Abstract
In today’s digital era, the rapidly escalating digital service industry plays a crucial role in the country’s economic development. However, compared to the countries that are a part of the Comprehensive and Progressive Agreement for Trans-Pacific Partnership (CPTPP), the competitiveness level of China’s digital service trade still needs to be improved. This paper aims to know the differences in the competitiveness of the digital service trade between China and CPTPP countries and explore the factors affecting competitiveness in both exports and imports to improve China’s competitiveness level and narrow the gap with CPTPP, thereby promoting its accession process. This paper first uses China and CPTPP countries’ 2010–2022 import and export volume of digital service data to calculate each country’s revealed comparative advantage index, trade competitiveness index, market share, and Michaely fluctuation index indicators, further comparing the comprehensive level of competitiveness between countries. Then, based on the diamond theory, multiple regression analyses will be conducted based on the factors influencing digital service trade competitiveness and using the indicator data of influencing factors in each country for 2010–2021. The conclusions show that China’s digital service trade competitiveness ranked relatively high among CPTPP countries. The competitiveness of imports and exports of the digital service trade is influenced positively by several factors, including the degree of trade freedom, government efficiency, the number of fixed broadband subscriptions per 100 people, and the industry’s openness. The value of exports of trade in goods has a positive effect on export competitiveness, the enrolment rate in tertiary education has a positive effect on import competitiveness, and the ratio of employed in the service sector to the total employed has a dual effect, facilitating export competitiveness and inhibiting import competitiveness.
1. Introduction
Extensive implementation of digital technology has encouraged a strong development of the digital economy, creating favorable circumstances for cross-border, suitable, and well-organized international trade. As an essential part of trade, the trade of digital services is becoming a new engine for future trade growth. Based on data from the World Trade Organization (WTO) (2023), the digital service trade has demonstrated robust resilience and potential between 2019 and 2022 [1]. Global digital service trade has expanded by 36.9%, surpassing the growth rates of 12.9% for trade in services and 31.0% for trade in commodities. According to the Asian Development Bank, the trade of digital services is expected to experience significant growth in the future and become the most dynamic part of global trade.
The rapid development of digital services trade has become an essential carrier of transnational knowledge spillovers, however it raises income incentives, stimulates trade liberalization, quickens knowledge transfer, and encourages financial deepening (Huwei, W., Wenjing, C. and Fengxiu, Z., 2023) [2]. The Department of Foreign Economic Research of the Development Research Center of the State Council released the third issue of the research report “Digital Trade Development and Cooperation Report 2023”, which points out that that in 2022, China’s total import and export of digital services was valued at USD 3710.8 billion, representing a 3.2% annual rise and accounting for 41.7% of all services. The exports of digital services reached USD 2089.1 billion, reflecting a 7.2% increase compared 2021, and the imports of digital services amounted to USD 1621.6 billion, indicating a 1.6% decrease year-on-year. Therefore, evidence suggests that China’s digital service exports are experiencing substantial growth, surpassing the global average. However, compared with developed countries and high-level regional organizations, China’s digital service industry’s irrational structure and the trade deficit’s continued extension have constrained the development of digital services trade. Therefore, in order to keep pace with the development of the digital economy and enjoy the dividends that trade in digital services has given to society, production, and life, we need a precise comprehension of the level of development of our country’s trade in digital services and take into account the factors affecting its competitiveness so that we can further exploit the competitive advantages of our country’s trade in digital services in the international market. Yanfang, L., et al. (2021) constructed a quantitative evaluation framework for the trade of digital services. The study revealed that the internet’s infrastructure, connectivity, and free flow of cross-border data have a beneficial impact on encouraging the development of the digital service trade network [3]. By employing a twofold fixed-effects model, Xiying, Z., et al. (2022) confirmed that a higher level of digital technology significantly affects the volume of trade in digital services, both in regard to imports and exports [4]. Additionally, the more policy restrictions are in place, the more markedly the growth of the digital services trade is inhibited.
The Comprehensive and Progressive Agreement for Trans-Pacific Partnership (CPTPP) is a significant global free trade agreement of high standards. To some extent, it represents a new round of directions for developing the digital service trade. South Korea confirmed the necessity of joining the CPTPP regarding its tariff reduction rates, cumulative origin provisions, and potential expansion (Yu, J.H. and Su, L.C., 2021) [5]. China also formally applied to join the CPTPP in September 2021, and President Xi Jinping has consistently underlined China’s proactive efforts to become a member. In June 2023, China presented a communication document to CPTPP members expressing its desire to join the agreement, but it still needs to be permitted to initiate the accession process. As a result, China’s accession progress has been slower than the UK’s entry into the CPTPP expansion process, and it is currently encountering obstacles. The barriers primarily include rule-based obstacles and non-rule-based obstacles. The rule-based obstacle is the disparity between our country and the CPTPP in the stringent regulations that have been established. Just as Cristina, E.P.T. (2022) suggests, the only reasonable path for China and the EU to take in reaching an investment agreement is the public international law governing the treaties [6]. Non-rule-based obstacles include differences in the attitudes of CPTPP members and the dilution of the attributes of the expansionist countries. In light of the coexistence of the service economy and the digital economy, the CPTPP organization provides nondiscriminatory treatment for digital products. It dramatically opens the digital service market to promote the development of digital service trade. In comparison, Daxue K. et al. (2022) pointed out that China’s service industry has a poor ranking in the Global Value Chain (GVC) and competitiveness in the service trade is also weak [7]. If China wants to expedite its accession to the CPTPP organization, it must closely monitor the actions of member countries and implement appropriate measures. For instance, improving the legal regulation of trade in digital services and opening trade markets to enhance international competitiveness. These measures are essential for addressing China’s rule-based and non-rule-based obstacles that are in the way of them joining the CPTPP.
The digital service trade is growing rapidly, and enhancing the country’s competitiveness in this sector is crucial for economic development. China, a key partner of CPTPP member countries in Asia, is aggressively getting ready to join the CPTPP organization (Pao-Li, C. and Phuong, T.B.N., 2022) [8]. Therefore, this paper would like to explore the competitiveness level of China’s digital service trade in the international market. This paper will statistically find out the level of competitiveness of the digital service trade between China and CPTPP member countries and, on this basis, analyze the factors affecting the competitiveness of digital services trade from both export and import perspectives. Based on the relevant data of the import and export value of the digital service trade in each country from 2010 to 2022, firstly calculating the index values of revealed comparative advantage, trade competitiveness, market share, and Michaely fluctuation of each country, which are the more typical indexes to measure the competitiveness of digital service trade. Then, the entropy weighting method should be used to objectively assign weights of the four index values to arrive at the comprehensive score of each country’s competitiveness in the digital service trade. Further, based on the theory of the diamond model, prosing the factors affecting the competitiveness of the digital service trade and multiple regression is conducted using the indicator data of the factors affecting each country from 2010 to 2021 to analyze the factors that can affect the competitiveness of the digital service trade in exports and imports. This research allows for the comparing of the competitiveness of digital service trade between China and CPTPP member countries. It also investigates the factors influencing this competitiveness, providing a foundation for enhancing digital service trade competitiveness in each country and facilitating China’s successful entry into the CPTPP.
The potential contribution of this paper is reflected in two aspects: (1) existing research primarily focuses on the process, significance, and challenges associated with China’s entry into the CPTPP, and there is a lack of analysis on the competitiveness of digital services trade between China and CPTPP member countries; (2) this report views import and export as equally important, in contrast to earlier research that exclusively examined the factors impacting the competitiveness of digital services trade from an export- or overall-oriented perspective, and explores the influencing factors of their competitiveness separately, which is more innovative and comprehensive.
This paper’s remaining chapters are organized as follows: Section 2 describes the relevant concepts of the digital service trade, measurement, and factors affecting trade competitiveness in digital services, and formulates two research hypotheses. Section 3 provides a detailed description of the data sources, processing procedures, and research methodology required for this paper. Section 4 compares the competitiveness of trade in digital services between China and the CPTPP member nations and then uses multiple regression to test the factors affecting the export and import competitiveness of trade in digital services. Section 5 discusses and concludes the above research and points out the limitations of the article and directions for future research.
2. Literature Review
2.1. Relevant Concepts of Digital Services Trade
A thorough examination of the meaning of the digital service trade is still ongoing. In 2013, the United States International Trade Commission (USITC) formally defined digital trade for the first time, proposing that it is a commercial activity that involves the supply of products and services through digital networks using digital technology [9]. In 2015, the United Nations Conference on Trade and Development (UNCTAD) defined digital service trade as the total value of all services delivered using digital methods [10]. In 2018, the Organization for Economic Co-operation and Development (OECD) defined trade in digital services as the exchange of transmissions and deliveries between countries using information and communication networks, including various digital goods such as e-books, data, and databases [11]. In response to this definition, in 2019, the OECD constructed a statistical framework for digital services trade in three dimensions: mode of delivery, products, and participants (Ferencz, J. and Gonzales, F., 2019) [12]. In summary, a fundamental comprehension of the digital service trade exists. However, the academic field is yet to reach a consensus on the division of specific service categories and scope.
In 2015, UNCTAD published specific categorizations of digital services, including “insurance and pension services”, financial services”, “intellectual property royalties”, “other business services”, “personal, cultural, and recreational services”, and “telecommunications, computer, and information services” [9]. Furthermore, when evaluating the data density of the services sector, Ferracane, M. (2020) found that the digitally intensive service industry includes telecommunications, computer and information services, financial services, insurance services, audiovisual services, research and development services, and intellectual property royalty services [13]. The Digital Trade Measurement Handbook, launched in 2019 by the OECD, WTO, and International Monetary Fund (IMF), provides a comprehensive framework for measuring digital trade across three dimensions: digital ordering trade, digital delivery trade, and digital intermediary platforms.
2.2. Measurement of Digital Services Trade Competitiveness
The evaluation systems that model widely employed approaches are the entropy weight method, analytical hierarchy process method, gray correlation method, factor analysis method, principal component analysis method, amongst various other ways. Recently, foreign scholars have made numerous efforts to assess the competitiveness of the digital service trade. The evaluation index primarily revolves around international market share (MS) [14,15], trade competitiveness index (TC), revealed comparative advantage index (RCA) [16,17], display competitive advantage index (CA), and Michaely fluctuation index (MI) as the fundamental basis for research. In order to evaluate the competitiveness of services trade in China, India, and the US, Nath et al. (2015) [18] used the gravity model and the RCA index. However, it is increasingly customary to use multi-dimensional indexes to determine an industry’s worldwide competitiveness to avoid the bias of using a single indicator to measure competitiveness. Thus, considering the data’s accessibility and scientific character, this research selects the RCA, TC, MS, and MI as its metrics for a thorough evaluation of the competitiveness of the digital service trade.
2.3. Influencing Factors of Digital Services Trade Competitiveness
The study of international competitiveness is a significant area of research in international economics. Throughout this research, scholars have gradually formed a system with products, enterprises, industries, and countries as the object. Michael Porter, the founder of industrial competitiveness theory, researched the competitiveness level of countries from the industrial level through the empirical analysis of more than 100 industries in 10 countries and put forward the theory of the “diamond model”. This theory has become one of the most widely used classic models for scholars to study international competitiveness, and this paper will use it as the theoretical basis for studying the influencing factors [19].
The literature on the competitiveness of digital services trade and its factors mainly includes imports, exports [20,21], and the overall trade of digital services.
2.3.1. Regarding the Overall Digital Services Trade
From the research object, the U.S. foreign direct investment status, GDP, and other indicators have a particular impact on its international competitiveness (Markusen, J., 1989) [22]. Both new and old members of the EU region exhibit distinct manifestations of identical factors (Hufbauer, G. and Stephenson, S., 2007) [23]. Developing countries’ trade competitiveness in services is negatively correlated with regulatory requirements and the degree of trade freedom in the service sector (Karmakar, S., 2007) [24].
Regarding the nature of the effect, regulatory data policies and barriers are crucial in influencing the service trade (particularly the digital service trade) (Gervais A. 2017) [25]. In contrast, cross-border e-commerce can lessen trade barriers from geography, culture, and politics, indirectly promoting trade growth across nations (Yu, W., Yi, W. and Soo, H.L., 2017) [26]. The closer two countries are to each other geographically, the more they export in digital services trade (Lin, X. and Hyukku, L., 2021) [27]. The rise of the digital service trade enhances the effectiveness of service provisions, bolstering worldwide competitiveness (Ferencz, J., 2019) [28]. The ability to drive digital service trade reflects in changing how cross-border trade is produced and delivered (Zhou, L., Xia, Q., Sun, H., Zhang, L., Jin, X., 2023) [29].
Although the classification of digital services in the trade sector is still being determined, some scholars have conducted detailed research. Didier, L. (2020) found that North–North trade agreements increase exports of financial and other business services of member countries, while North–South trade agreements reduce exports of communications, computer and information, finance, personal culture, and recreational services [30]. Furthermore, Marel, E.V.D. et al. (2021) found that the impact of trade regulation varies across different sectors of trade regarding digital services, with a negative correlation in both business and financial services [31]. Based on data provided by the Group of Twenty (G20) countries, Fanfan, Q. (2021) found that human capital has a positive impact on telecommunications, computer and information services, audiovisual and related services, the level of economic development has a positive impact on intellectual property royalties and other business services, outward direct investment has a positive impact on financial services and intellectual property royalties, the development of the internet has a positive impact on other business service sectors, and the openness of the service trade has a positive impact on intellectual property royalties and other commercial services [32]. Zhang et al. (2022) found that digital technology plays a vital role in improving the international competitiveness of the United States, Japan, and Germany in communication and information services [33]. Language differences and the signing of regional trade agreements will significantly impact the development of the financial services sector (Marel, E.V.D. and Shepherd, B., 2013) [34]. The above literature reveals that scholars have different classifications of digital service trade sectors, so exploring the factors which affect competitiveness is a necessity. This paper takes the specific classification set by the UNCTAD database in 2015, including “insurance and pension services”, “financial services”, “charges for the use of intellectual property n., i.e.”, “other business services”, “personal, cultural, and recreational services” and “telecommunications, computer, and information services”. The study will use data on six sectors’ total import and export volumes to provide an empirical analysis.
2.3.2. Regarding the Export of the Digital Service Trade
There are many factors affecting the export of the digital service trade. From the perspective of market influencing factors, increasing information transparency and using Information and Communications Technologies (ICTs) in exporting countries may lessen the negative impact of stringent laws on the domestic export of digital services (Fang, W., Zhaoyuan, X. and Xiaoyong D., 2019) [35]. Meanwhile, domestic and global digital agendas have highlighted the significance of enterprises’ expertise in exporting the trade of digital services (Mandi, J. and Peng, J., 2022) [36]. Hao Li et al. (2023) suggested that the digital economy has also boosted the competitiveness of services exports, which has led to the rapid expansion of the category margin and the intensive rise of the quantity and price margins [37]. Ziyu, Y. et al. (2022) pointed out that the effect of ICT market liberalization levels on digital service exports differs between exporting and importing nations [38]. From the perspective of non-market factors, through the quantitative analysis of cross-border data flow control measures, the gravity model confirms the negative impact of strict cross-border data flow control policies on bilateral service exports (Spiezia, V. and Tscheke, J. 2020) [39]. Additionally, some nations might create data coalitions to promote data flow across borders (Jia-Jia, L. and Nakhyun, H., 2022) [40]. By reducing access restrictions and “promoting fair competition, it is also possible to increase the openness of ICT markets in both exporting and importing countries, thereby facilitating the export of digital services. Although the above studies have analyzed many factors affecting the export of digital services, they are mainly from a single perspective and lack the support of a theoretical system. As an essential theory to cultivate industrial competitiveness, the diamond model theory is suitable for exploring the export competitiveness of digital service trade. As a result, this study puts forward Hypothesis 1 (H1).
Hypothesis 1 (H1).
The influencing factors proposed based on the diamond model theory positively impact the export competitiveness of the digital service trade.
2.3.3. Regarding the Import of the Digital Service Trade
The factors that influence the digital service trade import also appear gradually. From the market perspective, importing digital services becomes more expensive when importers impose digital trade restrictions, lowering the number of services imported (Hellmanzik, C. and Schmitz, M., 2015) [41]. To realize the advanced structure of digital service imports, however, Marel et al. (2016) verified that data and technology in digital service imports could enhance the effectiveness of communication and collaboration among industry chain participants, which allow production factors to flow from low-quality and inefficient to high-quality and efficient sectors [42]. From the perspective of non-market factors, the complexity and fragmentation of trade regulation in digital services have led to significant differences in national regulatory strategies and capacities. Beverelli, C. et al. (2017) thought that these differences hinder the integration of the domestic sector with the international digital services sector, reduce the efficiency of firms’ access to digital technologies and services, and increase the cost of digital service imports [43]. As seen from the aforementioned research, the existing literature only analyzes the factors affecting the import competitiveness of digital service trade from one or two perspectives, and more systematic guidance from theories is needed. The diamond model theory can improve the import competitiveness of digital service trade. As a result, this study proposed Hypothesis 2 (H2).
Hypothesis 2 (H2).
The influencing factors proposed based on the diamond model theory positively impact the import competitiveness of the digital service trade.
3. Materials and Methods
3.1. Data
This paper takes the relevant data of China and CPTPP member countries from 2010 to 2022 as the object of study. Seeing as the UK is about to join the CPTPP organization formally, it is also one of the subjects of the study. The data in the paper on the determination of the competitiveness indicators of the digital services trade of each country involves the import and export value of the digital services trade of each study country, the total import and export value of the study countries, the import and export value of the digital service trade of the world, and the total import and export value of the world. The data were mainly obtained from the WTO database, https://stats.wto.org/en (accessed on 15 December 2023). First, we need to select “International Trade Statistics” in “Indicators” and then select the “Commercial services imports by main sector” indicator, according to the needed years and country to download data. Brunei, Chile, Mexico, and Vietnam have missing data for individual years, filled in using interpolation. In order to further measure the overall level of the competitiveness of countries’ trade in digital services, this paper also standardizes the data of each competitiveness indicator in order to derive a comprehensive score of the competitiveness of China’s trade in digital services with that of the CPTPP member countries.
Regarding the indicators of the factors affecting the competitiveness of trade in digital services, this article counts the data from the study countries for the period between 2010–2021. Among them, the enrollment rate in tertiary education (EDU), the ratio of employed in the service sector to total employment (EMP), the number of fixed broadband subscriptions per 100 individuals (FBS), the ratio of the net outflow of foreign direct investment to the GDP (OFDI), the ratio of the value-added of the industry to the GDP (IND), the value of exports of trade in goods (GTE), and the ratio of the net inflow of foreign direct investment to the GDP (FDI) are mainly obtained from the World Development Indicators (WDI) database, https://databank.worldbank.org (accessed on 19 December 2023). Data on the level of openness in the digital services trade industry (DSTO) are obtained from the UNCTAD database, https://unctadstat.unctad.org/EN/ (accessed on 19 December 2023). Government efficiency (GOV) data are obtained from the Worldwide Governance Indicators (WGI) database https://databank.worldbank.org (accessed on 19 December 2023). Data on the extent of trade freedom are obtained from the International Statistical Yearbook https://data.stats.gov.cn (accessed on 19 December 2023). For the above-required variables, data in the various databases can be searched for via keywords and filtered to data for China and CPTPP member countries for 2010–2021. In order to reduce the correlation of variables, this paper also logarises the data of the above-mentioned indicators as well as the import and export value of the study countries.
3.2. Methods
- (1)
- Comparative research method
The approach involves analyzing multiple interconnected entities based on particular criteria to identify similarities and differences and investigate underlying principles (Kaššaj, M., Peráček, T., 2024) [44]. This paper measures China and CPTPP member countries based on the same digital service trade competitiveness index to find the gap between China and other countries, explore the laws of industrial development, and help China join the CPTPP organization as early as possible. Therefore, this article combines the relevant data of China, CPTPP member countries, and the world, and selects the RCA index, TC index, MS index, and MI index as the parameters. The entropy weight method is then used to synthesize the results of the four indices to compare and analyze the competitiveness of the trade in digital services between China and the CPTPP member countries to clarify the development gap between China and other member countries and to lay the foundation for making up for its shortcomings.
- (2)
- Empirical analysis method
The empirical analysis method uses facts to support the viewpoints presented in the paper or to prove a particular theory, which mainly includes statistical analysis and regression analysis. This paper proposes positive elements affecting the competitiveness of digital service trade from the theory of the diamond model. However, the viewpoints need to be verified with data to prove their scientific validity. This study chooses regression analysis in the empirical analysis method. In order to further observe the data characteristics of the variables, descriptive statistics, correlation analysis, and covariance diagnosis were carried out using STATA 14.0 software. Meanwhile, the Hausman test found that the fixed effect model was more suitable for this study. In order to make the model fit better, this paper further chose the stepwise regression analysis to add the variable indicators into the model step-by-step for processing to get more scientific and accurate experimental results.
4. Empirical Analysis
4.1. Measurement and Comparative Analysis of Digital Service Trade Competitiveness between China and CPTPP Countries
The competitiveness of service trade is currently evaluated mainly through comparative advantage analysis. This chapter selects RCA, TC, MS, and MI, which are more commonly used as the measurement indexes to compare the competitiveness level of digital service trade between China and the CPTPP member countries and provide reference opinions for pertinent policy making. This is based on a combination of the existing research and data availability.
4.1.1. Revealed Comparative Advantage Index (RCA)
The most persuasive metric is the revealed comparative advantage (RCA) index, which was developed by American economist Balassa in 1965 [45] and assesses how competitive a nation’s goods or industries are on the global market. Expressed as the ratio of a country’s exports of service as a share of its total exports to the world’s exports of the same service as a share of its total exports, the mathematical formula for RCA is:
where Xij represents the exports of industry i in j country, Xtj represents the total exports of country j, Xiw represents the exports of industry i globally, and Xtw represents the total exports worldwide. The degree of competitive advantage is categorized based on the value of the RCA index, as shown in Table 1.

Table 1.
RCA index division.
China and CPTPP member countries revealed comparative advantage index values for 2010–2022, as shown in Table 2. The UK’s RCA exceeded 2.5, far ahead of other countries, indicating that the UK’s digital services trade has a very strong competitive advantage and better future development. Next, the highest RCA is that of Singapore, which exceeded 1.25 in 2016. Its digital service trade competitiveness also has a clear comparative advantage, and the rising trend of the advantage is smooth. Japan, Canada, New Zealand, China, and the remaining seven countries’ RCA levels close behind are all less than one and have no comparative advantage in the trading of digital services.
Table 2.
RCA index between China and CPTPP member countries.
4.1.2. Trade Competitiveness Index (TC)
One of the more popular metrics for assessing global competitiveness is the trade competitiveness (TC) index, expressed as the ratio of a country’s import and export balance of a product or service to the total import and export of the same product or service, with the formula:
where Mij represents the import of industry i in country j. The TC index is a numerical measure from −1 to 1. The magnitude of the TC determines the level of competitive advantage, as shown in Table 3.
TC = (Xij − Mij)/(Xij + Mij)
Table 3.
TC index division.
As seen from Table 4, the UK’s TC index is in first place, with a fluctuation range of (0.3–0.6), indicating that its trade in digital services has a higher share in the international market and a very strong competitive advantage. China’s TC index is currently ranked second, and, like Singapore, it changed from negative to positive in 2018. The digital service trade is beginning to have a weak competitive advantage. The TC values of Japan, Canada, Australia, Malaysia, and Vietnam are located at (−0.3–0), and digital service trade, mainly import-oriented, show a weak competitive disadvantage. Chile, Peru, New Zealand, Mexico, and Brunei have low TC levels, with imports much more significant than exports. The degree of international competitive disadvantage of digital services trade is very strong.
Table 4.
TC index between China and CPTPP member countries.
4.1.3. International Market Share (MS)
The percentage of a nation’s goods or services relative to comparable goods or services globally is known as its international market share. A higher market share indicates more substantial international competitiveness, whereas a lower market share indicates poor competitiveness. The formula is:
where Xj represents the export of an industry in country j and Xw represents the entire export value of the same product in the international market.
As can be seen from Table 5, the highest MS index is the UK, but it has a fluctuating downward trend. The second is shared between China and Singapore; China’s MS index is higher, but Singapore’s development trend is more favorable, with the most significant increase. Japan and Canada’s MS index followed, but both appear to have a downward trend. The remaining eight CPTPP member countries in the international market accounted for the low ratio, and the MS change is less noticeable.
Table 5.
MS index between China and CPTPP member countries.
4.1.4. Michaely Fluctuation Index (MI)
The Michaely fluctuation index is primarily utilized to quantify the magnitude of the average yearly fluctuation in economic variables. It is calculated by using a country’s exports of a specific product or service as a proportion of its total exports to cut its imports of the same product or service as a proportion of its total imports. The formula is:
where Mtj represents the total import of j country. The range of changes in the MI index is (−1,1), and the MI is greater than 0, indicating that the export of a particular industry has a competitive advantage. The MI is less than 0, indicating that the export of a particular industry has a competitive disadvantage.
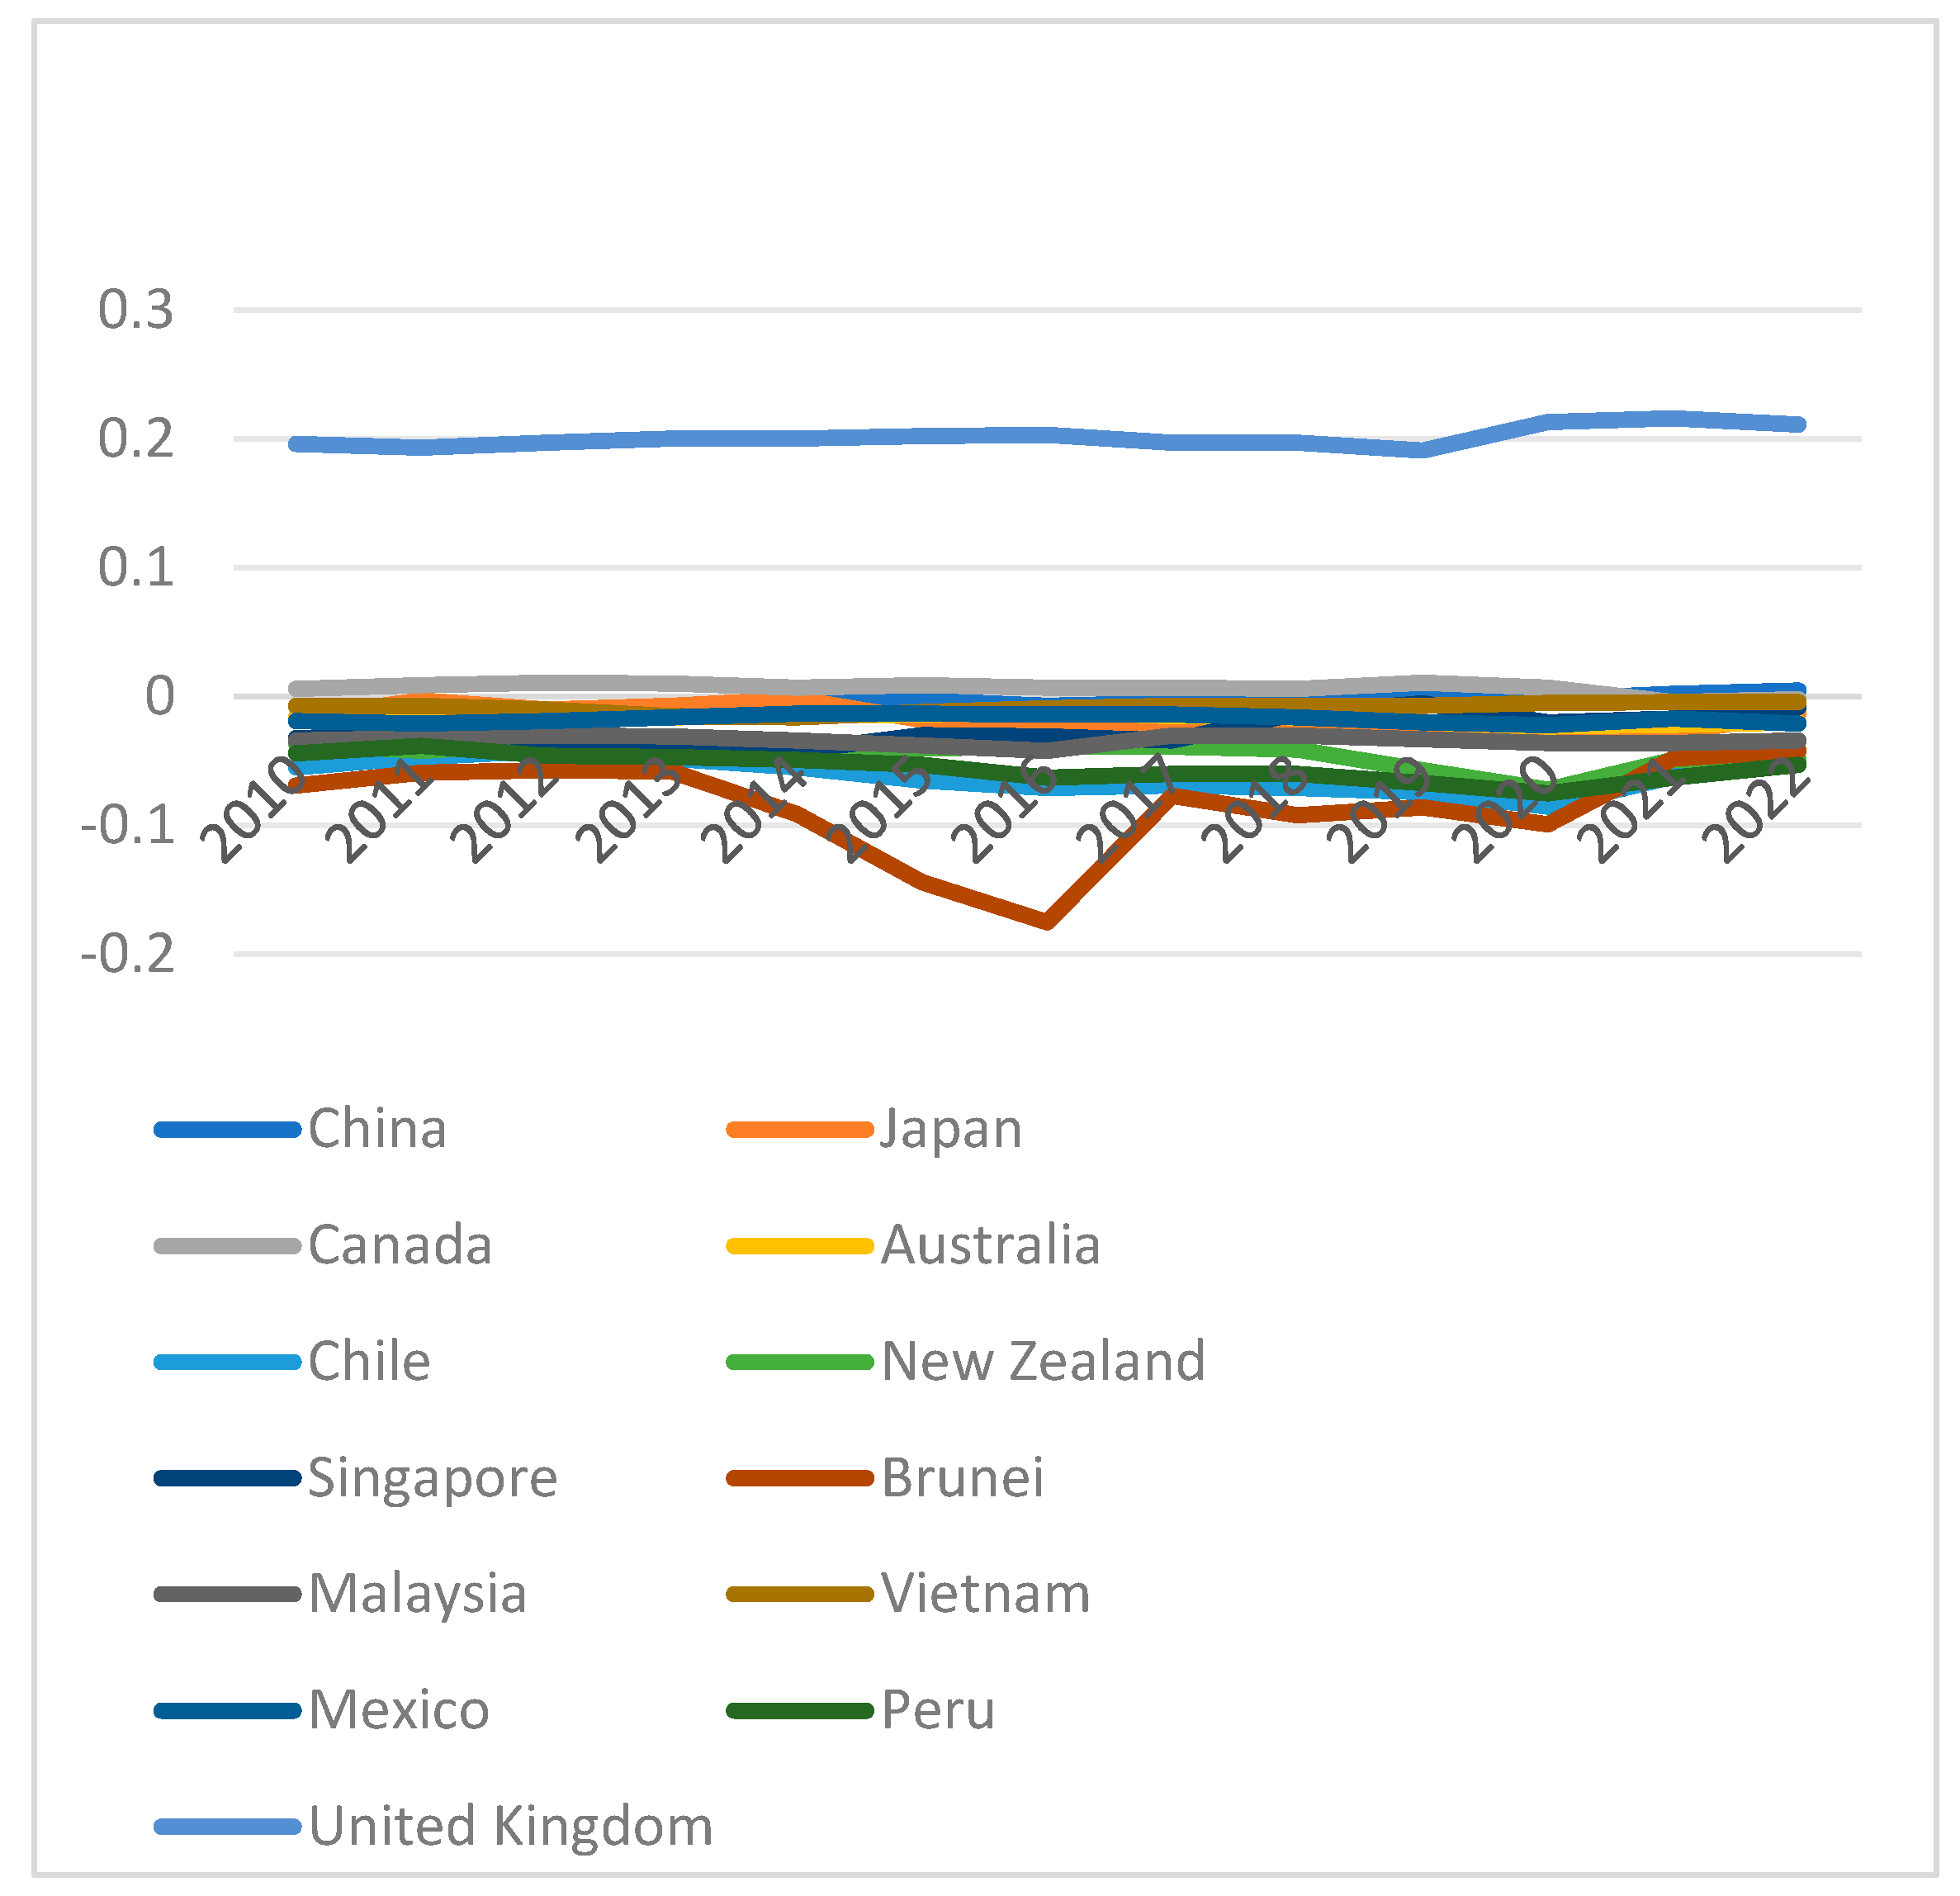
As seen from Table 6, the UK’s MI index has been positive, suggesting that there is a competitive advantage to the export of digital services, which continues to expand. In recent years, China’s MI index has shown an upward trend, turning negative to positive in 2021 and presenting a slight competitive advantage for the trade of digital services. Canada’s MI index between 2010–2020 had a slight competitive advantage in the international market, but its competitiveness declined in 2021 and 2022, presenting a comparative disadvantage. The MI index of the remaining 10 member countries of the CPTPP has been in a disadvantageous situation. This rings true particularly for Peru, which currently has the most pronounced competitive disadvantage (Figure 1).
Table 6.
MI index between China and CPTPP member countries.

Figure 1.
MI index movement between China and CPTPP member countries.
4.1.5. The Entropy Weight Method
The entropy weight method is commonly employed as an objective value assignment method due to its ability to mitigate the impact of subjective outcomes. The precise sequence of construction steps is as follows:
Firstly, the indicators are standardized to minimize the quantitative disparities of the evaluation indicators.
Secondly, the information entropy of each indicator is computed.
L = 13 represents a period of statistical data from 2010 to 2022, and Hj refers to the measure of information entropy.
The weights of the indicators are established.
Finally, the competitiveness of the digital services industry is assessed using a composite score.
Ui = ∑j WjEij
The comprehensive score of the digital service trade competitiveness with China and CPTPP members was calculated from 2010 to 2022 using the digital services trade competitiveness index, the specific results are shown in Table 7. The UK’s digital services trade competitiveness ranking has been steadily in first place. It is much higher than that of other countries due to the advantageous conditions of large market size, strong development of the platforms, richness of categories, and convenience of payment. As a developed country, Singapore has strict regulations for the digital economy, which provides an essential guarantee for developing the digital service trade. Its competitiveness is growing at the fastest rate and is currently ranked second. The competitiveness levels of China and Japan are close, but Japan’s shortage of resources and insufficient development momentum made it lag behind China, meaning that it is currently ranked fourth. Canada, with its diversified economic structure and high open trade policy, reached its highest competitiveness ranking in 2012, trailing only the UK. However, a slightly slower economic growth rate in recent years has made it less competitive, which has slowed the growth of the trade of digital services. Australia has rich natural resources and is dominated by trade in agricultural products. Affected by GDP, it has had weaker competitiveness in digital service trade in recent years, with a fluctuating downward trend. New Zealand is dominated by tourism in the service trade, and due to the impact of the epidemic, the tourism industry as a whole is on a downward trend. Hence, its competitiveness in the digital service trade is also relatively backward. Located in Southeast Asia, Malaysia’s uneven distribution of resources and corrupt government have seriously hindered the development of its digital service trade. Thus, its competitiveness could be ranked lower in the CPTPP organization. The relative backwardness of digital infrastructure, difficulties in online payment, and intermittent implementation of trade barrier policies in countries such as Vietnam, Chile, Mexico, and Peru have kept the competitiveness of their digital services trade also ranked low in the CPTPP organization. Brunei, a country with a high GDP per capita, mainly focuses on oil and gas exports. Its homogenization of economic structure is not conducive to developing the digital service trade, so its competitiveness level is the lowest.
Table 7.
Comprehensive score of competitiveness in digital services trade between China and CPTPP countries.
4.2. Regression Analysis of the Factors Influencing the Competitiveness of Digital Services Trade between China and CPTPP Countries
4.2.1. Selection of Variables
Dependent variables: when studying the influencing factors of trade competitiveness, related scholars take the competitiveness indicators RCA, MS, and MI as the explained variables. Additionally, due to the variations in these indicators and the challenges in obtaining them, the export value and total trade value are frequently employed to measure the level of competitiveness. This chapter uses the export value of digital service trade (export) and the import value of digital service trade (import) as the two dependent variables to analyze the factors impacting competitiveness because the import and export of the digital service trade are equally essential. The UNCTAD database is the source of the data.
Independent variables: in the 1990s, Michael Porter put forward the diamond model in “Competitive Advantage among Countries” and as a result, the theory of national competitive advantage was formed. Combined with relevant theories and literature, the independent variables affecting the digital service trade are mainly selected from the following six aspects:
Factors of production: labor, as one of the main factors of production, plays a vital role in the digital services trade. High-quality talents are more advantageous in researching digital technology and improving trade efficiency, so the enrollment rate in tertiary education (EDU) is chosen to indicate a country’s high-quality talents. Employment in the service industry is the basis for growing the scale of the digital service trade, and sufficient staff can guarantee the specialization and rationalization of trade processes so the ratio of people employed in the service sector to total employment (EMP) is chosen as an indicator. Digital infrastructure is the base for the development of the digital service trade, and that is the foundation for countries to innovate trade methods. So, the number of fixed broadband subscriptions per 100 individuals (FBS) was chosen as an indicator of digital facilities.
Demand conditions: the development of the digital service trade in all countries requires advanced technology, sufficient funds, and a perfect system. OFDI can produce a learning effect, technology spillover, capital return, and other phenomena that provide resource advantages for the home country to improve the competitiveness of digital services trade, so the ratio of the net outflow of Foreign Direct Investment (FDI) to the GDP (OFDI) is selected as the primary measure of demand conditions.
Relevant and supporting industries: as a tertiary industry, the service industry cannot be separated from the support of machinery and equipment of the secondary industry, and the industry as a secondary industry can also open the market with the help of the tertiary industry. Therefore, the ratio of the value-added by the industry to the GDP (IND) is chosen as the relevant industry indicator of the digital services trade. Similarly, trade in goods provides more opportunities and the market space for developing services trade, and the two also complement each other. Hence, the value of exports trade in goods (GTE) is chosen as the supporting industrial indicator.
Enterprise organization, strategy, and competition: an enterprise’s organizational structure and strategy determines its scale and strength in trade. If the trade openness between enterprises is higher, it is more likely to produce learning effects and innovation incentives. Therefore, the level of openness in the digital services trade industry (DSTO) is chosen to measure enterprises’ acceptance of the digital service trade. Similarly, the perfect organizational structure of enterprises will attract investment from the host country. They provide sufficient financial support for the home country to expand the scale of trade and improve the competitiveness of digital services trade, so the index of the ratio of the net inflow of foreign direct investment to the GDP (FDI) is selected.
Government: the higher the efficiency of a country’s government, the more it can optimize its business environment and improve its digital service trade regime, thus promoting international competitiveness. So, the government efficiency (GOV) indicator is selected.
Opportunity: trade liberalization increases the range and depth of trade opportunities by allowing nations to trade in digital services, so the extent of trade freedom (TF) is selected to measure the size of the opportunity.
In summary, 10 independent variables were selected (Table 8).
Table 8.
Selection of explanatory variables and data sources.
4.2.2. Model Setting
Export, import, FBS, IND, DSTO, FDI, GOV, and TF are transformed into logarithmic forms to reduce the correlation between variables. i and t represent the nation and year, respectively. Ui and Ti represent individual and temporal fixed effects, respectively. ɛ denotes a random factor.
LnExportit = β0 + β1EDU1 + β2EMP2 + β3LnFBS3 + β4OFDI4 + β5LnIND5 + β6GTE6 + β7LnDSTO7 + β8LnFDI8 + β9LnGOV9 + β10LnTF10 + Ui + Ti + ɛ
LnImportit = β0 + β1EDU1 + β2EMP2 + β3LnFBS3 + β4OFDI4 + β5LnIND5 + β6GTE6 + β7LnDSTO7 + β8LnFDI8 + β9LnGOV9 + β10LnTF10 + Ui + Ti + ɛ
4.2.3. Multiple Regression Analysis
To investigate the factors that impact the competitiveness of digital service trade in regards to both imports and exports, this chapter selected China and CPTPP member countries as the research objects, collecting panel data from 2010 to 2021 to establish a regression model.
First, Table 9 displays descriptive statistics on the characteristics influencing the competitiveness of the digital service trade.
Table 9.
Descriptive statistics.
Secondly, the correlation study showed that the variables had the same correlation findings with lnY1 and lnY2. EDU, LnFBS, ETG, LnDSTO, OFDI, and LnGOV positively correlated with lnY1, lnY2 at the 1% level. EMP, LnIND, LnFDI, and LnTF had no significant correlation with lnY1, lnY2, the specific results are shown in Table 10.
Table 10.
Sample correlation analysis.
Thirdly, the VIF test was conducted, and the resulting mean value was 4.60, which was much less than 10, so there was no multicollinearity between the indicators, the specific results are shown in Table 11.
Table 11.
VIF test.
Finally, the Hausman test shows that the p-value is 0.000, so the fixed effect model was chosen for this study, the specific results are shown in Table 12.
Table 12.
Hausman test.
Based on the above tests, this paper chose STATA 14.0 software for stepwise regression based on panel data from 13 nations between 2010 and 2021. The outcomes are displayed in Table 13 and Table 14.
Table 13.
Benchmark regression estimates for model of exports of digital service trade.
Table 14.
Benchmark regression estimates for model of imports of digital service trade.
The results of a stepwise regression using the 10 chosen indicators show that, at the 1% significance level, the ratio of employed in the service sector to total employment (EMP), the value exports of trade in goods (GTE), and the level of openness in the digital services trade industry (LnDSTO) are significantly and positively correlated with the value of digital services trade exports. At a 5% level of significance, the number of fixed broadband subscriptions per 100 individuals (LnFBS), government efficiency (LnGOV), and the extent of trade freedom (LnTF) are significantly and positively related to the value of digital services trade exports. Therefore, Hypothesis 1 is partially valid as the six influencing factors proposed based on the diamond model theory significantly positively impact the export competitiveness. Among them, the regression coefficient of openness in the digital service trade industry is the largest at 0.725, indicating that it has the most significant influence on the dependent variables. The higher the openness of the digital service trade, the lower the trade barriers that are more favorable for the enterprises to cross the temporal and spatial limitations of the services to increase the value of the export of the digital service trade. The smallest regression coefficient for the value of exports of trade in goods has the slightest degree of influence on the dependent variables. This may be because countries with a predominantly goods-based trade are less affected by the low share of the service sector or digital service sector in total trade due to the level of technology, the scale of trade, and the specialization of production, among other reasons.
The stepwise regression analysis of the 10 chosen indicators demonstrates that the variables “the number of fixed broadband subscriptions per 100 individuals” (LnFBS), “the level of openness in the digital services trade industry” (LnDSTO), and ”the extent of trade freedom”(LnTF) exhibit a strong positive correlation with the value of imports involving the digital service trade, with a significance level of 1%. At a significance level of 5%, there is a positive correlation between the enrollment rate in tertiary education (EDU) and the import of digital services trade. At a significance level of 10%, there is a relationship between the ratio of employed in the service sector to total employment (EMP), government efficiency (LnGOV), and the value of imports of digital services trade. However, EMP showed a significant negative correlation. Therefore, Hypothesis 2 is partially valid, as the five influencing factors proposed based on the diamond model theory positively impact the import competitiveness. Similarly, the regression coefficient of openness in the digital services trade industry is the largest at 0.886, indicating that it has the most significant and positive impact on the import value of the digital service trade. Due to the increase in the openness of the digital trade industry, the information policy and audit process are relatively transparent, which improves the import efficiency and level of home country enterprises. The regression coefficient of the ratio of employed in the service sector to total employment is the smallest (−0.002), indicating a significant inhibitory effect on import. This may be because the more people are employed in the services sector in the home country, the smaller the demand for services imports from the host country, which reduces the volume of digital services trade imports. However, the level of inhibition could be lower due to the different levels of the digital economy in each country, disparities in the types of services provided by service providers, and the impossibility of national services being a complete substitute for services in other countries.
Contrary to expectations, the impact of the enrollment rate in tertiary education (EDU) on the value of exports of the digital service trade is insignificant due to the long training cycle of tertiary talents and the time lag effect of their contribution to the industry. The value of imports of digital services trade is not significantly impacted by the value of trade in goods (GTE) exports, possibly due to the weak degree of economic linkages between countries through trade in goods that have yet to produce a driving effect to promote imports of digital services. The ratio of the value-added of the industry to the GDP (LnIND), the ratio of the net outflow of foreign direct investment to the GDP (OFDI), and the ratio of the net inflow of foreign direct investment to the GDP (LnFDI) do not have a significant impact on the import and export volume of the digital service trade, probably because digital service trade is still in the early stage of rapid development that the role of these factors in boosting the import and export value of digital services trade is not prominent enough.
5. Discussion and Conclusions
5.1. Discussion
This research provides three main contributions to enhance the competitiveness of the trade of digital services, surpassing prior studies. First of all, compared with the previous measurement of a single index, this paper combines several indexes of digital service trade competitiveness, such as the RCA, TC, MS, and MI, to analyze the level of digital service trade competitiveness of China and CPTPP member countries in multiple dimensions. This study also uses the entropy weight method to assign comprehensive scores to each country, comparing the differences between countries. Secondly, based on the diamond model theory, this paper comprehensively and systematically analyzes the factors that affect the competitiveness of digital service trade, which has a more robust theoretical basis than previous studies. Finally, from the two perspectives of export and import, this paper explores the factors that affect competitiveness, considering the situation more comprehensively and objectively.
The other author of this paper participated in the whole literature combing and data collection process. Moreover, the author proposed this paper’s research questions and significance for the characteristics of the current development of the digital service trade between China and CPTPP member countries, who are very clear about the research content. In addition, based on authentic and accurate data information, the other author also agrees with the empirical research results. In the future, the authors will continue to explore the field of the digital service trade, not only to study the competitiveness of China and CPTPP member countries in digital services trade, but to expand the scope of research objects. Based on large-scale scientific demonstration, refining the research field will explore the factors affecting the competitiveness of digital service trade in different departments and provide a scientific basis for developing global digital service trade.
5.2. Conclusions
In this study, we first compare the competitiveness of the digital services trade of China and CPTPP member countries using panel data from 2010–2022. Then, factors affecting the competitiveness of the digital service trade are proposed based on the diamond theory. Finally, multiple regression analyses are used to verify the factors affecting digital service trade’s import and export competitiveness. The following conclusions are drawn:
- (1)
- By measuring the RCA, TC, MS, and MI indices of China and CPTPP member countries from 2010 to 2022, we discover that while the UK has led the world in the competitiveness of trade in digital services, recent years have seen a changing downward trend. Singapore and China are growing faster and are now in second and third place, respectively. Japan and Canada follow them with medium levels of competitiveness but with large fluctuations. Australia, New Zealand, Malaysia, Chile, Mexico, Vietnam, and Peru are at a lower level of competitiveness and have a flat development. Brunei has the lowest level of competitiveness in the digital service trade overall in the statistical years, rebounding and rising slowly after reaching its minimum in 2016.
- (2)
- Based on the diamond model theory and the fixed effects model, it is found that an increase in the ratio of people employed in the service sector to total employment, the exports of trade in goods, the level of openness in the digital services trade industry, the number of fixed broadband subscriptions per 100 individuals, government efficiency, and the extent of trade freedom is conducive to an increase in the competitiveness of exports of the digital service trade. Therefore, in Hypothesis 1, only six of the ten influencing factors proposed based on the diamond model theory are valid and impact the export competitiveness of the digital service trade in a positive way.
- (3)
- Similarly, based on the diamond model theory and the fixed effects model, it is found that increases in the number of fixed broadband subscriptions per 100 individuals, the level of openness in the digital service trade industry, the extent of trade freedom, the enrollment rate in tertiary education, and government efficiency are conducive to the import competitiveness of trade in digital services. In contrast, increases in the ratio of people employed in the service sector to total employment will dampen the import competitiveness of trade in digital services. Therefore, in Hypothesis 2, only five of the ten influencing factors proposed based on the diamond model theory are valid and impact the import competitiveness of the digital service trade in a positive way.
This study only measures the competitiveness level of China’s trade in digital services with each of the CPTPP member countries and explores the factors affecting it and does not consider it from a bilateral perspective to explore the differences in China’s competitiveness in its trade in digital services with the CPTPP countries. In the future, we can continue to study the characteristics of China’s bilateral digital service trade with CPTPP member countries and further refine the factors influencing the competitiveness of various sectors of the digital service trade.
Author Contributions
Conceptualization, funding acquisition, methodology, resources, supervision and writing—review and editing—were performed by J.L.; data curation, formal analysis, investigation, project administration, software, validation, visualization and writing—original—were performed by F.W. All authors have read and agreed to the published version of the manuscript.
Funding
This research was funded by the National Social Science Foundation of China, grant number 22BJY227. The APC was funded by the National Social Science Foundation of China.
Institutional Review Board Statement
Not applicable.
Informed Consent Statement
Not applicable.
Data Availability Statement
The data presented in this study are available upon request from the corresponding author.
Conflicts of Interest
The authors declare no conflicts of interest.
References
- World Trade Organization (WTO). World Trade Report 2023: The Future of Service Trade; WTO Pub: Geneva, Switzerland, 2023. [Google Scholar]
- Huwei, W.; Wenjing, C.; Fengxiu, Z. Does digital service trade boost technological innovation? International evidence. Socio-Econ. Plan. Sci. 2023, 88, 101647. [Google Scholar]
- Yanfang, L.; Ruonan, F.; Dong, W. Analysis on the Topological Structure Characteristics and Influence Mechanism of Global Digital Service Trade Network. Quart. Technol. Econ. 2021, 38, 128–147. [Google Scholar]
- Xiying, Z.; Yihuan, W. Research on the Influence of Digital Technology and Policy Restrictions on the Development of Digital Service Trade. Sustainability 2022, 14, 10420. [Google Scholar] [CrossRef]
- Yu, J.H.; Su, L.C. Is Accession to the CPTPP a Necessary Option for Korea? Kor. Ass. Int. Com. Inf. 2021, 23, 273–290. [Google Scholar] [CrossRef]
- Cristina, E.P.T. The EU-China road to the Comprehensive Agreement on Investment. Trib. Jurid. 2022, 12, 476–494. [Google Scholar]
- Daxue, K.; Lianju, L.; Weichiao, H.; Wenqing, Y. Digital Economy and the Upgrading of the Global Value Chain of China’s Service Industry. J. Theor. Appl. Electron. Commer. Res. 2022, 17, 1279–1296. [Google Scholar] [CrossRef]
- Chang, P.L.; Nguyen, P.T. Global value chains and the CPTPP. World Econ. 2022, 45, 3780–3832. [Google Scholar] [CrossRef]
- United States International Trade Commission. Digital trade in the U.S. and global economies, part 1. In Industry & Economy Analysis; Investigation No. 332–531; United States International Trade Commission: Washington, DC, USA, 2013; Volume 4415. [Google Scholar]
- United Nations Conference on Trade and Development. International Trade in ICT Services and ICT-Enabled Service; UNCTAD Technical Notes on ICT for Development; United Nations: New York, NY, USA, 2015; Volume 3. [Google Scholar]
- OECD. Towards a handbook on measuring digital trade: Status update. In Proceedings of the 31st Meeting of the IMF Committee on Balance of Payments Statistics, Washington, DC, USA, 24–26 October 2018. [Google Scholar]
- Ferencz, J.; Gonzales, F. Barriers to Trade in Digitally Enabled Services in the G20; OECD Trade Policy Paper No. 232; OECD Publishing: Paris, France, 2019. [Google Scholar]
- Ferracane, M.; Marel, E.V.D. Digital Innovation in East Asia: Do Restrictive Data Policies Matter; World Bank Policy Research Working Paper No. 9124; World Bank: Washington, DC, USA, 2020. [Google Scholar]
- Vu, T.T.H.; Tian, G.; Khan, N.; Zada, M.; Zhang, B.; Nguyen, T.V. Evaluating the International Competitiveness Competitiveness of Vietnam Wood Processing Industry by Combining the Variation Coefficient and the Entropy Method. Forests 2019, 10, 901. [Google Scholar] [CrossRef]
- Guan, Z.J.; Xu, Y.; Jiang, H.; Jiang, G.G. International competitiveness of Chinese textile and clothing industry—A diamond model approach. J. Chin. Econ. Foreign Trade Stud. 2019, 12, 2–19. [Google Scholar] [CrossRef]
- Lubna, N.; Adeel, A.; Ambreen, F. International competitiveness and ex-ante treatment effects of CPEC on household welfare in Pakistan. Int. J. Dev. Issues 2018, 17, 168–186. [Google Scholar]
- Esmaeili, A. Revealed Comparative Advantage and Measurement of International Competitiveness for Dates. J. Int. Food Agribus. Mark. 2014, 26, 209–217. [Google Scholar] [CrossRef]
- Nath, H.K.; Liu, L.; Tochkov, K. Comparative advantages in US bilateral services trade with China and India. J. Asian Econ. 2015, 38, 79–92. [Google Scholar] [CrossRef]
- Porter, M.E.; Kramer, M.R. A response to Andrew Crane et al.’s article by Michael, E. Porter and Mark, R. Kramer. Calif. Manag. Rev. 2014, 56, 151–153. [Google Scholar]
- Jiang, L.; Zhang, Y. The Impact of Foreign Trade on the Proportion of Labor Distribution—Analysis Based on China’s Provincial Panel Data. Int. Trade Issues 2008, 10, 26–33. [Google Scholar]
- Yeerken, A.; Deng, F. Digital Service Trade and Labor Income Share—Empirical Research on 48 Countries. Sustainability 2023, 15, 5468. [Google Scholar] [CrossRef]
- Markusen, J. Trade in Producer Services and in Other Specialized Intermediate Inputs. Am. Econ. Rev. 1989, 79, 85–95. [Google Scholar]
- Hufbauer, G.; Stephenson, S. Services Trade: Past Liberalization and Future Challenges. J. Int. Econ. Law 2007, 10, 605–630. [Google Scholar] [CrossRef]
- Karmakar, S. Services Trade Liberalisation and Domestic Regulations: The Developing Country Conundrum. Glob. Econ. J. 2007, 7, 3. [Google Scholar] [CrossRef]
- Gervais, A. Estimating the Impact of Country-level Policy Restrictions on Services Trade. Rev. Int. Econ. 2017, 26, 743–767. [Google Scholar] [CrossRef]
- Yu, W.; Yi, W.; Soo, H.L. The Effect of Cross-Border E-Commerce on China’s International Trade: An Empirical Study Based on Transaction Cost Analysis. Sustainability 2017, 9, 2028. [Google Scholar] [CrossRef]
- Lin, X.; Hyukku, L. Analysis of the Development and Influence Factors of Global Digital Trade. Korean Chin. Soc. Sci. Stud. 2021, 19, 66–84. [Google Scholar] [CrossRef]
- Ferencz, J. The OECD Digital Services Trade Restrictiveness Index; OECD Trade Policy Paper No. 221; OECD Publishing: Paris, France, 2019. [Google Scholar]
- Zhou, L.; Xia, Q.; Sun, H.; Zhang, L.; Jin, X. The Role of Digital Transformation in High-Quality Development of the Services Trade. Sustainability 2023, 15, 4014. [Google Scholar] [CrossRef]
- Didier, L. Comparing the Impacts of Some North-North and North-South Trade Agreements on Trade in Services. Rev. Econ. Polit. 2020, 130, 727–758. [Google Scholar] [CrossRef]
- Marel, E.V.D.; Ferracane, M.F. Do data policy restrictions inhibit trade in services? Rev. World Econ. 2021, 157, 727–776. [Google Scholar] [CrossRef]
- Fanfan, Q. Analysis on the Changes and Influencing Factors International Competitiveness of Digital Service Trade in the China. Master’s Thesis, Liao Ning University, Shenyang, China, 2021. [Google Scholar]
- Zhang, T.; Ni, Y.; Zhang, Y. Opportunities and Challenges: An Empirical Analysis of the International Competitiveness of China’s Digital Content Industry. Kor. Cit. Ind. 2022, 22, 22–30. [Google Scholar] [CrossRef]
- Marel, E.V.D.; Shepherd, B. Services Trade, Regulation and Regional Integration: Evidence from Sectoral Data. World Econ. 2013, 36, 1393–1405. [Google Scholar] [CrossRef]
- Zhaoyuan, X.; Fang, W.; Xiaoyong, D. Is learning by exporting technology specific? Evidence from Chinese firms. Econ. Inn. New. Technol. 2019, 32, 275–304. [Google Scholar]
- Mandi, J.; Peng, J. Does the level of digitalized service drive the global export of digital service trade? Evidence from global perspective. Tel. Inform. 2022, 72, 51–53. [Google Scholar]
- Hao, L.; Jian, H.; Yayun, X. The effect of the digital economy on services exports competitiveness and ternary margins. Telecommun. Policy 2023, 47, 102596. [Google Scholar]
- Yi, Z.; Wei, L.; Huang, X. Does Information-and Communication-Technology Market Openness Promote Digital Service Exports? Sustainability 2022, 14, 4901. [Google Scholar] [CrossRef]
- Spiezia, V.; Tscheke, J. International Agreements on Cross-Border Data Flows and International Trade: A Statistical Analysis; OECD Science, Technology and Industry Working Papers No. 9; OECD Publishing: Paris, France, 2020. [Google Scholar]
- Jia-Jia, L.; Nakhyun, H. A Study on the Strategic Trade Policy of Korea, China and Japan in the Era of Digital Trade. Kor. Cit. Ind. 2022, 47, 35–353. [Google Scholar]
- Hellmanzik, C.; Schmitz, M. The Impact of Cultural Exceptions: Audiovisual Services Trade and Trade Policy. Appl. Econ. Lett. 2015, 23, 695–700. [Google Scholar] [CrossRef]
- Marel, V.D.E.; Bauer, M.; Lee-Makiyama, H.; Verschelde, B. A methodology to estimate the costs of data regulations. Int. Econ. 2016, 146, 12–39. [Google Scholar] [CrossRef]
- Beverelli, C.; Fiorini, M.; Hoekman, B. Services trade policy and manufacturing productivity: The role of institutions. J. Int. Econ. 2017, 104, 166–182. [Google Scholar] [CrossRef]
- Kaššaj, M.; Peráček, T. Sustainable Connectivity—Integration of Mobile Roaming, WiFi4EU and Smart City Concept in the European Union. Sustainability 2024, 16, 788. [Google Scholar] [CrossRef]
- Balassa, B. Trade Liberalisation and“Revealed” Comparative Advantage. Manch. Sch. 1965, 33, 99–123. [Google Scholar] [CrossRef]
Disclaimer/Publisher’s Note: The statements, opinions and data contained in all publications are solely those of the individual author(s) and contributor(s) and not of MDPI and/or the editor(s). MDPI and/or the editor(s) disclaim responsibility for any injury to people or property resulting from any ideas, methods, instructions or products referred to in the content. |
© 2024 by the authors. Licensee MDPI, Basel, Switzerland. This article is an open access article distributed under the terms and conditions of the Creative Commons Attribution (CC BY) license (https://creativecommons.org/licenses/by/4.0/).