Article

Impacts of Carbon Border Adjustment Mechanism on the Development of Chinese Steel Enterprises and Government Management Decisions: A Tripartite Evolutionary Game Analysis

1
School of Energy and Environmental Engineering, University of Science and Technology Beijing, Haidian, Beijing 100083, China
2
China Center for Information Industry Development, Haidian, Beijing 100083, China
3
Shunde Graduate School, University of Science and Technology Beijing, Foshan 528399, China
4
School of Energy and Environment, City University of Hongkong, Hongkong 999077, China
*
Author to whom correspondence should be addressed.
Sustainability 2024, 16(8), 3113; https://doi.org/10.3390/su16083113
Submission received: 4 February 2024 / Revised: 18 March 2024 / Accepted: 21 March 2024 / Published: 9 April 2024

Abstract

:
Upon the implementation of the European Union Carbon Border Adjustment Mechanism (CBAM), substantial challenges are anticipated to impact the international trade of Chinese steel products. To safeguard the competitiveness of Chinese steel products on the global stage, this paper establishes a tripartite evolutionary game model, involving large steel enterprises, small- and medium-sized steel enterprises, and the government. The model integrates collaborative emission reduction and free-riding benefits among enterprises, along with the government’s dynamic subsidies and penalties. First, we calculate the replicator dynamic equations and conduct stability analysis to obtain the evolutionary trends and system equilibrium points in different phases of the CBAM. Then, we validate the evolutionary theoretical analysis of the model through example simulation analysis. Finally, we explore the impact of different parameters on the agents through a sensitivity analysis of parameters. The findings indicate that (1) large enterprises demonstrate greater sensitivity to CBAM, making their production structures more susceptible to changes in CBAM policies; (2) small- and medium-sized enterprises are more prone to free-riding behavior influence; (3) government intervention should be kept within appropriate boundaries, as excessive intervention may lead to strategic oscillation, with passive management being chosen by the government during the strengthening phase of CBAM; (4) elevating the price in the Chinese carbon market would slow down the structural changes in the production of Chinese steel enterprises, serving as an effective measure to counteract the impacts of CBAM. This paper provides theoretical support for how steel enterprises and the government can respond to CBAM, aiding stakeholders in selecting optimal strategies during different implementation stages and mitigating the impacts of the CBAM to the maximum extent possible.

1. Introduction

Addressing carbon leakage resulting from differences in climate policies has become an urgent global challenge in carbon emission reduction [1]. In order to tackle global carbon leakage and assist in global decarbonization, the European Commission introduced the Carbon Border Adjustment Mechanism (CBAM) in July 2021, with the commitment to achieve a net reduction of at least 55% in greenhouse gas emissions by 2030. The legislation was officially passed in October 2023. Grounded in the implicit carbon emissions of imported goods, the CBAM imposes additional carbon tariffs on goods imported into the EU [2]. Currently, the CBAM primarily targets carbon-intensive industries such as the steel sector [3], which mainly include cement, steel, aluminum, fertilizer, electricity, and hydrogen products. China, being a major exporter of steel, recorded a steel export volume of 669 million tons in 2021 [4], with approximately 4 million tons annually exported to the EU. As one of the countries subject to the CBAM, China’s domestic steel enterprises will incur carbon tariffs as a result of the CBAM legislation [5], which will be integrated into their operational costs through the pass-through mechanism [6,7]. Consequently, the overall competitiveness of Chinese steel products in the global market will be impacted [5]. At this juncture, Chinese steel enterprises will adjust their production decisions to cope with the progressively increasing additional carbon tax expenses. Simultaneously, the Chinese government, as the enforcer of pertinent regulations and the overseer urging enterprises toward low-carbon sustainable development, will inevitably play a role in the market dynamics prompted by the new regulations under the CBAM.
Currently, research on carbon tax imposition primarily revolves around the design of carbon tax schemes [8], with macro-level analyses examining the impacts of carbon taxes on different countries’ finances [9], social welfare [10], and decarbonization scenarios [11]. Similarly, analyses of the CBAM focus on controversies surrounding the legislation and its carbon reduction implications. For instance, some scholars argue that the CBAM will exacerbate carbon economic inequalities in trade [7]. Sigit et al. suggest that this measure may lead to decreased economic investment returns in less developed countries, thereby triggering greater carbon leakage [12]. The impact of this regulation is particularly severe on countries with high-carbon-intensity industries, including China, Iran, the United States, and India, all of which may oppose the CBAM [13]. David G, through economic theory analysis, demonstrates that the CBAM cannot effectively reduce global carbon emissions but only weakens the competitive advantage of exports from countries with less stringent carbon regulations [14]. Conversely, some scholars argue that the CBAM is an effective means to mitigate carbon leakage and promote global decarbonization [15], stimulating emission reduction efforts in relevant industries [16]. For the steel industry, the advancement of the CBAM is expected to stimulate enthusiasm for recycling resources such as scrap steel, promoting the recycling of scrap steel resources and reducing carbon dioxide emissions [17], while protecting the steel industry from the risk of carbon leakage [18]. Therefore, the current research lacks perspectives from enterprises and governments of countries subject to the CBAM, examining its impacts on stakeholders and how to mitigate its effects. Meanwhile, the mutual game between enterprises and governments under the implementation of the CBAM has also become a focal point of society.
Unlike traditional game theory, evolutionary game theory is an effective approach to addressing the problem of multiple equilibria [19]. Currently, evolutionary game theory has been widely applied in policy simulations [20], enterprise behavior modeling [21], and social issue analysis [22]. The strategic choices of enterprises and governments evolve continuously following CBAM policies, involving dynamic and complex group behavior arising from micro-level decisions within entities rather than one-time decisions. Evolutionary game theory provides a suitable framework for analyzing government and enterprise behaviors, where different-sized steel enterprises and the Chinese government, as the primary decision-makers under the CBAM’s implementation, interact strategically to maximize their interests and achieve stability.
Therefore, the primary research objective of this paper is to construct an evolutionary game model for the interactions between different types of steel enterprises and the Chinese government under the backdrop of CBAM. This study aims to investigate the changes in the behaviors of the three entities at various stages of the CBAM’s implementation and explore optimal decision-making strategies that alleviate the impact of the CBAM while maximizing self-interest. This paper will focus on the following questions: (1) What coping strategies will be adopted by steel enterprises of different scales and the Chinese government at different stages of the CBAM’s implementation? (2) Does the tripartite evolutionary model have points of evolutionary stability? (3) How do relevant parameters impact stakeholders?
To address the aforementioned questions, this paper constructs a more comprehensive and specific dynamic tripartite evolutionary game model. It analyzes the impact of the CBAM from the perspective of stakeholders’ behavioral decision-making and determines the evolutionary stable strategies of the model. Based on real cases and interviews with relevant personnel, the study identifies the key factors influencing the strategic choices of the main actors and conducts simulation experiments on variations in typical parameters. The contributions of this research are as follows: (1) It broadens the scope of China’s research on CBAM. (2) By employing an evolutionary game approach, it dynamically simulates the strategic behaviors and decision choices of the government and enterprises in response to CBAM. (3) Through an analysis of the evolutionary outcomes of government and enterprise strategies at different stages of the CBAM, it provides a scientific basis for formulating new environmental strategies to cope with the CBAM in the future.
The remaining organizational structure of this study is as follows: Section 2 provides a review and summary of the literature relevant to this study in recent years. Section 3 formulates hypotheses based on the relationships between the game entities and constructs a tripartite game model. Section 4 conducts a systematic analysis of the game model using system dynamics and stability theory. Section 5 employs numerical simulation to analyze the evolutionary paths of the model and conduct a sensitivity analysis of key parameters. Section 6 discusses the results of the analysis. Finally, Section 7 summarizes the research conclusions, policy implications, and research limitations.

2. Literature Review

2.1. The Current State of Research on the Impact of the CBAM on China

Regarding the impact of the CBAM on China, Guo et al., using the Global Trade Analysis Project (GTAP) model, verified that the CBAM has negative effects on China’s economic development, trade levels, and resident welfare [23]. GTAP is a general equilibrium model involving multiple countries and sectors, primarily utilized for investigating the impacts of international trade policies, environmental policies, and climate change. Lin and Zhao [24], through an assessment of the Chinese futures market, demonstrated significant adverse impacts of the CBAM on China’s energy-intensive export-oriented enterprises. Qi et al. [25], by constructing a price-variable resource allocation model, confirmed the negative effects of the CBAM on China’s commodity exports. They further emphasized that stabilizing a higher carbon price could reduce the impact of the CBAM. Yang and Yan [26], comparing the effects of carbon tariffs in the United States and the EU on the steel industry, concluded that carbon tariffs would negatively affect the value-added products of steel producers, accompanied by welfare losses. Combining the above literature illustrates that, in the future trade of the steel market, the impact of the CBAM will be one of the most critical factors. Most of the existing literature focuses on the welfare losses caused by the CBAM, environmental carbon leakage, and debates on trade measures. However, there is relatively less research analyzing the decision-making impact on stakeholders involved in the CBAM. Therefore, this paper aims to analyze and evaluate the strategies of governments and different types of enterprises in response to the CBAM.

2.2. The Current State of Research on Carbon Tax Policies

Currently, research on carbon tax policies and their impact on industries or businesses usually employs input–output models, the “tragedy of the commons” model, profit maximization models, and general equilibrium models. For example, Yu et al. [27], using an input–output model, explored the impact of carbon taxes on different age and income groups, revealing the burden of carbon taxes on different demographics. They demonstrated that carbon taxes pose energy challenges for low-income elderly individuals and require support mechanisms to mitigate the impact of carbon taxes. The input-output models selected for its research are predominantly used to examine the interrelationships and dependencies among different industries within an economic system. Naef et al. [28] have formulated a trilemma involving carbon taxation, fossil fuel revenues, and climate change, highlighting the inherent conflict or irreconcilability among these three choices. They analyzed the extent of support for carbon tax policies within the oil industry and provided empirical evidence demonstrating that oil and gas companies could employ carbon taxes as a means to alleviate competition from coal. However, this study did not address the issue of profit maximization for businesses; it solely analyzed the behavioral choices of relevant enterprises. Wang et al. [29] utilized a static profit maximization model, whereby, within predetermined market conditions, they optimized enterprise profits through adjustments in carbon taxes and low-carbon credits. This approach allowed them to examine the impact of carbon taxes and low-carbon credits on the manufacturing activities of enterprises. Their findings underscored the necessity for capital considerations to include low-carbon costs and the availability of low-carbon financing, despite the efficacy of carbon tax policies in emissions control. Lamb et al. [30] utilized a computable general equilibrium (CGE) model to establish supply–demand relationships across all carbon and energy markets, thereby simulating the interconnectedness of these markets. Their simulation evaluated the contributions and impacts of carbon taxation, phasing out coal-fired power plants, and introducing subsidies for unconventional renewable energy on emission reduction. Results indicated that all three policies could effectively reduce greenhouse gas emissions. Additionally, the phase-out of coal-fired power plants exerted a significant impact on GDP, while subsidies for unconventional renewable energy influenced household income and expenditure.
In summary, in studying the impact of carbon taxes on industries or businesses, there is a lack of research on the decision-making of enterprises in response to carbon tax policies. Moreover, in terms of model application, there is a lack of a dynamic evolving game-theoretic form that adjusts to meet the goal of profit maximization for businesses.

2.3. The Application of Evolutionary Game Theory in the Steel Industry

Evolutionary game theory has become a crucial theoretical approach for addressing environmental issues, combining game theory with dynamic evolutionary processes to explain the phenomena of mutual learning and competition during the evolution of agents. Methodologically, compared with traditional game theory, evolutionary game theory places more emphasis on dynamic equilibrium among agents, highlighting the limited rationality of stakeholders’ behavior in an environment of incomplete information [31].
This framework is particularly suited for analyzing the competitive–cooperative relationships between different types of steel enterprises and governmental actions. Zhou et al. [32] studied the relationship between government intervention and low-carbon innovation technology by constructing a three-way evolutionary model. Meng et al. [33] built a three-way evolutionary model between the government and the shipping industry, analyzing the impact of government regulation on energy-saving and emission reduction strategies in the shipping industry. Yuan et al. [34] analyzed the relationship between the government and prefabricated housing construction by constructing a three-way evolutionary model, proposing a mechanism for promoting prefabricated housing construction. In recent years, evolutionary game theory has also been widely applied to the steel industry. Zhang et al. [35] constructed an evolutionary model of pollution coordination governance among steel enterprises under the carbon quota trading mechanism. Liu et al. [36] analyzed the game relationship between steel enterprises, scrap steel enterprises, and the government from the perspective of evolutionary game theory, deriving corresponding behavioral strategies. Zhang et al. [37] simulated the relationship between Chinese iron and steel enterprises and international iron ore enterprises to provide the basis for strategic choices in iron ore negotiations. Lin et al. [38] used the method of evolutionary game theory to analyze the interactive relationship between steel enterprises and the government in the post-pandemic era, offering policy recommendations for the sustainable development of steel enterprises.

2.4. Summary

In summary, previous research on the steel industry has mostly focused on the impact of domestic policies in China and the promotion of relevant technologies. However, there is limited research on the relationship and response strategies between steel enterprises and the government after the implementation of the CBAM. This paper, using the method of evolutionary game theory, simulates the interactions between carbon tax collection, stakeholder benefits, and various influencing factors over a certain period, reflecting the optimal choices for government and corporate strategies under carbon border tax imposition.

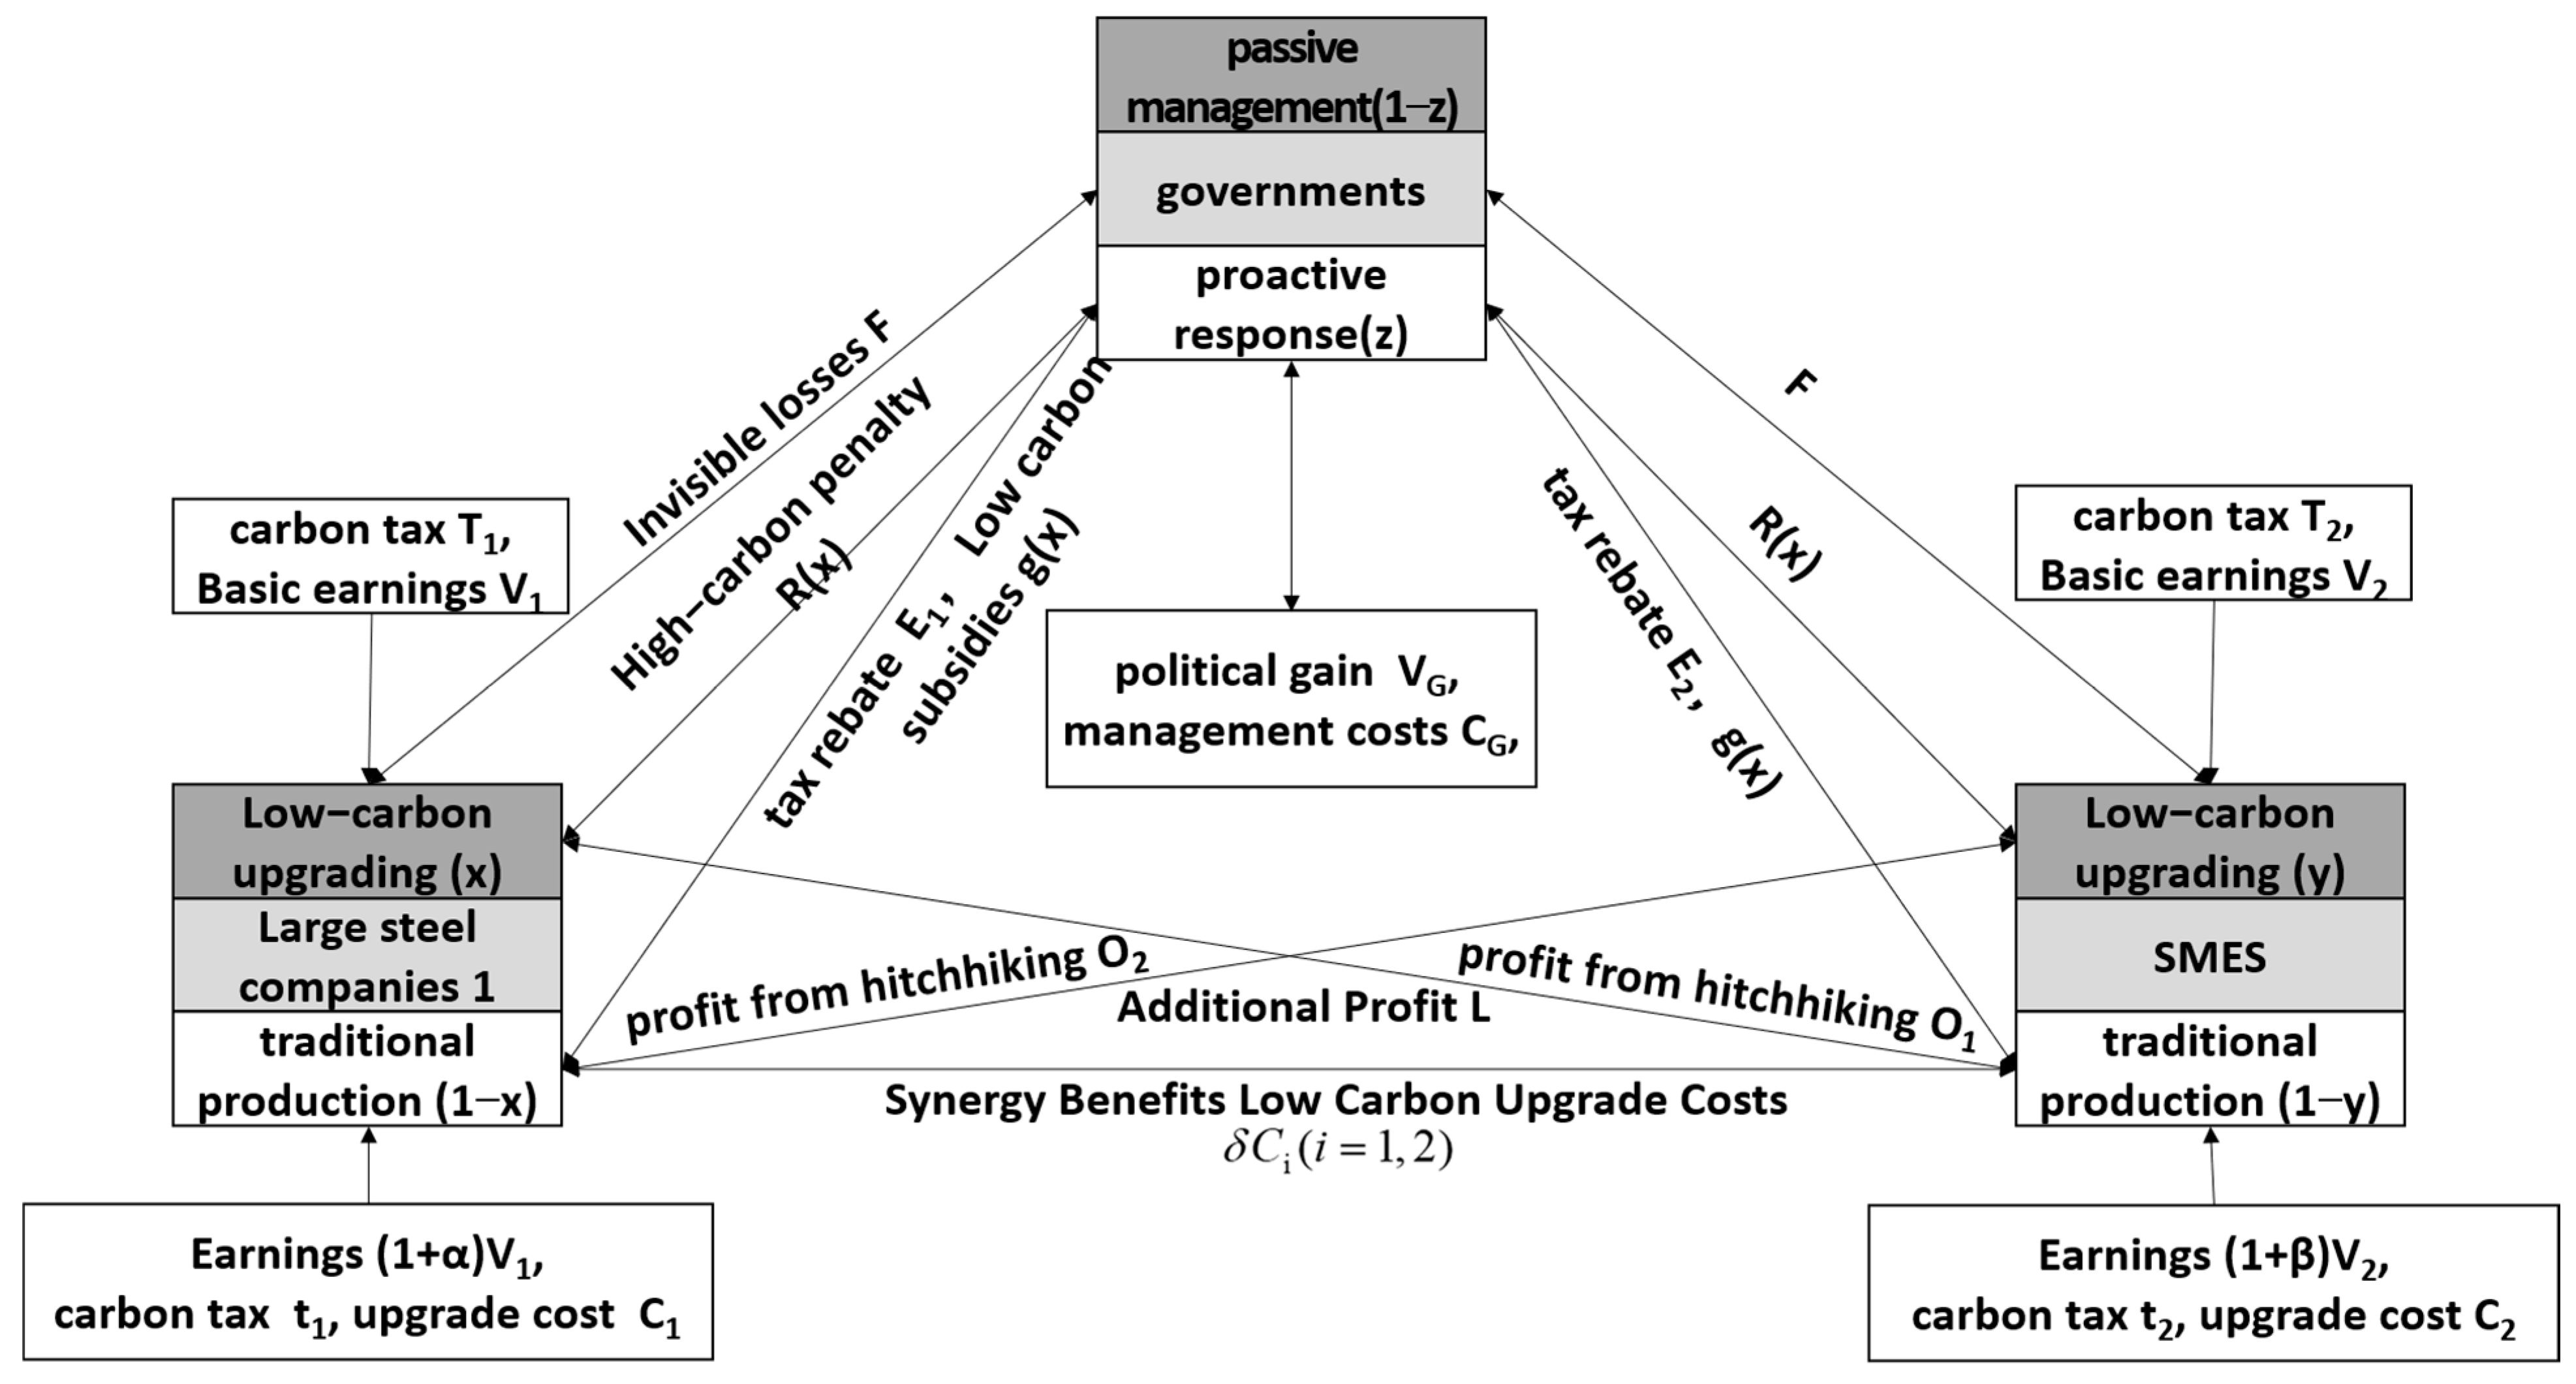
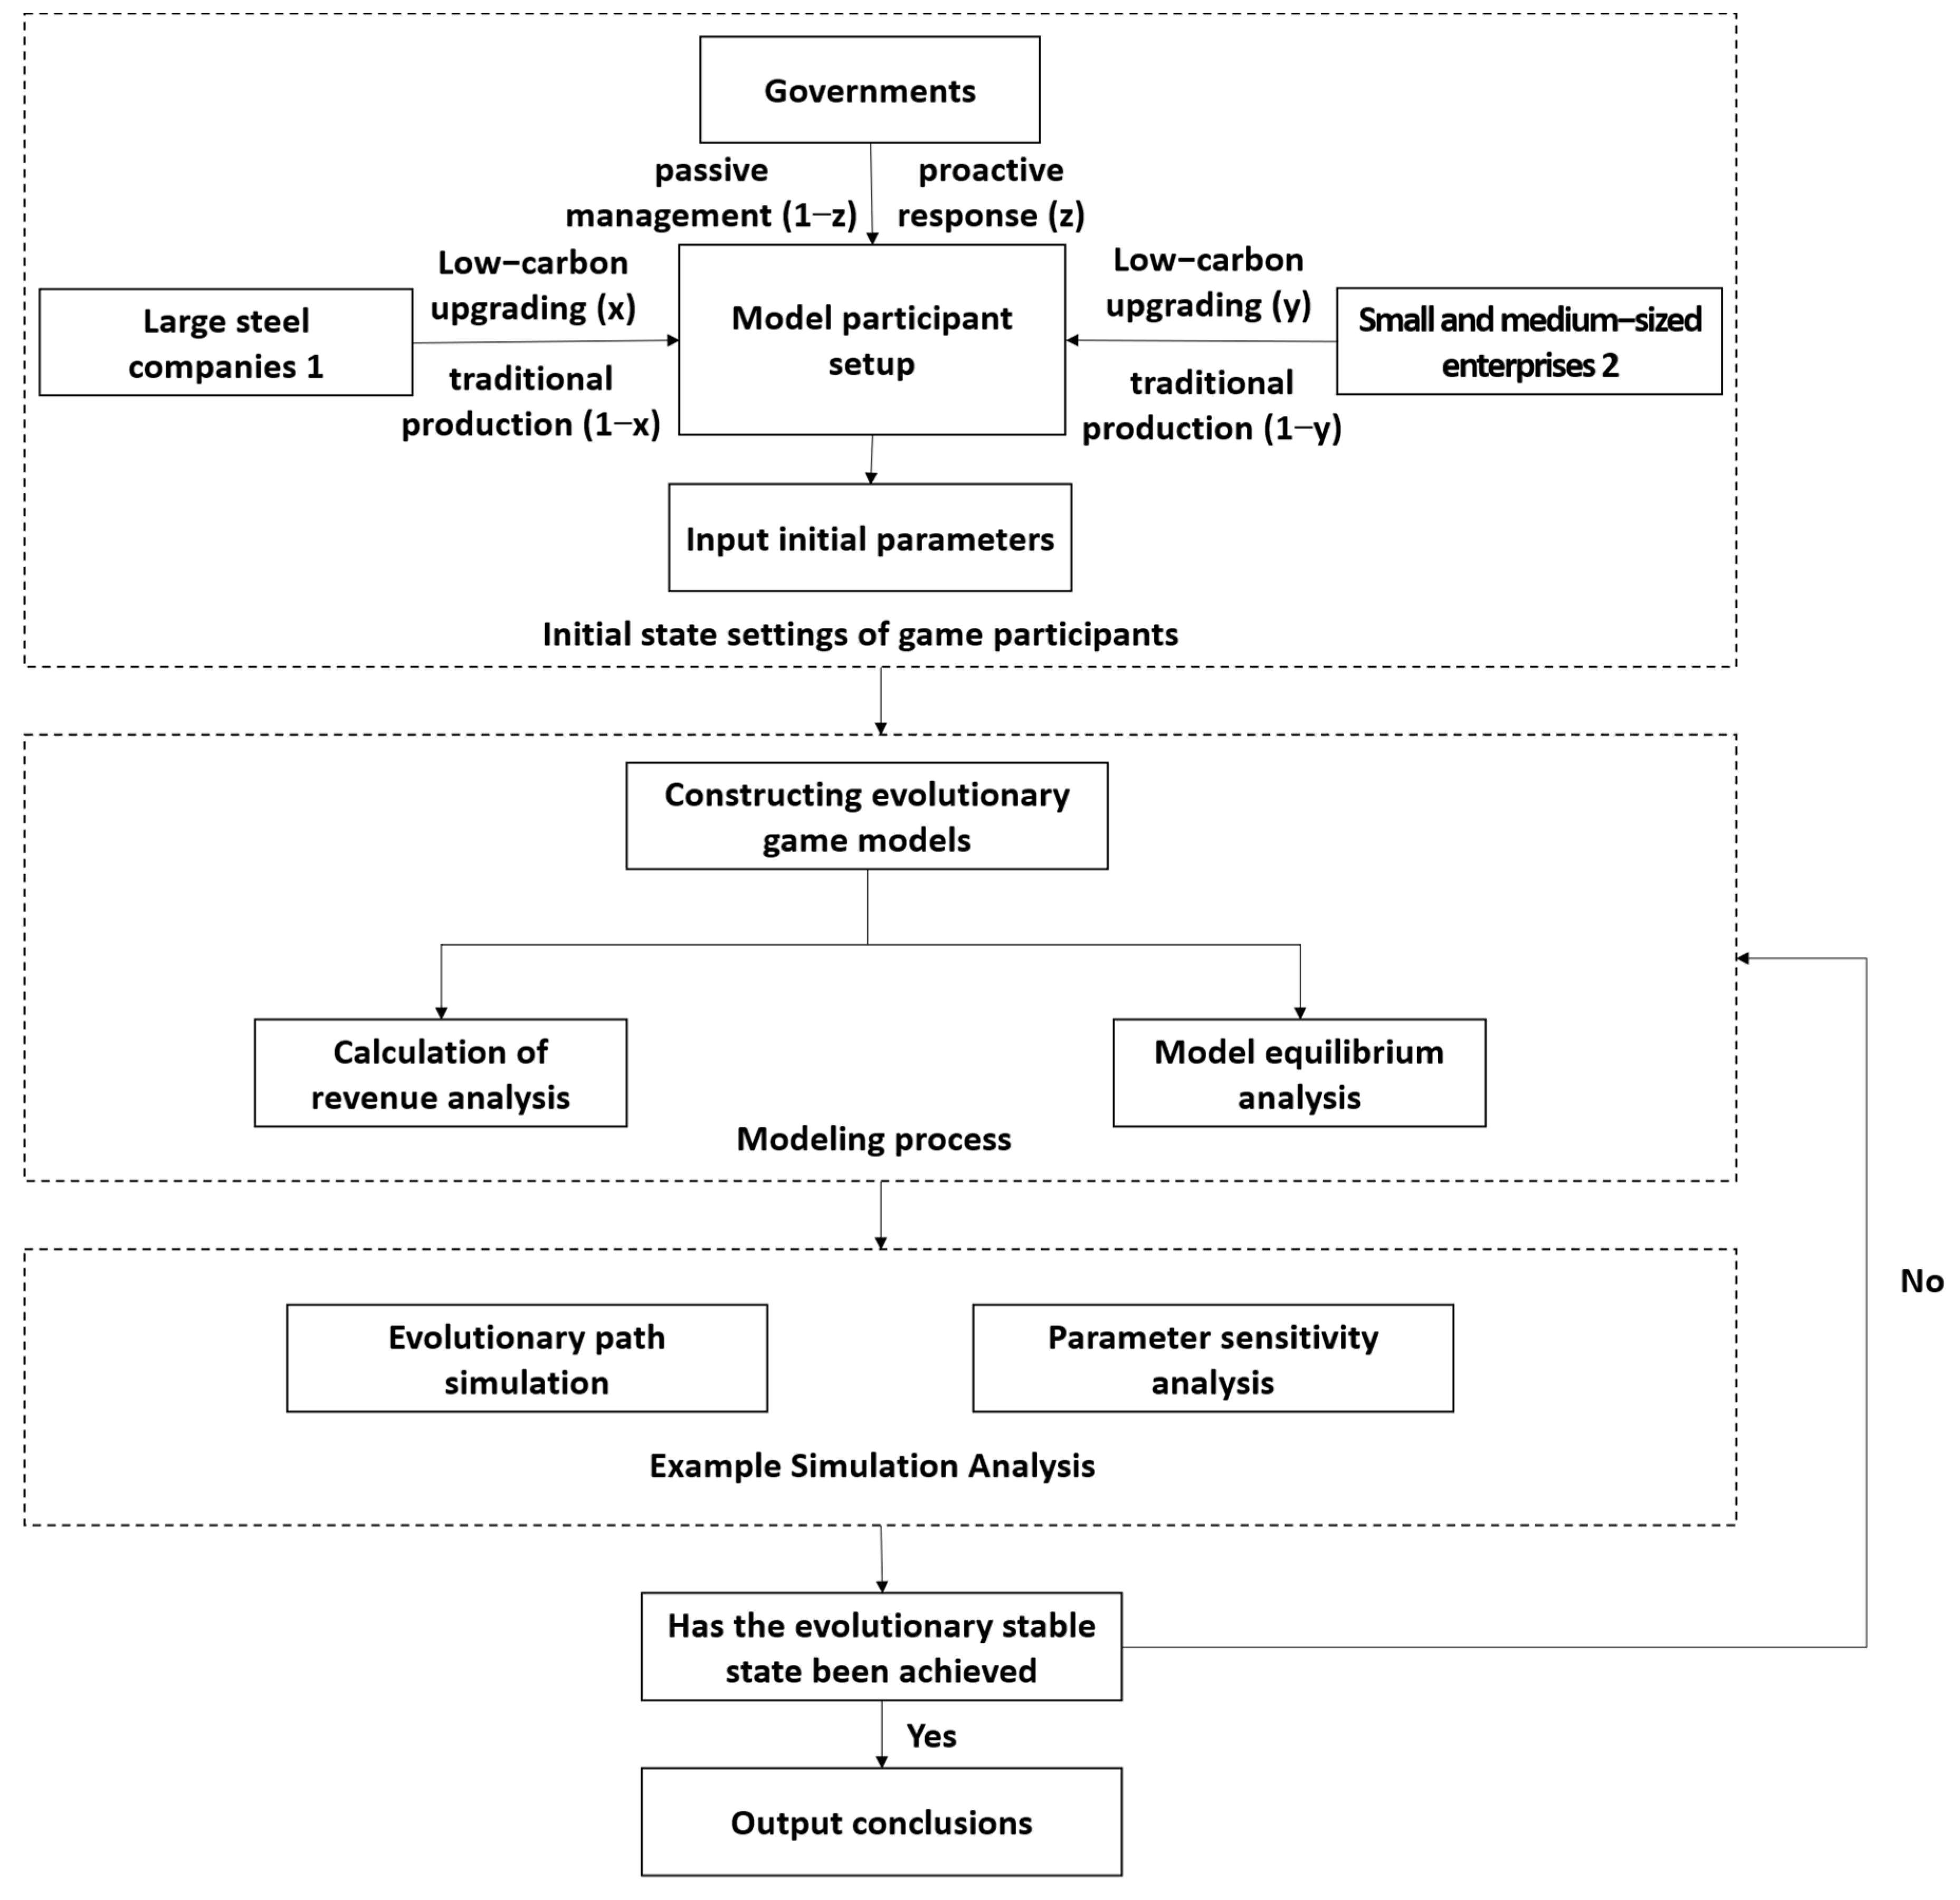
3. Construction of a Tripartite Evolutionary Model

3.1. Description of the Problem

Under the implementation of the CBAM, there exists a competitive game relationship between large-scale steel enterprises and small- and medium-sized steel enterprises, with the government serving as a market guide and providing relevant policy and financial support as a crucial external force. Therefore, the model includes three participants: large-scale steel enterprises, small- and medium-sized steel enterprises, and the government. They all make independent decisions under bounded rationality to maximize their own interests. Large-scale and small- and medium-sized steel enterprises face the CBAM and government management by deciding whether or not to undergo low-carbon upgrades. The government, as a key external force, can choose whether or not to proactively address the CBAM and formulate its own decisions. Since all three parties need to satisfy their own profits, their strategic choices will also be dynamic. Using an evolutionary game model to identify the evolutionary stable points among the three parties is crucial in understanding how to better respond to the CBAM. The logical relationship among the three entities is illustrated in Figure 1.

3.2. Methodological Design

The results indicate that the above analysis elucidates the issues to be addressed in this paper as well as the logical relationships among the entities involved. The next section will analyze and solve the problem based on evolutionary game theory. The methodological design for model solution in this paper is illustrated in Figure 2.

3.3. Model Assumptions
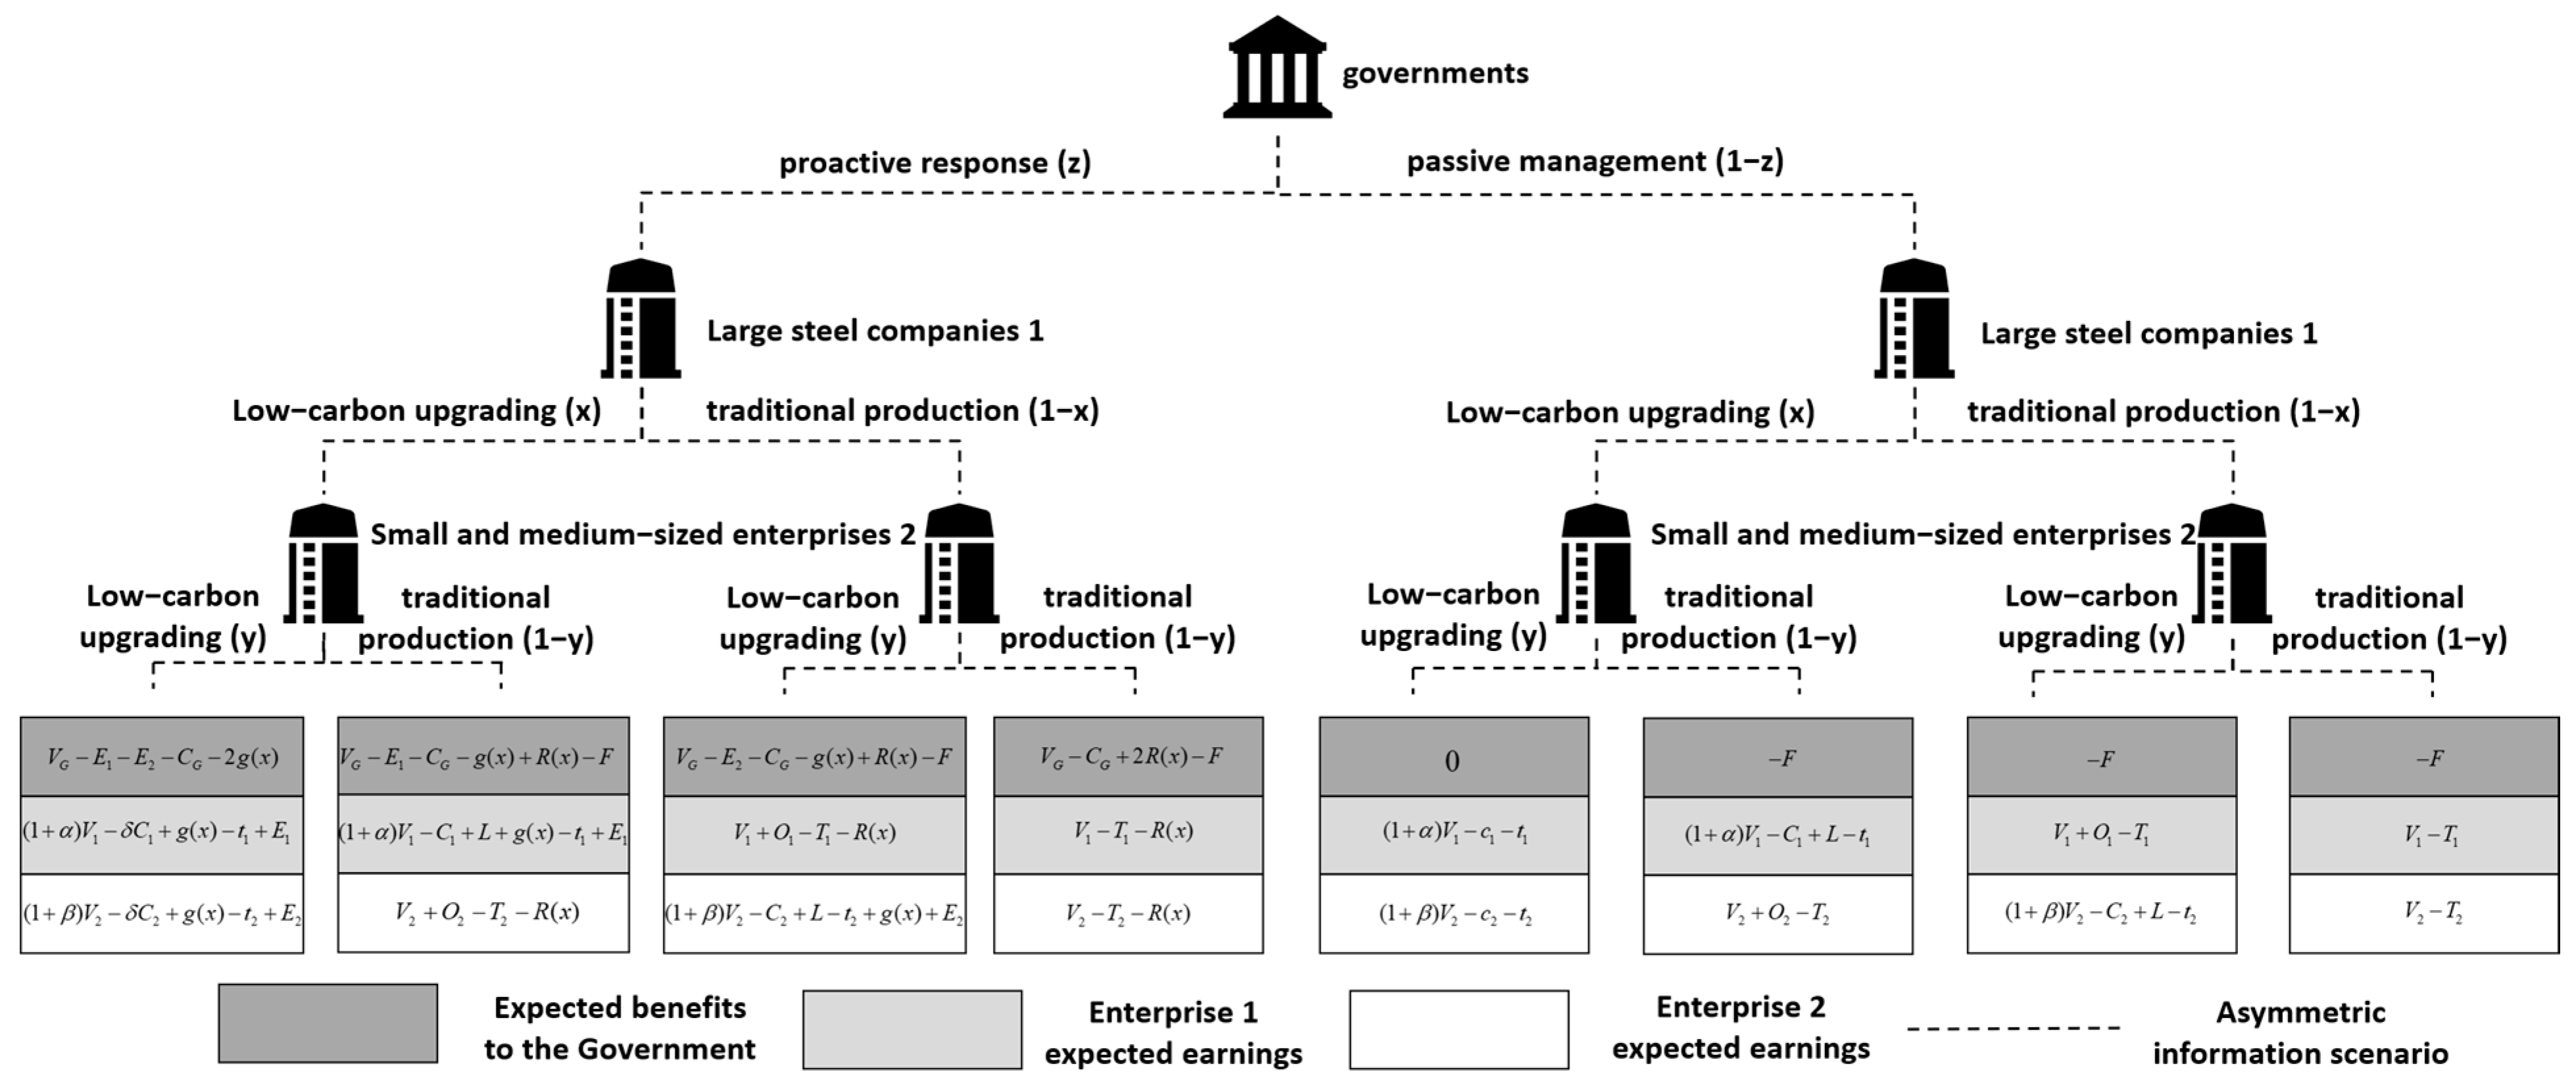
Drawing from the behavioral logic relationship among the three parties in the game model, as depicted in Figure 1, the following hypotheses can be posited.
Assumption 1: The decision dynamics of steel enterprises will be influenced by environmental policies, government attitudes, and the interactions of other steel enterprises. This will lead to the formation of a competitive–cooperative equilibrium state between the government and enterprises [39]. Considering the entire steel industry as a comprehensive system, the assumption involves the existence of a large-scale steel enterprise (Enterprise 1), a medium-sized steel enterprise (Enterprise 2), and the government playing a guiding and managerial role. When the CBAM is implemented, there exists a game system involving large steel enterprises, 1, small- and medium-sized steel enterprises, 2, and the Chinese government, all of whom exhibit bounded rationality. In this scenario, each party aims to maximize their expected utility under the assumption of asymmetric information. They will make decisions based on the principle of profit maximization. It is not possible to obtain the optimal strategy from a single game. Once a player becomes aware of the strategy chosen by others, a long-term dynamic evolutionary process ensues. Furthermore, players possess the ability to engage in mutual learning, competition, and cooperation, leading to continual adjustments of their strategies until stability is achieved. The decision set for Enterprise 1 includes (1: undergo low-carbon upgrade, 0: maintain the existing production mode). The probability of choosing the decision 1 is denoted as x ( 0 x 1 ), and the probability of choosing 0 is denoted as 1 − x. The decision set for Enterprise 2 includes (1: undergo low-carbon upgrade, 0: maintain the existing production mode). The probability of choosing decision 1 is denoted as y ( 0 y 1 ), and the probability of choosing 0 is denoted as 1 − y. The decision set for the government includes (1: proactively address the CBAM, 0: passively manage). The probability of choosing decision 1 is denoted as z ( 0 y 1 ), and the probability of choosing 0 is denoted as 1 − z. Here, x, y, and z are all functions of time, t.
Assumption 2: When both Enterprise 1 and Enterprise 2 choose the traditional production mode, both parties receive basic benefits, Vi (I = 1, 2). Enterprises opting for a low-carbon upgrade mode can gain returns from low-carbon investments. This brings additional benefits to Enterprise 1, denoted as α V 1 , where α α represents the input–output ratio of low-carbon production for Enterprise 1, and additional benefits to Enterprise 2, denoted as β V 2 , where β represents the input–output ratio of low-carbon production for Enterprise 2. When one enterprise chooses the low-carbon upgrade production strategy while the other adheres to the traditional production mode, the enterprise implementing low-carbon production incurs corresponding costs, Ci. When both enterprises choose low-carbon upgrade, collaborative emission reduction utility is generated [40], and the emission reduction cost is reduced to δ C i ( i = 1 , 2 ) , where δ is the synergy coefficient 0 < δ < 1 .
Assumption 3: Currently, there is a stronger market demand for products produced through low-carbon processes in the global steel market. Consumers are willing to pay higher prices for environmentally friendly low-carbon products instead of regular products [41]. If one enterprise chooses the low-carbon production mode while the other adheres to traditional production, the enterprise implementing low-carbon production gains additional income, denoted as L. When both enterprises choose low-carbon production, the two enterprises compete at the same level, and hence, neither receives additional income. Additionally, government subsidies for dynamic low-carbon initiatives to enterprises are directly proportional to the share of low-carbon enterprises [42]. The subsidy amount for enterprises is represented by g ( x ) = g × e , where g is the maximum subsidy amount, and e is the proportion of low-carbon enterprises. Similarly, under increased government intervention, there will be dynamic penalties for high-carbon enterprises, i.e., those enterprises still using traditional production methods. The government’s penalty intensity for high-carbon enterprises is also related to the proportion of enterprises using traditional production methods, represented by the penalty function R ( x ) = r × ( 1 e ) , where r is the maximum penalty amount.
Assumption 4: Considering the management of air pollution in the steel industry as a collective interest, Enterprise 1 and Enterprise 2 are two actors within this collective. The benefits of air pollution control are shared by the actors [43]. The cost of low-carbon governance is borne individually by each actor. Therefore, when one enterprise chooses a low-carbon upgrade strategy, the willingness of the other actor to choose a low-carbon upgrade will be suppressed, leading to free-riding behavior [44]. When Enterprise 1 chooses a low-carbon upgrade, Enterprise 2 gains benefits denoted as O 2 due to free-riding. Similarly, when Enterprise 2 chooses a low-carbon upgrade, Enterprise 1 gains benefits denoted as O 2 due to free-riding.
Assumption 5: If an enterprise maintains its traditional production mode, the carbon emission intensity per ton of steel is denoted as N i . When the enterprise adopts a low-carbon upgrade strategy, the carbon emission intensity per ton of steel becomes M i ; at this time, N i > M i ( i = 1 , 2 ) . Influenced by the EU CBAM, additional carbon taxes are imposed on steel product exports. The export quantity of steel products for the enterprise is represented by l. For analytical convenience, it is assumed that after the low-carbon upgrade, the carbon emission intensity per ton of steel is equivalent to that of a European steel enterprise with a similar scale and product profile. The carbon emission intensity per ton of steel for a comparable European enterprise under the EU Emissions Trading System (EU-EST) is denoted as ES. This European enterprise receives free carbon allowances with a ratio denoted as b, and the carbon trading prices in the EU and China are denoted as EP and CP; at this time, 0 b < 1 , E P < C P . In this scenario, the CBAM tax (t) for the enterprise after implementing the low-carbon upgrade is calculated as follows:
t = ( M i M i × b ) × ( E P C P ) × l
When the enterprise adopts the traditional production mode, the CBAM tax expense (T) is calculated as follows:
T = ( N i E S × b ) × ( E P C P ) × l
Assumption 6: When the government proactively responds to CBAM regulations, it will gain corresponding environmental reputation and image internationally [45]. Additionally, it will enhance international market access for domestic goods [46]. Proactive compliance with international regulations also demonstrates the government’s commitment to compliance in international affairs [47], increases international trust in China, and results in corresponding political benefits, VG. To protect the competitiveness of domestic products in the international market [48,49], the government encourages enterprises to undergo low-carbon transformation by providing a certain amount of tax rebate, Ei, for products from low-carbon enterprises and dynamic subsidies. Under the choice of actively facing the CBAM, the government incurs additional regulatory and operational costs, Cg. Regardless of the measures taken by the government when some enterprises maintain traditional high-carbon production modes, it will result in external implicit losses such as ecological management fees, and public and social health costs [50], climate adjustment measures, and other external implicit losses, F [50,51].
Based on the model assumptions described above, let us construct a three-player game tree for the government, large Enterprise 1, and small–medium Enterprise 2 under the scenario of asymmetric information, as depicted in Figure 3, where dashed lines represent asymmetric information states among the three parties. Additionally, we will list the payoff matrix for the model, as shown in Table 1.

4. Model Analysis

4.1. Analysis of Replication Dynamics

1.
Large Steel Enterprise 1
The expected payoff, u11, for Enterprise 1 choosing the low-carbon upgrade strategy is as follows:
u 11 = y z [ ( 1 + α ) V 1 δ C 1 + g ( x ) t 1 + E 1 ] + y ( 1 z ) [ ( 1 + ) V 1 δ C 1 t 1 ] + z ( 1 y ) [ ( 1 + α ) V 1 C 1 + L + g ( x ) t 1 + E 1 ] + ( 1 y ) ( 1 z ) [ ( 1 + ) V 1 C 1 + L t 1 ] = ( 1 + α ) V 1 C 1 + L t 1 + y ( C 1 δ C 1 L ) + z ( g ( x ) + E 1 )
The expected payoff, u12, for choosing to maintain the traditional production mode is as follows:
u 12 = y z ( V 1 + O 1 T 1 R ( x ) ) + y ( 1 z ) ( V 1 + O 1 T 1 ) + z ( 1 y ) ( V 1 T 1 R ( x ) ) + ( 1 y ) ( 1 z ) ( V 1 T 1 ) = V 1 T 1 + O 1 y R ( x ) z
The average payoff, u ¯ 1 , is as follows:
u ¯ 1 = x u 11 + ( 1 x ) u 12
The replicator dynamic equation for the production strategy choice of steel Enterprise 1, derived from Equations (3) and (5), is as follows:
F ( x ) = d x d t = x ( u 11 u ¯ 1 ) = x ( 1 x ) ( u 11 u 12 ) = x ( 1 x ) [ ( 1 + α ) V 1 C 1 + L t 1 + y ( C 1 c 1 L ) + z ( g ( x ) + E 1 ) V 1 + T 1 O 1 y + R ( x ) z ] = x ( 1 x ) [ α V 1 C 1 + L t 1 + T 1 + y ( C 1 δ C 1 L O 1 ) + z ( g ( x ) + R ( x ) + E 1 ) ]
2.
Small- and Medium-Sized Steel Companies, 2
The expected payoff, u21, for Enterprise 2 choosing the low-carbon upgrading strategy is as follows:
u 21 = x z [ ( 1 + β ) V 2 δ C 2 + g ( x ) t 2 + E 2 ] + x ( 1 z ) [ ( 1 + β ) V 2 δ C 2 t 2 ] + z ( 1 x ) [ ( 1 + β ) V 2 C 2 + L + g ( x ) t 2 + E 2 ] + ( 1 x ) ( 1 z ) [ ( 1 + β ) V 2 C 2 + L t 2 ] = ( 1 + β ) V 2 C 2 + L t 2 + x ( C 2 δ C 2 L ) + z ( g ( x ) + E 2 )
The expected payoff, u22, for Enterprise 2 maintaining the traditional production mode is as follows:
u 22 = x z ( V 2 + O 2 T 2 R ( x ) ) + x ( 1 z ) ( V 2 + O 2 T 2 ) + z ( 1 x ) ( V 2 T 2 R ( x ) ) + ( 1 x ) ( 1 z ) ( V 2 T 2 ) = V 2 T 2 + O 2 x R ( x ) z
The average payoff, u ¯ 2 , is as follows:
u ¯ 2 = y u 21 + ( 1 y ) u 22
Based on Equations (7) and (9), the replicator dynamic equation for steel Enterprise 2’s production strategy choice is given by the following:
F ( y ) = d y d t = y ( u 21 u ¯ 2 ) = y ( 1 y ) ( u 21 u 22 ) = y ( 1 y ) [ ( 1 + β ) V 2 C 2 + L t 2 + x ( C 2 δ C 2 L ) + z ( g ( x ) + E 2 ) V 2 + T 2 O 2 x + R ( x ) z ] = y ( 1 y ) [ β V 2 C 2 + L t 2 + T 2 + x ( C 2 δ C 2 L O 2 ) + z ( g ( x ) + R ( x ) + E 2 ) ]
3.
Government
The expected return, u31, to the government’s choice of a proactive CBAM response strategy is as follows:
u 31 = x y ( V G E 1 E 2 C G 2 g ( x ) ) + x ( 1 y ) ( V G E 1 C G g ( x ) + R ( x ) F ) + y ( 1 x ) ( V G E 2 C G g ( x ) + R ( x ) F ) + ( 1 x ) ( 1 y ) ( V G C G + 2 R ( x ) F ) = F x y x ( E 1 + g ( x ) + R ( x ) ) y ( E 2 + g ( x ) + R ( x ) )
The expected return, u32, from passive management is as follows:
u 32 = F ( 1 y ) x F ( 1 x ) y F ( 1 x ) ( 1 y ) = F + F x y
The average payoff, u ¯ 3 , is as follows:
u ¯ 3 = z u 31 + ( 1 z ) u 32
The replication dynamic equation for management strategy choice on the government side is as follows:
F ( z ) = d z d t = z ( u 31 u ¯ 3 ) = z ( 1 z ) ( u 31 u 32 ) = z ( 1 z ) [ F x y x ( E 1 + g ( x ) + R ( x ) ) y ( E 2 + g ( x ) + R ( x ) ) + F F x y ] = z ( 1 z ) [ F x ( E 1 + g ( x ) + R ( x ) ) y ( E 2 + g ( x ) + R ( x ) ) ]

4.2. Stable Equilibrium Analysis

By associating (5), (8), and (11) with each other, the model power system is formed, as shown in the following equation:
F ( x ) = x ( 1 x ) [ α V 1 C 1 + L t 1 + T 1 + y ( C 1 δ C 1 L O 1 ) + z ( g ( x ) + R ( x ) + E 1 ) ] F ( y ) = y ( 1 y ) [ β V 2 C 2 + L t 2 + T 2 + x ( C 2 δ C 2 L O 2 ) + z ( g ( x ) + R ( x ) + E 2 ) ] F ( z ) = z ( 1 z ) [ F x ( E 1 + g ( x ) + R ( x ) ) y ( E 2 + g ( x ) + R ( x ) ) ]
When the decision change rates of the three entities are zero, the equilibrium points of this tripartite evolutionary system can be obtained. That is, when F ( x ) = 0 , F ( y ) = 0 , F ( z ) = 0 , there exist eight pure stable strategy points, P 1 ( 0 , 0 , 0 ) , P 2 ( 1 , 0 , 0 ) , P 3 ( 0 , 0 , 1 ) , P 4 ( 1 , 0 , 1 ) , P 5 ( 0 , 1 , 0 ) , P 6 ( 1 , 1 , 0 ) , P 7 ( 0 , 1 , 1 ) , and P 8 ( 1 , 1 , 1 ) , and one mixed strategy equilibrium point, P 9 ( x , y , z ) .
x = F     y ( E 2   +   g ( x )   +   R ( x ) ) E 1   +   g ( x )   +   R ( x ) y = α V 1     C 1   +   L t 1   +   T 1   +   z [ g ( x )   +   R ( x )   +   E 1 ] δ C 1   +   L   +   O 1     C 1 z = β V 2     C 2   +   L t 2   +   T 2   +   x ( C 2     δ C 2     L     O 2 ) [ g ( x )   +   R ( x )   +   E 2 ]
According to the arguments presented in the papers by Wainwright [52] and Lyapunov [53], to determine whether or not a stable point is an asymptotically stable point in the dynamic evolutionary system, it must exhibit a pure Nash equilibrium strategy balance. Therefore, temporarily ignoring the mixed strategy point, P 9 ( x , y , z ) , the analysis will focus on the remaining eight equilibrium points. Secondly, based on Lyapunov’s method for system stability determination [54], when all eigenvalues of the Jacobian matrix of the evolution model are negative, the point is an asymptotically stable point. When at least one eigenvalue is positive, the equilibrium point is unstable. If there are eigenvalues equal to 0 with the rest being negative, the stability of the point cannot be determined, indicating a saddle point. Using the above methods and the system’s dynamic system, the Jacobian matrix can be obtained:
J = J 11 J 12 J 13 J 21 J 22 J 23 J 31 J 32 J 33 = F ( x ) x F ( x ) y F ( x ) z F ( y ) x F ( y ) y F ( y ) z F ( z ) x F ( z ) y F ( z ) z
The arithmetic is available:
J 11 = ( 1 2 x ) [ α V 1 C 1 + L t 1 + T 1 + y ( C 1 δ C 1 L O 1 ) + z ( g ( x ) + R ( x ) + E 1 ) ] J 12 = x ( 1 x ) ( C 1 δ C 1 L O 1 ) J 13 = x ( 1 x ) ( g ( x ) + R ( x ) + E 1 ) J 21 = y ( 1 y ) ( C 2 δ C 2 L O 2 ) J 22 = ( 1 2 y ) [ β V 2 C 2 + L t 2 + T 2 + x ( C 2 δ C 2 L O 2 ) + z ( g ( x ) + R ( x ) + E 2 ) ] J 23 = y ( 1 y ) ( g ( x ) + R ( x ) + E 2 ) J 31 = z ( 1 z ) ( E 1 + g ( x ) + R ( x ) ) J 32 = z ( 1 z ) ( E 2 + g ( x ) + R ( x ) ) J 33 = ( 1 2 z ) [ F x ( E 1 + g ( x ) + R ( x ) ) y ( E 2 + g ( x ) + R ( x ) ) ]
Based on the above results, the eigenvalues of the eight equilibrium points can be calculated, as shown in Table 2.
By taking the eigenvalues in the above table, the ESS of the system for different conditions can be derived, as can be seen through Table 3:
As indicated in the above table, due to the non-negativity of the hidden loss, F, caused by high emissions from enterprises, point P 1 ( 0 , 0 , 0 ) cannot be a stable point in the evolutionary system. It can only be a saddle point or an unstable point. Only points P 2 ( 1 , 0 , 0 ) , P 3 ( 0 , 0 , 1 ) , P 4 ( 1 , 0 , 1 ) , P 5 ( 0 , 1 , 0 ) , P 6 ( 1 , 1 , 0 ) , P 7 ( 0 , 1 , 1 ) , and P 8 ( 1 , 1 , 1 ) have the potential to become ESS under certain conditions. Due to space limitations and for the sake of simplification, it is unnecessary to analyze all potential ESS. With the initiation of the CBAM legislation in October 2023, the period from October 2023 to the end of December 2025 is considered a transition period. The CBAM will be formally implemented from 2026, and its enforcement will strengthen each year from 2026 to 2034. According to the progression of the CBAM legislation, the implementation of the CBAM is divided into four phases: the window phase, transition phase, implementation phase, and strengthening phase.
The first stage is the window phase, which occurs before the initiation of the CBAM. During this stage, large steel enterprises, due to their significant market share in overseas markets, are among the first to face the impacts of the CBAM. They begin to realize the necessity of undertaking low-carbon industrial upgrades and transitioning toward sustainable development to mitigate the losses incurred by the CBAM. Specifically, when the benefits of low-carbon production outweigh the costs, i.e., α V 1 + L > C 1 + t 1 T 1 , large enterprises will take measures to upgrade to low-carbon production; small- and medium-sized enterprises, influenced by free-rider benefits and upgrade costs, will choose to maintain their existing production mode ( β V 2 t 2 + T 2 δ C 2 O 2 < 0 ). At the same time, as the CBAM regulations have not officially started, the government is more inclined to adopt a passive and wait-and-see attitude. Therefore, P 2 ( 1 , 0 , 0 ) is the optimal stable strategy point for dealing with this stage.
The second stage is the transition phase. With the official launch of the CBAM regulations in October 2023, following a preparatory phase, the government, aiming to ensure the sustainable development of the steel market and reduce pollution emissions from the steel industry, begins to actively intervene in management. Through measures such as carbon emission incentives and penalties, as well as fiscal subsidies, the government seeks to alter enterprise production strategies, promote energy conservation, and encourage sustainable development reforms. These initiatives aim to assist enterprises in addressing the impacts of the CBAM’s implementation by mitigating emissions through emission reduction efforts. Simultaneously, constrained by the prevailing socio-economic context and the imperative for sustainable development, the government faces an increased implicit cost for high-carbon enterprises ( F > E 1 + g ( x ) + R ( x ) ). The government is inclined to proactively respond to CBAM decisions. During this stage, small- and medium-sized enterprises are less affected by the CBAM due to their lower export volumes. Consequently, they continue to opt for maintaining traditional production methods, countering the costs of upgrading and the high-carbon penalties through the benefits derived from free-riding. At this stage, P 4 ( 1 , 0 , 1 ) is the corresponding optimal equilibrium point.
The third stage is the implementation stage. This stage corresponds to the substantial implementation of the CBAM starting from January 2026. Importers of goods covered by the CBAM need to purchase CBAM certificates for the implied carbon emissions. At this stage, as the CBAM regulations become increasingly refined and the CBAM legislation is implemented, steel enterprises face intensified impacts from the CBAM. Under the dynamic low-carbon subsidy and high-carbon penalty mechanisms of the government, large steel enterprises find that the benefits ( α V 1 + g ( x ) + E 1 δ C 1 ) of low-carbon upgrading outweigh the costs ( t 1 + O 1 T 1 R ( x ) ) associated with maintaining traditional production or undergoing low-carbon upgrades. At this stage, small- and medium-sized enterprises exhibit similar conditions to those of large enterprises, experiencing benefits ( β V 2 + g ( x ) + E 2 δ C 2 > t 2 T 2 + O 2 R ( x ) ). Simultaneously, the government incentivizes all enterprises, and the cost is lower than that when dealing with the external implicit losses generated by high carbon emissions, such as ecological management fees, public social health costs, and climate adjustment measures, F > ( E 1 + g ( x ) + R ( x ) ) ( E 2 + g ( x ) + R ( x ) ) . Therefore, during this stage, the point P 8 ( 1 , 1 , 1 ) is considered the optimal equilibrium point.
The fourth phase is the strengthening phase. At this stage, due to the imposition of higher CBAM carbon taxes, maintaining traditional production incurs significant costs ( t 1 + O 1 T 1 for large enterprises; t 2 T 2 + O 2 for small–medium enterprises). Simultaneously, both enterprises benefit from synergistic emission reduction effects, resulting in reduced costs for low-carbon upgrades and higher benefits ( α V 1 δ C 1 for large enterprises; β V 2 δ C 2 for small–medium enterprises). Consequently, the development strategy of both enterprises no longer relies on fiscal subsidies or incentive mechanisms from the government, resulting in a scenario characterized by α V 1 δ C 1 > t 1 + O 1 T 1 , β V 2 δ C 2 > t 2 T 2 + O 2 . Government-side implicit losses and political gains will be lower than fiscal expenditures, leading to the cessation of incentive measures and punitive interventions in the market. This inequality is satisfied, F < ( E 1 + g ( x ) + R ( x ) ) ( E 2 + g ( x ) + R ( x ) ) , and the government is more inclined toward a passive management strategy. During this stage, point P 6 ( 1 , 1 , 0 ) becomes the optimal equilibrium point.

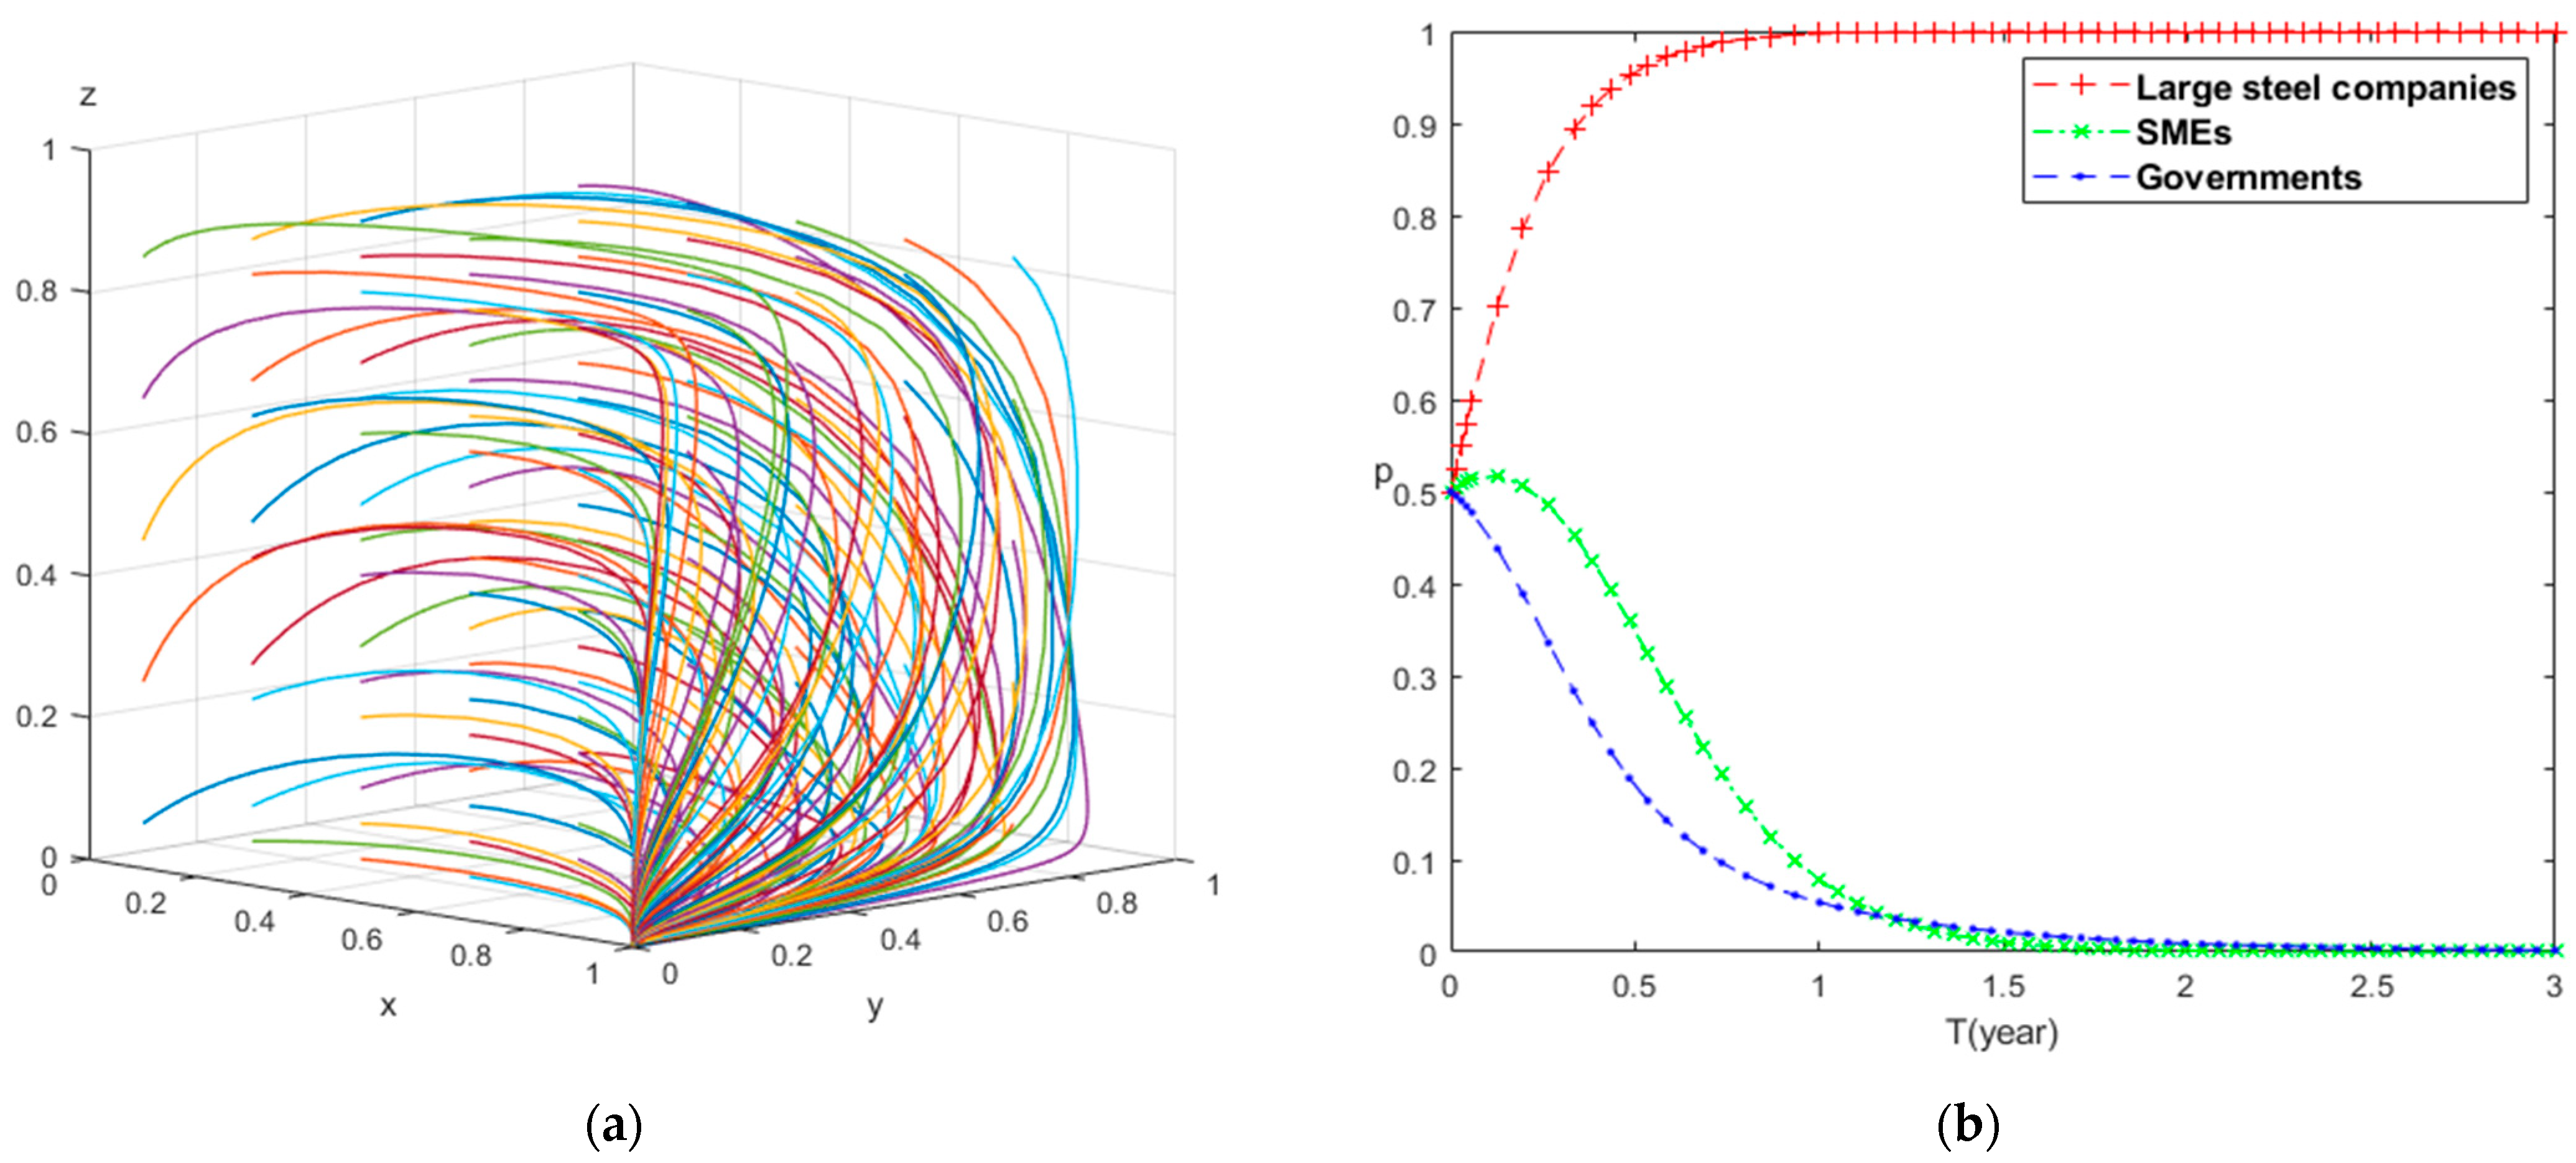
5. Evolutionary Numerical Modeling Simulation

To visualize the dynamic evolution of various stakeholders’ behaviors in the context of the CBAM, determining how the system stabilizes under different conditions, this section employs MATLAB2019a for numerical analysis. MATLAB2019a can represent graphics as different vectors and matrices, facilitating the 2D and 3D visualization of expression graphics. Therefore, through data simulation, a more intuitive quantitative analysis of the iteration and interaction of the gaming stakeholders can be conducted, displaying the tripartite evolutionary gaming process and the ultimate stable state of the entire system. This section will describe the parameter settings involved in numerical simulation in Section 5.1. In Section 5.2, the simulation of the evolutionary paths of stakeholders during the window phase, transition phase, implementation phase, and reinforcement phase of the CBAM will be presented. In Section 5.3, the sensitivity of different parameter variations during the implementation phase will be examined.

5.1. Parameter Sources and Settings

This study is based on two steel plants in southern China and eastern China as examples. The southern steel plant utilizes amine-based technology to capture carbon emissions from the blast furnace. Amine-based technology is one of the most popular carbon capture technologies worldwide and is a cost-effective method. The annual emissions from this plant are approximately 15.5 million tons. The application of this technology allows the steel plant to capture about 500,000 tCO2/year per year, incurring additional fixed operating costs of RMB 12 million per year. The eastern steel plant, during its low-carbon upgrades, actively adopts various low-carbon technologies such as sintering waste heat recovery and power generation, converter flue gas waste heat recovery, blast furnace TRT (top gas recovery turbine) power generation equipment, and the application of renewable energy for multi-energy complementation. The annual emissions from this plant are around 13 million tCO2/year. The annual investment cost for individual low-carbon technologies ranges from RMB 10 to 18 million. The application of the multi-energy complementation technology using renewable energy alone can reduce carbon dioxide emissions by approximately 20,000 tons per year.
According to the actual project data and references from additional literature, the initial parameters for setting up the game model are determined to simultaneously satisfy the two principles of realism, as proposed by Chen [55] and Jiang [56]. In the case of Lingang Corporation obtaining government financial subsidies, the government’s maximum subsidy, g, is based on actual cases and does not exceed 50% of the investment cost. The government’s penalties for emissions from high-carbon enterprises are referenced from the research data of Zhou et al. [32] and Lin et al. [57]. The coefficients of low-carbon input and output for both enterprise entities, denoted as α and β, are referenced from the initial values in the study by Chu et al. [58]. The basic profits, Vi (i = 1, 2), and low-carbon investment costs, Ci (i = 1, 2), associated with maintaining the original production mode for both enterprises are set based on the research by Mörsdorf et al. [59]. The free quota ratio for the EU, denoted as b, is referenced from the relevant rules of the European Parliament’s CBAM for the sake of simulation analysis, and it is proportionally reduced. Considering real-time data from the European Union Emissions Trading System (ETS) and future predictions of EU carbon prices, where the EU carbon trading price has exceeded EUR 99 per ton and is expected to continue rising, the initial value of the EU carbon price (EP) is set to 1. Research on trading price information in the Chinese carbon market indicates that the recent trading prices range from RMB 65 to 74/ton. To simplify the analysis and incorporate currency unit exchange rates, the initial value of the Chinese carbon price (CP) is set to 0.083. The values for the government’s proactive response to the CBAM political gains (Vg) and high-carbon implicit losses (F) are abstract and determined through consultation with government experts and literature research [33,60]. The government’s tax refund subsidies for enterprises, Ei (i = 1, 2), are set based on the research data from Wang [61] and Chang et al. [62]. Combining the actual situation and relevant literature research, four sets of parameter values for different stages are summarized, with specific parameters shown in Table 4.

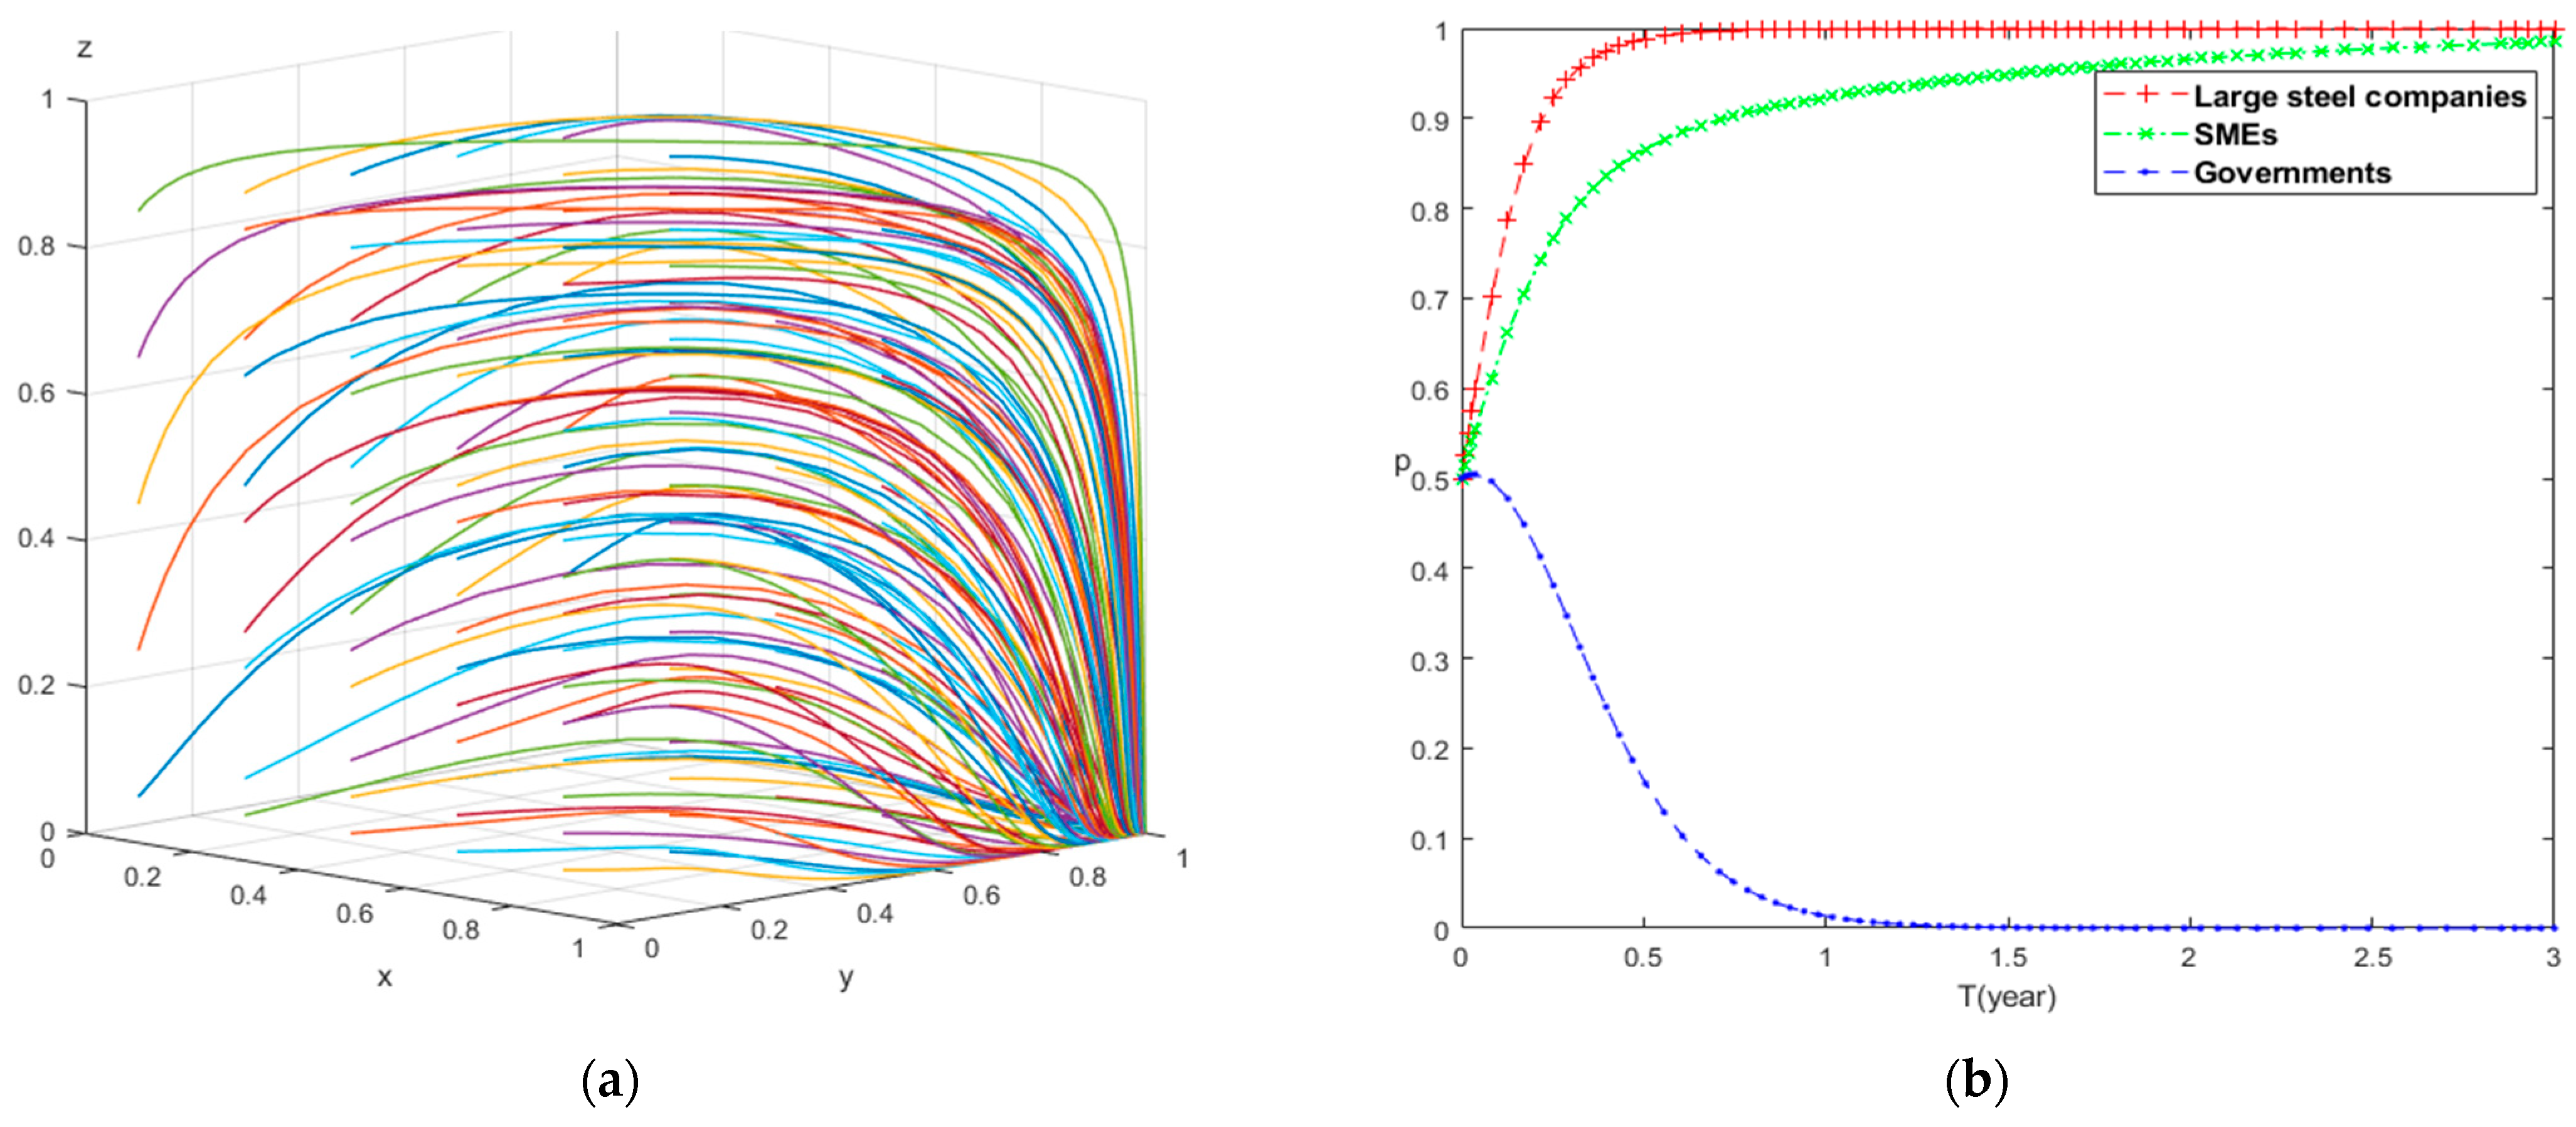
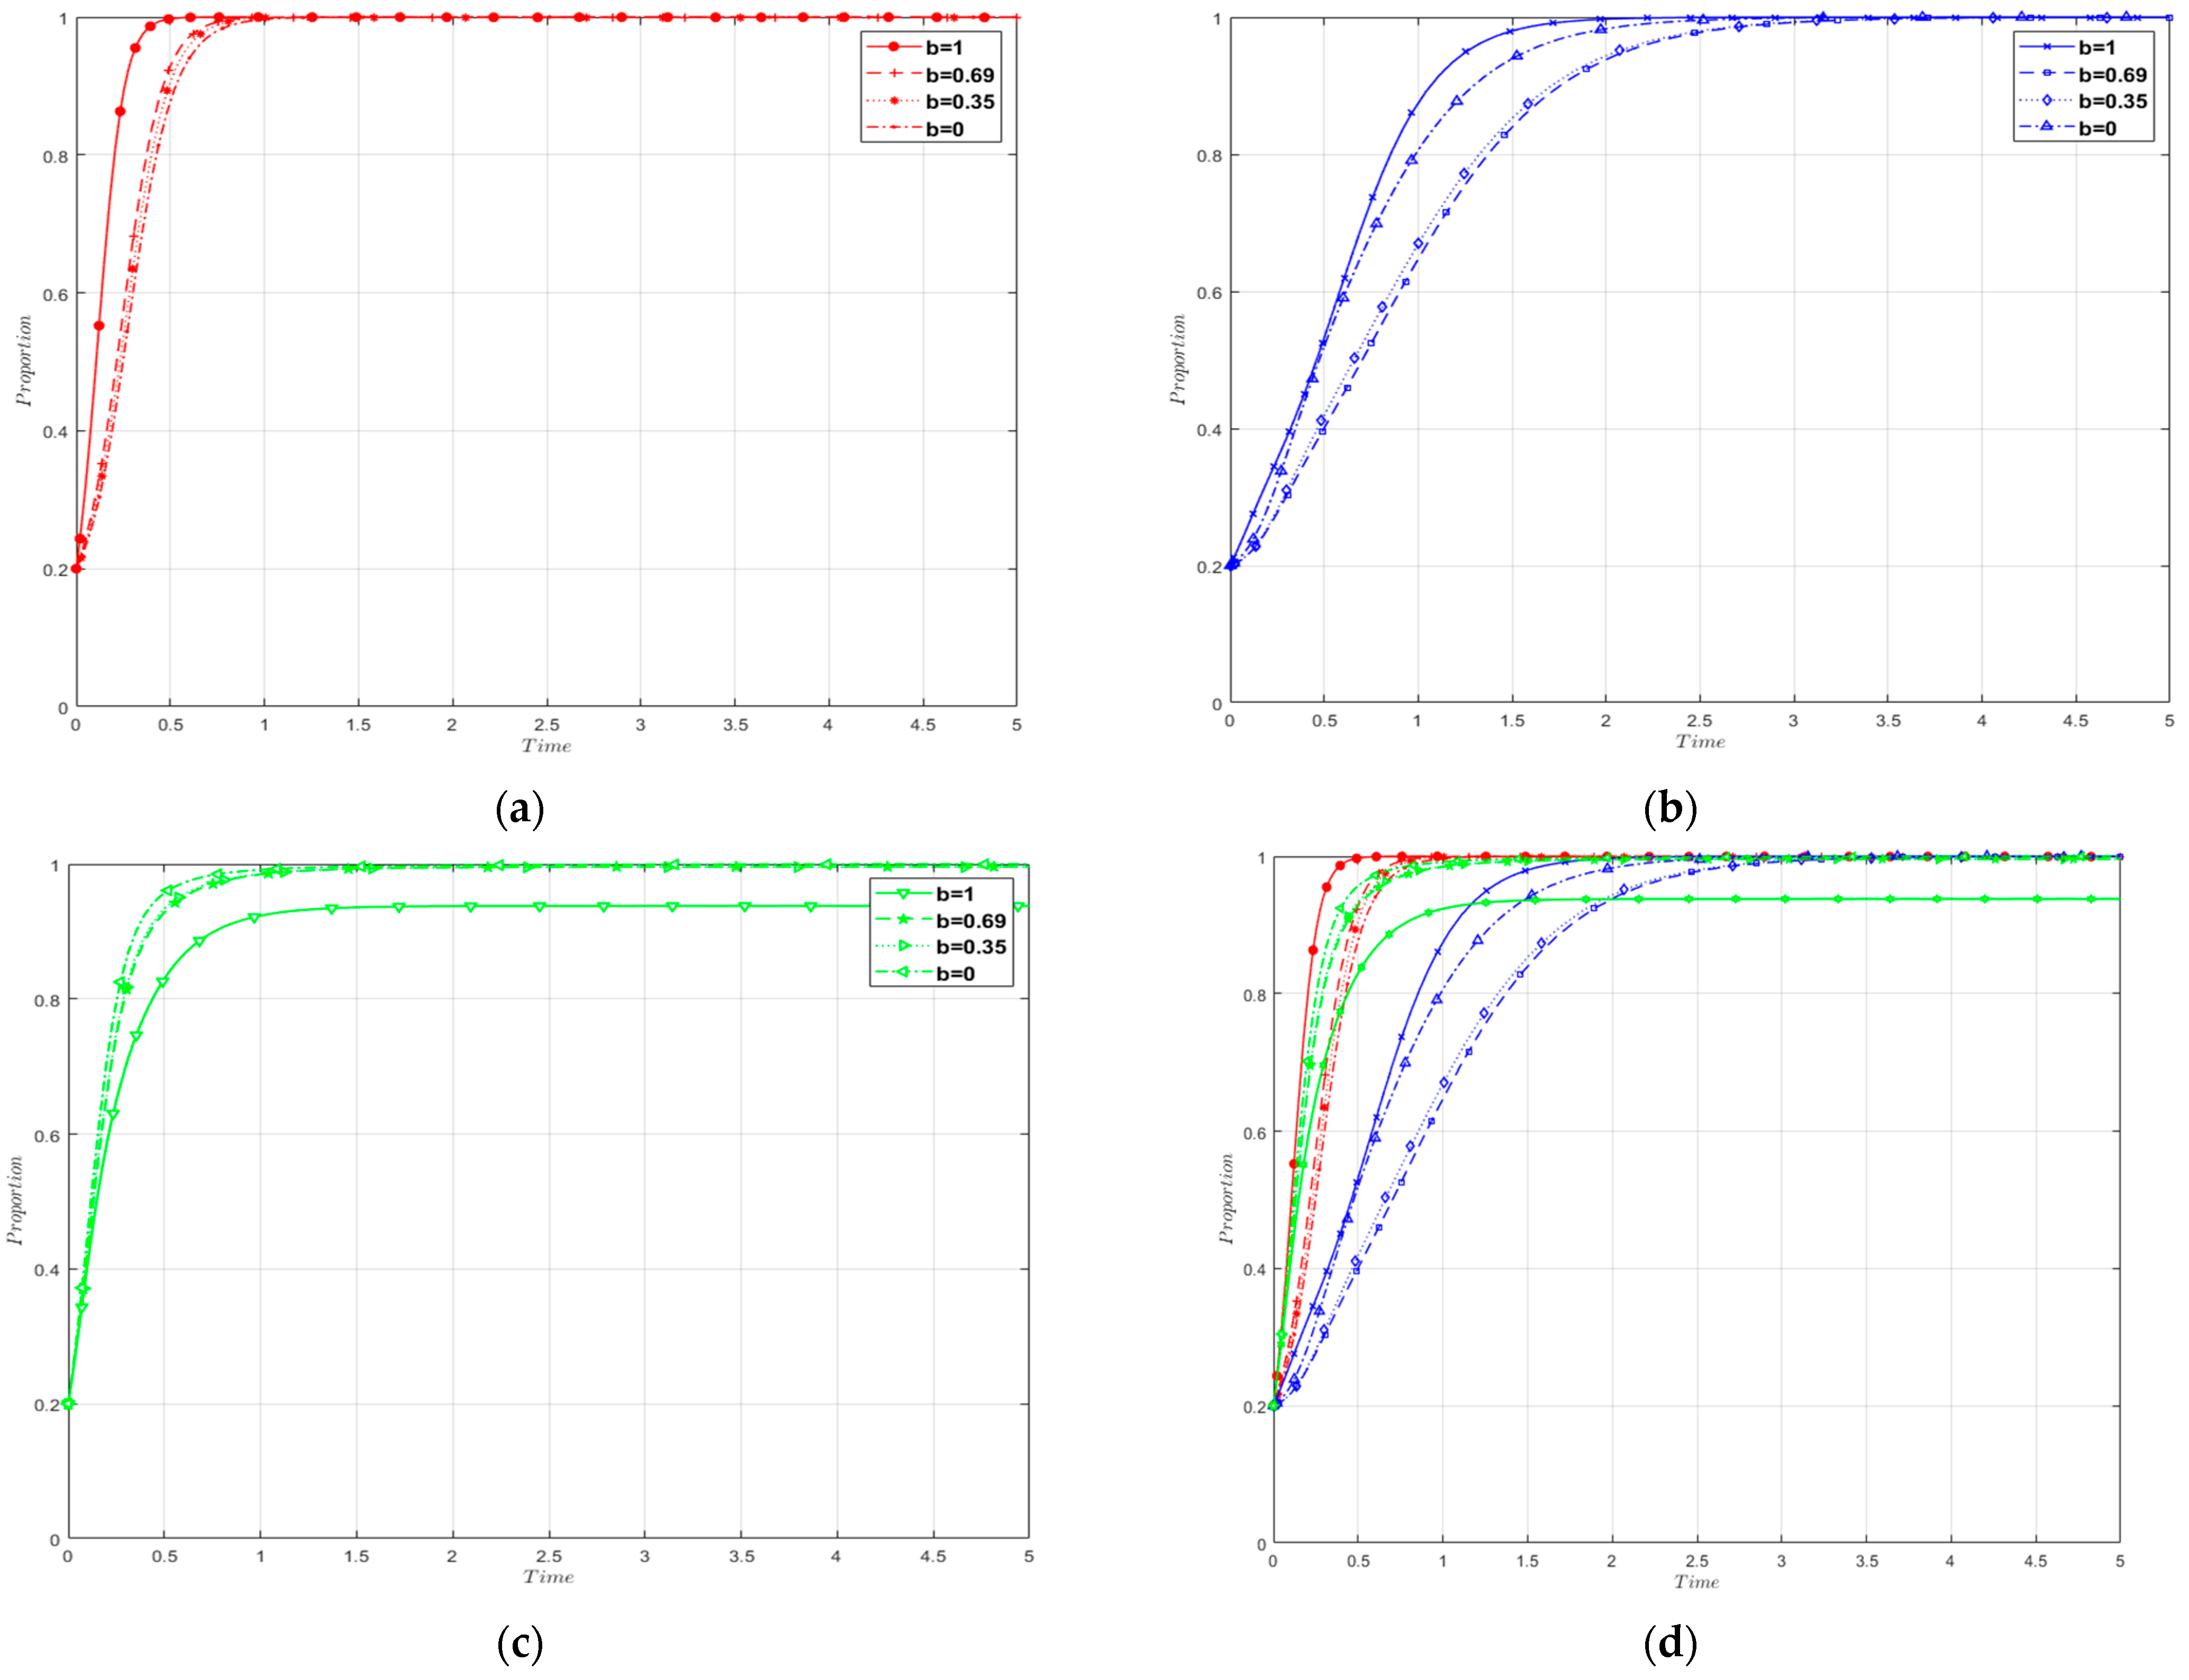
5.2. Results of Evolutionary Paths at Different Stages

(1)
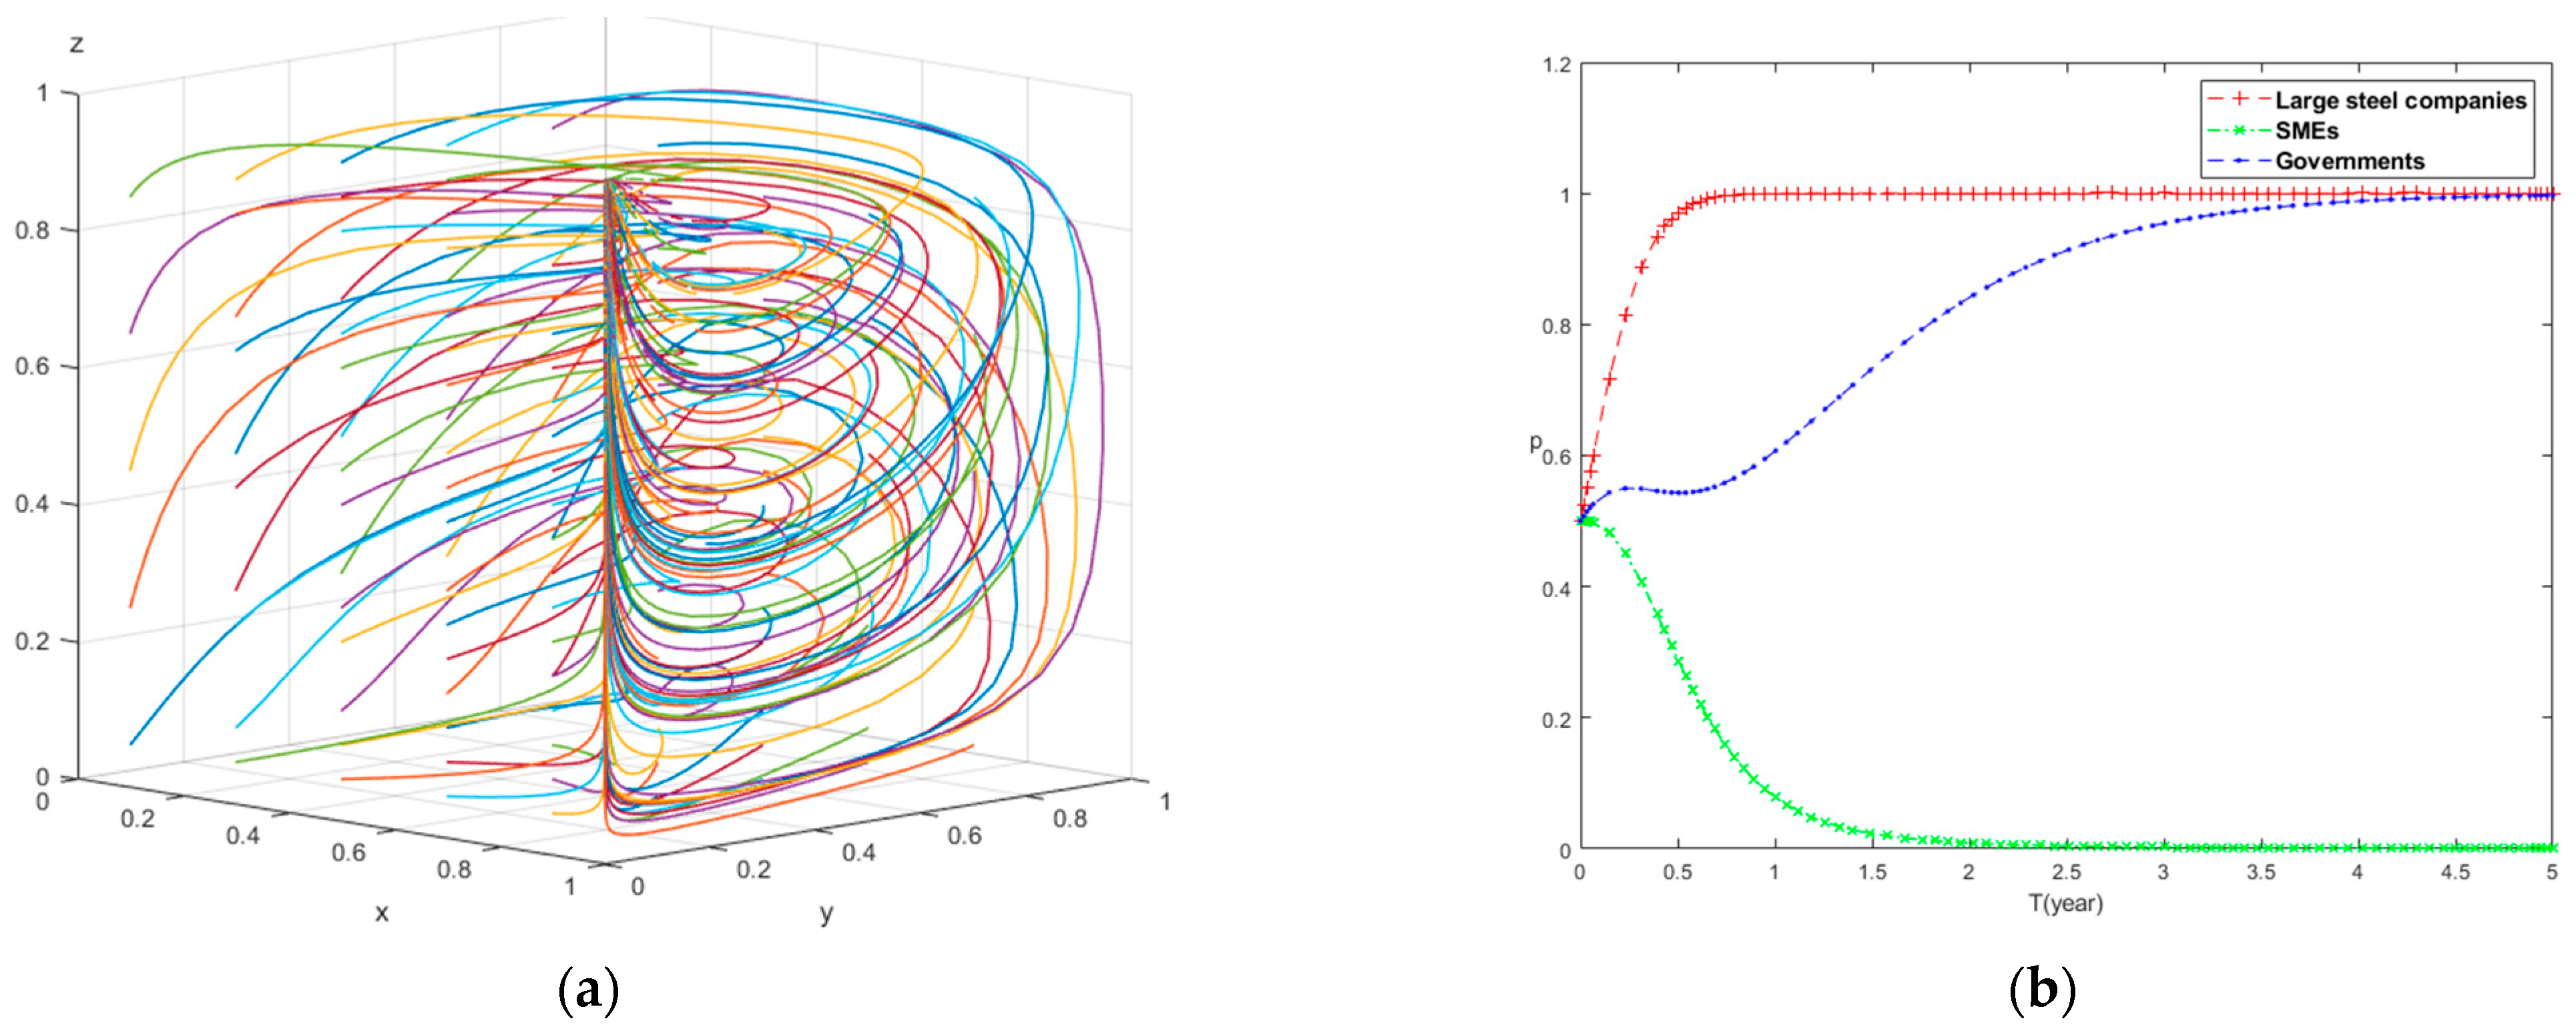
The evolutionary paths of stakeholders during the CBAM window stage are as follows:
Based on the simulated parameters during the window stage, Figure 4a shows the evolutionary trajectories of the three players over 80 iterations, while Figure 4b presents the evolution trends of the relevant stakeholders with different colored lines. From the graph, it can be observed that different initial strategies eventually converge to the point, indicating the the ESS for the large steel enterprise, small- and medium-sized steel enterprise, and government is adopting low-carbon upgrade, maintaining traditional production, and passive management. This effectively validates the theoretical analysis in Section 4.2. This indicates that during the window period before the CBAM is launched, factors such as export volume, free-riding benefits, and the cost of low-carbon upgrades inhibit the choice of a low-carbon upgrade strategy by small- and medium-sized enterprises. The lack of clarity in government policies and the insufficient awareness of the implicit losses caused by high-carbon enterprises lead to an inclination among enterprises to adopt a passive wait-and-see approach. Large enterprises, being the first to be impacted by the CBAM due to their export business, tend to choose low-carbon upgrades.
(2)
Evolutionary Paths of Stakeholders in the CBAM Transition Stage
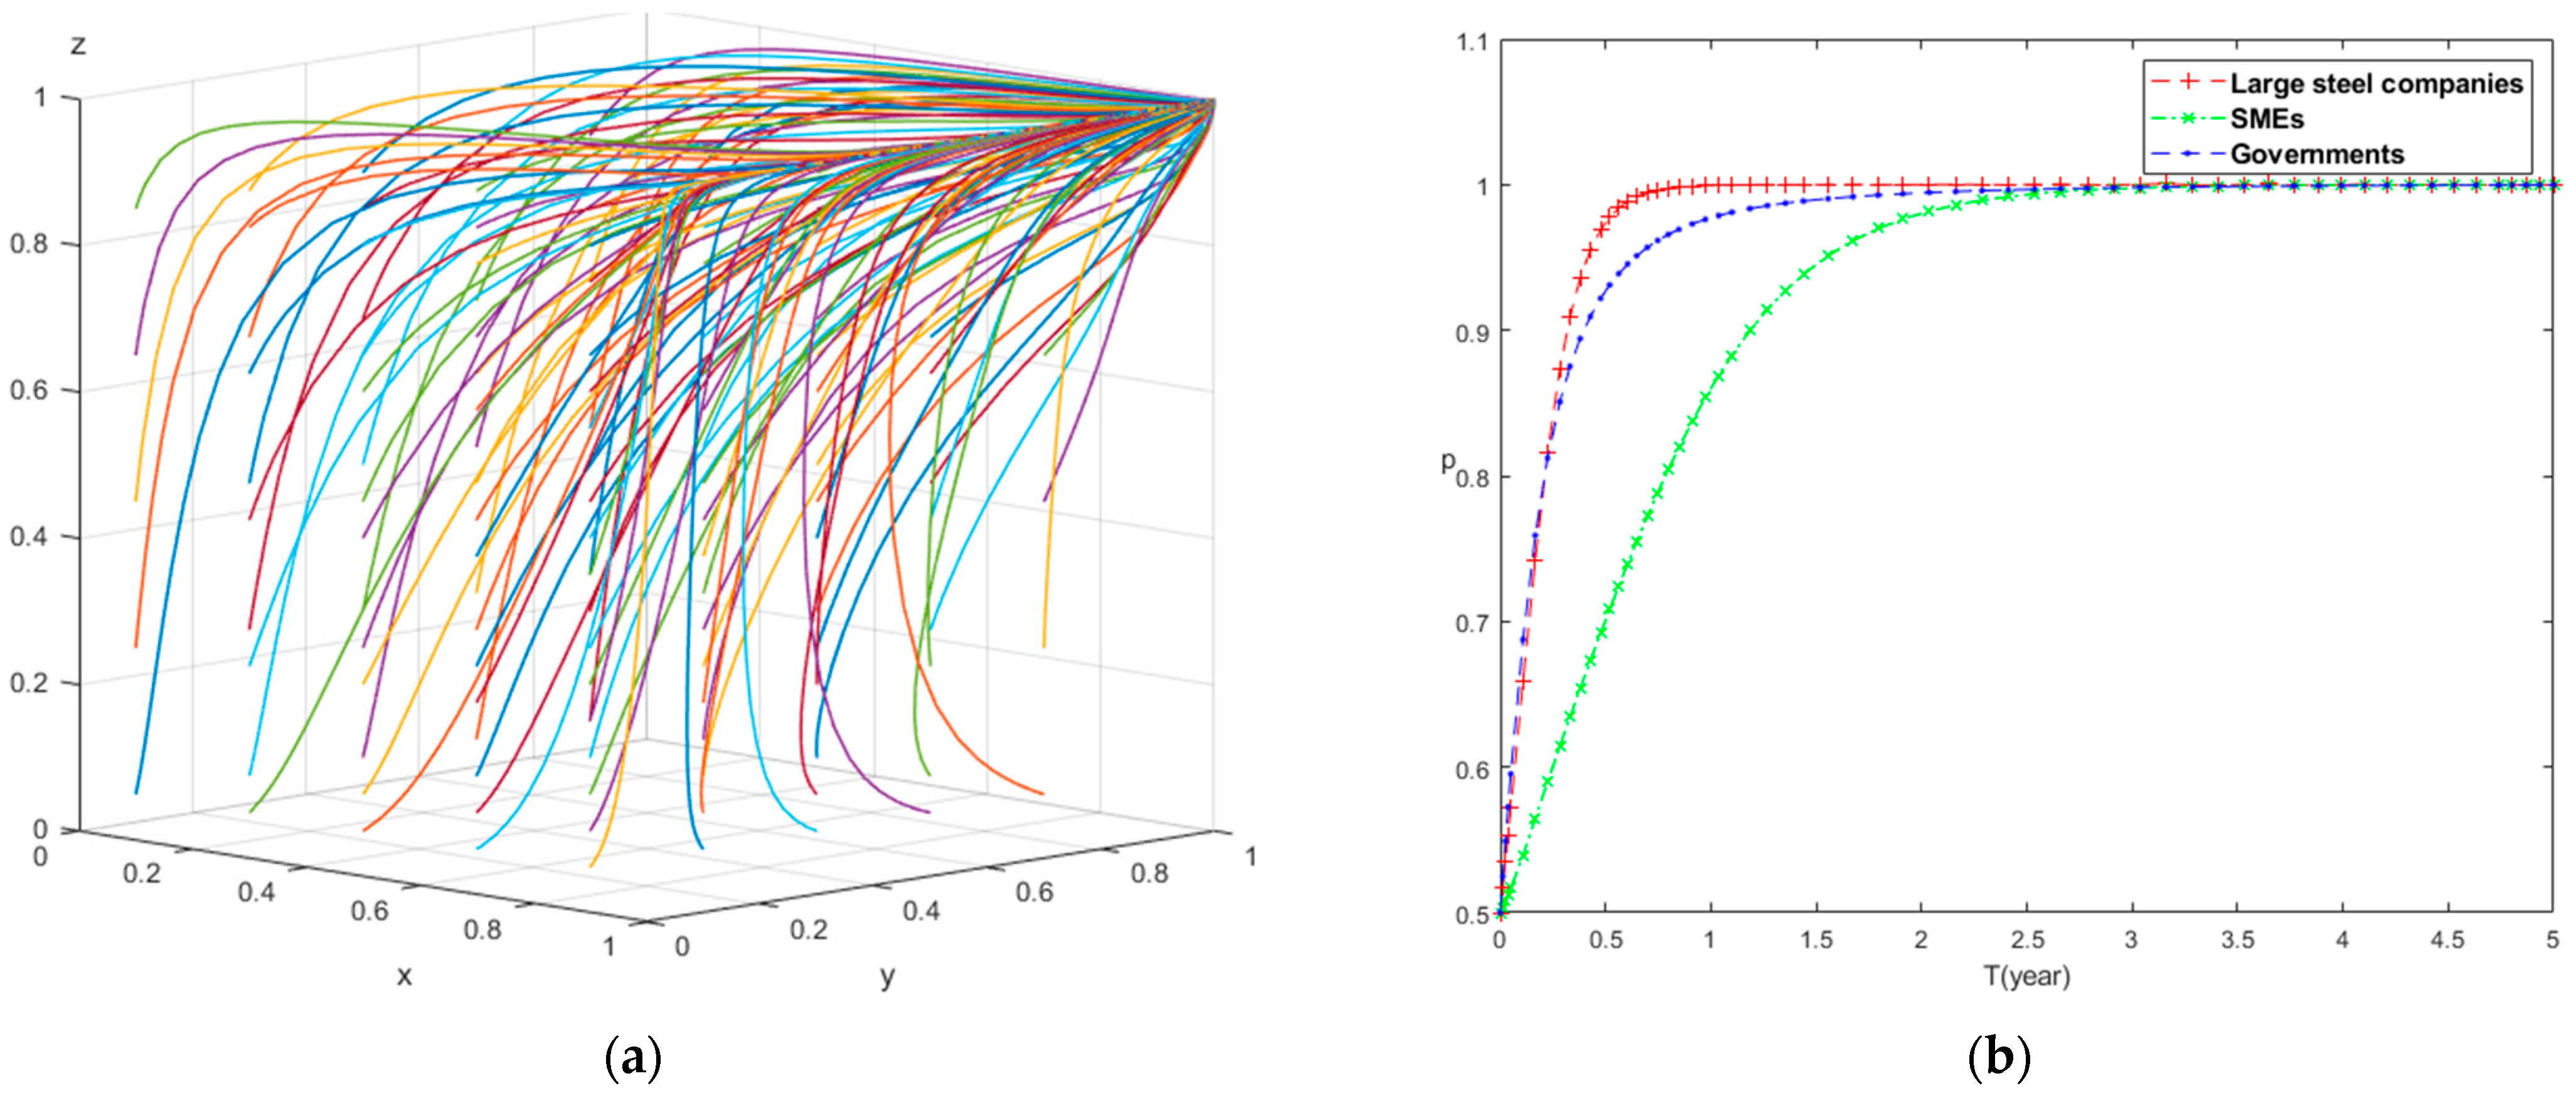
In the transition phase, through simulation and gaming, the trajectory chart after 80 iterations is obtained, as shown in Figure 5a; the evolutionary trend is depicted in Figure 5b. In this phase, based on the window stage, government policies ultimately converge to 1, stabilizing the evolutionary system with the strategy P 4 ( 1 , 0 , 1 ) . During the transition phase, the government initiates active responses to CBAM, exerting its guiding role by promoting low-carbon development through fiscal subsidies and a dynamic emission reward and penalty mechanism. This proactive environmental strategy enhances the government’s international image, leading to certain political gains.
(3)
Stakeholder Evolutionary Paths in the CBAM Implementation Phase
According to the implementation phase shown in Table 4, each parameter corresponds to instances and stable conditions, including α V 1 t 1 + T 1 δ C 1 O 1 + g ( x ) + R ( x ) + E 1 > 0 , β V 1 t 1 + T 1 δ C 1 O 1 + g ( x ) + R ( x ) + E 1 > 0 and F ( E 1 + g ( x ) + R ( x ) ) ( E 2 + g ( x ) + R ( x ) ) > 0 . By generating evolution paths over time for different initial strategies using MATLAB2019a, as shown in Figure 6a, it can be observed that after multiple iterations, the path ultimately converges to (1, 1, 1), indicating that the ESS for the implementation phase is P 8 ( 1 , 1 , 1 ) . This phase signifies that, with the formal implementation of the CBAM, businesses, influenced by carbon taxes and government regulations, opt for low-carbon upgrading strategies. Simultaneously, the government plays a regulatory and incentivizing role in the implementation phase, mitigating the impact of the CBAM and benefiting from it, hence choosing an active response strategy.
(4)
Stakeholder Evolutionary Paths in the CBAM Enhancement Phase
In the CBAM strengthening stage, the numerical simulation reveals that the system converges to P 6 ( 1 , 1 , 0 ) , indicating the presence of a unique evolutionarily stable strategy (ESS). The evolution path and trajectory of the system are depicted in Figure 7a,b. During this stage, as CBAM implementation progressively intensifies, the enterprises experience an increasing impact from the CBAM. The incentives associated with maintaining traditional production and benefiting from free-riding gradually become inadequate in comparison with the substantial carbon taxes. Consequently, steel enterprises universally opt for low-carbon upgrades. With the escalating prioritization of low-carbon strategies by enterprises and the refinement of the CBAM regulations, the government gradually disengages from proactive management, diminishes its intervention in the market, and fosters an environment conducive to independent development by enterprises, thus converging toward a passive management strategy.

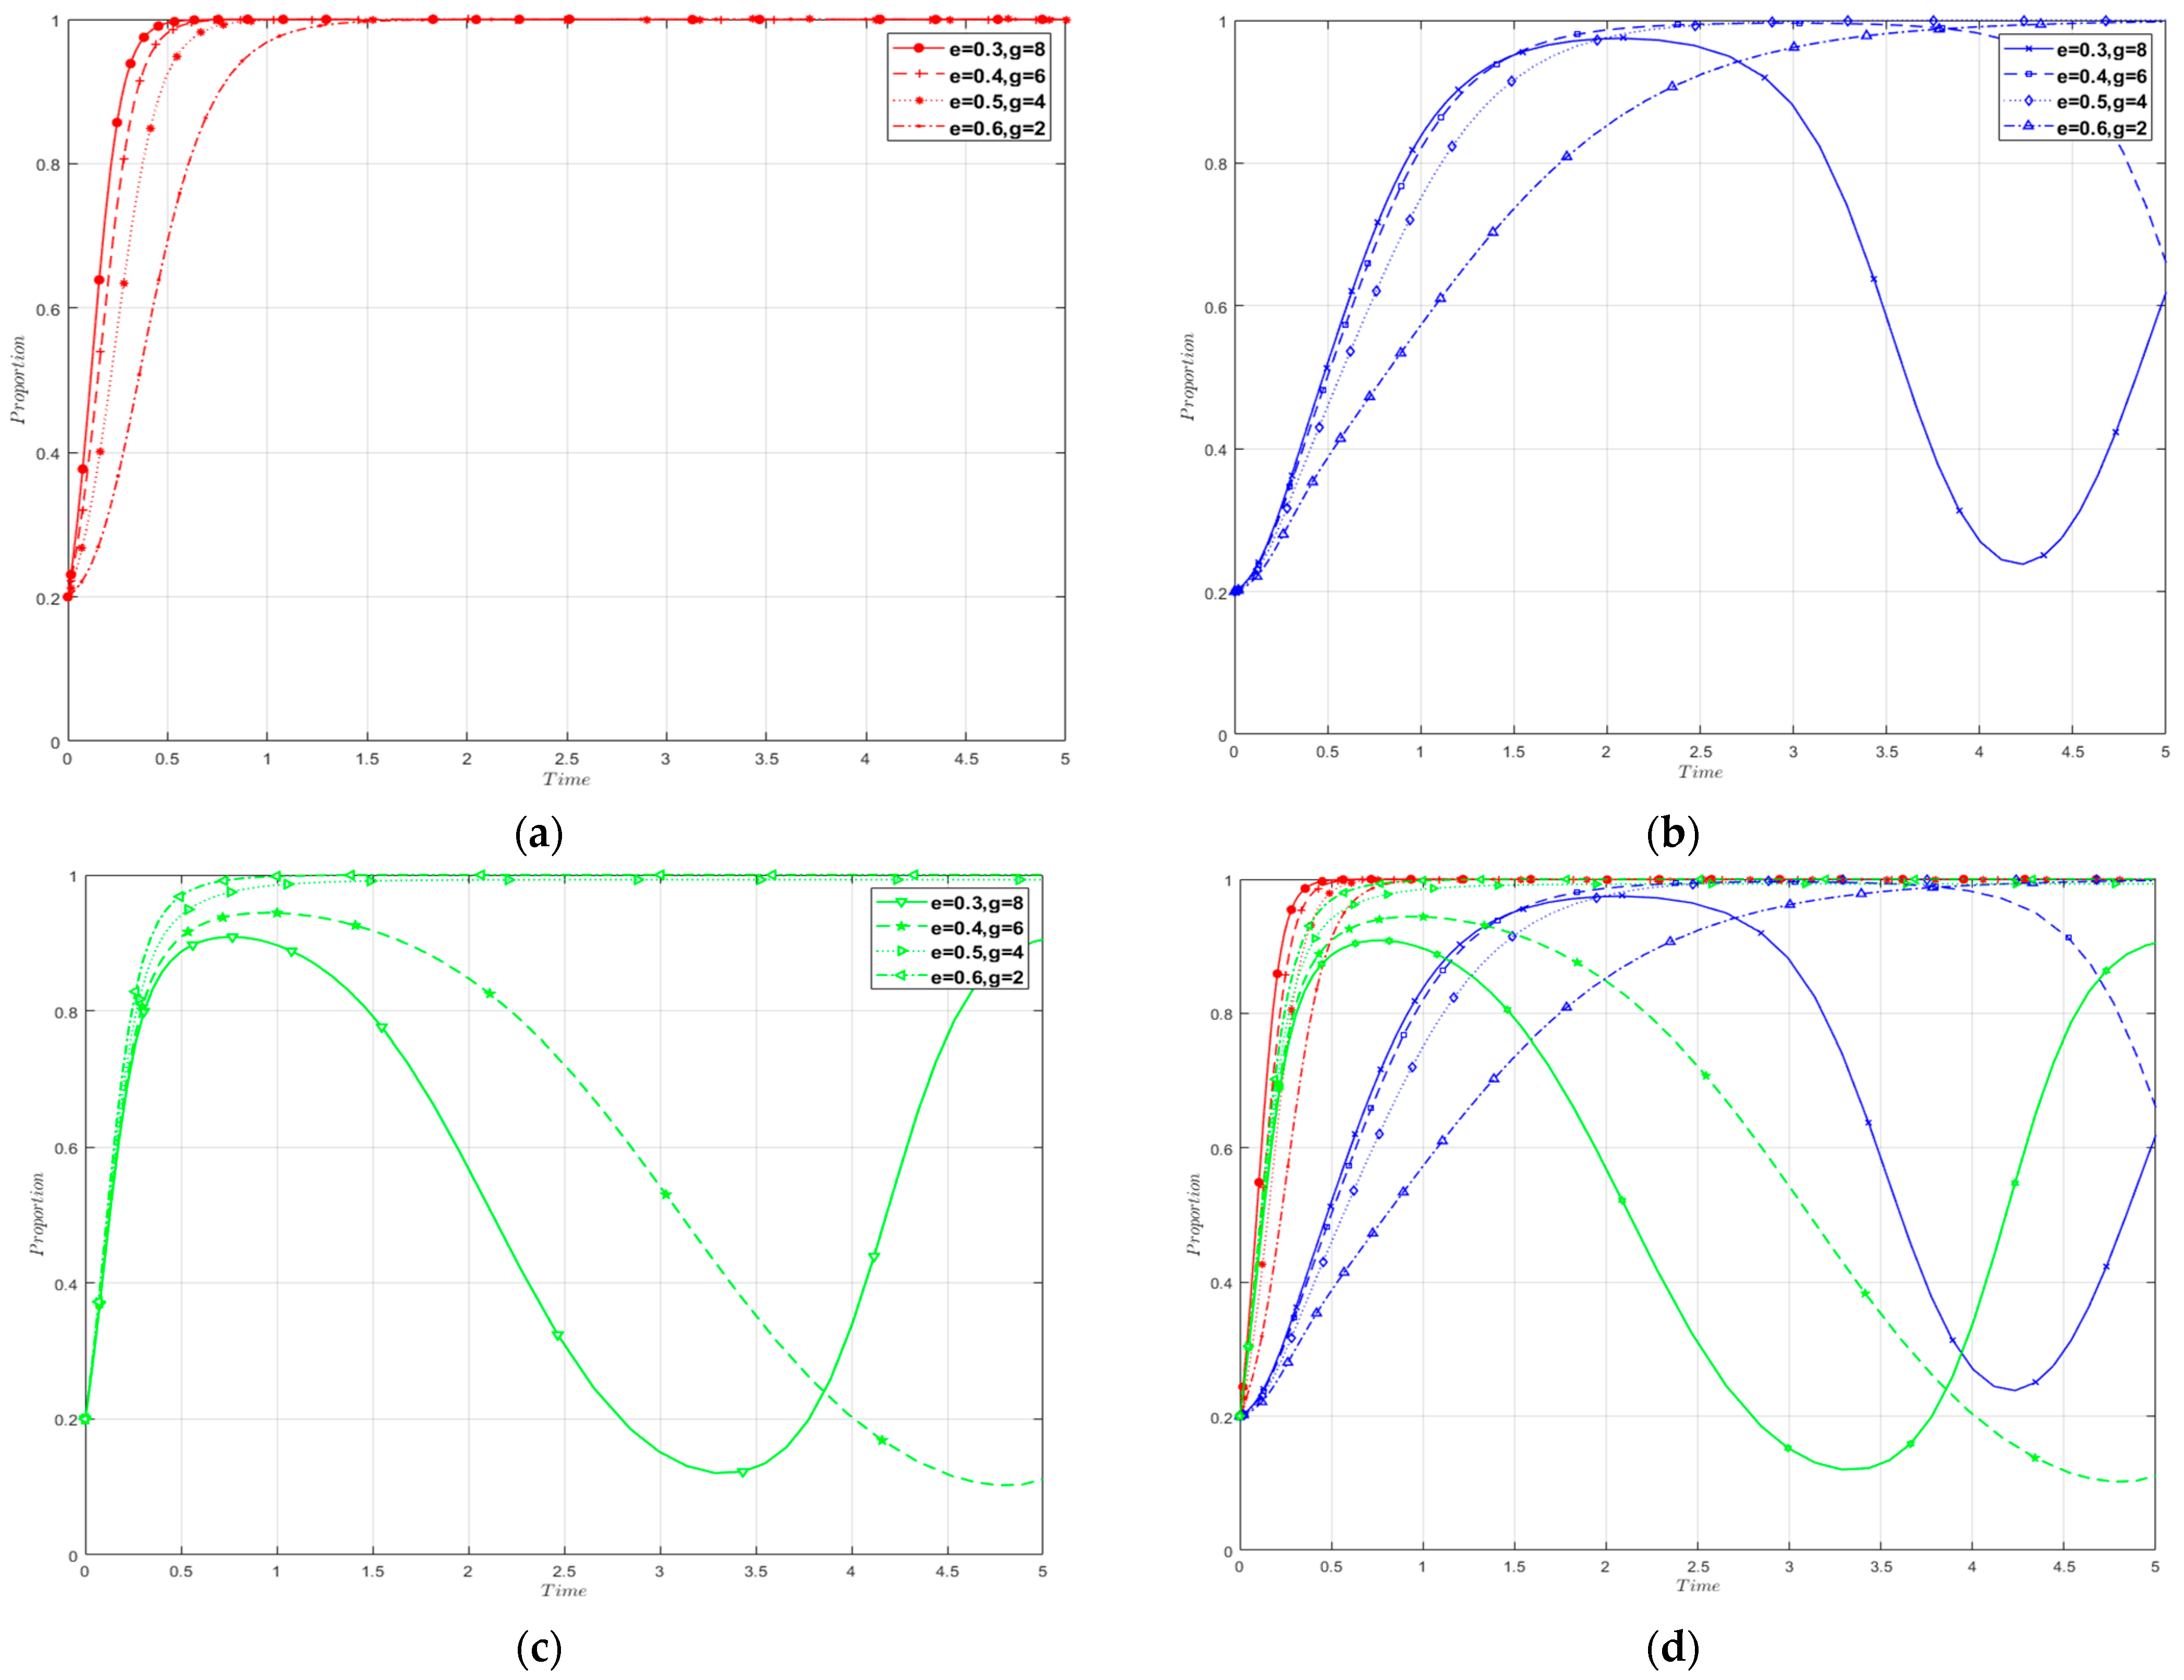
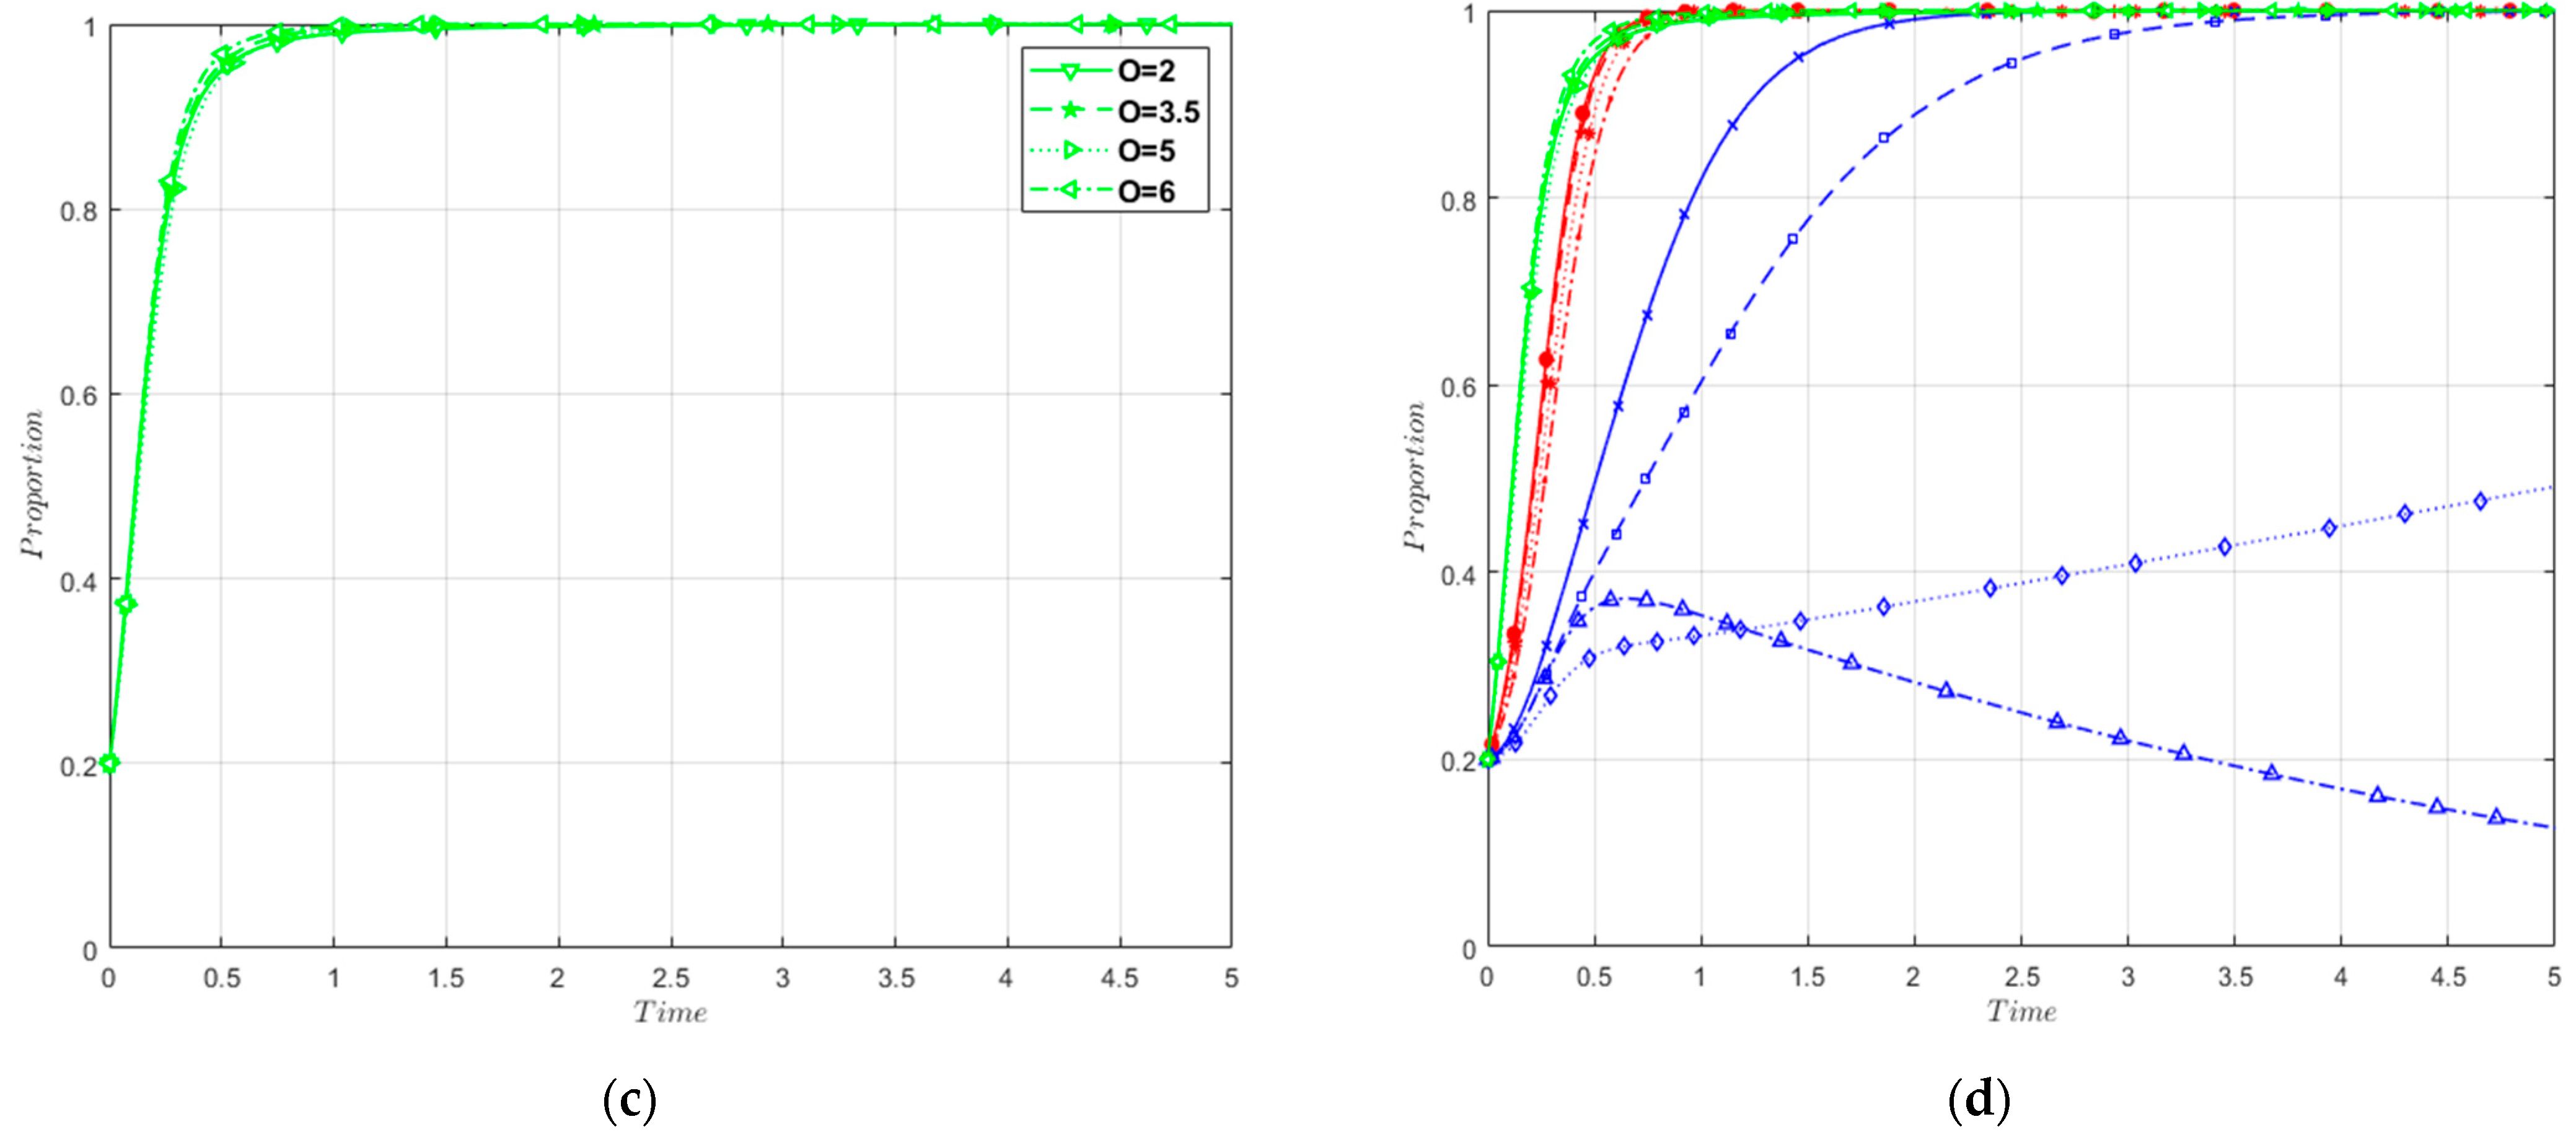
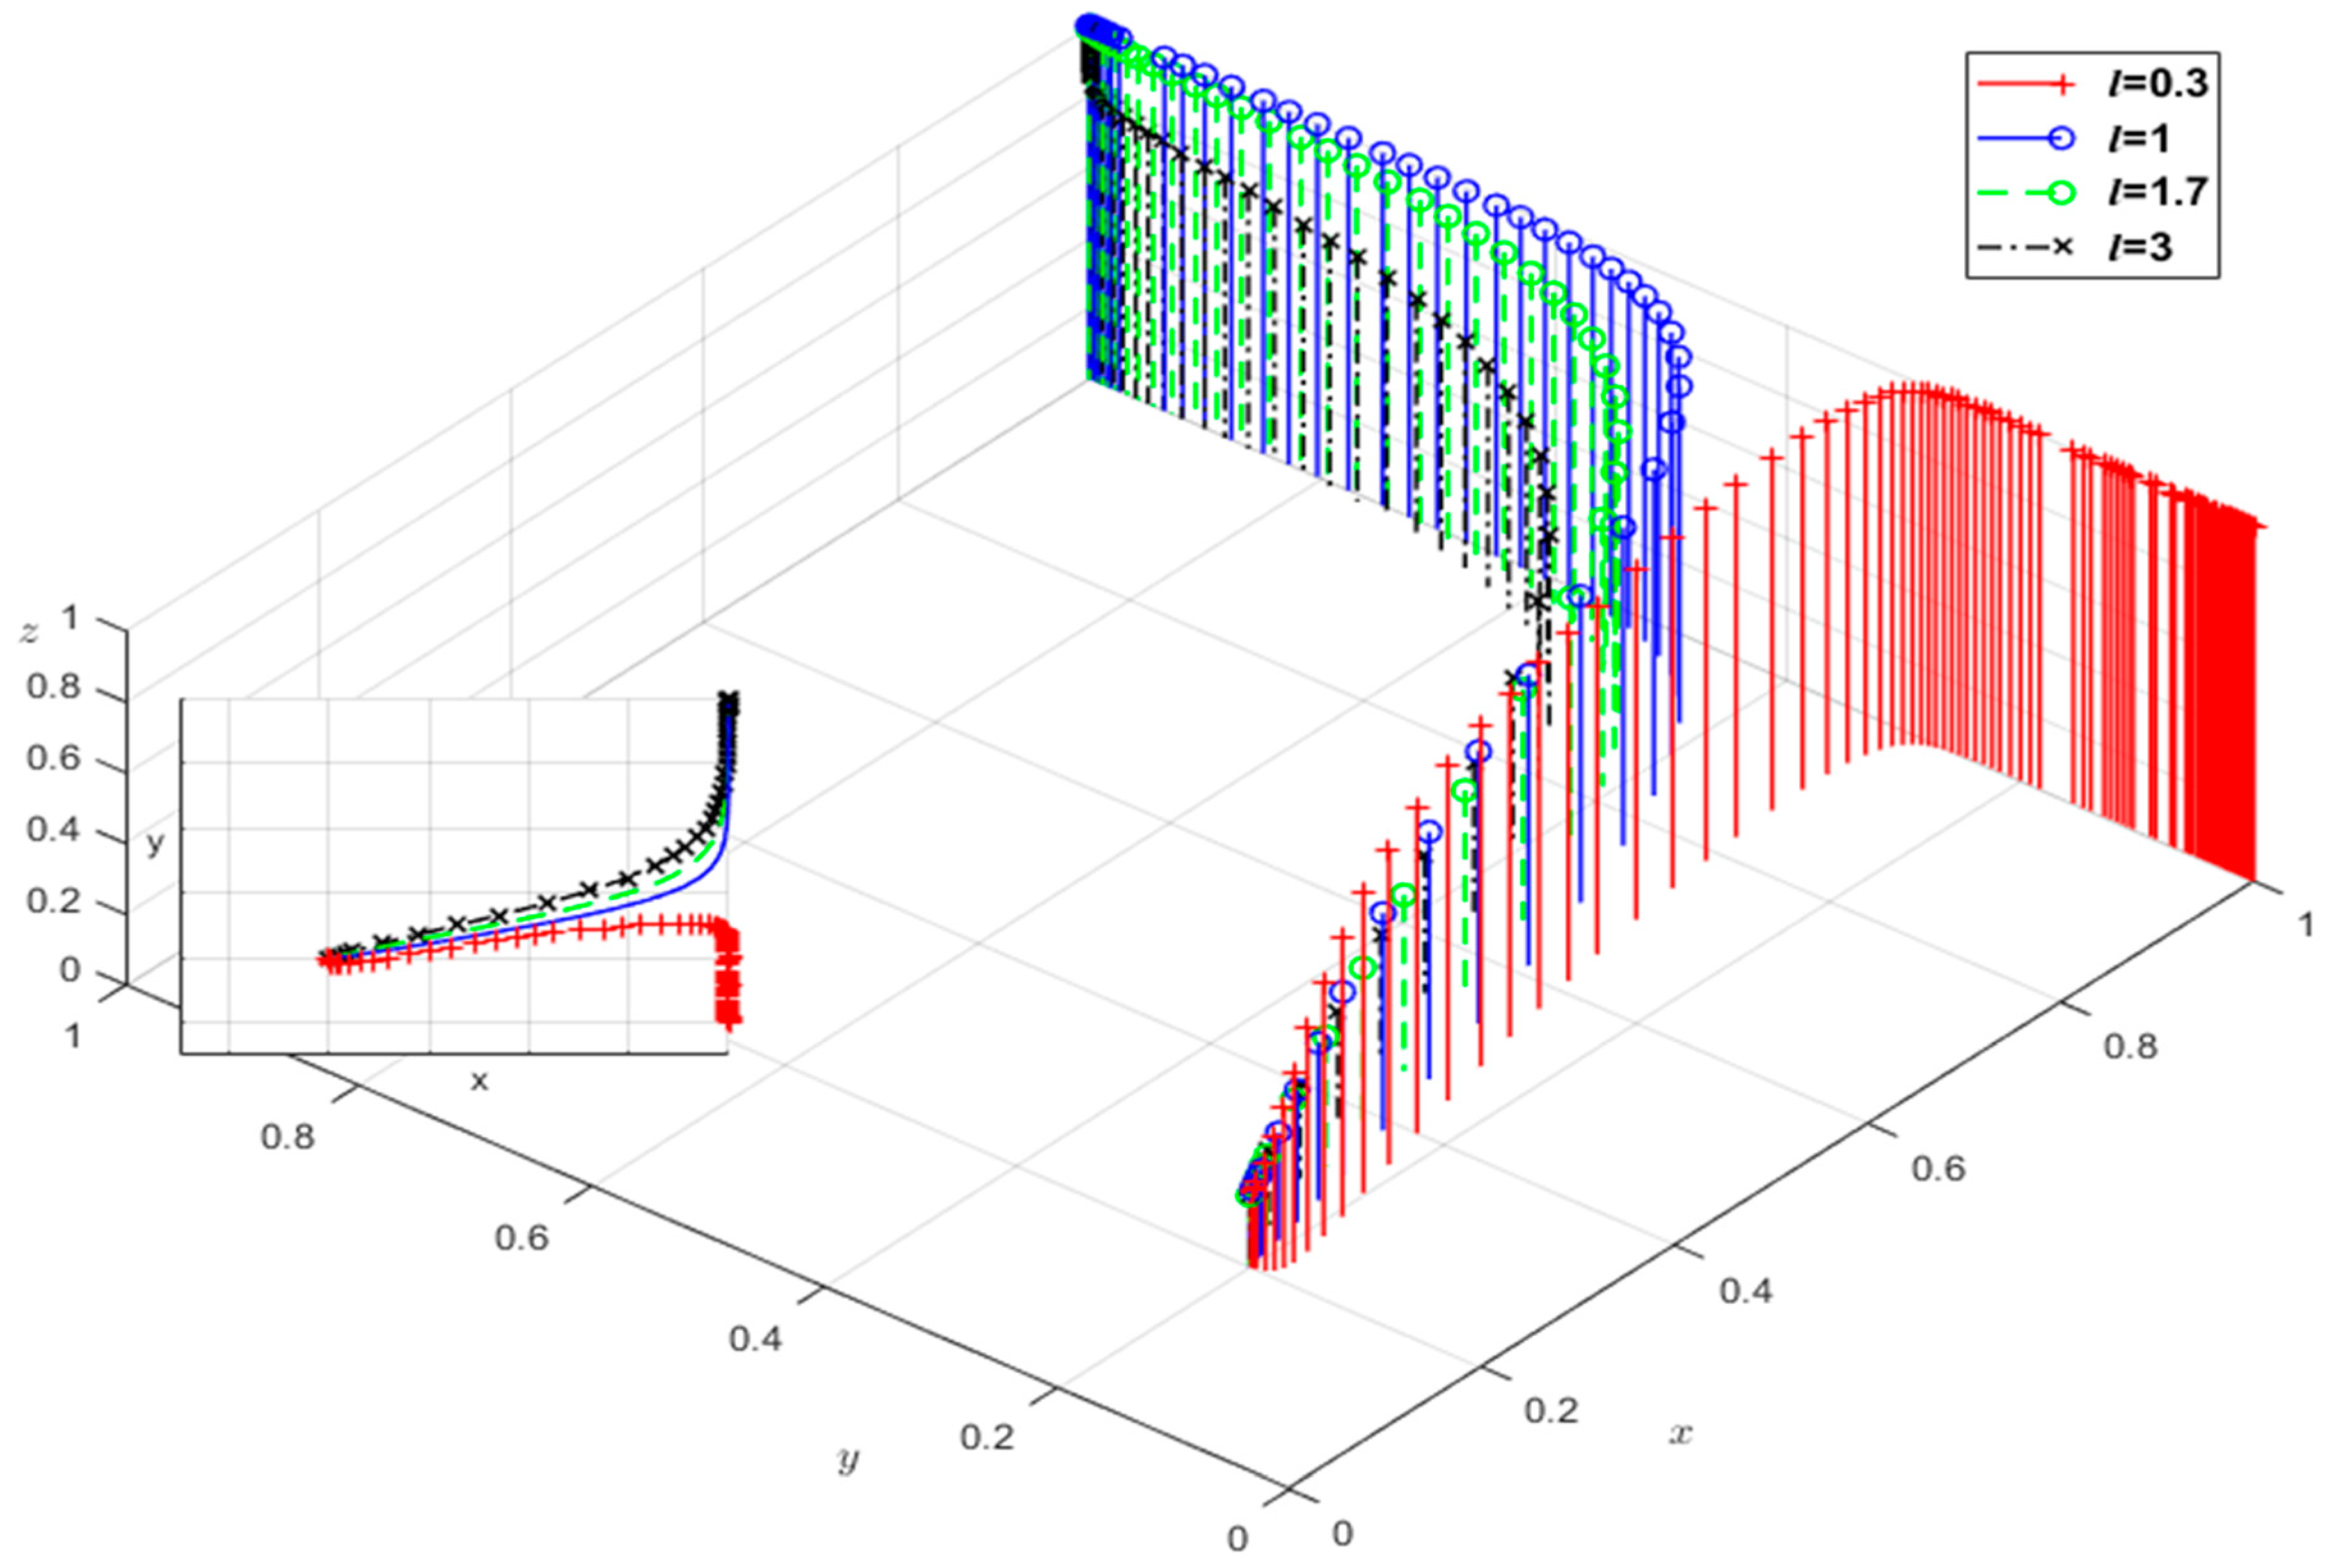
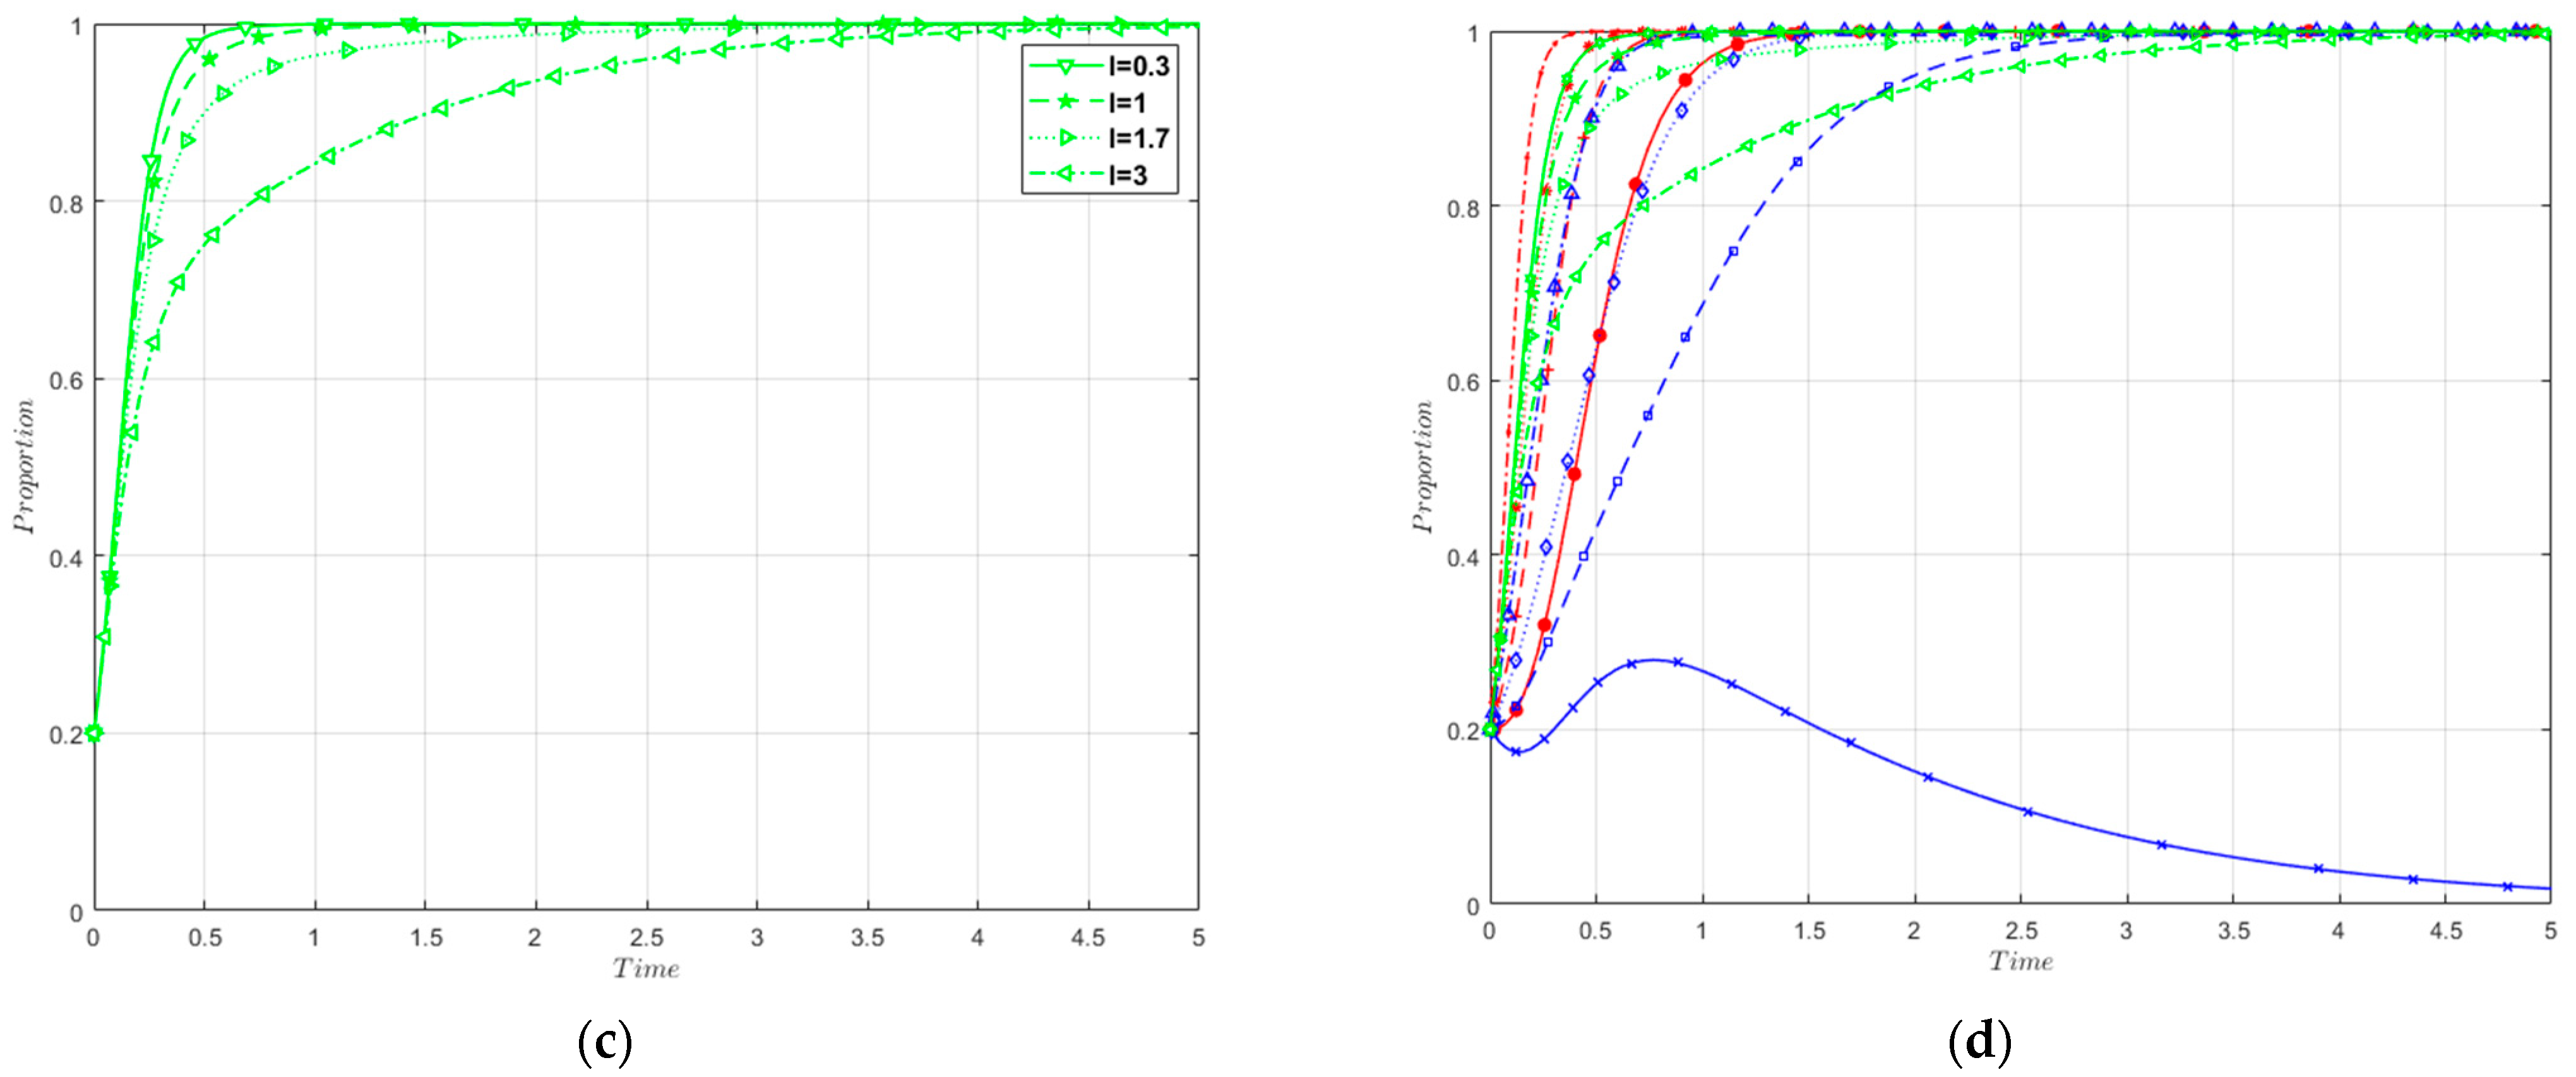
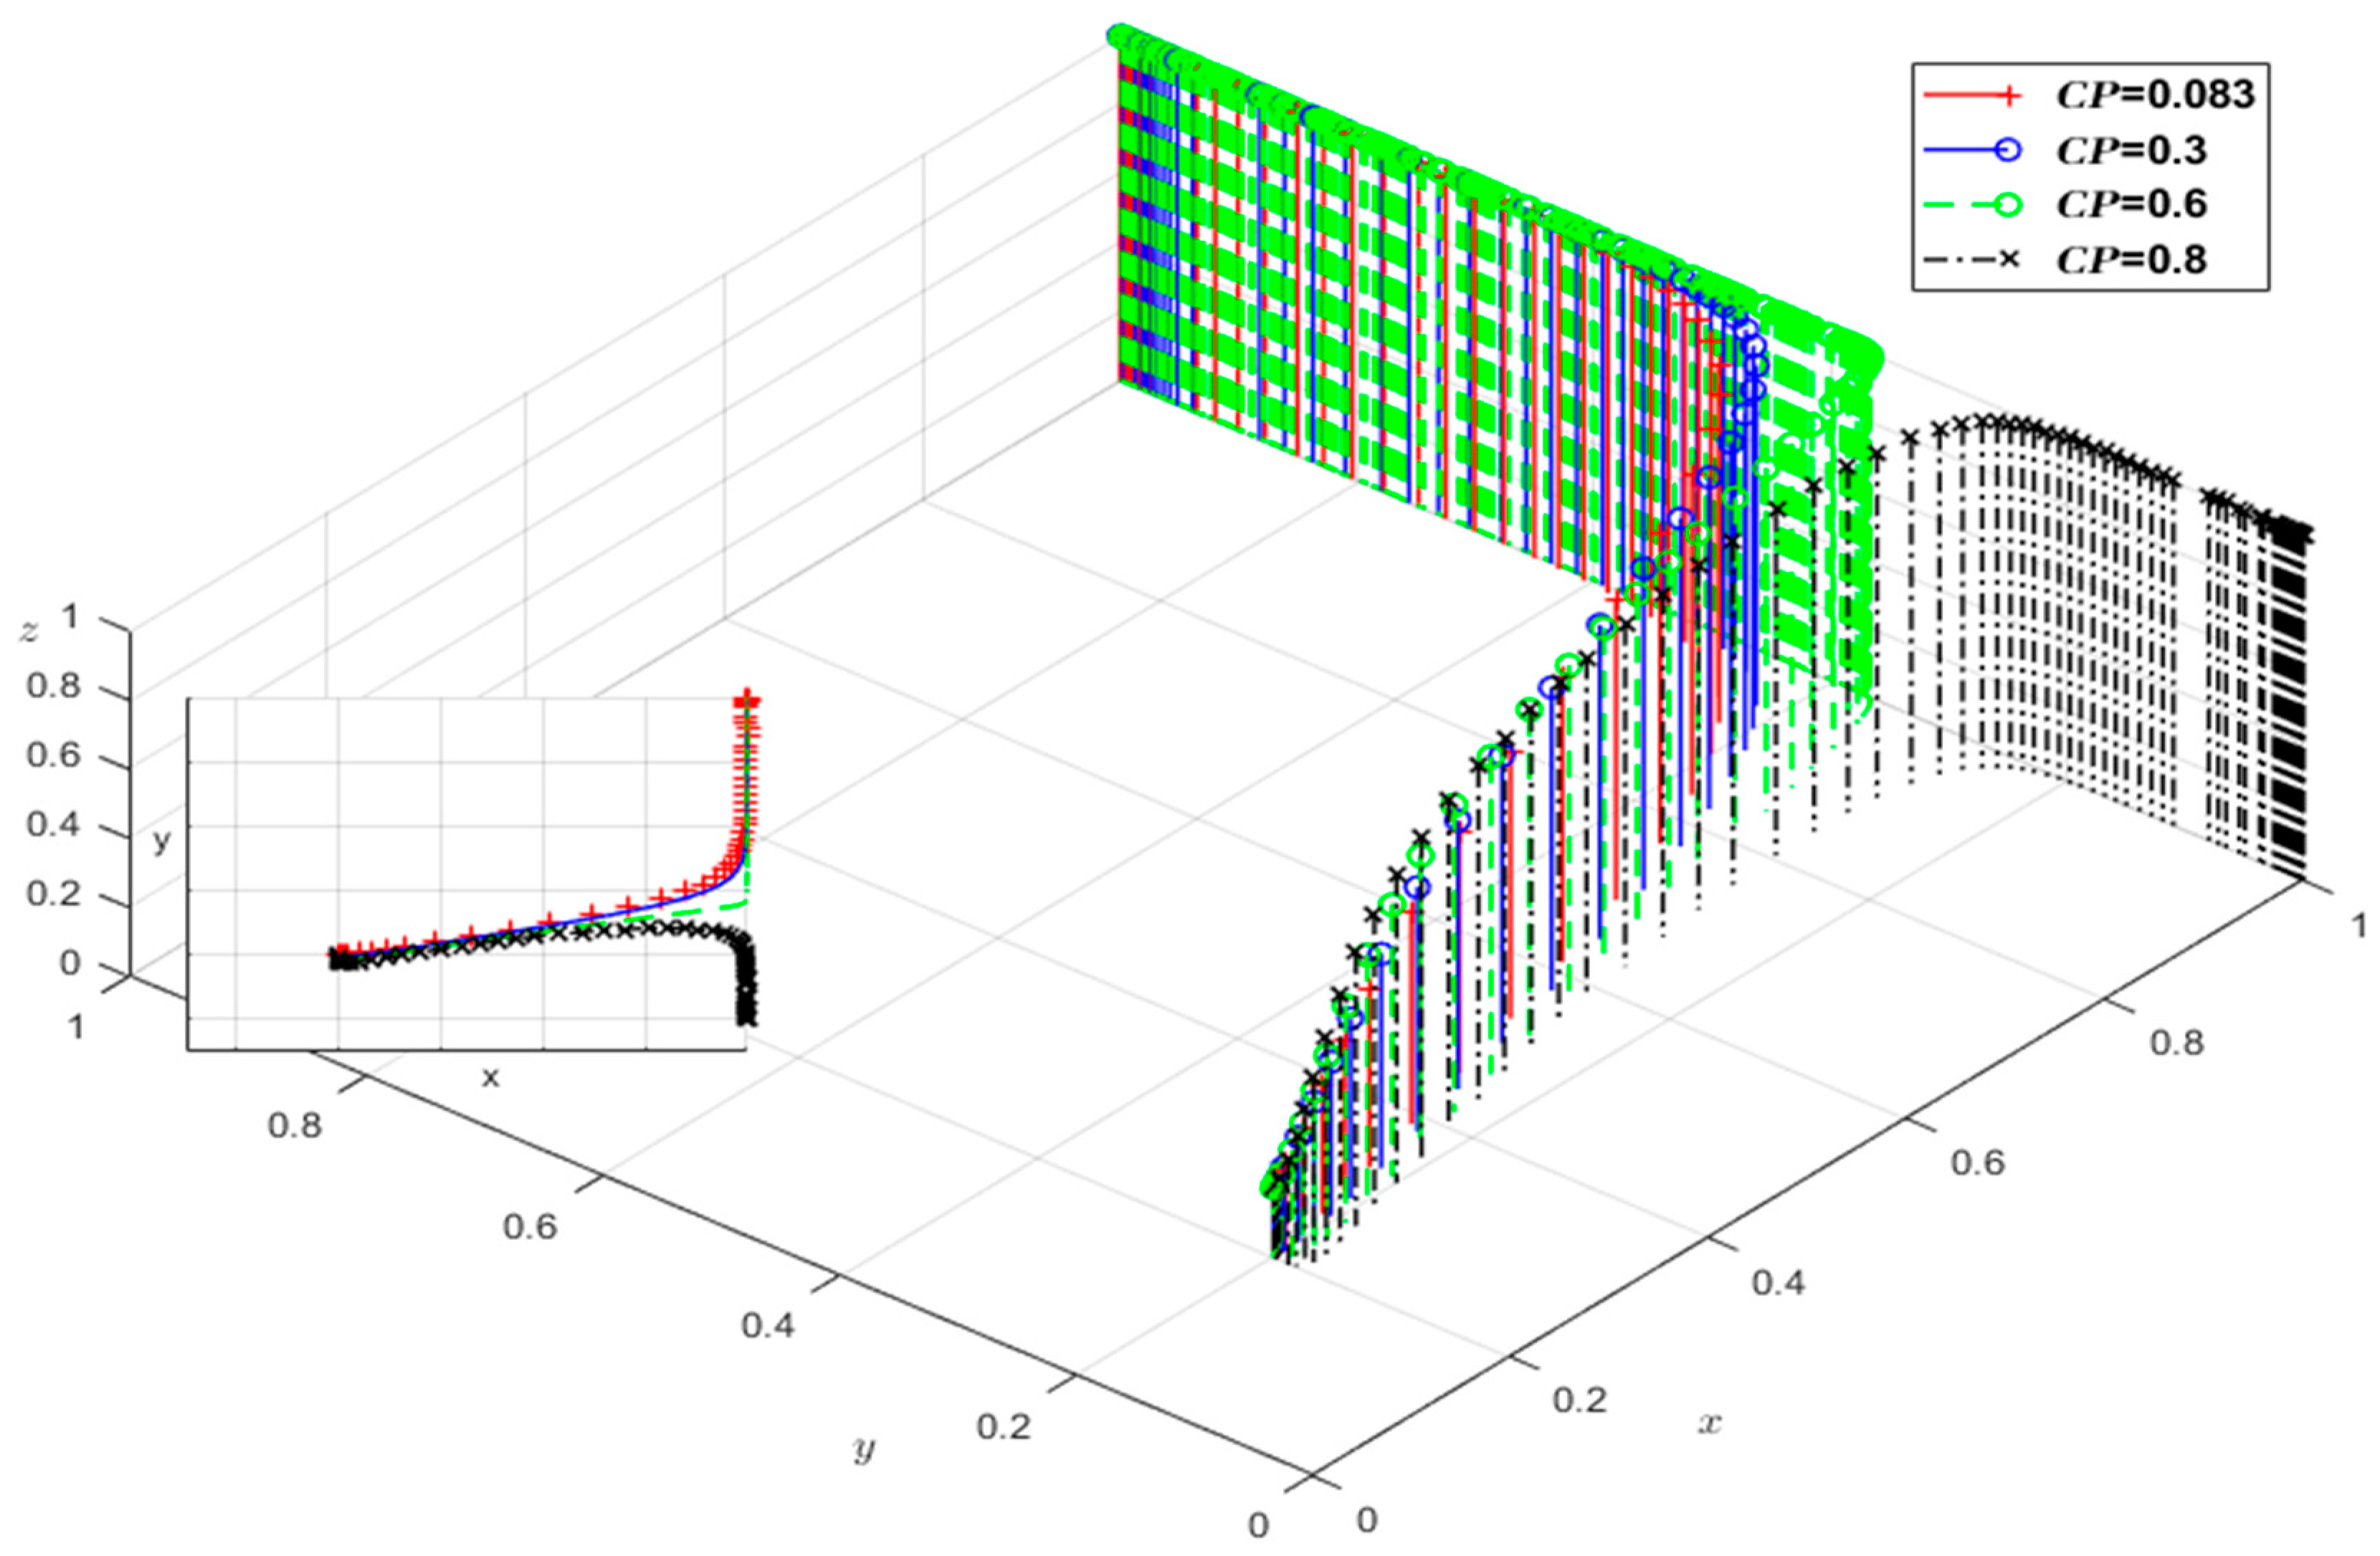
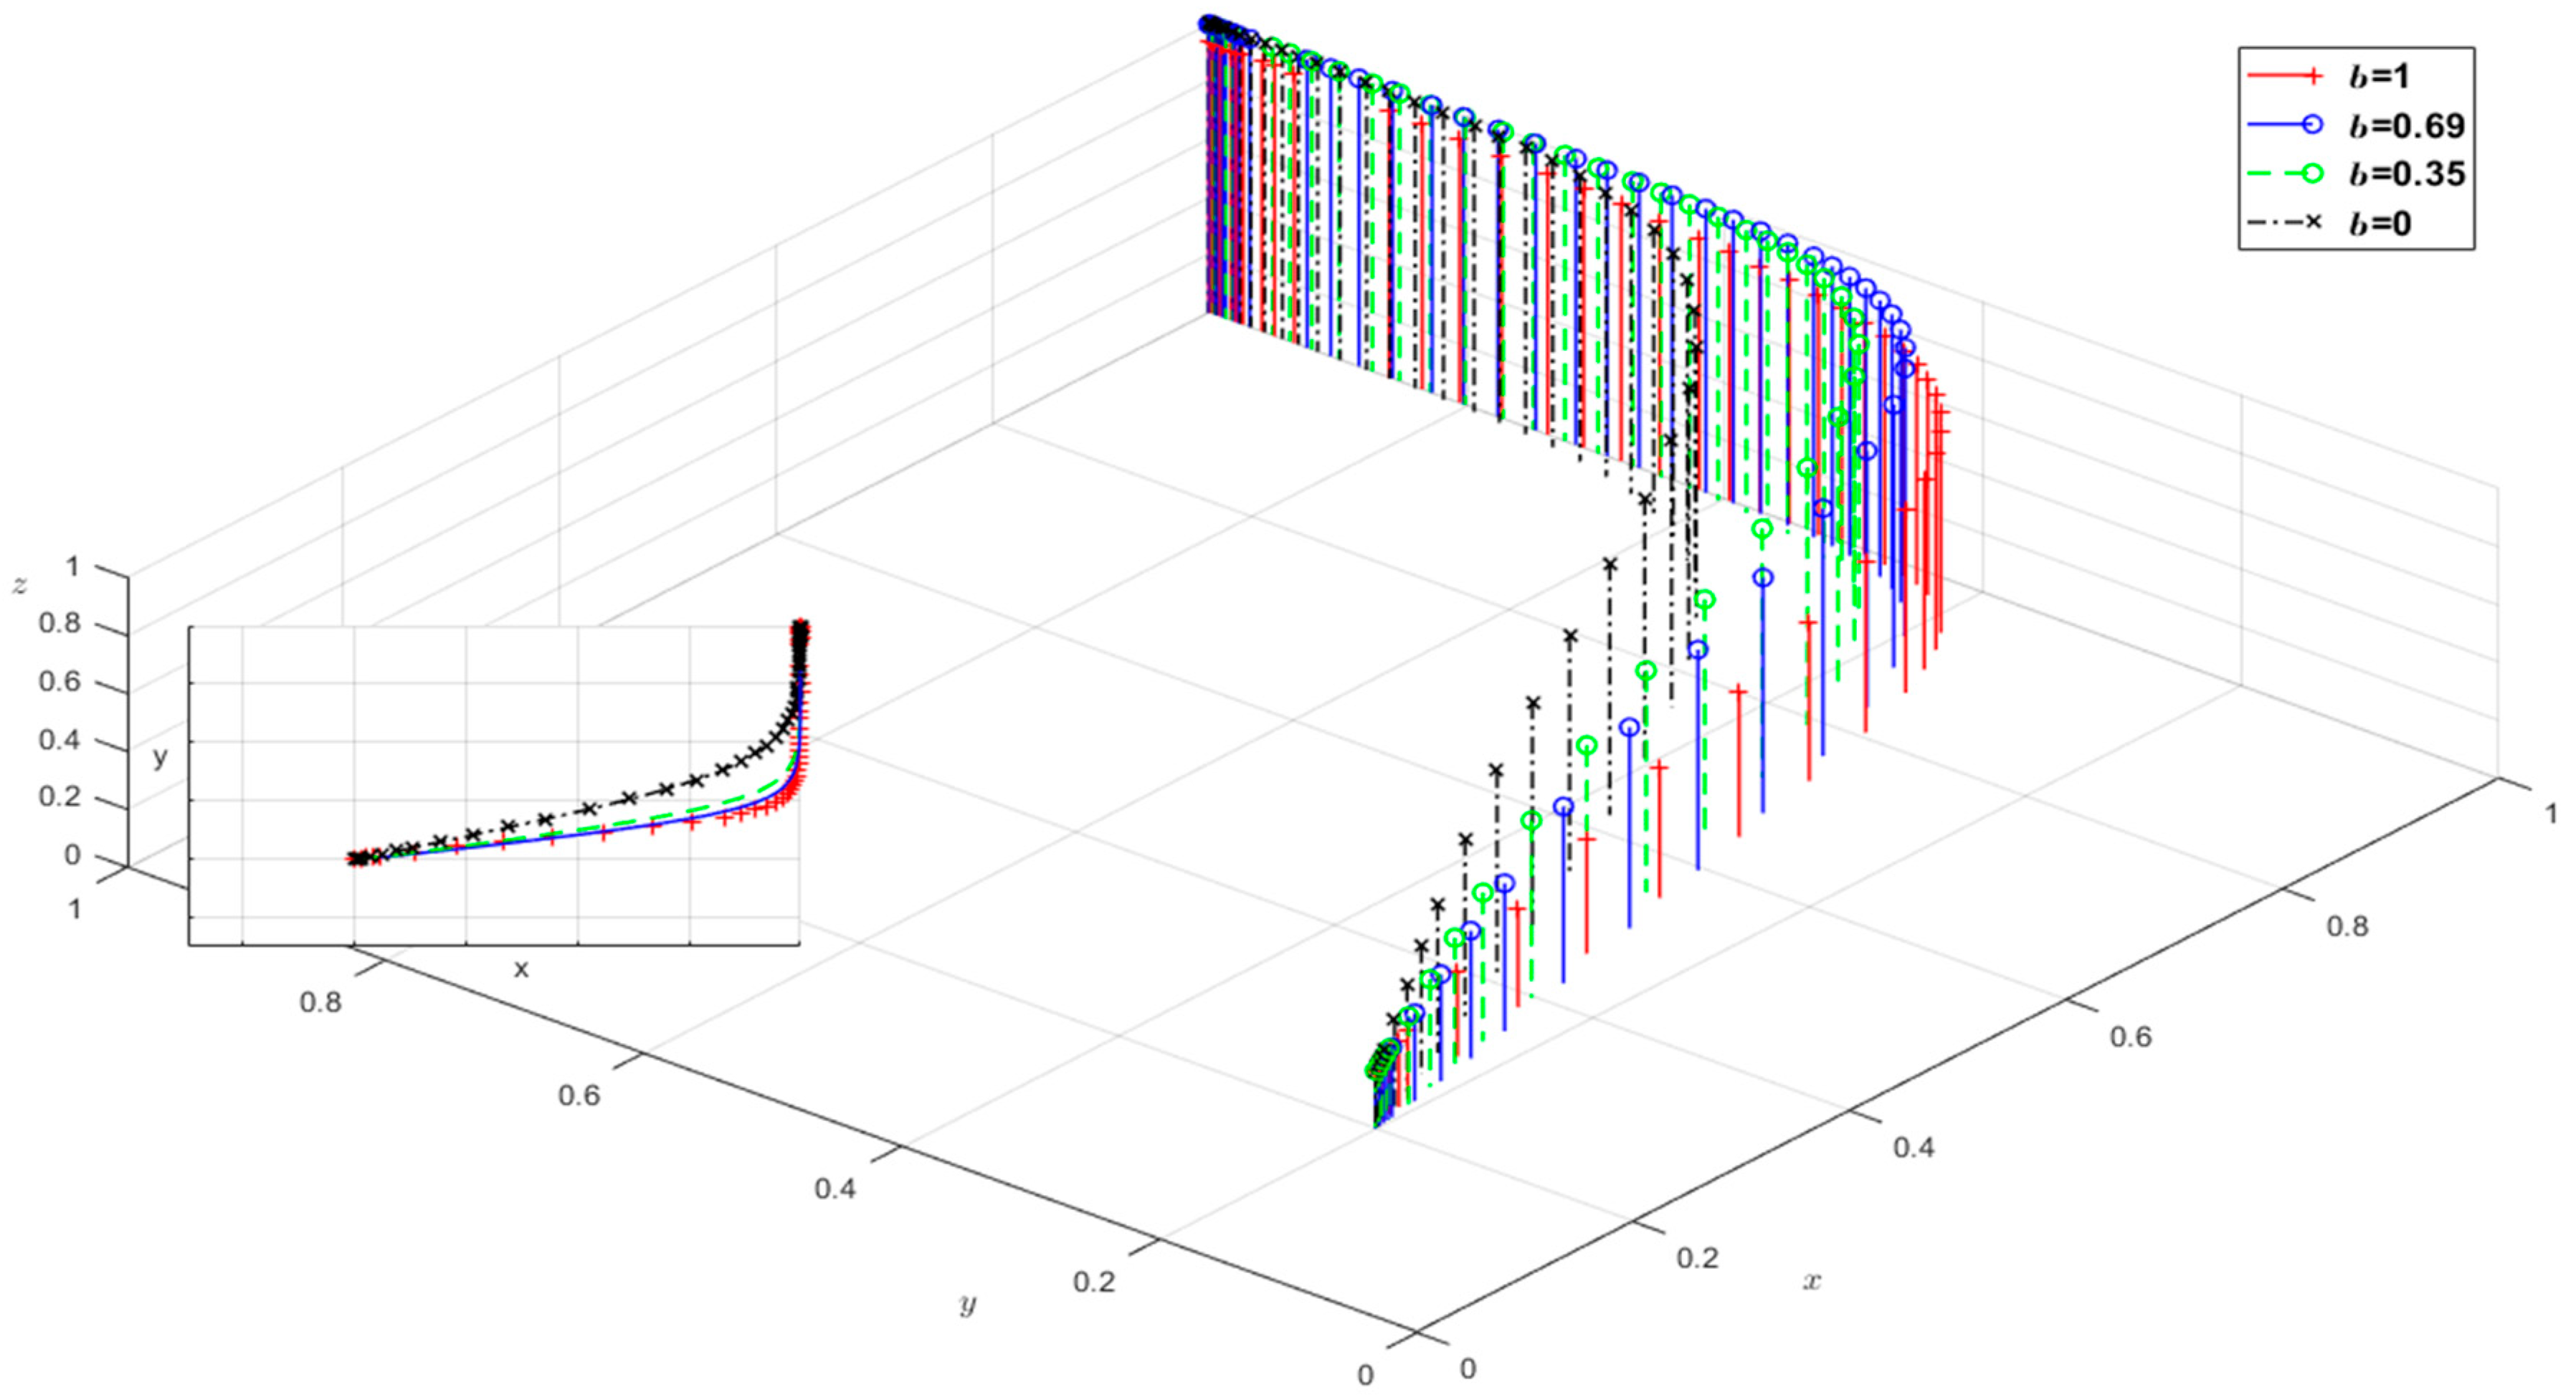
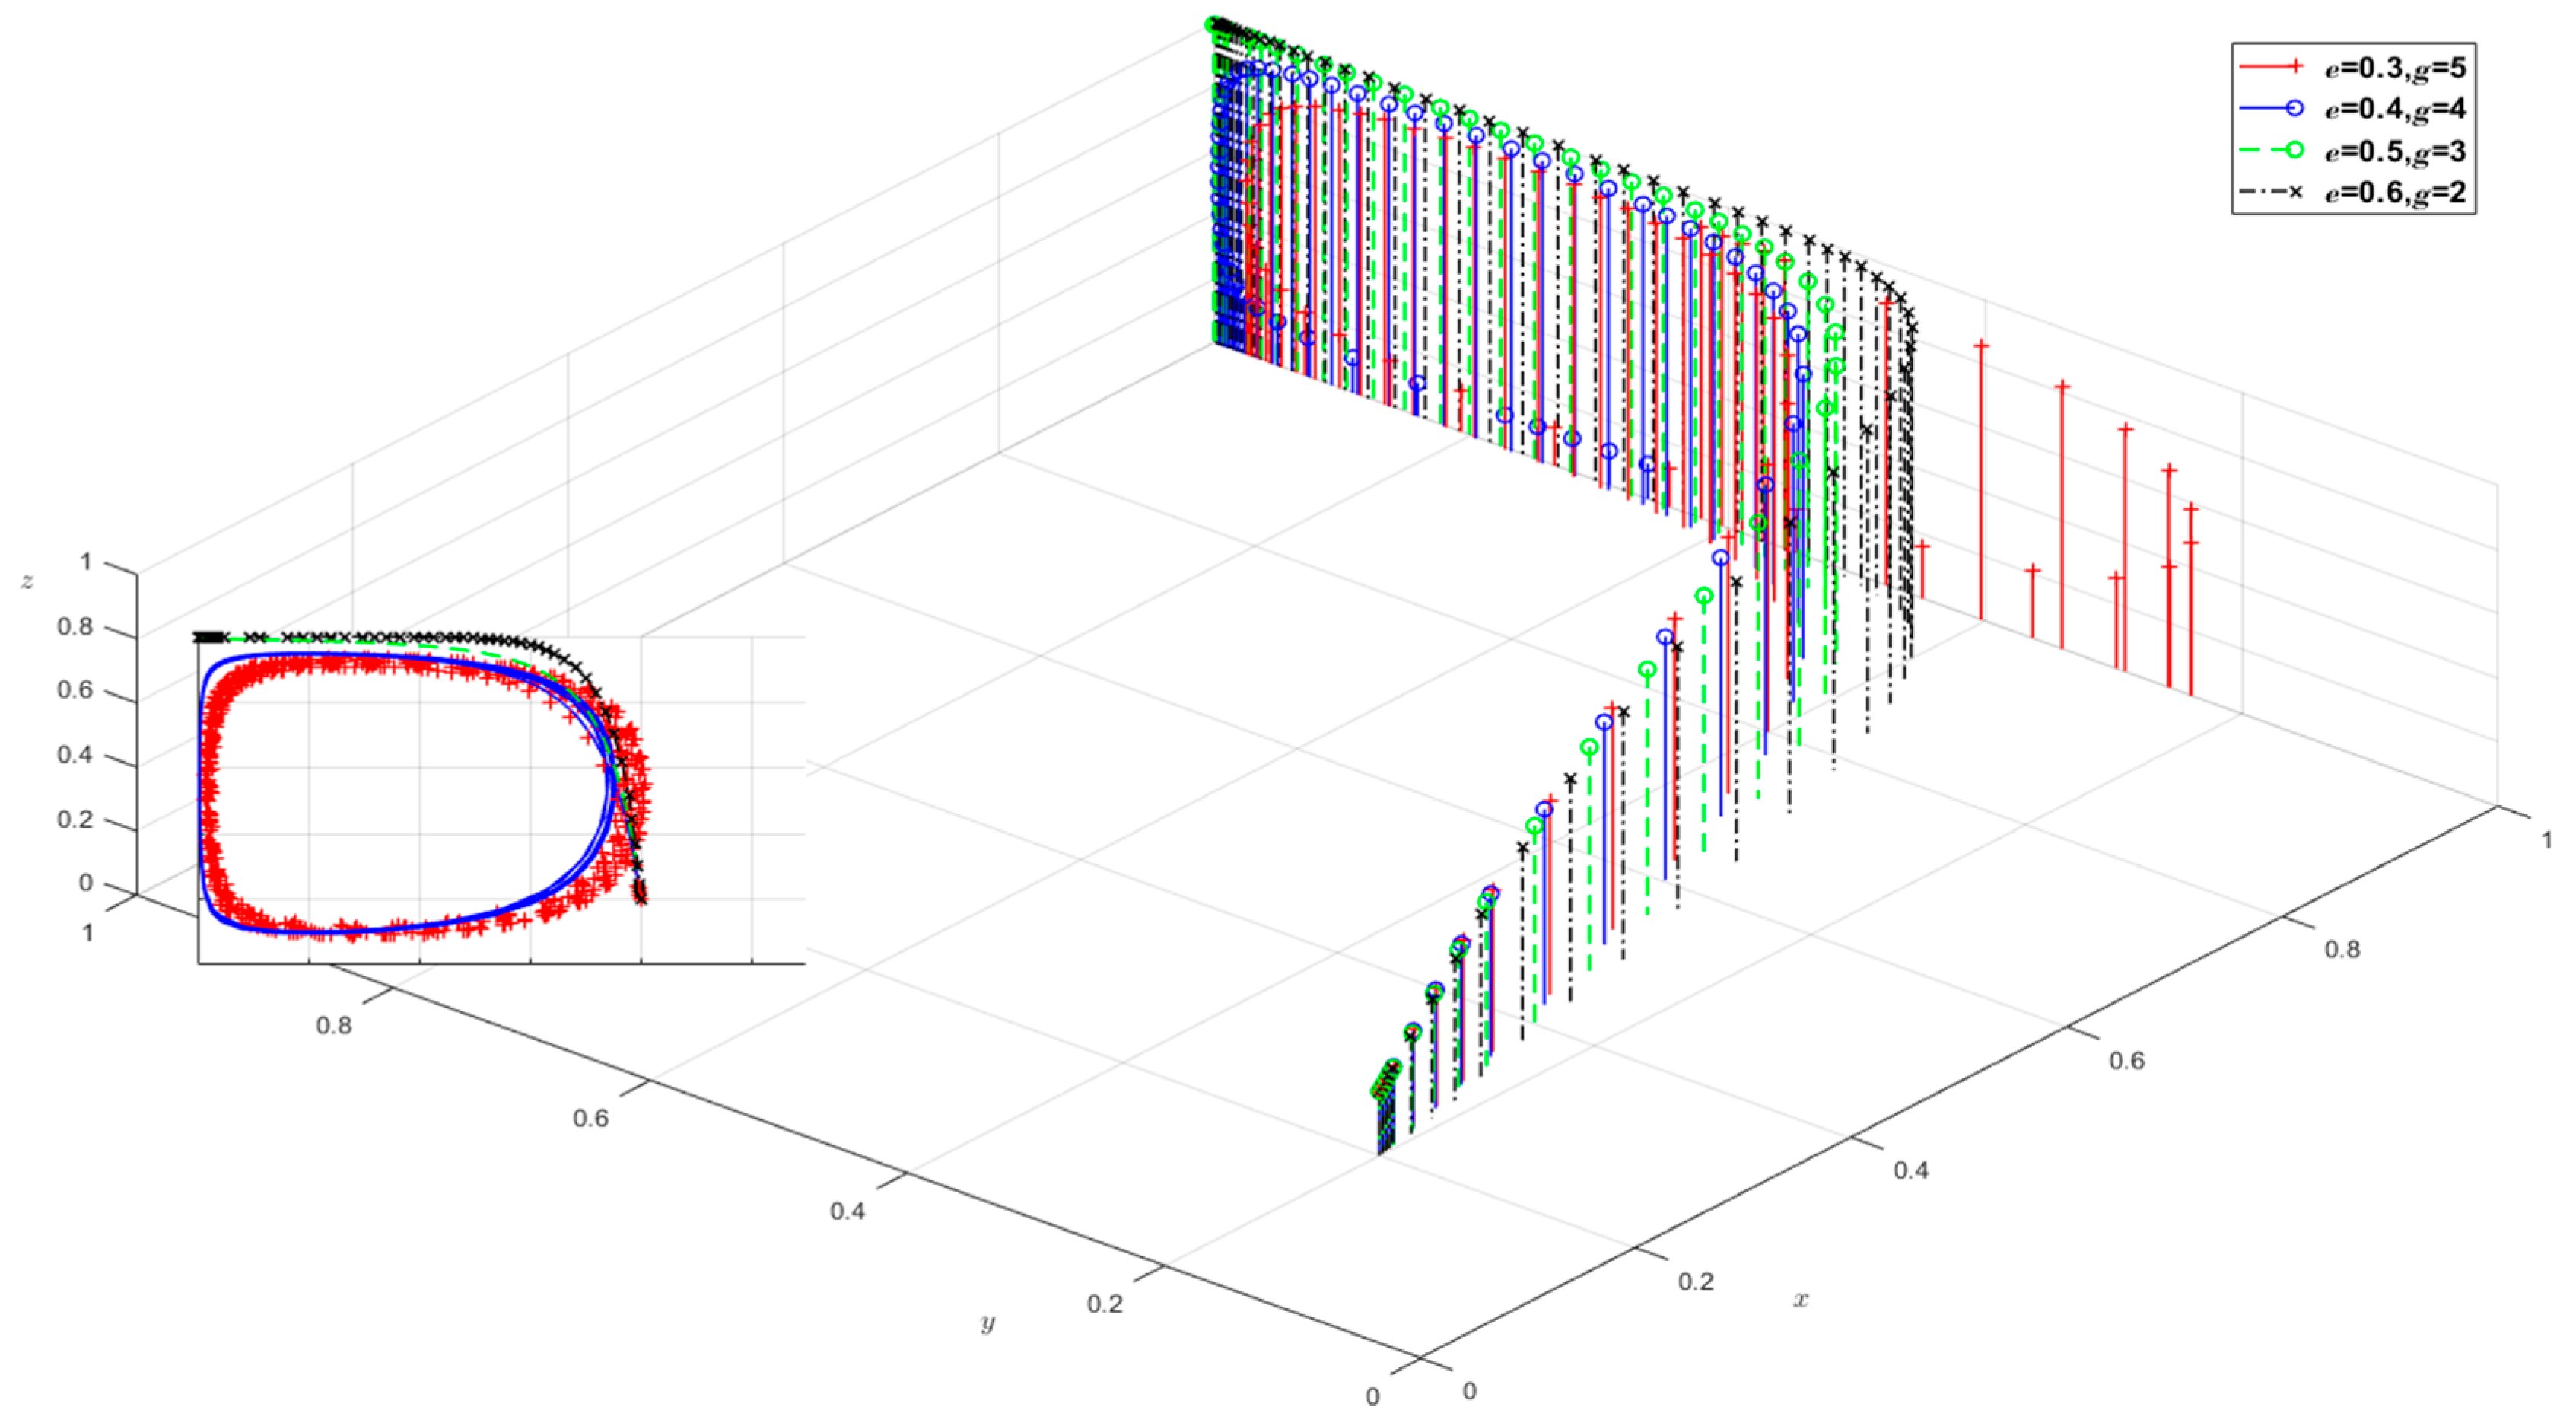
5.3. Sensitivity Analysis of Key Variables to Tripartite Evolutionary Systems
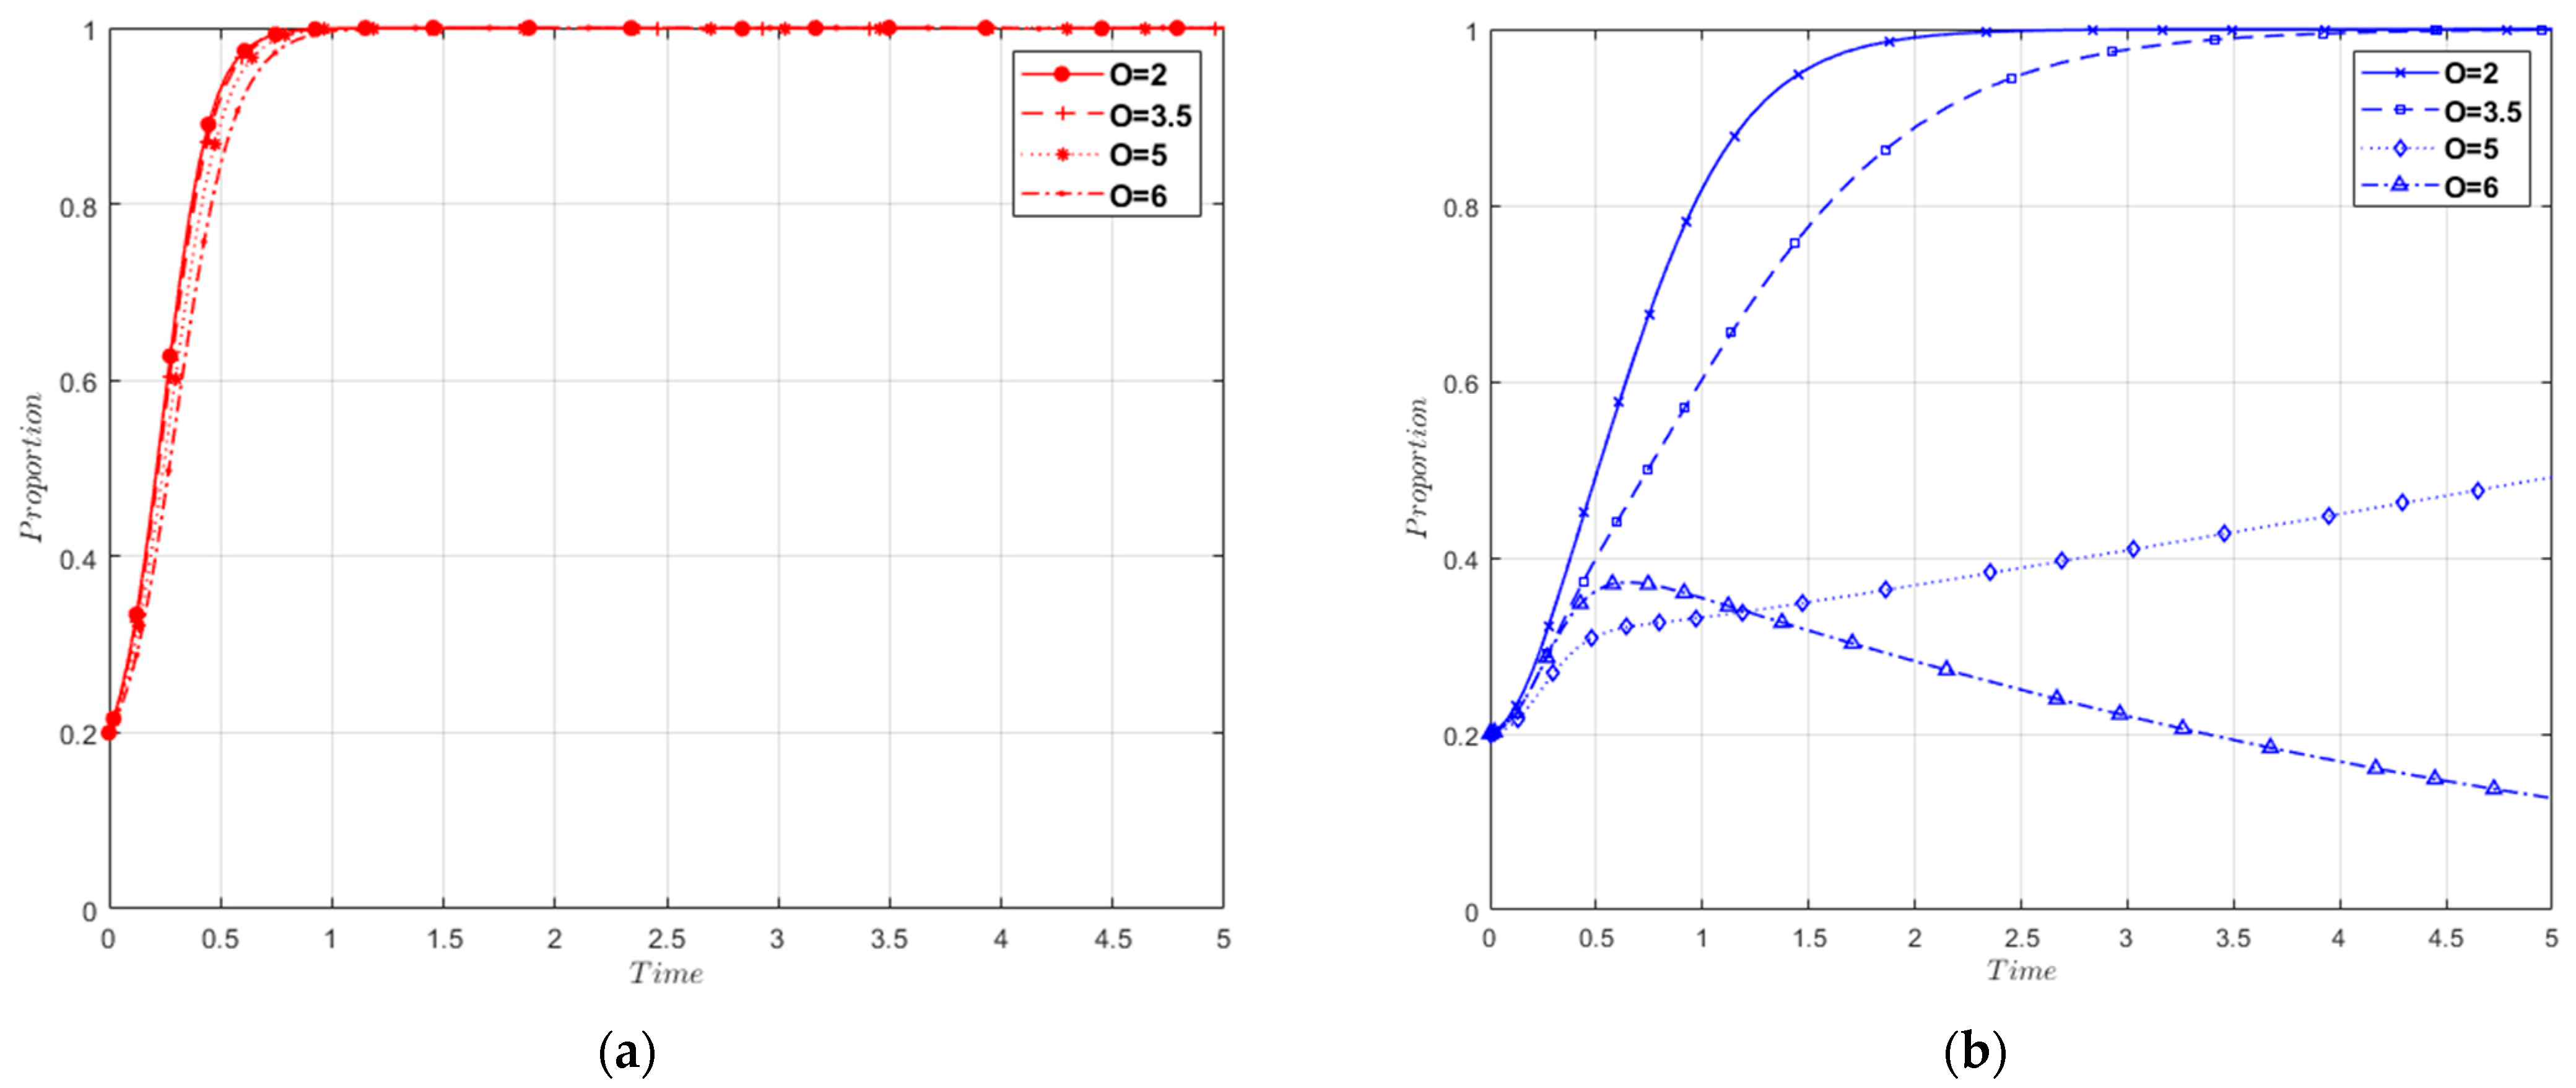
This section evaluates the impact of key parameters on the evolutionary outcomes and trajectories of the tripartite game after the formal implementation of the CBAM. This provides theoretical support and policy recommendations for future strategic choices by businesses and governments. Using the parameters from the CBAM implementation stage as a foundation, the initial intentions of x, y, and z are set to 0.2 to ensure uniform control.
(1)
Impact of Changes in Free-Riding Effect
Keeping the baseline parameters unchanged, the free-riding benefits (O) were set to 2, 2.35, 5, and 6. From Figure 8, it can be observed that O primarily influences the strategy choices of small- and medium-sized enterprises (SMEs). When O exceeds 5, SMEs tend to choose strategy 0, meaning they maintain traditional production. The increase in O has limited effects on large-scale steel enterprises, primarily influencing only the time required to evolve to a stable state and the rate of evolution., with the ultimate evolutionary outcome still tending toward 1. Additionally, as the free-riding benefits decrease, the system evolves more rapidly toward the ideal state (1, 1, 1), as shown in Figure 9. As free-riding behavior primarily occurs between enterprises, its impact on the government is limited. However, as a leader, the government can mitigate free-riding behavior through regulatory measures and other means. The above results indicate that free-rider benefits are a crucial factor hindering the low-carbon upgrade of steel enterprises. Only by reducing the free-rider benefits among enterprises can the three parties evolve toward the ideal state of (1, 1, 1).
When the export volumes were set to 0.3, 1, 1.7, and 3, numerical simulations of the trilateral game model were conducted, and the evolutionary trajectory is shown in Figure 10 and Figure 11. As the export volume decreases from 3 to 0.3, the evolutionary outcome for large enterprises remains oriented toward 1, but the stability time of evolution increases. Small- and medium-sized enterprises evolve toward 0 when the export volume is low. This indicates that the export volume determines the magnitude of the CBAM costs, with smaller export volumes resulting in relatively less of an impact on enterprises. As the export volume increases, the attention and response of enterprises to the CBAM need to correspondingly increase. The government’s evolutionary rate is inversely proportional to the increase in export volume. This implies that as the export volume increases, the government, in order to regulate the market and ensure the competitiveness of Chinese steel products in international trade, needs to mitigate the impact of the CBAM through fiscal subsidies and tax refunds. This, to some extent, increases the government’s fiscal expenditure, resulting in a certain economic burden and reducing the government’s proactive response to the CBAM.
(2)
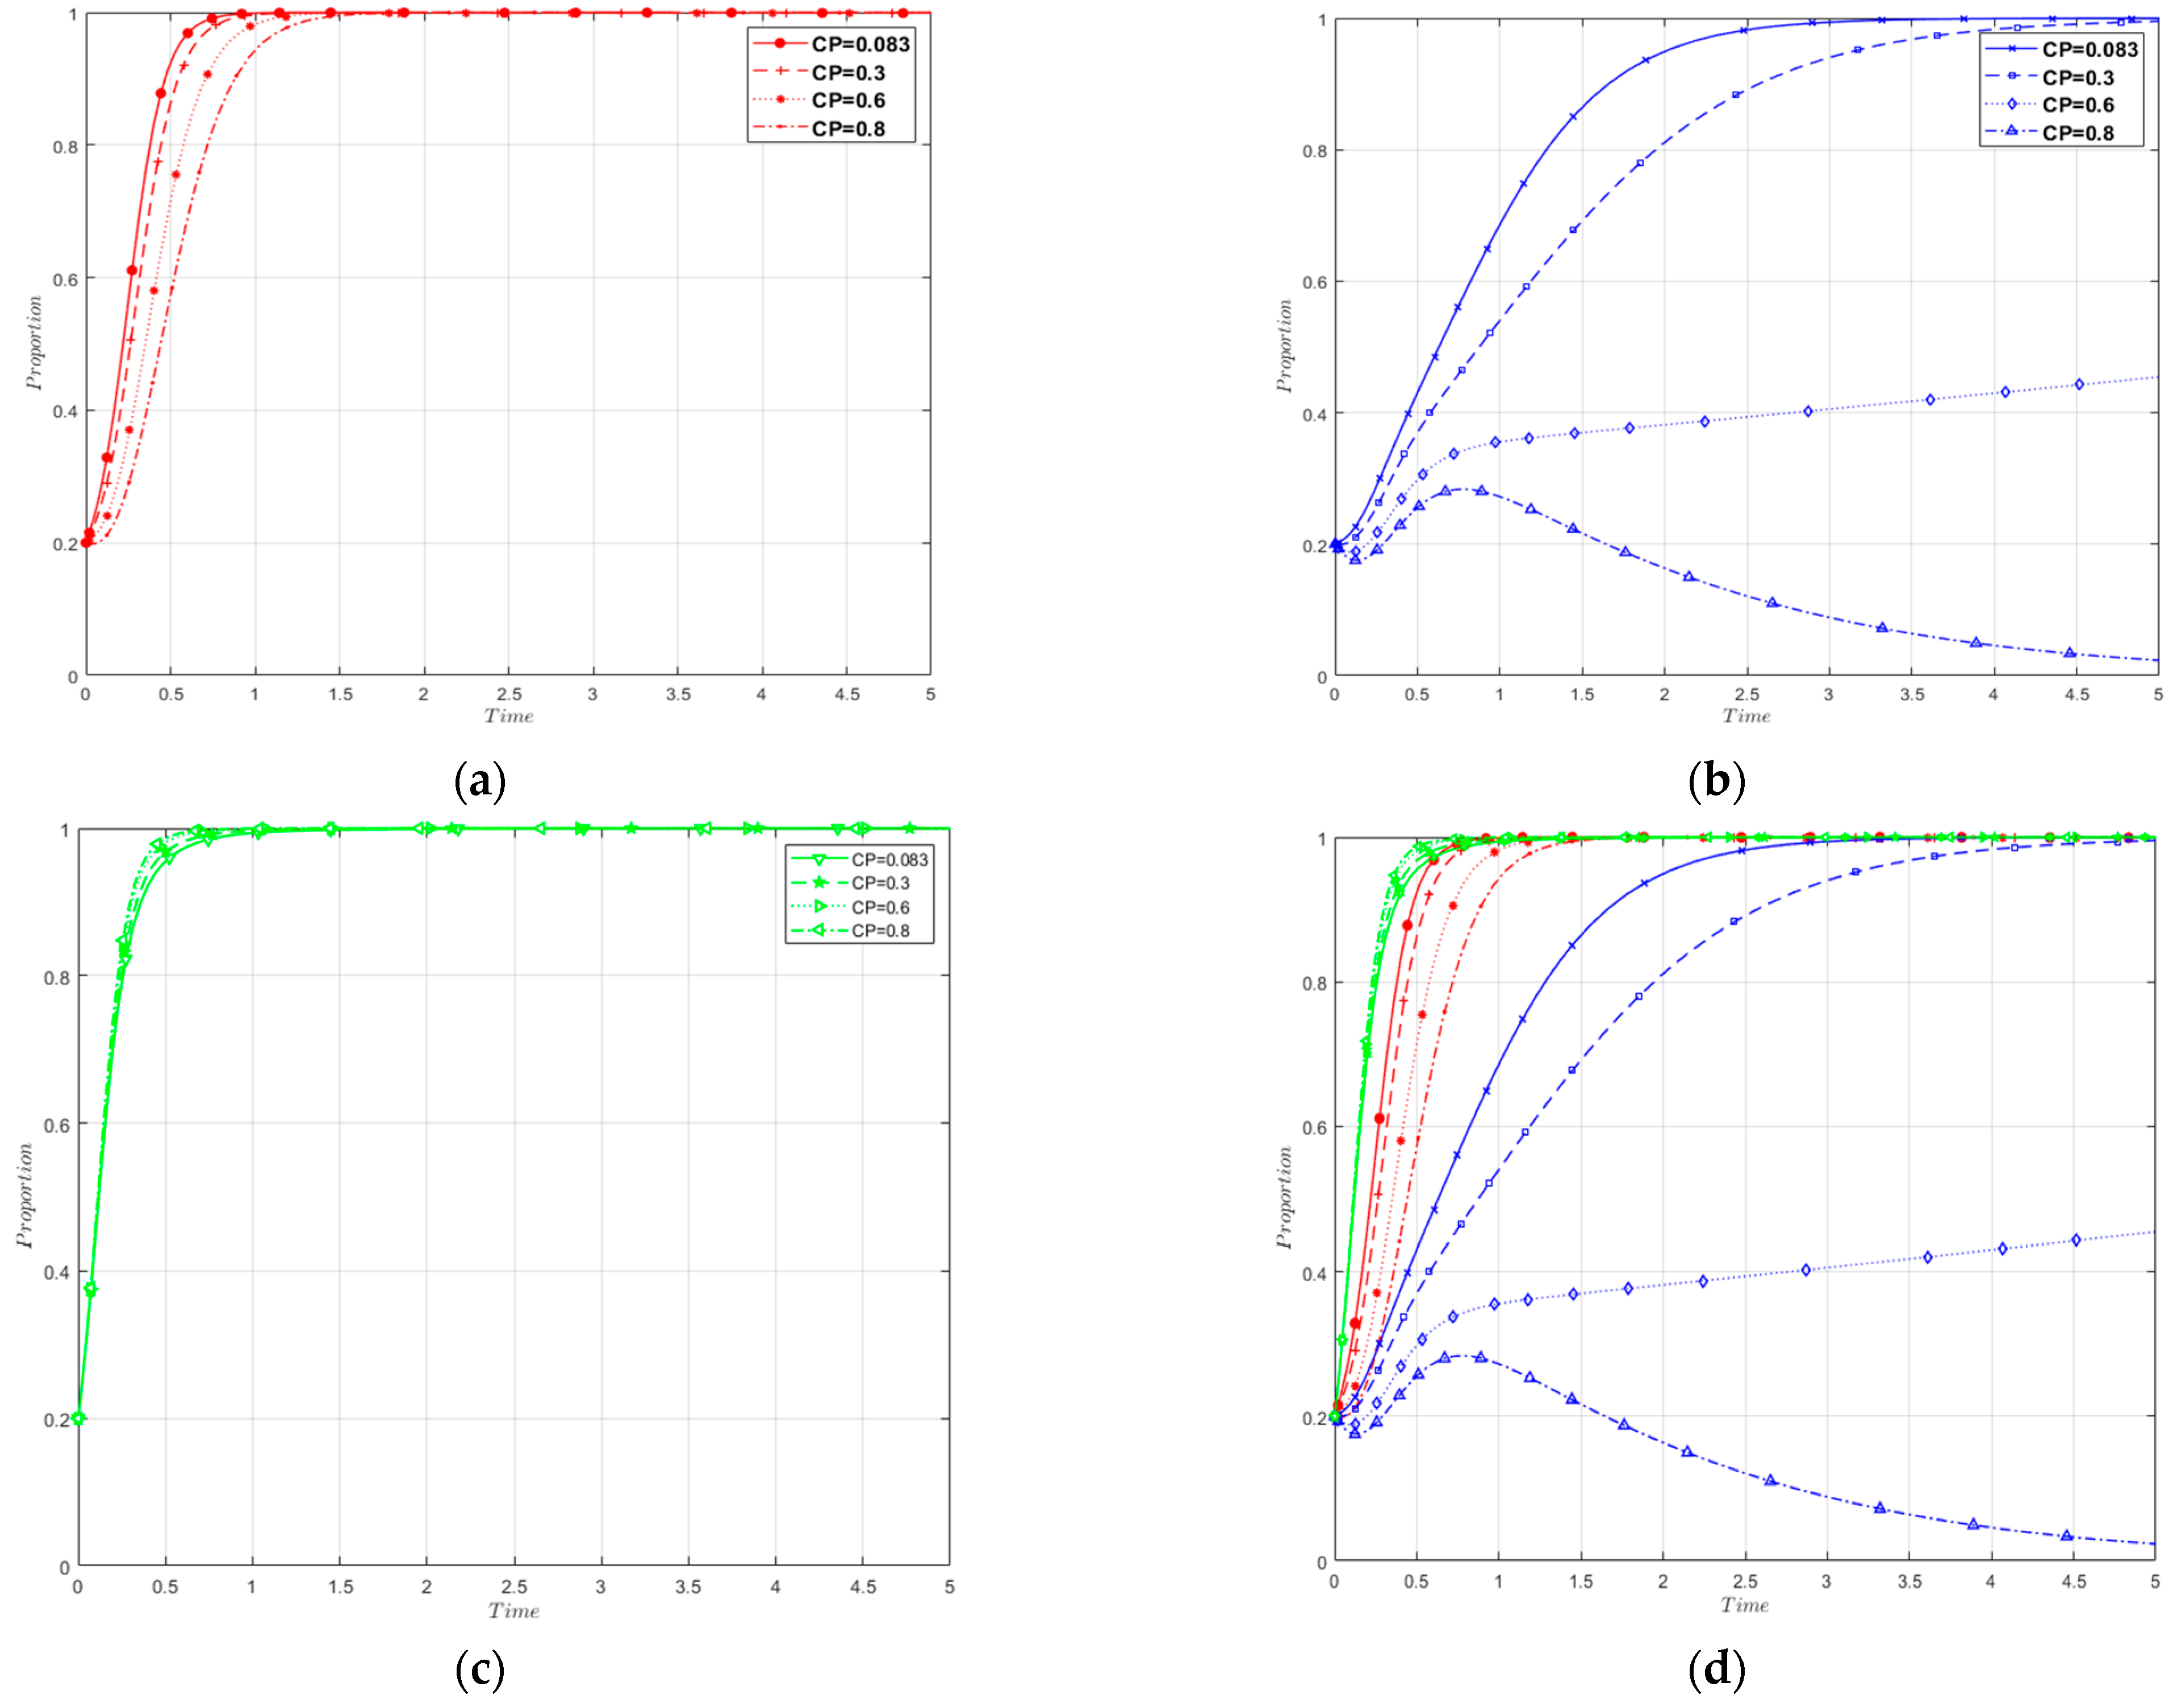
The Impact of Changes in the Chinese Carbon Market Prices
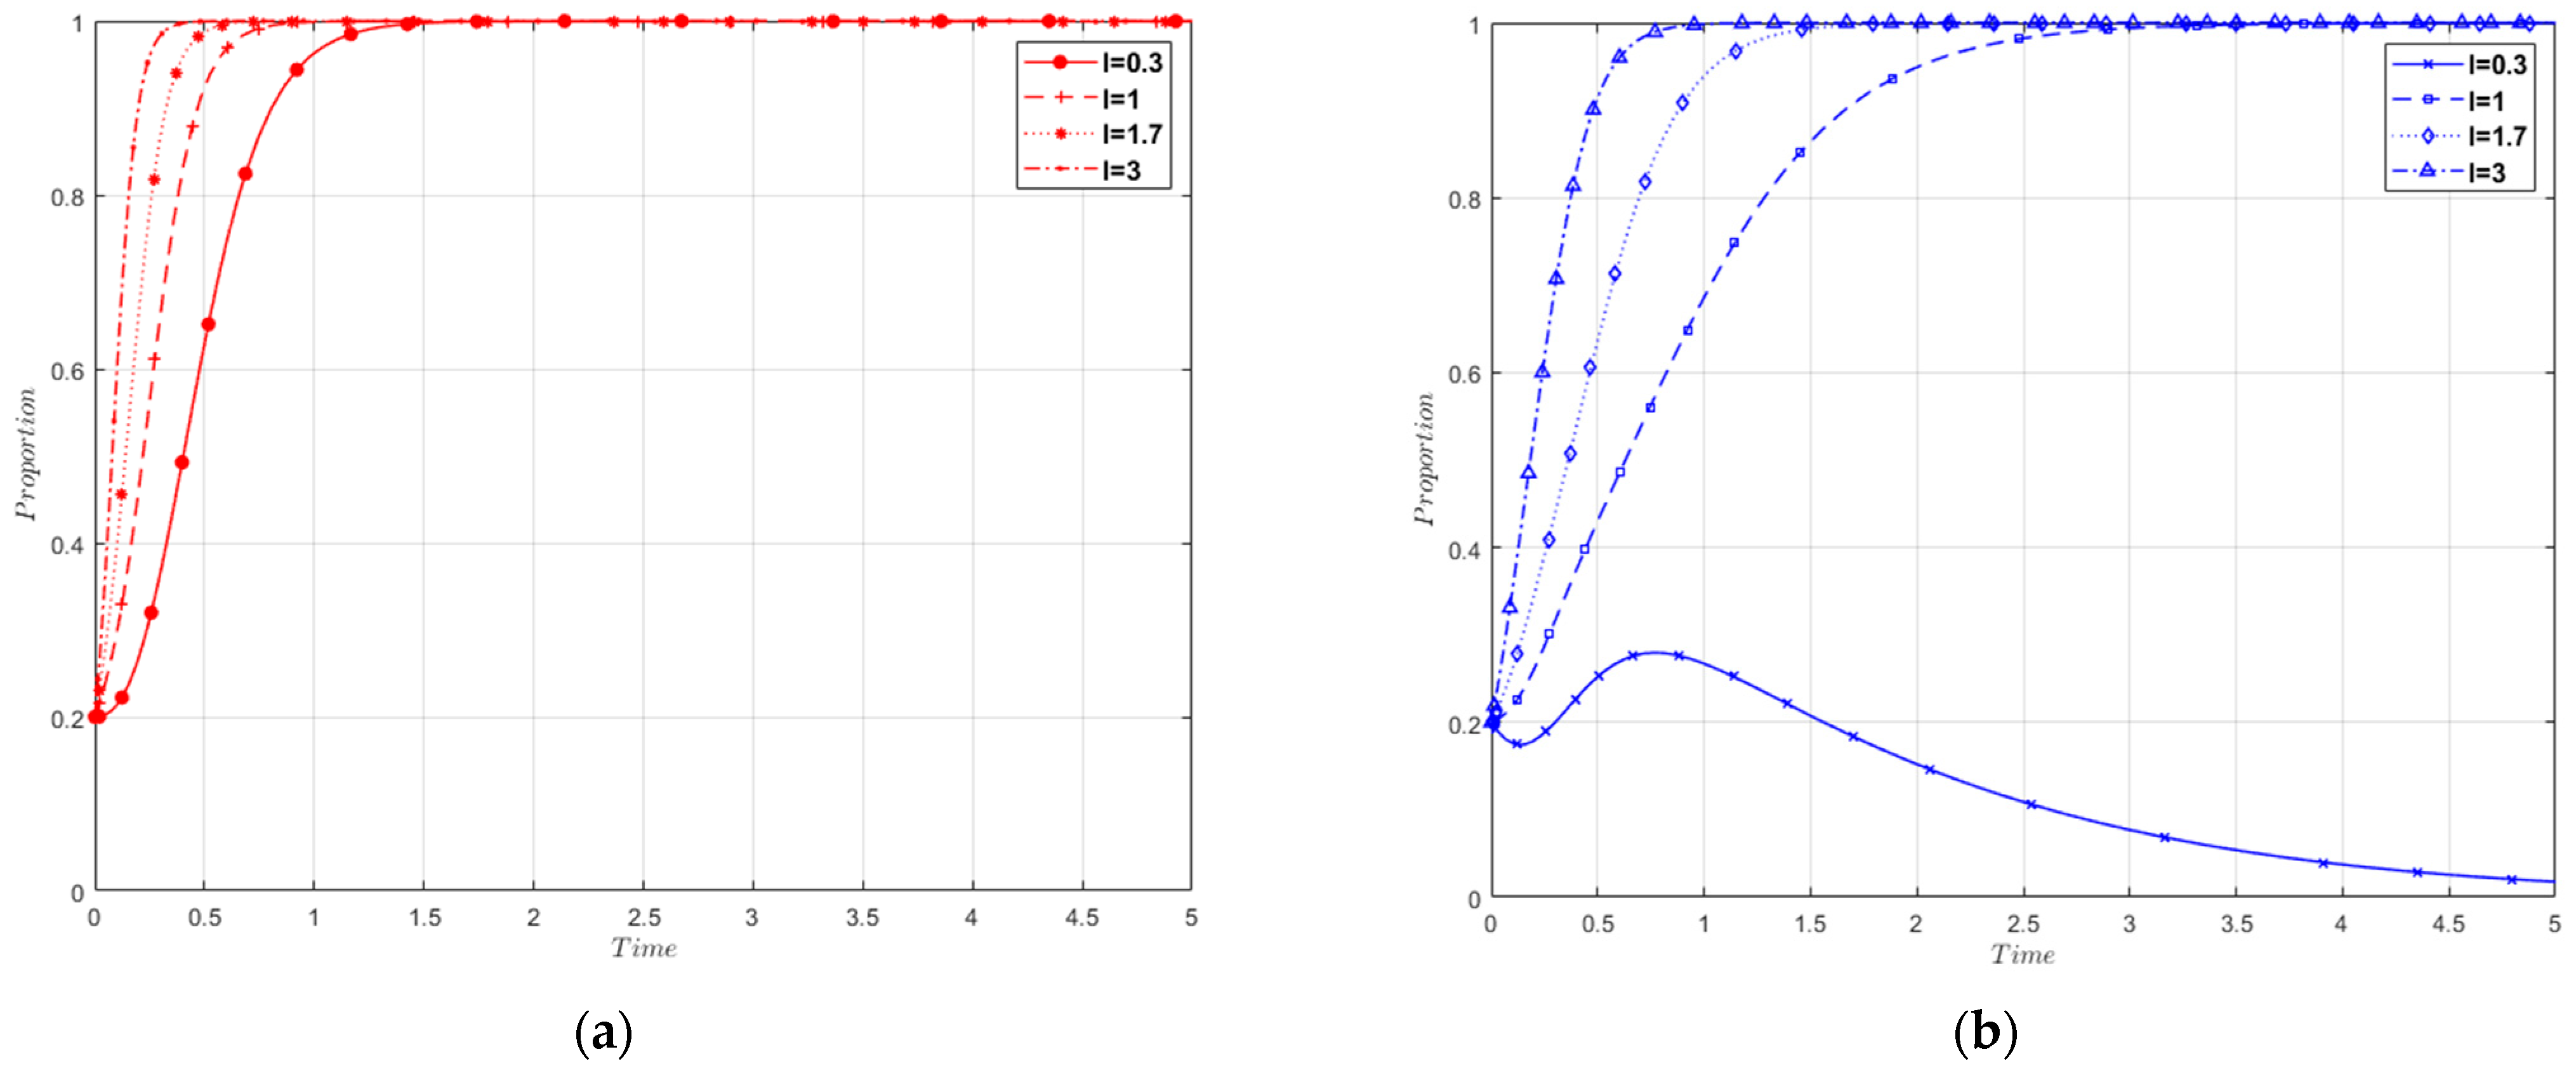
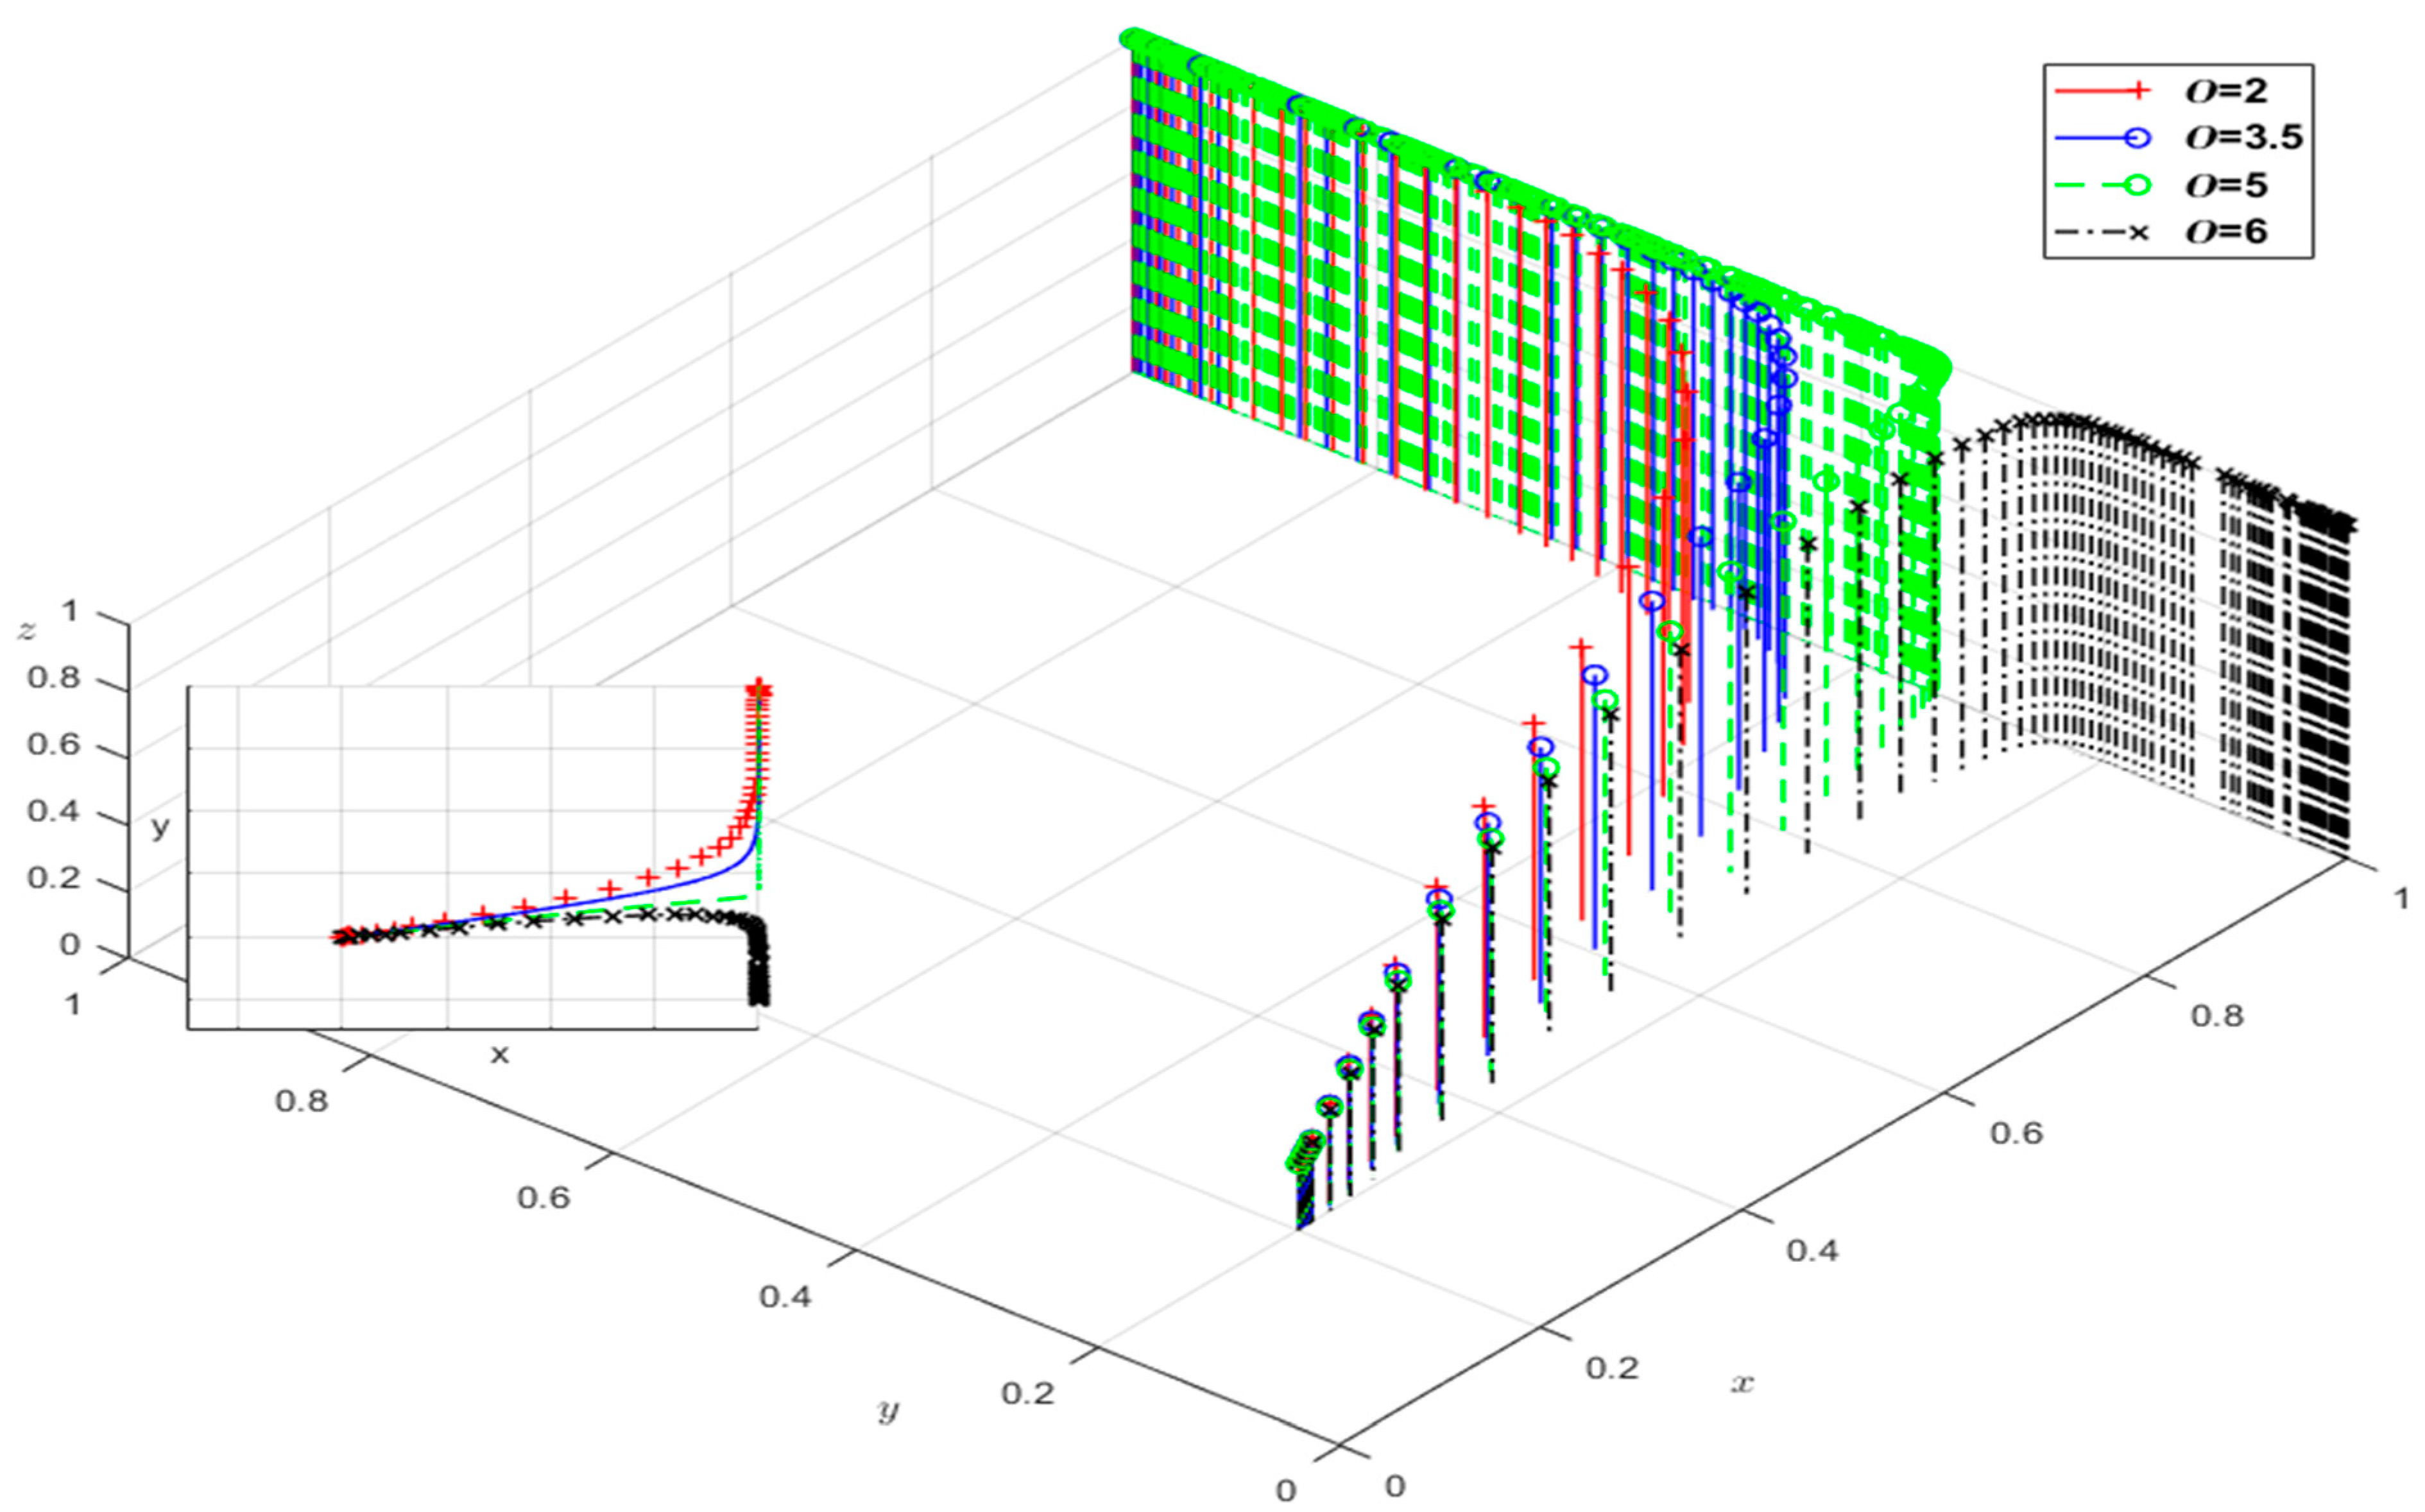
To explore whether or not changes in the carbon market prices in China can mitigate the impact of the CBAM, the Chinese carbon price (CP) was set at 0.083, 0.3, 0.6, and 0.8. As shown in Figure 12 when CP increases to 0.6 and 0.8, y tends to be 0, but the impact on x and z is limited, only changing the evolution rate. During the CBAM implementation phase, with the increase in the Chinese carbon market price, small- and medium-sized enterprises are more willing to maintain their existing production mode, and the evolution rates of large steel enterprises and the government are also reduced. Based on Figure 13a, it can be observed that for large-scale steel Enterprise 1, as carbon prices increase, the rate of decision evolution to a stable state decreases, and there is a negative correlation between carbon price and decision time. In contrast, government decisions are positively correlated with carbon prices, with decision evolution to a stable state occurring more quickly and in a shorter time to reach stability as carbon prices increase. These results indicate that improving the Chinese carbon market and increasing carbon trading prices are effective measures to mitigate the impact of the CBAM’s implementation. High-level carbon trading prices provide a certain buffering effect on industrial structure for enterprises, alleviating the impact of the CBAM’s implementation on the production structure of steel enterprises. This research finding is consistent with the results of Qi et al. [25].
(3)
The Impact of Changes in the EU’s Free Carbon Allowances
The evolution of different stages of free carbon emission quotas proposed by the CBAM was simulated by setting free quota parameter b to 1, 0.69, 0.35, and 0, corresponding to the window phase, transition phase, implementation phase, and strengthening phase of the CBAM, respectively. The evolution trajectories and behaviors of the tripartite system under different free quota levels are shown in Figure 14 and Figure 15. When b = 1, the government’s decision evolution does not reach 1, indicating that in the high free quota stage, the government, while more inclined to choose an active response strategy, cannot ignore the possibility of choosing a passive management strategy. Based on Figure 15a,b, it is evident that the size of the enterprise remains one of the main factors influencing decision-making. The larger the enterprise, the shorter the time required for it to evolve to a stable state. From Figure 15, it can be observed that changes in free quotas do not have a decisive impact on the stakeholders within the model. When there is a scenario of high free quotas, the rates at which x, y, and z evolve to stable strategy point 1 are slower compared with the scenario with zero free carbon quotas, indicating a longer time required for evolution. This is because free carbon quotas alleviate, to some extent, the carbon tax expenses imposed by the CBAM. As free carbon quotas decrease, the carbon tax costs that enterprises need to pay gradually increase, thereby inhibiting the enthusiasm for low-carbon upgrading and resulting in a decrease in the rate of evolution.
(4)
The Impact of Dynamic Subsidy Intensity Changes by the Government
The analysis of dynamic subsidies and penalties for enterprises is similar, and this section will focus on dynamic subsidies. Based on the assumptions mentioned earlier, the government’s subsidy intensity for iron and steel enterprises for low-carbon initiatives will vary based on the proportion of low-carbon enterprises. When the proportion of low-carbon enterprises is low, the government will expand the subsidy intensity to encourage iron and steel enterprises to undergo low-carbon upgrades. Setting the low-carbon proportion and subsidy amount to 0.3 and 8, 0.4 and 6, 0.5 and 4, and 0.6 and 2, the corresponding evolutionary trajectories and results are obtained, as shown in Figure 16 and Figure 17. According to the evolution results, when the proportion (e) is 0.3 and 0.4, the evolution trajectory shows fluctuating development, and there is no stable evolution point. This indicates that the government, constrained by excessive fiscal expenditures, will continuously adjust its management decisions. The evolution curve of small- and medium-sized enterprises follows the trend of government decisions, indicating that small and medium-sized enterprises will adjust their production strategies in response to changes in government decisions, making it difficult to reach a stable evolution point. As the proportion increases, the government subsidy amount decreases to a level within acceptable expenditure limits. The model reaches a stable evolution point (1, 1, 1). Simulation results show that, for the government, excessively high fiscal subsidies impose a significant burden on it during policy implementation, leading to fluctuations in the strategies of small- and medium-sized enterprises following changes in government attitudes. Moderate levels of fiscal subsidies help guide enterprises toward low-carbon upgrades, but excessively low low-carbon subsidies will prolong the time required to evolve to a stable state.

6. Discussion

Chinese steel enterprises and the government are important stakeholders under the implementation of the CBAM. Based on a tripartite evolutionary game model, this paper theoretically analyzes and empirically simulates the evolving trends and sensitivity of key parameters in the production decisions of steel enterprises of different scales and the government’s management attitudes at different stages of the CBAM. The results indicate that attitudes of both enterprises and the government undergo significant changes at different stages of the CBAM’s implementation. Moreover, five key parameters, including free-riding benefits, export volume, Chinese carbon market prices, and government dynamic low-carbon subsidies and penalties, significantly influence the low-carbon upgrading decisions of steel enterprises and the government’s proactive attitude toward the CBAM.
Firstly, this study divides the implementation process of the CBAM into four stages. In different stages, the scale of enterprises has a significant impact on their strategic choices. This conclusion is consistent with the findings of Li et al. [63], demonstrating that the scale of enterprises has a positive moderating effect on low-carbon upgrading choices, leading to large-scale steel enterprises prioritizing low-carbon upgrading strategies with shorter decision stabilization times. However, the benefits of free-riding among enterprises cannot be overlooked [64,65]. This study exhibits a stronger specificity, demonstrating the impact of free-riding behavior on the selection path of enterprise behaviors. Secondly, Qi et al. [25] demonstrated in their study the directional effect of carbon market prices on enterprise production costs. This study constructs a more dynamic evolutionary model, specifically simulating the process of enterprise decision-making in response to changes in carbon prices. Finally, for government stakeholders, this paper considers the impact of dynamic low-carbon subsidies and high-carbon penalties on both enterprises and the government itself, including the importance of government financial subsidies and tax refunds [62]. Compared with their research, our study more effectively targets smaller-scale enterprises and simulate the effects of tax refunds and subsidies on them.
In summary, this study provides a theoretical analysis for Chinese steel enterprises and government management on how to mitigate the impact of the CBAM and promote the coupling of corporate economic viability and environmental sustainability [66] under this background. Additionally, it offers a new direction for research on the CBAM in the Chinese steel industry, providing an analytical model for developing countries similar to China, which is of great significance for the global steel industry’s economic sustainability and low-carbon emission reduction.

7. Conclusions

Since 1 October 2023, the CBAM (Carbon Border Adjustment Mechanism) Act has entered a transitional phase, and the impact on China’s steel trade has been increasing with the improvement and implementation of regulations. This study focuses on different types of steel enterprises and the strategies adopted by the Chinese government. Utilizing evolutionary game theory, this research investigates the game relationships and decision-making choices among stakeholders during different stages of the CBAM’s implementation. It explores the strategic interactions and dynamic evolution pathways between the government and enterprises, analyzing the influence of key parameters on the strategies of all parties during the formal implementation stage of the CBAM. Our research yields the following conclusions:

7.1. Results

(1)
The larger-scale steel enterprises are more significantly impacted by the CBAM and exhibit higher sensitivity to policies. This results in larger-scale steel enterprises prioritizing low-carbon upgrade strategies, leading to shorter decision stability times. As the CBAM matures and is implemented, government management strategies transition from passive management to active response. During the CBAM strengthening phase, constrained by fiscal expenditures and changes in enterprise behavior, governments ultimately opt for passive strategies. This finding is consistent with the research outcomes of Raudla et al. [67], which suggests that government management choices are constrained by fiscal and policy factors. Additionally, the decision-making of small- and medium-sized enterprises relies more on government management strategies.
(2)
The issue of free-riding benefits emerges as a significant impediment to an enterprise’s adoption of low-carbon upgrades. Excessive benefits derived from free-riding may perpetuate enterprises’ adherence to high-carbon production practices, thereby exacerbating environmental strain. Effective mitigation of this issue necessitates enhanced governmental oversight and intervention to curtail inter-enterprise free-riding benefits. By carrying this out, a conducive environment for small- and medium-sized enterprises to undertake low-carbon transformation and upgrading initiatives is ensured.
(3)
The export volume of steel products plays a decisive role in enterprises’ decisions to pursue low-carbon upgrades. As the export volume increases, steel enterprises tend to make the decision to upgrade to low-carbon production in shorter timeframes and at faster rates. However, higher export volumes may lead to excessive fiscal expenditures on tax refunds by the government. Excessive fiscal expenditures hinder the government’s proactive response to the CBAM, thereby slowing down the evolution of the system toward stability. This conclusion aligns with the findings of Zhou et al. [68], indicating that excessive fiscal expenditures impede the government’s proactive attitude toward regulations, exacerbate environmental degradation, and undermine the sustainable development of local environments.
(4)
As the CBAM legislation is progressively implemented, the gradual reduction in free carbon allowances by the European Union will not exert a decisive influence on the decision-making of the three parties involved. Instead, it will only alter the time required to evolve toward a stable state. With the reduction in free carbon allowances, the time needed to reach a stable state will be prolonged.
(5)
The increase in carbon market prices in China serves as an effective measure to address the CBAM. As the Chinese carbon market gradually matures and the gap between domestic carbon prices and EU carbon prices narrows, the increase becomes more conducive to alleviating the economic pressure brought about by the CBAM. The rate of evolution of enterprises slows down, and with the increase in carbon prices, the impact of the CBAM on the production structure of Chinese domestic steel enterprises diminishes.
(6)
Government dynamic subsidies and penalties for enterprises should be optimized within a certain range. In the model, low-carbon subsidies at levels between 2 and 4 produce the optimal incentives and punitive effects with minimal fiscal expenditure. Excessive penalties or subsidies are not conducive to the sustainable development of enterprises’ choices for low-carbon production modes, as they can exacerbate the financial burden on both enterprises and the government. This conclusion is consistent with the research findings of Wang et al. [69] Small- and medium-sized steel enterprises exhibit greater sensitivity to government policies, resulting in their evolution being influenced by changes in government strategies.

7.2. Policy Implications

Promoting the low-carbon transformation of Chinese steel enterprises and reducing the carbon emission intensity per ton of steel products are the foundations for addressing the implementation of the CBAM. In order to facilitate the industrial upgrading of steel enterprises and meet the fundamental requirements for the sustainable and healthy development of China’s steel industry [70], mitigate the impact of the CBAM on Chinese steel enterprises, and safeguard the competitiveness of Chinese steel products in the international market, this study proposes the following policy recommendations:
(1)
To prevent free-riding phenomena and expedite the low-carbon transformation of steel enterprises, the government should enact effective environmental policies and regulations. This includes establishing an accelerated system for low-carbon standards, increasing government attention to the sustainable development of the steel market, and implementing regulations that raise the costs of free-riding for both small and large enterprises. By minimizing the benefits derived from free-riding behavior, the government can reduce instances of free-riding, thereby facilitating the low-carbon transition of enterprises and safeguarding the environmental sustainability of businesses.
(2)
Enhancing the mechanism of China’s carbon trading market and narrowing the gap between Chinese and international carbon prices are essential steps. Establishing a robust carbon pricing mechanism and gradually integrating the steel industry into the Chinese carbon market will provide a stable external environment for the sustainable development of the steel sector. Additionally, this will help alleviate the carbon tax pressure resulting from the CBAM’s implementation. Moreover, it will ensure that products from steel enterprises maintain high competitiveness in the international market.
(3)
The government should implement appropriate penalties and fiscal support to encourage enterprises to transition toward strategies of “low-carbon upgrading” and actively engage in industrial low-carbon upgrade reforms. When providing subsidies and penalties, the government should adopt a graded approach based on the scale of different enterprises to determine the levels of penalties and low-carbon subsidies. This measure aims to prevent individual enterprises from exploiting low-carbon subsidies while also avoiding additional fiscal pressure on the government due to high levels of fiscal expenditure. Through appropriate penalty and subsidy measures, the government can incentivize the entire steel industry to undergo low-carbon upgrades, thereby leveraging its regulatory guidance role to steer enterprises from high-carbon production toward low-carbon sustainable development.

7.3. Limitations

This study utilizes two different-scale steel enterprises from South China and East China as examples, which, although somewhat representative, still exhibit spatial heterogeneity. Moreover, the evolutionary game model employed in data processing entails a degree of subjectivity. For instance, parameters such as the added value of the low-carbon market were determined through expert consultation and literature research, indicating potential for future research to employ more realistic data. Furthermore, the study primarily focuses on how China responds to the CBAM, neglecting other stakeholders such as the European Union, which serves as a policymaker and leader in the CBAM’s implementation. Future research could utilize methods like principal–agent game to construct models from the EU perspective, enriching the study’s specificity. Additionally, there is potential for a deeper exploration of the impact of the carbon market and of increasing carbon quota trading among enterprises, providing more realistic market assumptions for steel enterprises to address the CBAM in the future.

Author Contributions

B.T.: methodology, data curation, and writing—original draft. M.Z.: validation and project administration. C.P.: supervision, conceptualization and methodology. Y.X.: resources and supervision. W.L.: writing—review and editing, and validation. Y.G.: data curation, and writing—review and editing. All authors have read and agreed to the published version of the manuscript.

Funding

This work is supported by Scientific and Technological Innovation Foundation of Foshan, USTB (BK22BF006), and Research Project on Methods, Technologies, and Standards for Greenhouse Gas Spatial Measurement, Industrial Source Localization, and Verification (2022YFF0606403).

Institutional Review Board Statement

Not applicable.

Informed Consent Statement

Not applicable.

Data Availability Statement

No new data were created or analyzed in this study. Data sharing is not applicable to this article.

Conflicts of Interest

The authors declare that they have no known competing financial interests or personal relationships that could have appeared to influence the work reported in this paper.

Nomenclature

V i Basic corporate earnings
β Enterprise 2 input–output ratio
δ Synergy coefficient
e Share of low-carbon enterprises
r Maximum penalty
L Length, m
M i Upgraded emission intensity
l Export volume
b CBAM free carbon allowance
C P China carbon trading price
t i Low-carbon production CBAM tax
c g Government management costs
F High-carbon hidden losses
α Enterprise 1 input–output ratio
C i Low-carbon upgrade costs
L Additional benefits
g Maximum government subsidy
O i Profit from hitchhiking
W Width, m
N i Conventional emission intensity
E S European steel emission intensity
E P EU carbon trading price
T i Traditional production CBAM taxes
V G Chinese government political gains
E i Tax rebate
i = 1 ,   2

References

  1. Beck, U.R.; Kruse-Andersen, P.K.; Stewart, L.B. Carbon leakage in a small open economy: The importance of international climate policies. Energy Econ. 2023, 117, 106447. [Google Scholar] [CrossRef]
  2. European Union. Commission Implementing Regulation (EU) 2023/1773 of 17 August 2023 laying down the rules for the application of Regulation (EU) 2023/956 of the European Parliament and of the Council as Regards Reporting Obligations for the Purposes of the Carbon Border Adjustment Mechanism during the Transitional Period. Off. J. Eur. Union 2023, 228, 94–195. Available online: http://data.europa.eu/eli/reg_impl/2023/1773/oj (accessed on 25 December 2021).
  3. Carbon Border Adjustment Mechanism. Available online: https://ec.europa.eu/taxation_customs/green-taxation-0/carbon-border-adjustment-mechanism_en (accessed on 25 December 2021).
  4. Xu, J.; Lu, C.; Ruan, S.; Xiong, N.N. Estimating the efficiency and potential of China’s steel products export to countries along the “Belt and Road” under interconnection: An application of extended stochastic frontier gravity model. Resour. Policy 2022, 75, 102513. [Google Scholar] [CrossRef]
  5. Zhu, N.; Qian, L.; Jiang, D.; Mbroh, N. A simulation study of China’s imposing carbon tax against American carbon tariffs. J. Clean. Prod. 2020, 243, 118467. [Google Scholar] [CrossRef]
  6. Calı, M.; Ghose, D.; Montfaucon, A.F.L.; Ruta, M. Trade Policy and Exporters’ Resilience: Evidence from Indonesia; The World Bank: Washington, DC, USA, 2022. [Google Scholar]
  7. Ren, Y.; Liu, G.; Shi, L. The EU Carbon Border Adjustment Mechanism will exacerbate the economic-carbon inequality in the plastic trade. J. Environ. Manag. 2023, 332, 117302. [Google Scholar] [CrossRef] [PubMed]
  8. Marron, D.B.; Toder, E.J. Tax policy issues in designing a carbon tax. Am. Econ. Rev. 2014, 104, 563–568. [Google Scholar] [CrossRef]
  9. Khastar, M.; Aslani, A.; Nejati, M. How does carbon tax affect social welfare and emission reduction in Finland? Energy Rep. 2020, 6, 736–744. [Google Scholar] [CrossRef]
  10. Mildenberger, M.; Lachapelle, E.; Harrison, K.; Stadelmann-Steffen, I. Limited impacts of carbon tax rebate programmes on public support for carbon pricing. Nat. Clim. Chang. 2022, 12, 141–147. [Google Scholar] [CrossRef]
  11. Nong, D.; Simshauser, P.; Nguyen, D.B. Greenhouse gas emissions vs CO2 emissions: Comparative analysis of a global carbon tax. Appl. Energy 2021, 298, 117223. [Google Scholar] [CrossRef]
  12. Perdana, S.; Vielle, M. Making the EU Carbon Border Adjustment Mechanism acceptable and climate friendly for least developed countries. Energy Policy 2022, 170, 113245. [Google Scholar] [CrossRef]
  13. Overland, I.; Sabyrbekov, R. Know your opponent: Which countries might fight the European carbon border adjustment mechanism? Energy Policy 2022, 169, 113175. [Google Scholar] [CrossRef]
  14. Tarr, D.G.; Kuznetsov, D.E.; Overland, I.; Vakulchuk, R. Why carbon border adjustment mechanisms will not save the planet but a climate club and subsidies for transformative green technologies may. Energy Econ. 2023, 122, 106695. [Google Scholar] [CrossRef]
  15. Bellora, C.; Fontagné, L. EU in search of a Carbon Border Adjustment Mechanism. Energy Econ. 2023, 123, 106673. [Google Scholar] [CrossRef]
  16. Jakob, M. Why carbon leakage matters and what can be done against it. One Earth 2021, 4, 609–614. [Google Scholar] [CrossRef]
  17. Rossetto, D. The carbon border adjustment mechanism: What does it mean for steel recycling? Sustain. Horiz. 2023, 5, 100048. [Google Scholar] [CrossRef]
  18. Rossetto, D. The long-term feasibility of border carbon mechanisms: An analysis of measures proposed in the European Union and the United States and the steel production sector. Sustain. Horiz. 2023, 6, 100053. [Google Scholar] [CrossRef]
  19. Hofbauer, J.; Sigmund, K. Evolutionary Games and Population Dynamics; Cambridge University Press: Cambridge, UK, 1998. [Google Scholar]
  20. Liu, Z.; Qian, Q.; Hu, B.; Shang, W.-L.; Li, L.; Zhao, Y.; Zhao, Z.; Han, C. Government regulation to promote coordinated emission reduction among enterprises in the green supply chain based on evolutionary game analysis. Resour. Conserv. Recycl. 2022, 182, 106290. [Google Scholar] [CrossRef]
  21. Wang, J.; Qin, Y.; Zhou, J. Incentive policies for prefabrication implementation of real estate enterprises: An evolutionary game theory-based analysis. Energy Policy 2021, 156, 112434. [Google Scholar] [CrossRef]
  22. Ma, L.; Zhang, L. Evolutionary game analysis of construction waste recycling management in China. Resour. Conserv. Recycl. 2020, 161, 104863. [Google Scholar] [CrossRef]
  23. Gu, R.; Guo, J.; Huang, Y.; Wu, X. Impact of the EU carbon border adjustment mechanism on economic growth and resources supply in the BASIC countries. Resour. Policy 2023, 85, 104034. [Google Scholar] [CrossRef]
  24. Lin, B.; Zhao, H. Evaluating current effects of upcoming EU Carbon Border Adjustment Mechanism: Evidence from China’s futures market. Energy Policy 2023, 177, 113573. [Google Scholar] [CrossRef]
  25. Qi, S.; Xu, Z.; Yang, Z. China’s carbon allowance allocation strategy under the EU carbon border adjustment mechanism: An integrated non-parametric cost frontier approach. Sci. Total Environ. 2022, 831, 154908. [Google Scholar] [CrossRef] [PubMed]
  26. Yang, C.; Yan, X. Impact of carbon tariffs on price competitiveness in the era of global value chain. Appl. Energy 2023, 336, 120805. [Google Scholar] [CrossRef]
  27. Yu, Y.Y.; Liu, L.J.; Wang, H.J. Who is most affected by carbon tax? Evidence from Chinese residents in the context of aging. Energy Policy 2024, 185, 113956. [Google Scholar] [CrossRef]
  28. Naef, A. The impossible love of fossil fuel companies for carbon taxes. Ecol. Econ. 2024, 217, 108045. [Google Scholar] [CrossRef]
  29. Wang, Z.J.; Zhou, R.F.; Ma, Y.F.; Wang, Y.J. Carbon tax and low-carbon credit: Which policy is more beneficial to the capital-constrained manufacturer’s remanufacturing activities? Environ. Res. 2024, 246, 118079. [Google Scholar] [CrossRef] [PubMed]
  30. Lamb, W.F.; Antal, M.; Bohnenberger, K.; Brand-Correa, L.I.; Müller-Hansen, F.; Jakob, M.; Minx, J.C.; Raiser, K.; Williams, L.; Sovacool, B.K. What are the social outcomes of climate policies? A systematic map and review of the ex-post literature. Environ. Res. Lett. 2020, 15, 113006. [Google Scholar] [CrossRef]
  31. Von Neumann, J.; Morgenstern, O. Theory of Games and Economic Behavior, 2nd ed.; Princeton University Press: Princeton, NJ, USA, 1947. [Google Scholar]
  32. Zhou, W.; Zhao, T.; Cao, X.; Li, J. Government regulation, horizontal coopetition, and low-carbon technology innovation: A tripartite evolutionary game analysis of government and homogeneous energy enterprises. Energy Policy 2024, 184, 113844. [Google Scholar] [CrossRef]
  33. Meng, L.; Liu, K.; He, J.; Han, C.; Liu, P. Carbon emission reduction behavior strategies in the ship** industry under government regulation: A tripartite evolutionary game analysis. J. Clean. Prod. 2022, 378, 134556. [Google Scholar] [CrossRef]
  34. Yuan, M.; Li, Z.; Li, X.; Li, L.; Zhang, S.; Luo, X. How to promote the sustainable development of prefabricated residential buildings in China: A tripartite evolutionary game analysis. J. Clean. Prod. 2022, 349, 131423. [Google Scholar] [CrossRef]
  35. Zhang, C.; Zhang, X. Evolutionary game analysis of air pollution co-investment in emission reductions by steel enterprises under carbon quota trading mechanism. J. Environ. Manag. 2022, 317, 115376. [Google Scholar] [CrossRef]
  36. Liu, Y.; Cui, M.; Gao, X. Building up scrap steel bases for perfecting scrap steel industry chain in China: An evolutionary game perspective. Energy 2023, 278, 127742. [Google Scholar] [CrossRef]
  37. Zhang, Y.; He, Q. Evolutionary game analysis and computer simulation of iron ore price negotiation. In Proceedings of the 2013 6th International Conference on Information Management, Innovation Management and Industrial Engineering, Xi’an, China, 23–24 November 2013; Volume 1, pp. 409–412. [Google Scholar]
  38. Lin, M.; Liu, S.Q.; Luo, K.; Burdett, R. Dynamic incentives to promote green production of the iron and steel industry in the post-pandemic period. Ann. Oper. Res. 2023, 1–37. [Google Scholar] [CrossRef]
  39. Han, S. Strongly robust equilibrium and competing-mechanism games. J. Econ. Theory 2007, 137, 610–626. [Google Scholar] [CrossRef]
  40. Hu, J. Synergistic effect of pollution reduction and carbon emission mitigation in the digital economy. J. Environ. Manag. 2023, 337, 117755. [Google Scholar] [CrossRef] [PubMed]
  41. Muslemani, H.; Liang, X.; Kaesehage, K.; Ascui, F.; Wilson, J. Opportunities and challenges for decarbonizing steel production by creating markets for ‘green steel’products. J. Clean. Prod. 2021, 315, 128127. [Google Scholar] [CrossRef]
  42. Uyarra, E.; Shapira, P.; Harding, A. Low carbon innovation and enterprise growth in the UK: Challenges of a place-blind policy mix. Technol. Forecast. Soc. Chang. 2016, 103, 264–272. [Google Scholar] [CrossRef]
  43. Zhang, Z.; Shang, Y.; Zhang, G.; Shao, S.; Fang, J.; Li, P.; Song, S. The pollution control effect of the atmospheric environmental policy in autumn and winter: Evidence from the daily data of Chinese cities. J. Environ. Manag. 2023, 343, 118164. [Google Scholar] [CrossRef] [PubMed]
  44. Xu, S.; Tang, H.; Lin, Z.; Lu, J. Pricing and sales-effort analysis of dual-channel supply chain with channel preference, cross-channel return and free riding behavior based on revenue-sharing contract. Int. J. Prod. Econ. 2022, 249, 108506. [Google Scholar] [CrossRef]
  45. Schreurs, M.A.; Economy, E. (Eds.) The Internationalization of Environmental Protection; Cambridge University Press: Cambridge, UK, 1997. [Google Scholar]
  46. Gaines, S.E. Rethinking Environmental Protection, Competitiveness, and International Trade. Univ. Chic. Lagal Forum 1997, 1997, 9. [Google Scholar]
  47. Weiss, E.B.; Jacobson, H.K. (Eds.) Engaging Countries: Strengthening Compliance with International Environmental Accords; MIT Press: Cambridge, MA, USA, 2000. [Google Scholar]
  48. Ekins, P.; Speck, S. Competitiveness and exemptions from environmental taxes in Europe. Environ. Resour. Econ. 1999, 13, 369–396. [Google Scholar] [CrossRef]
  49. Liang, Q.M.; Wang, T.; Xue, M.M. Addressing the competitiveness effects of taxing carbon in China: Domestic tax cuts versus border tax adjustments. J. Clean. Prod. 2016, 112, 1568–1581. [Google Scholar] [CrossRef]
  50. Landrigan, P.J.; Fuller, R. Environmental pollution: An enormous and invisible burden on health systems in low-and middle-income counties. World Hosp. Health Serv. 2012, 50, 35. [Google Scholar]
  51. National Research Council. Hidden Costs of Energy: Unpriced Consequences of Energy Production and Use; National Academies Press: Washington, DC, USA, 2010. [Google Scholar]
  52. Nilsson, U.S.; Uggla, C.; Wainwright, J. A dynamical systems approach to geodesics in Bianchi cosmologies. Gen. Relativ. Gravit. 2000, 32, 1319–1343. [Google Scholar] [CrossRef]
  53. Lyapunov, A.M. The general problem of the stability of motion. Int. J. Control 1992, 55, 531–534. [Google Scholar] [CrossRef]
  54. Ritzberger, K.; Weibull, J.W. Evolutionary selection in normal-form games. Econom. J. Econom. Soc. 1995, 63, 1371–1399. [Google Scholar] [CrossRef]
  55. Chen, G. Impact of carbon border adjustment mechanism on China’s manufacturing sector: A dynamic recursive CGE model based on an evolutionary game. J. Environ. Manag. 2023, 347, 119029. [Google Scholar] [CrossRef] [PubMed]
  56. Jiang, S.; Wei, X.; Jia, J.; Ma, G. Toward sustaining the development of green residential buildings in China: A tripartite evolutionary game analysis. Build. Environ. 2022, 223, 109466. [Google Scholar] [CrossRef]
  57. Lin, B.; Zhang, A. Government subsidies, market competition and the TFP of new energy enterprises. Renew. Energy 2023, 216, 119090. [Google Scholar] [CrossRef]
  58. Chu, Z.; Bian, C.; Yang, J. Air pollution regulations in China: A policy simulation approach with evolutionary game. Problemy Ekorozwoju 2022, 17, 222–233. [Google Scholar] [CrossRef]
  59. Mörsdorf, G. A simple fix for carbon leakage? Assessing the environmental effectiveness of the EU carbon border adjustment. Energy Policy 2022, 161, 112596. [Google Scholar] [CrossRef]
  60. Tsai, I.C. Impact of proximity to thermal power plants on housing prices: Capitalizing the hidden costs of air pollution. J. Clean. Prod. 2022, 367, 132982. [Google Scholar] [CrossRef]
  61. Wang, X.; Zhu, L. How does export VAT rebates policy affect corporate investment efficiency? Evidence from corporate tax stickiness. Pac.-Basin Financ. J. 2023, 82, 102130. [Google Scholar] [CrossRef]
  62. Chang, K.; Long, Y.; Yang, J.; Zhang, H.; Xue, C.; Liu, J. Effects of subsidy and tax rebate policies on green firm research and development efficiency in China. Energy 2022, 258, 124793. [Google Scholar] [CrossRef]
  63. Li, F.; Xu, X.; Li, Z.; Du, P.; Ye, J. Can low-carbon technological innovation truly improve enterprise performance? The case of Chinese manufacturing companies. J. Clean. Prod. 2021, 293, 125949. [Google Scholar] [CrossRef]
  64. Li, X. Study on the impact of energy rebound effect on carbon emission reduction at different stages of urbanization in China. Ecol. Indic. 2021, 120, 106983. [Google Scholar] [CrossRef]
  65. Chen, P.; Liu, X.; Wang, Q.; Zhou, P. The implications of competition on strategic inventories considering manufacturer-to-consumer rebates. Omega 2022, 107, 102541. [Google Scholar] [CrossRef]
  66. Yan, H.E.; Guo, F.; Zhang, B.; Chan, Y.K.; Zhou, H.; Sun, L.; He, T.; Tang, J.; Chen, H.; Tan, W.; et al. Sustainability assessment during machining processes: Evidence from the econ-environmental modelling. J. Clean. Prod. 2024, 448, 141612. [Google Scholar] [CrossRef]
  67. Raudla, R.; Douglas, J.W.; Savi, R.; Randma-Liiv, T. Fiscal crisis and expenditure cuts: The influence of public management practices on cutback strategies in Europe. Am. Rev. Public Adm. 2017, 47, 376–394. [Google Scholar] [CrossRef]
  68. Zhou, K.; Qu, Z.; Wei, Z.; Zhao, J. Does government fiscal pressure matter for firm environmental performance? The role of environmental regulation and tax competition. Econ. Anal. Policy 2023, 80, 1187–1204. [Google Scholar] [CrossRef]
  69. Wang, X.; Han, S. Optimal operation and subsidies/penalties strategies of a multi-period hybrid system with uncertain return under cap-and-trade policy. Comput. Ind. Eng. 2020, 150, 106892. [Google Scholar] [CrossRef]
  70. Gu, Y.; Liu, W.; Wang, B.; Tian, B.; Yang, X.; Pan, C. Analysis and Prediction of Energy, Environmental and Economic Potentials in the Iron and Steel Industry of China. Processes 2023, 11, 3258. [Google Scholar] [CrossRef]
Figure 1. Logical relationships between stakeholders.
Sustainability 16 03113 g001
Figure 2. Methodological design diagram.
Sustainability 16 03113 g002
Figure 3. A tripartite pure strategy game tree.
Sustainability 16 03113 g003
Figure 4. Evolutionary process during the window stage. (a) Window stage evolution path; (b) trends in window stage evolution.
Sustainability 16 03113 g004
Figure 5. Transition phase evolutionary process. (a) Transition phase evolutionary path; (b) evolutionary trends in the transition phase.
Sustainability 16 03113 g005
Figure 6. Evolution of the implementation phase. (a) Implementation phase evolution path; (b) trends in the evolution of implementation phases.
Sustainability 16 03113 g006
Figure 7. Enhanced stage evolutionary process. (a) Reinforcement phase evolutionary path; (b) trends in the evolution of the enhancement phase.
Sustainability 16 03113 g007
Figure 8. Simulation of system evolution trajectories under different O values.
Sustainability 16 03113 g008
Figure 9. Illustration of the evolution of the behaviors of the three parties under different levels of free riding benefits. (a) Impacts of evolutionary outcomes of different O values on x; (b) impacts of evolutionary outcomes of different O values on y; (c) impacts of evolutionary outcomes of different O values on z; (d) O’s impact on game participants.Impact of changes in export volumes.
Sustainability 16 03113 g009aSustainability 16 03113 g009b
Figure 10. Simulation trajectories of the system under different l conditions.
Sustainability 16 03113 g010
Figure 11. The Evolution of Tripartite Behavior under Different Export Volumes. (a) Impacts of evolutionary outcomes of different l conditions on x; (b) impacts of evolutionary outcomes of different l conditions on y; (c) impacts of evolutionary outcomes of different l conditions on z; (d) Different l conditions’ impacts on evolutionary outcomes.
Sustainability 16 03113 g011aSustainability 16 03113 g011b
Figure 12. Simulation of system evolution trajectories under different CPs.
Sustainability 16 03113 g012
Figure 13. Evolution of trilateral behavior under different carbon prices in China. (a) Impact of CP on x evolution; (b) impact of CP on y evolution; (c) impact of CP on z evolution; (d) impact of CP on participant evolution.
Sustainability 16 03113 g013
Figure 14. Simulation trajectories of the system under different b scenarios.
Sustainability 16 03113 g014
Figure 15. Evolution of trilateral behavior under different EU free carbon allowance scenarios. (a) Different b scenarios’ effects on the evolution of x; (b) different b scenarios’ effects on the evolution of y; (c) different b scenarios’ effects on the evolution of z; (d) impact of b on participant evolution.
Sustainability 16 03113 g015
Figure 16. Simulation of system evolution trajectories under dynamic subsidies.
Sustainability 16 03113 g016
Figure 17. Evolution of the behavior of the three parties under dynamic subsidies. (a) x’s evolution under dynamic subsidies; (b) y’s evolution under dynamic subsidies; (c) z’s evolution under dynamic subsidies; (d) evolution of game entities under dynamic subsidies.
Sustainability 16 03113 g017
Table 1. CBAM-oriented government–business tripartite game benefits matrix.
Game ParticipantsGovernments
Proactive Response (z)Passive Management (1 − z)
Small- and Medium-Sized Enterprises 2
Low-Carbon Upgrading (y)Traditional Production (1 − y)Low-Carbon Upgrading (y)Traditional Production (1 − y)
Large steel companies 1Low-carbon upgrading (x) V G E 1 E 2 C G 2 g ( x ) ( 1 + α ) V 1 δ C 1 + g ( x ) t 1 + E 1 ( 1 + β ) V 2 δ C 2 + g ( x ) t 2 + E 2 V G E 1 C G g ( x ) + R ( x ) F ( 1 + α ) V 1 C 1 + L + g ( x ) t 1 + E 1 V 2 + O 2 T 2 R ( x ) 0 ( 1 + α ) V 1 c 1 t 1 ( 1 + β ) V 2 c 2 t 2 F ( 1 + α ) V 1 C 1 + L t 1 V 2 + O 2 T 2
traditional production
(1 − x)
V G E 2 C G g ( x ) + R ( x ) F V 1 + O 1 T 1 R ( x ) ( 1 + β ) V 2 C 2 + L t 2 + g ( x ) + E 2 V G C G + 2 R ( x ) F V 1 T 1 R ( x ) V 2 T 2 R ( x ) F V 1 + O 1 T 1 ( 1 + β ) V 2 C 2 + L t 2 F V 1 T 1 V 2 T 2
Table 2. Jacobian matrix eigenvalues.
Equilibrium Point Eigenvalue   λ 1 Eigenvalue   λ 2 Eigenvalue   λ 3
P 1 ( 0 , 0 , 0 ) α V 1 C 1 + L t 1 + T 1 β V 2 C 2 + L t 2 + T 2 F
P 2 ( 1 , 0 , 0 ) ( α V 1 C 1 + L t 1 + T 1 ) β V 2 t 2 + T 2 δ C 2 O 2 F ( E 1 + g ( x ) + R ( x ) )
P 3 ( 0 , 0 , 1 ) α V 1 C 1 + L t 1 + T 1 + E 1 + g ( x ) + R ( x ) β V 2 C 2 + L t 2 + T 2 + E 2 + g ( x ) + R ( x ) F
P 4 ( 1 , 0 , 1 ) ( α V 1 C 1 + L t 1 + T 1 + g ( x ) + R ( x ) + E 1 ) β V 2 δ C 2 t 2 + T 2 O 2 + g ( x ) + R ( x ) + E 2 [ F ( E 1 + g ( x ) + R ( x ) ) ]
P 5 ( 0 , 1 , 0 ) α V 1 δ C 1 t 1 + T 1 O 1 ( β V 2 C 2 + L t 2 + T 2 ) F ( E 2 + g ( x ) + R ( x ) )
P 6 ( 1 , 1 , 0 ) ( α V 1 δ C 1 t 1 + T 1 O 1 ) ( β V 2 δ C 2 t 2 + T 2 O 2 ) F ( E 1 + g ( x ) + R ( x ) ) ( E 2 + g ( x ) + R ( x ) )
P 7 ( 0 , 1 , 1 ) α V 1 δ C 1 + T 1 t 1 O 1 + E 1 + R ( x ) + g ( x ) ( β V 2 C 2 + L t 2 + T 2 + g ( x ) + R ( x ) + E 2 ) [ F ( E 2 + g ( x ) + R ( x ) ) ]
P 8 ( 1 , 1 , 1 ) ( α V 1 t 1 + T 1 δ C 1 O 1 + g ( x ) + R ( x ) + E 1 ) ( β V 2 t 2 + T 2 δ C 2 O 2 + g ( x ) + R ( x ) + E 2 ) [ F ( E 1 + g ( x ) + R ( x ) ) ( E 2 + g ( x ) + R ( x ) ) ]
Table 3. Equilibrium point stabilization conditions.
Equilibrium PointStabilityStability Conditions
P 1 ( 0 , 0 , 0 ) saddle point-
P 2 ( 1 , 0 , 0 ) ESS β V 2 t 2 + T 2 δ C 2 O 2 < 0 α V 1 C 1 + L t 1 + T 1 > 0 F < E 1 + g ( x ) + R ( x )
P 3 ( 0 , 0 , 1 ) ESS α V i C i + L t i + T i + E i + g ( x ) + R ( x ) < 0 β V 2 C 2 + L t 2 + T 2 + E 2 + g ( x ) + R ( x ) < 0
P 4 ( 1 , 0 , 1 ) ESS α V 1 C 1 + L t 1 + T 1 + g ( x ) + R ( x ) + E 1 > 0 β V 2 δ C 2 t 2 + T 2 O 2 + g ( x ) + R ( x ) + E 2 < 0 F > E 1 + g ( x ) + R ( x )
P 5 ( 0 , 1 , 0 ) ESS α V 1 δ C 1 t 1 + T 1 O 1 < 0 β V 2 C 2 + L t 2 + T 2 > 0 F < ( E 2 + g ( x ) + R ( x ) )
P 6 ( 1 , 1 , 0 ) ESS α V 1 δ C 1 t 1 + T 1 O 1 > 0 β V 2 δ C 2 t 2 + T 2 O 2 > 0 F < ( E 1 + g ( x ) + R ( x ) ) + ( E 2 + g ( x ) + R ( x ) )
P 7 ( 0 , 1 , 1 ) ESS α V 1 δ C 1 + T 1 t 1 O 1 + E 1 + R ( x ) + g ( x ) < 0 β V 2 C 2 + L t 2 + T 2 + g ( x ) + R ( x ) + E 2 > 0 F > E 2 + g ( x ) + R ( x )
P 8 ( 1 , 1 , 1 ) ESS α V 1 t 1 + T 1 δ C 1 O 1 + g ( x ) + R ( x ) + E 1 > 0 β V 1 t 1 + T 1 δ C 1 O 1 + g ( x ) + R ( x ) + E 1 > 0 F ( E 1 + g ( x ) + R ( x ) ) ( E 2 + g ( x ) + R ( x ) ) > 0
Table 4. Parameter assignment table.
Parameter ValueWindow StageTransition PhaseImplementation PhaseIntensive Phase
V115151515
V210101012
α0.350.350.350.35
β0.250.250.250.25
C112121212
C210101010
δ0.750.750.750.75
e0.40.40.50.5
g2233
r3344
Oi3532
L5544
N115151414
N212101010
M18888
M26666
ES6666
b10.90.50
EP1111
CP0.0830.0830.0830.083
l1112
Vg10101010
Cg6666
F58158
E14444
E23333
Disclaimer/Publisher’s Note: The statements, opinions and data contained in all publications are solely those of the individual author(s) and contributor(s) and not of MDPI and/or the editor(s). MDPI and/or the editor(s) disclaim responsibility for any injury to people or property resulting from any ideas, methods, instructions or products referred to in the content.

