Article

Abolishing Single-Use Plastic Water Bottles in Dubai Hotels as a Voluntary Act—Scenarios and Environmental Impacts

by
Sameh Al-Shihabi
1,*,
Ridvan Aydin
1,
Zehra Canan Araci
1,
Fikri Dweiri
1,
Mohammed Obeidat
2 and
Mohammad Fayez Al Bataineh
3,4
1
Industrial Engineering and Engineering Management Department, University of Sharjah, Sharjah P.O. Box 27272, United Arab Emirates
2
Department of Industrial Engineering, Faculty of Engineering, Jordan University of Science and Technology, Irbid 22110, Jordan
3
Electrical and Communication Engineering Department, College of Engineering, United Arab Emirates University, Al Ain P.O. Box 15551, United Arab Emirates
4
Telecommunications Engineering Department, Hijjawi Faculty for Engineering Technology, Yarmouk University, Irbid 21163, Jordan
*
Author to whom correspondence should be addressed.
Sustainability 2024, 16(8), 3121; https://doi.org/10.3390/su16083121
Submission received: 28 February 2024 / Revised: 4 April 2024 / Accepted: 5 April 2024 / Published: 9 April 2024
(This article belongs to the Special Issue Advances in Sustainable Manufacturing and Supply Chains Management)

Abstract

:
Dubai, a popular vacation spot, has launched an initiative to reduce reliance on single-use plastic water bottles. Tourists in Dubai widely utilize PET (Polyethylene Terephthalate) water bottles, and significant quantities of greenhouse gases (GHG) are released during the production and disposal of PET bottles. In response to Dubai’s initiative, some hotels eliminated PET bottles and substituted them with environmentally favorable alternatives. These hotels are considered adopters of the initiative, while other hotels that might follow are imitators. Thus, innovation diffusion theory (IDT) is used in this work to forecast the transition of hotels to non-PET bottles. The diffusion of this new behavior is simulated using a system dynamic (SD) model, where factors pushing imitators to abolish PET bottles are found using the Delphi method and hotel surveying. Moreover, the importance of each identified factor is found using an analytical hierarchical process (AHP). Since hotels are divided into several categories based on their service quality, the analysis shows that hotels are affected by other hotels in their category or better categories. Using this conceptual understanding, Bass and generalized Bass modeling are used in the SD model to study how imitating hotels will follow the adopters. Best-, average-, and worst-case scenarios are studied to help decision-makers understand what to expect in the future. For the best- and average-case scenarios, the SD simulation shows that all hotels will potentially have abolished PET bottles in 25 years. However, only 16% of hotels will have cancelled PET bottles in 25 years if the worst-case scenario occurs; thus, decision-makers need to intervene to expedite the process.

1. Introduction

Despite the fact that plastic misuse and overuse pollute the environment worldwide, plastic production is rising [1]. The world produced 391 million tons of plastic in 2021 [2], and more than 1100 million tons of plastics will be produced annually by 2050. Plastics account for 15% of the annual greenhouse gas (GHG) emissions allowed if we are to prevent global temperatures rising by 1.5 °C [3]. In addition to there being GHG emissions associated with plastics, plastics do not easily decompose naturally [4] and contain various toxic components [5]. Moreover, micro-plastics (1–5 µm) and nanoplastics (<1 µm) permit translocation via biological membranes, making them potentially more hazardous than larger-sized plastics [1].
Plastics are generally made from synthetic polymers such as polyethylene (used in plastic bags); polystyrene (used to make Styrofoam cups); polypropylene (used for fibers and bottles); and polyvinyl chloride (used for food wrap, bottles, and drain pipes) [4]. Polyethylene Terephthalate (PET) is another plastic frequently used to make bottles, and PET bottles account for 67% of bottles in the beverage market [6].
PET is the preferred material for water bottles because it is inexpensive to produce, transparent, and carbon dioxide resistant [7]; however, PET bottles create many negative environmental impacts due to their short useful life, large quantities of production, and prolonged decomposition process [8]. There is substantial energy consumption and greenhouse gas (GHG) emission during the PET manufacturing process [9]. Moreover, water left in PET bottles that have been disposed of in landfills provides mosquitoes, which can spread diseases like yellow fever and malaria, with the perfect breeding ground [10]. Reducing the consumption of PET has a better impact on the environment than recycling or incineration [11].
For the Gulf Cooperation Council (GCC) countries, which include Bahrain, Kuwait, Oman, Qatar, Saudi Arabia, and the United Arab Emirates (UAE), drinking water from single-use plastic bottles is typical [12], especially in the hospitality sector [13]. Even though tap water is potable [14], drinking bottled water is the norm among UAE citizens [15]. The yearly individual consumption of bottled water in the UAE exceeds 285 liters (L) [16]. The UAE banned single-use plastic shopping bags on 1 January 2024 [17]. Nevertheless, no similar law banning the use of single-use water bottles was adopted. In contrast to the approach used to abolish single-use plastic bags, efforts were undertaken to promote the abandoning of single-use plastic bottles among residents of the UAE without legally mandating stopping their usage or establishing deadlines.
The Dubai Can initiative was launched in February 2022 to encourage Dubai residents to stop using plastic water bottles in the city. “One Little Change, One Huge Impact” is the slogan of the initiative. In pursuit of this objective, the initiative focuses on three fronts: (i) encouraging everyone to use refillable water bottles, (ii) installing water stations in Dubai, and (iii) raising environmental awareness about the harmful effects of plastics.
The hospitality sector heavily relies on PET bottles, as discussed earlier, and, in 2018, Dubai ranked fourth in terms of tourism popularity, with over 16.66 million visitors [18]. In 2023, Dubai welcomed 17.15 million visitors [19]. On average, 86.5% of tourists stay four nights in a hotel or furnished apartment in Dubai [20].
Based on the moderate assumption that hotel-dwelling tourists will only consume 2 L of water per day, it is estimated that hotel-dwelling tourists drank at least 130 million liters of PET-bottled water in 2023. In [21], it was shown that 1.5 L bottles consume the least PET, 21.73 g/L; thus, at least 2827 tons of PET needs to be manufactured to satisfy the demand for PET bottles by tourists. The production of 2827 tons of PET material generates 5112 MtCO2e, and the incineration of this mass of PET generates 4739 MtCO2e, according to the EPA (2022) [22]. It takes a PET bottle 450 years to degrade naturally [23]; thus, landfilling is not an option in the long run, mainly because Dubai aims to end the use of landfills [24].
Few hotels have abandoned PET bottles since the launch of the Dubai Can initiative [25]. Alongside this shift, multiple water drinking stations were installed in popular tourist areas in Dubai, enabling locals and visitors to utilize reusable water bottles [26]. The government of Dubai and the hotels that reacted to the Dubai Can initiative have taken steps that could set off a chain reaction that would eliminate PET bottles entirely in hotels and reduce greenhouse gas emissions [27].
The literature is replete with research articles concerning the management of plastic waste in general [28,29,30] and PET waste management [6,31,32] specifically. Researchers have examined PET management in the packaging industry, e.g., [33,34]; however, most of these studies did not consider behavioral changes by PET users. For instance, the technical aspects of recycling PET bottles are examined, e.g., in [6], without considering the consumers’ opinions. Furthermore, without considering consumer references, the environmental impacts and costs of PET bottles were compared to those of glass refillable bottles in the hospitality industry in Northern Italy [13] and to those of non-alcoholic beverages in California [35]. Research that examined PET consumers’ viewpoints did not take into account the hospitality sector or behavioral shifts over time, e.g., [36,37].
The main objective of this research is to give decision-makers a forecasting tool to examine the hotels’ long-term responses to the Dubai Can initiative. Traditional forecasting methods such as causal and time series forecasting [38], as well as machine learning [39], are well suited for predicting consumption. Nevertheless, the substitution of PET water bottles with more eco-friendly alternatives represents an adoption process [40]. A population member decides to adopt an innovation during the adoption process; this transition from non-adopter to adopter is typically modeled as irreversible [40]. Moreover, the adoption rate depends on the population percentage that has already adopted the new behavior [41]. The number of adopters increases over time, approaching a saturation level as an asymptote [40,41], which makes it a good choice for medium- and long-range projections [40]. For this reason, adoption processes have been used to model the adoption of several new technologies, like internet banking [42], Twitter hashtags [43], and AI applications [44]. Several review papers discussed the various applications of diffusion models [45,46].
In this study, the hotels’ decision to replace PET bottles with sustainable alternatives is consistent with two fundamental assumptions that underpin diffusion models: first, the notion that transitions are irreversible, and, second, the expectation that the rate of adoption is proportional to the percentage of current adopters. Consequently, a diffusion model is used in this work. Moreover, diffusion models have been recently applied to predict the responses of populations to novel sustainable products or energy sources. Such studies include the adoption of renewable energy sources by hotels in Australia [47]; the transition of Greeks from fossil fuels to biomass as a heating source [48]; the utilization of photovoltaic power sources by residents in Germany [49]; and the transition of car owners in California to electric vehicles [50].
The developed forecasting model is expected to provide decision-makers with vital information, like the percentage of hotels that have abolished PET bottles at each time point. The model will also provide decision-makers with a better understanding of the GHG emission reduction caused by the Dubai Can initiative, another objective of this work. Reducing GHG emissions is essential for the UAE’s efforts to satisfy the sustainable development goals (SDGs) [51]. Decision-makers can use such details to determine whether they need to step in and speed up the process by enacting regulations or providing incentives to hotels by comparing actual abandonment rates to forecasted ones. Since the Dubai Can initiative is still in its early stages of impact, the forecasting tool considers three adoption rates: fast, average, and slow. Moreover, decision-makers can estimate the environmental impacts of each scenario.

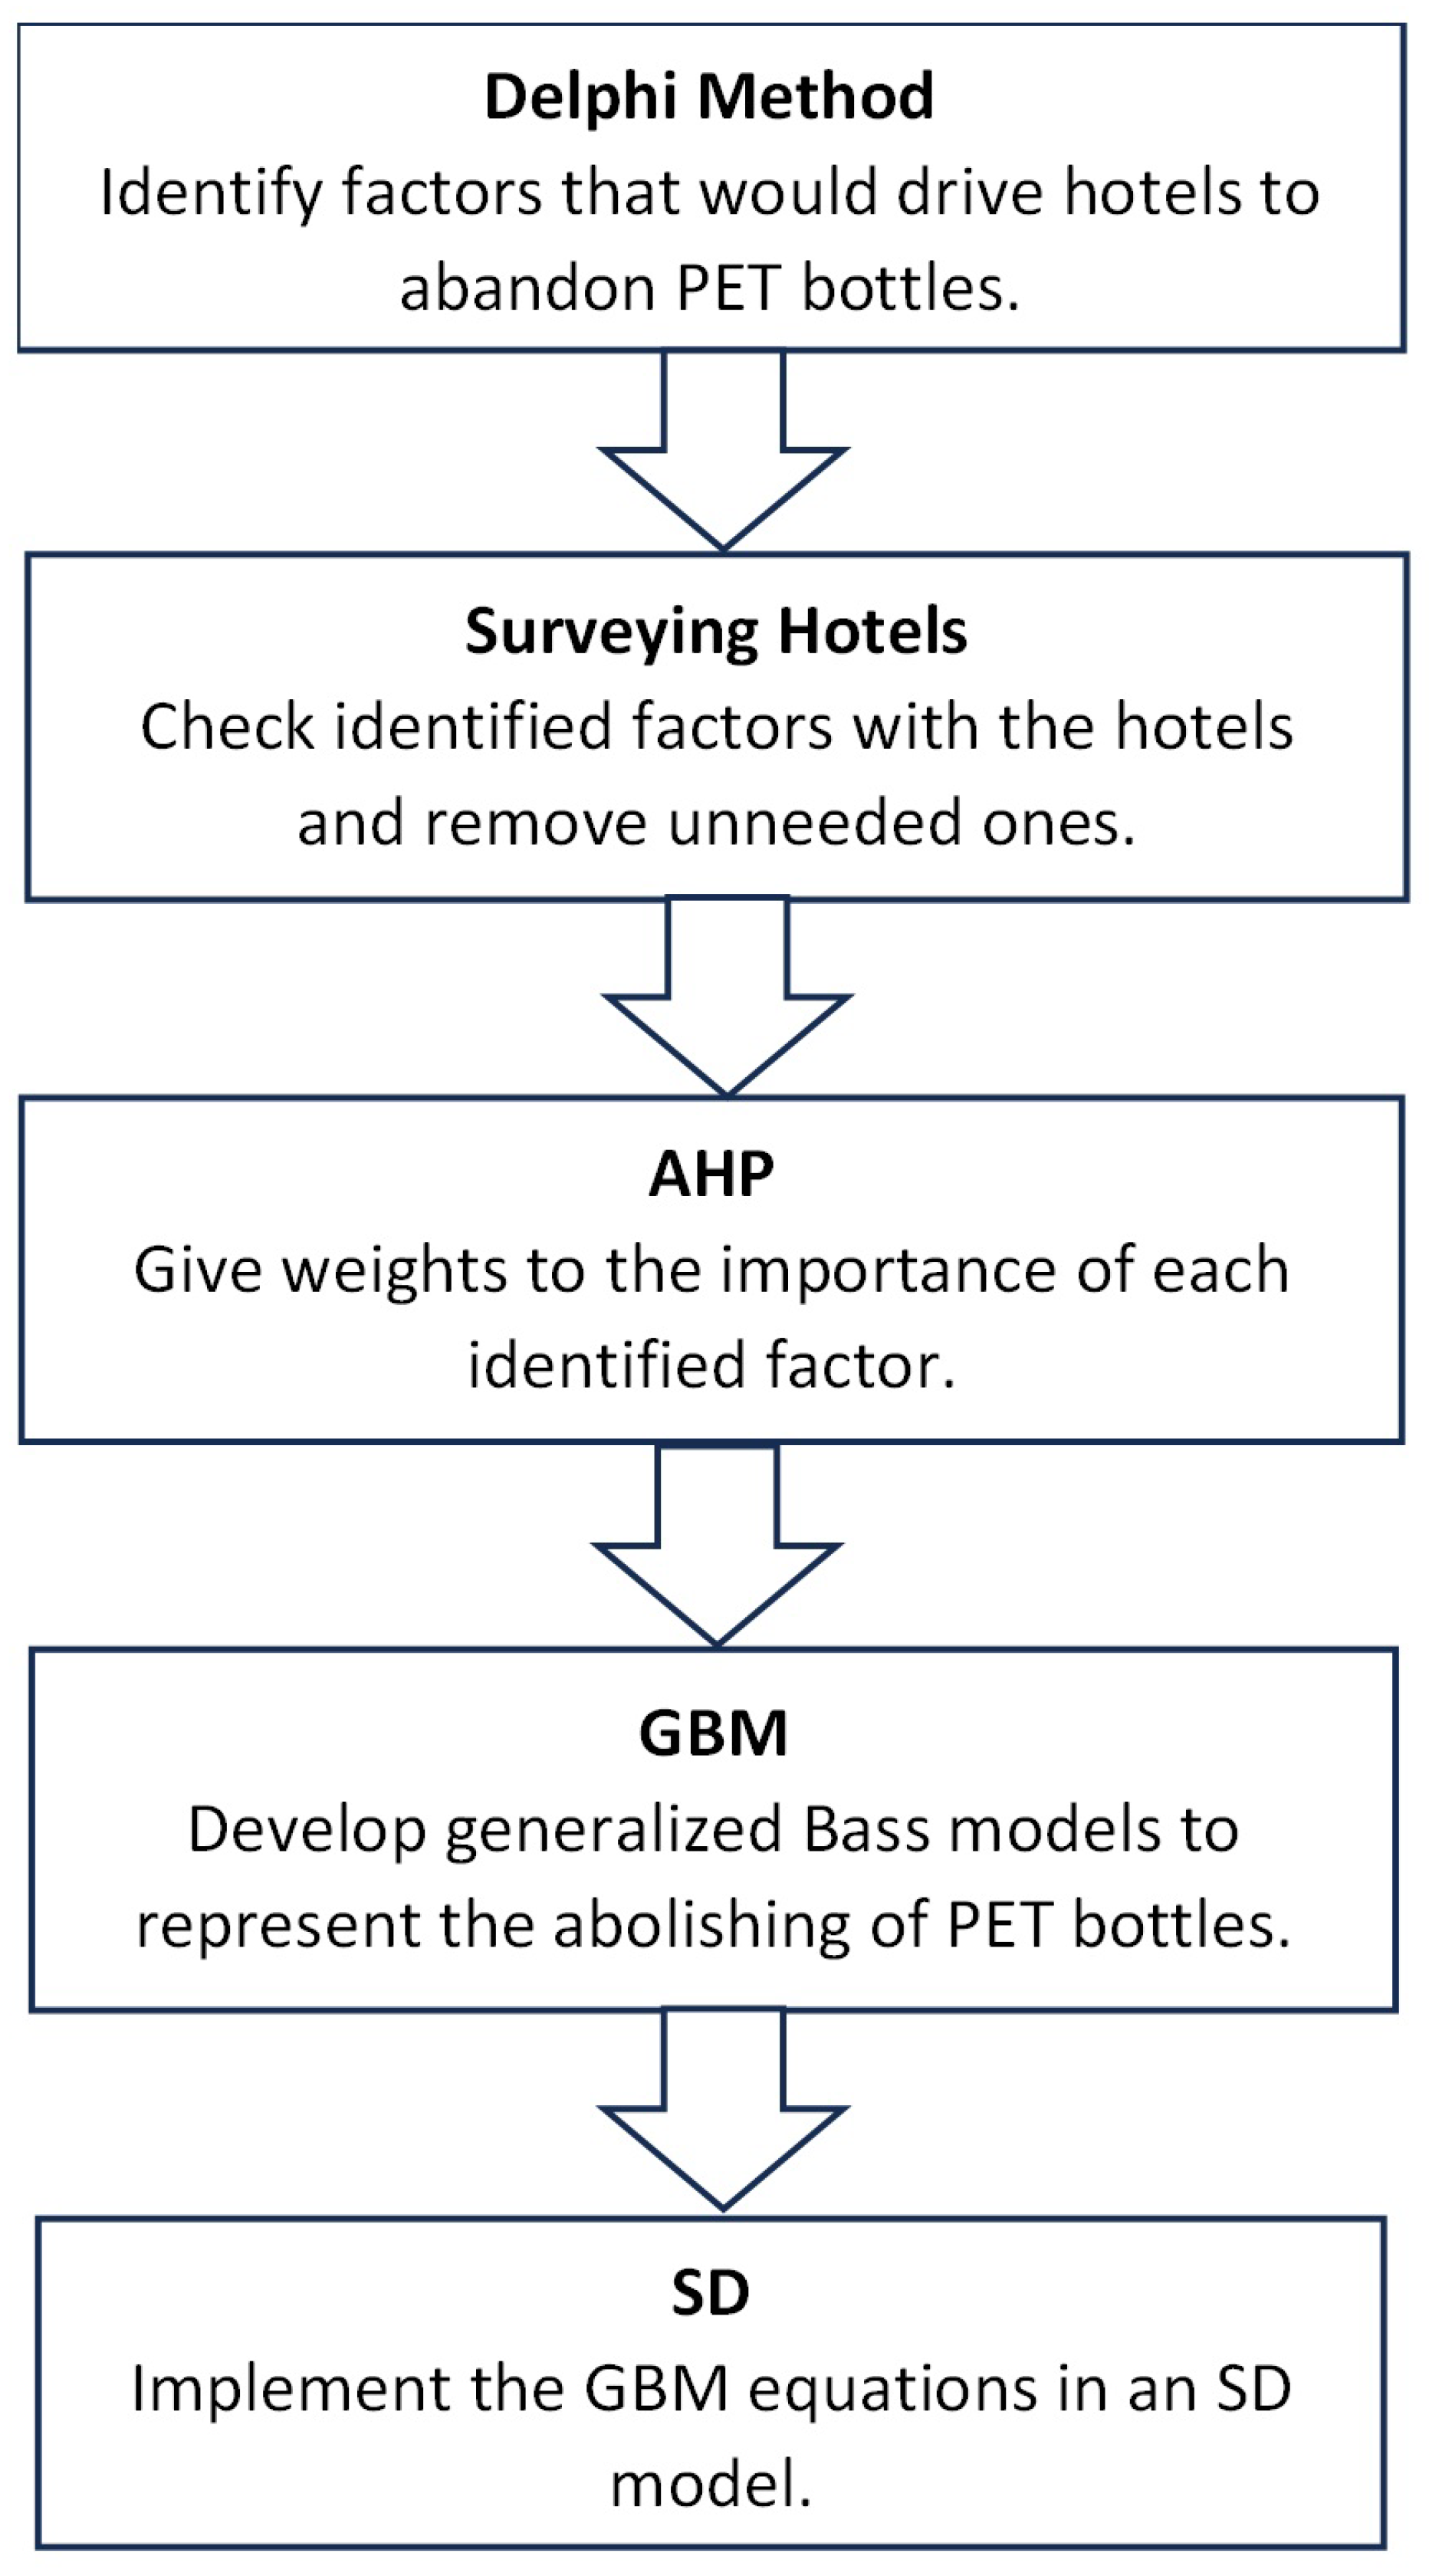
2. Materials and Methods

Several factors related to the diffusion of PET alternatives among hotels need to be understood to develop a diffusion model [52]. In this research, the following factors were analyzed:
  • Innovativeness: Individual personality traits influence the adoption or rejection of innovations [53,54]. Individuals tend to cluster based on their lifestyles [55], which further shapes their inclinations towards adopting or rejecting innovations;
  • Innovation characteristics: In the IT sector, innovation characteristics, e.g., ease of use or prices, influence the behavior of the studied community towards these innovations [56]. Recently, the characteristics of environmental innovations were also considered [57,58];
  • Communication: Communication channels and social relationships are pivotal in the diffusion of innovations [59];
  • Decision-making: Most related studies simply focus on influencing variables and implicitly assume fully rational decisions [60].
Figure 1 displays the main steps of this research. The first three steps, the Delphi method, surveying, and AHP, were conducted to analyze the factors affecting the diffusion model. The first step was to study the factors that might convince hotels relying on PET water bottles to abolish this practice. This was carried out by inviting six experts to participate in a Delphi study [61] to determine what influences hotels’ choices to phase out PET bottles. A survey was developed based on these factors to check hotels’ perspectives on these factors, and responses from 412 hotels were statistically analyzed.
Based on the statistical analysis of the hotels’ responses, important factors were retained and further analyzed using the analytical hierarchy process (AHP) [62]. This analysis was needed to weigh the factors based on their possible effects on hotels’ decisions to abolish PET bottles. Important factors were found to comply with the generalized Bass model (GMB) [63], which is an important model belonging to innovation diffusion theory (IDT) [64]. Thus, the developed conceptual model divides hotels into innovators, hotels that would abolish PET bottles by themselves, and imitators, hotels that would follow the innovators. The hotels’ transition to being non-PET users was then modeled using a system dynamic (SD) model [65]. The SD model compares several scenarios regarding their GHG emissions.

2.1. Delphi

Six experts were invited to assist in developing the idea of how hotels will react to the Dubai Can initiative. There were three professionals connected to Dubai’s hospitality industry. One of the experts was the general manager of a three-star hotel, and the other two were operational managers of two- and five-star hotels, respectively. All the experts had at least five years of experience in Dubai and ten years or more in the hospitality sector. Academics with backgrounds in marketing, sustainable tourism, and environmental sciences were the remaining three experts.
According to [66], the Delphi technique is appropriate for reaching consensus in relatively new areas; therefore, it was used to determine the factors that might influence hotels’ decisions to ban PET bottles [67]. The Delphi survey was run twice to determine the factors hotels would consider if they decided to phase out PET bottles. The six experts agreed upon the following four factors:
  • Cost: There are several options available to hotels who wish to discontinue using PET bottles. For instance, the water in Dubai is drinkable, but the hotels must maintain clean water tanks and pipelines to guarantee the safety of the tap water [17]. PET bottles are more expensive than hiring a licensed company to clean tanks and pipes. In addition, hotels have the option to add water dispensers and install drinking water filters. Travelers can request glass, metal, or Tritan bottles or jugs from hotels;
  • Peer pressure: Every hotel must adhere to the same rules that other hotels in the same category have established. As a result, other three-star hotels will follow suit if a few of them decide to stop using PET bottles;
  • Superior pressure: Not only will hotels copy one another, but they will also copy hotels that are rated more highly than themselves. In other words, four-star hotels will imitate five-star hotels more frequently as they adopt sustainable practices;
  • Tourist pressure: Visitors may be interested in using the water bottles that the hotels provide now that drinking water stations have been installed in Dubai. Also, travelers are growing more conscious of the environmental issues surrounding PET.

2.2. Surveying

A survey regarding hotels’ and hotel apartments’ opinions of the mentioned factors was conducted. As Table 1 shows, only four questions were asked in order to ensure a high response rate. Individuals could express differing degrees of agreement or disagreement by using a five-point Likert scale, which provided a fair diversity of possible answers [68]. The responses’ means and standard deviations are displayed in the last two columns of Table 1. Strong disagreement is indicated by a value of 1, and strong agreement is indicated by a value of 5. While emails were used for the majority of inquiries, a few hotels were also visited. In total, 412 hotel responses were either gathered or received.
The feedback indicates that cost is not a significant deterrent against using PET bottles. The majority of hotels are aware that cheaper alternatives to PET bottles exist. Superior and peer pressures are the primary factors that would compel hotels to discontinue the use of PET bottles.

2.3. Analytical Hierarchical Process

Pairwise comparisons are used in the AHP Multi-Criteria Decision-Making (MCDM) method to rank factors or alternatives [69]. Steps needed to conduct an AHP study are as follows:
  • Define the goal of the study: In this study, this is the ranking of factors affecting hotels’ abandonment of PET bottles;
  • Identify decision criteria, among which pairwise comparison is conducted: In this study, and after excluding cost, three criteria were compared, namely, peer, superior, and tourist pressures;
  • Choose a comparison scale to compare the identified factors, as shown in Table 2: Psychologists argue that expressing one’s preference when given only two options is easier and more accurate than when one is asked to simultaneously consider all options [70];
  • Ask experts to rank the criteria: A comparison matrix was designed and distributed among the experts to collect their opinions. Table 3 shows the comparison matrix along with some randomly generated values. For example, the expert who might have provided these illustrative values finds that the impact of peer pressure is significant compared to that of tourist pressure;
  • Aggregate expert inputs: In this study, twenty new hotel industry practitioners were asked to participate in the AHP study. Utilizing a snowball sampling technique, the three industry experts who participated in the Delphi study were asked to refer additional industry experts to participate in the AHP study [71];
  • Calculate the weights of the criteria: First, the normalized weights were found by dividing each value in the aggregated table by the sum of the associated column. For example, the sum of the peer pressure column is 6.14; thus, the normalized value of the cell representing the superior pressure and peer pressure is 0.81. The weight is found by taking the average of each row. For example, the weight of the superior pressure is 5 6.14 + 1 1.4 + 5 13 3 = 0.64 ;
  • Determine the consistency ratio (CR) to accept the results: First, the maximum eigenvalue of the aggregate comparison matrix, λ m a x , is calculated. Using λ m a x , the consistency index, CI, is calculated, ( λ m a x n )/( n 1 ), where n is the matrix size. The value of the CR is found using CI/RI, where RI is a random index that depends on the matrix size [72].
The factors were ranked and weighted as follows: peer pressure at 0.52, superior pressure at 0.37, and tourist pressure at 0.08. Furthermore, a CR < 0.1 led to the acceptance of these results [73].

2.4. Generalized Bass Model

As stated earlier, the above three analysis steps were conducted to better understand the factors affecting the diffusion model. These steps revealed the following:
  • Innovativeness: Five- and four-star hotels have higher innovativeness than lower-ranked hotels;
  • Innovation characteristics: The studied innovation, using alternatives to PET bottles, can be cheaper than the current practice of using PET water bottles;
  • Decision-making: Factors influencing hotels to abolish PET bottles are superior and peer pressures.
As for communication, it was assumed that the message of Dubai Can has been communicated to all hotels, and information about abandoning PET bottles is public. These factors and assumptions are integrated into the diffusion model developed in this research.
Diffusion models form a traditional area of research that predicts the adoption of new products [74]. Many models have been proposed, but that of Bass [75] is undoubtedly the most used for its efficiency and simplicity compared to other models [76]. In addition to modeling the adoption of new technologies, the Bass diffusion model has been used to model behavioral changes with regard to, for example, car ownership [77], new food [78], or new medicines prescribed by doctors [79]. Similarly to in [47], where Bass diffusion was used to model how hotels in Queensland, Australia, will abandon traditional and renewable energy sources, Bass diffusion was used in this work to model how hotels in Dubai will abandon the use of PET bottles and switch to refillable bottles.
The generalized Bass model (GBM) [80] is an extension to the original Bass model where external factors are included in the model, as shown in Equation (1). In Equation (1) and at time t, F ^ ( t ) shows the rate of transition from the non-adopters pool to the adopters one. The targeted population can be divided into two proportions: the proportion of adopters F ( t ) and the proportion of non-adopters 1 F ( t ) . The variable X ( t ) in Equation (1) represents the impact of external factors at time t. In addition to these time-varying variables, Equation (1) uses coefficients p and q, which show the importance of adoption and imitation, respectively.
F ^ ( t ) = ( p + q F ( t ) ) ( 1 F ( t ) ) X ( t )
Using the SD model to model a diffusion behavior requires changing rates into volumes per time, as shown in Equation (2), where P A and A are the numbers of potential adopters and adopters, respectively ([49] and [47]). On the one hand, the p × P A term in Equation (2) shows the adoption rate due to innovators, i.e., hotels that respond to the Dubai Can initiative. On the other hand, the term q × P A × A / ( P A + A ) represents the adoption rate of imitators affected by the word of mouth.
A d o p t i o n r a t e = ( p × P A + q × P A × A P A + A ) X ( t )
The AHP results indicate that peer and superior pressures will have the greatest impact on hotels’ transition to being non-PET users. These two factors account for 90% of the AHP weights. For simplicity, the other two factors are ignored. If the model only considers peer pressure, then the original Bass model can be applied, where PA in the model represents hotels that are still using PET and A represents hotels that have already abandoned PET. However, superior pressure is an external factor that necessitates the use of a GBM.
Hotels in Dubai were classified into five groups based on available data. Three groups represent 5-star, 4-star, and 1- to 3-star hotels, whereas the other two groups depict deluxe and standard hotel apartments. Thus, the subscripts h1, h2, and h3 are used to indicate hotels categorized as 5-star, 4-star, and 1–3-star accommodations, respectively. Similarly, a1 and a2 are used to denote the deluxe and standard apartments, respectively. Consequently, p h 2 is the p-coefficient of the GMB of the 4-star hotel, for example. P A a 1 and A a 1 represent the PAs and Is of the deluxe apartments, respectively.
The Bass model for 5-star hotels is represented by Equation (3), while the GBM for 4-star and 1–3-star hotels is represented by Equation (4). In Equation (4), the external variable X ( t ) represents the proportion of hotels in the higher classification category that have eliminated PET bottles. As for hotel apartments, it is assumed that deluxe apartments are subject to the superior pressure of five-star hotels, as demonstrated by Equation (5), while deluxe apartments are superior to standard apartments, as demonstrated by Equation (6).
A d o p t i o n n u m b e r h 1 = p h 1 × P A h 1 + q h 1 × P A h 1 × A h 1 P A h 1 + A h 1
A d o p t i o n n u m b e r h i = [ p h i × P A h i + q h i × P A h i × A h i P A h i + A h i ] × A ( h i 1 ) P A ( h i 1 ) + A ( h i 1 )
A d o p t i o n n u m b e r a 1 = [ p a 1 × P A a 1 + q a 1 × P A a 1 × A a 1 P A a 1 + A a 1 ] × A h 1 P A h 1 + A h 1
A d o p t i o n n u m b e r a 2 = [ p a 2 × P A a 2 + q a 2 × P A a 2 × A a 2 P A a 2 + A a 2 ] × A a 1 P A a 1 + A a 1

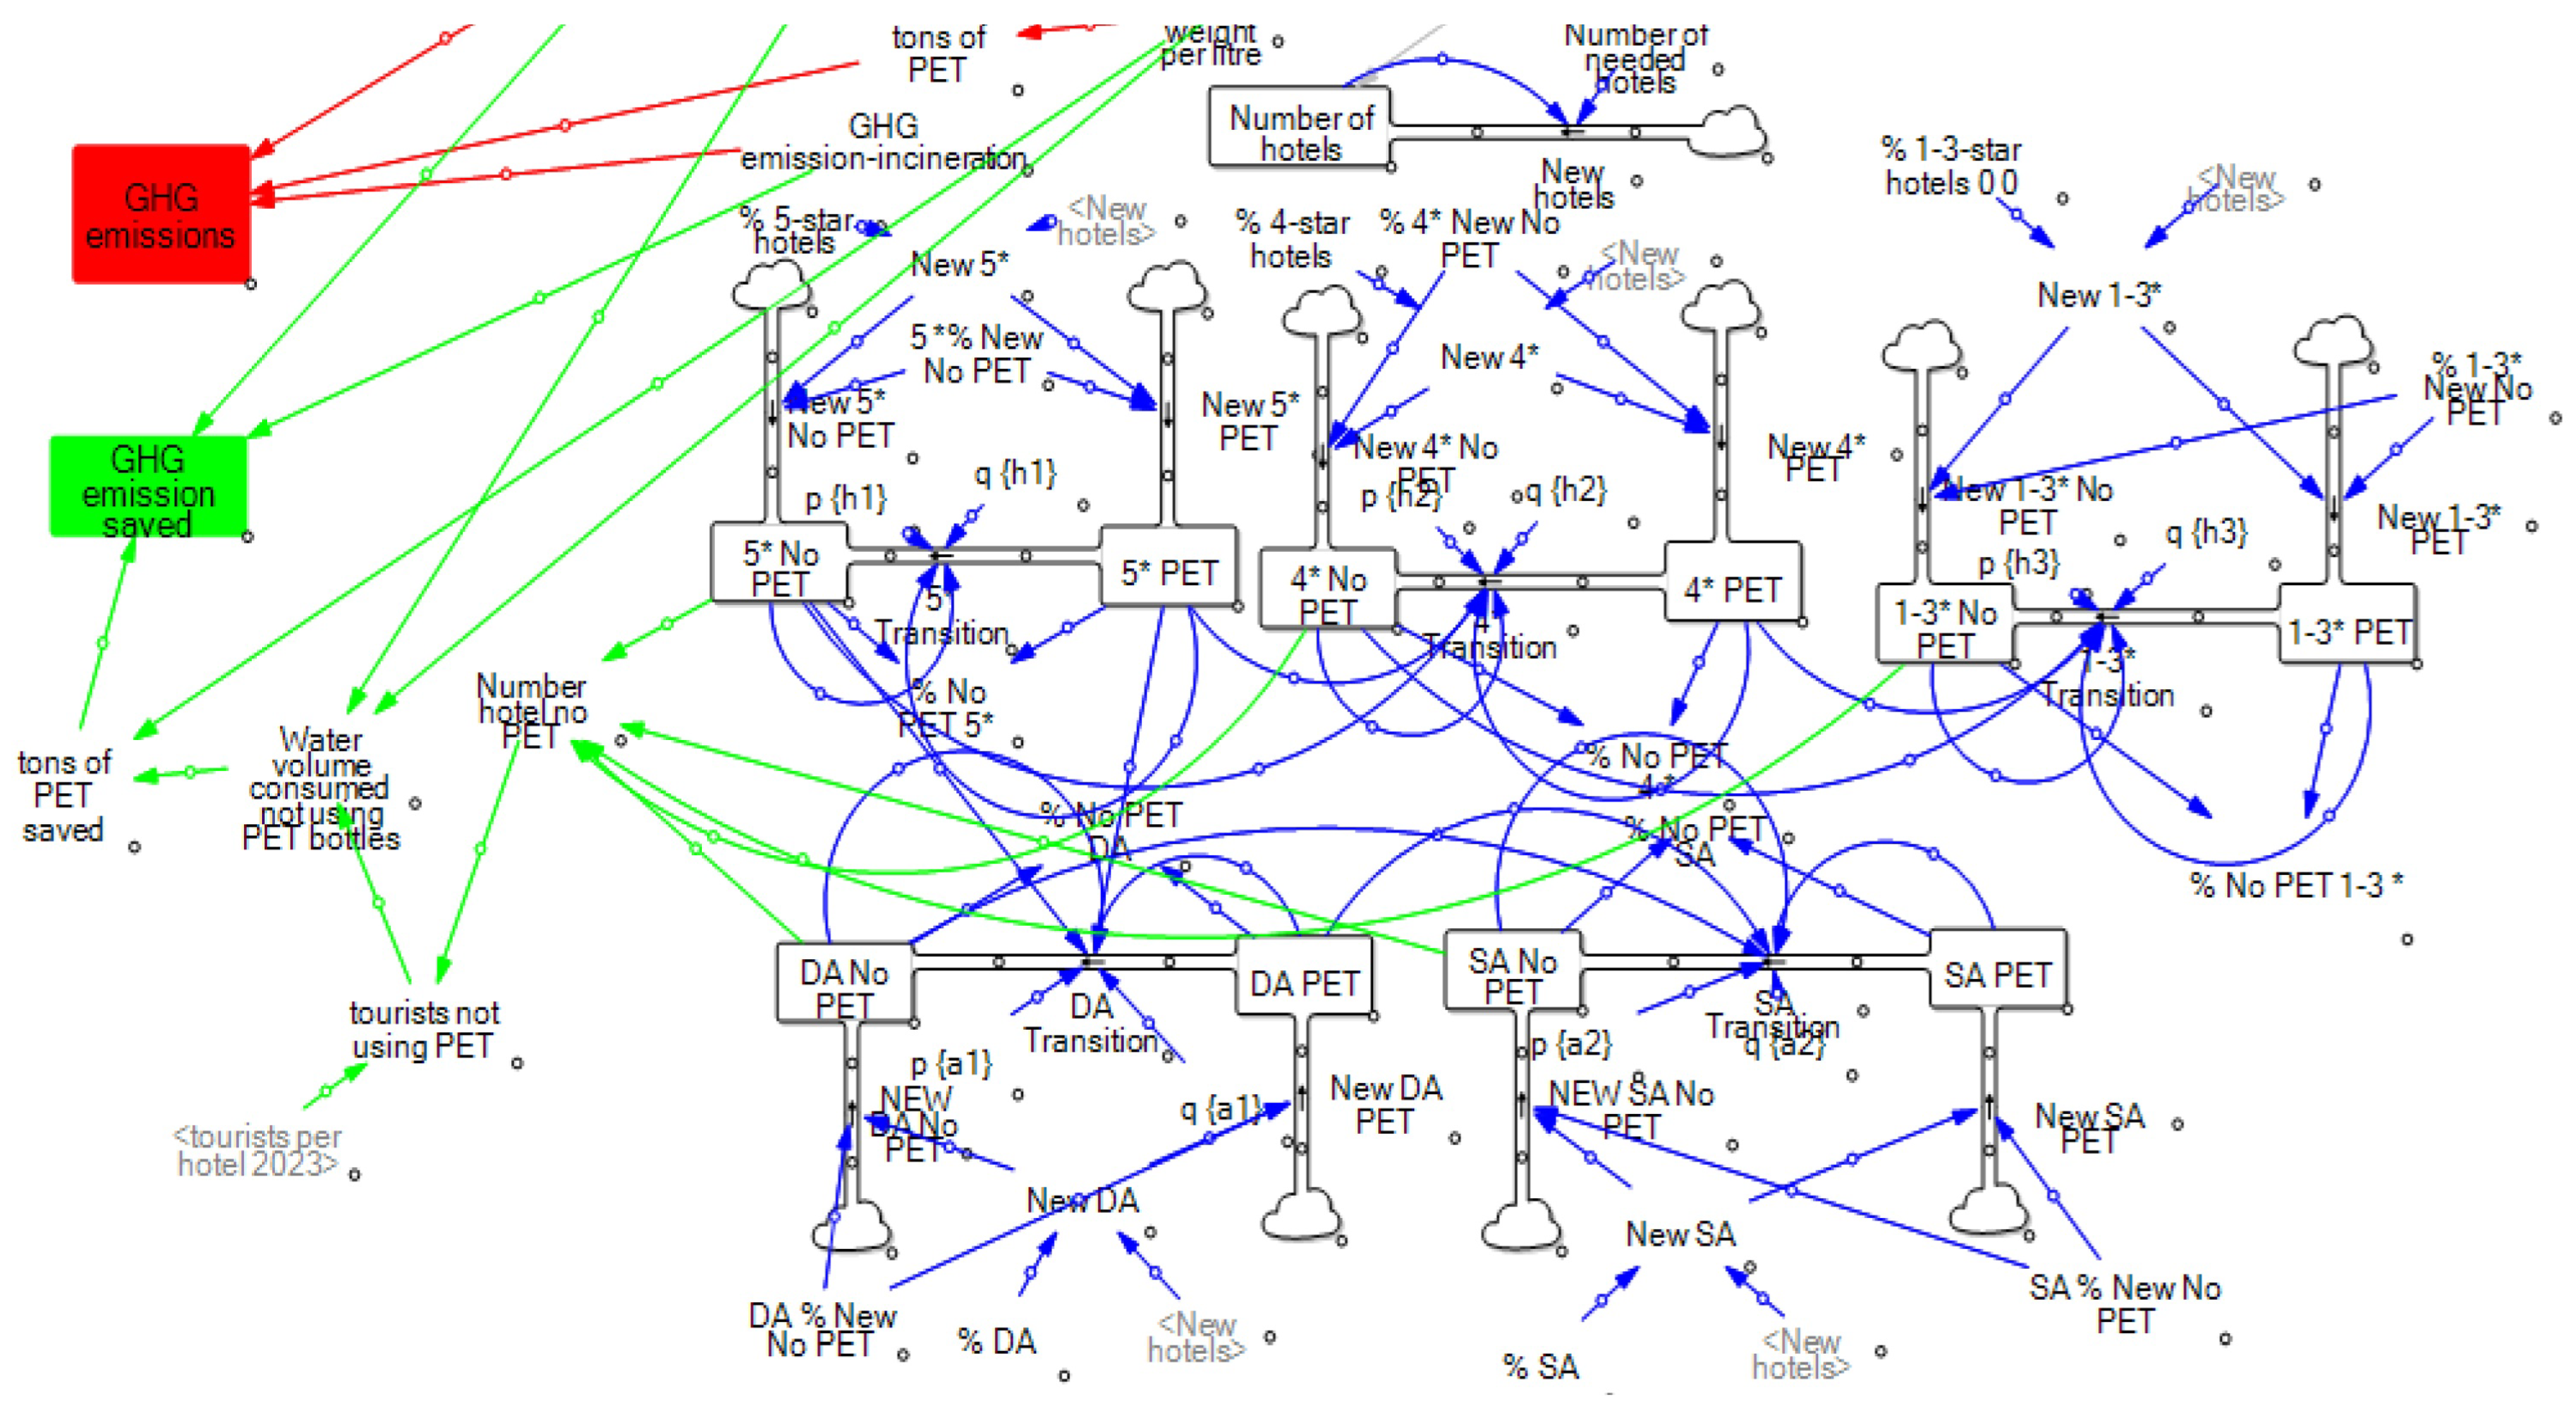
2.5. System Dynamic Model

The SD model was used to model how hotels will abandon PET bottles, similarly to in [47]. Moreover, using tank and water flow analogies with decision-makers made the SD model a better choice for this study. The Dubai Can initiative was launched in 2022; thus, data were unavailable for finding the best estimates for p and q. Moreover, the SD model was used to study the projected impacts of the Dubai Can initiative on PET abolition in hotels. Thus, the steps recommended in [81] were followed, and a conceptual model using Vensim® was iteratively built to facilitate its validation by the experts [82]. In the first iteration, the SD model did not account for innovation diffusion; instead, it considered only the growth of tourists, hotels, and GHG emissions, assuming that all hotels use PET bottles. The second iteration of this model included modeling the transition of each hotel category from PET users to non-users. The time horizon covered by the model is 25 years, beginning in 2023.
The experts who identified the factors were tasked with reviewing either a subset or the entirety of the two SD models. Experts in the hospitality industry focused on hotel behavior, the marketing experts checked the diffusion innovation behavior, and GHG emissions were confirmed by the environmental scientist. The sustainable tourism expert was required to oversee the entire validation process.
The validity of an SD model primarily refers to the model’s structure, which is required to instill confidence in the model [82]. The model’s structure and parameters had to be confirmed by examining the mathematical equations and parameters used to construct each of the two SD models [83]. In addition, tests for extreme conditions and parameter consistency were conducted. In addition to validating the SD model’s structure, the model’s behavior was examined through the extreme condition, behavior sensitivity, and boundary adequacy tests [82]. The experts who contributed to the development of the SD models have validated and accepted their results.

3. Results

The first part of this section is about the SD model that predicts the rise in tourists and how they will affect hotels and greenhouse gas emissions. Subsequently, this SD model is expanded to simulate the removal of PET bottles by Dubai hotels as an innovation diffusion process. A variety of scenarios are subsequently proposed in order to examine the environmental effects associated with varying rates of PET abandonment.

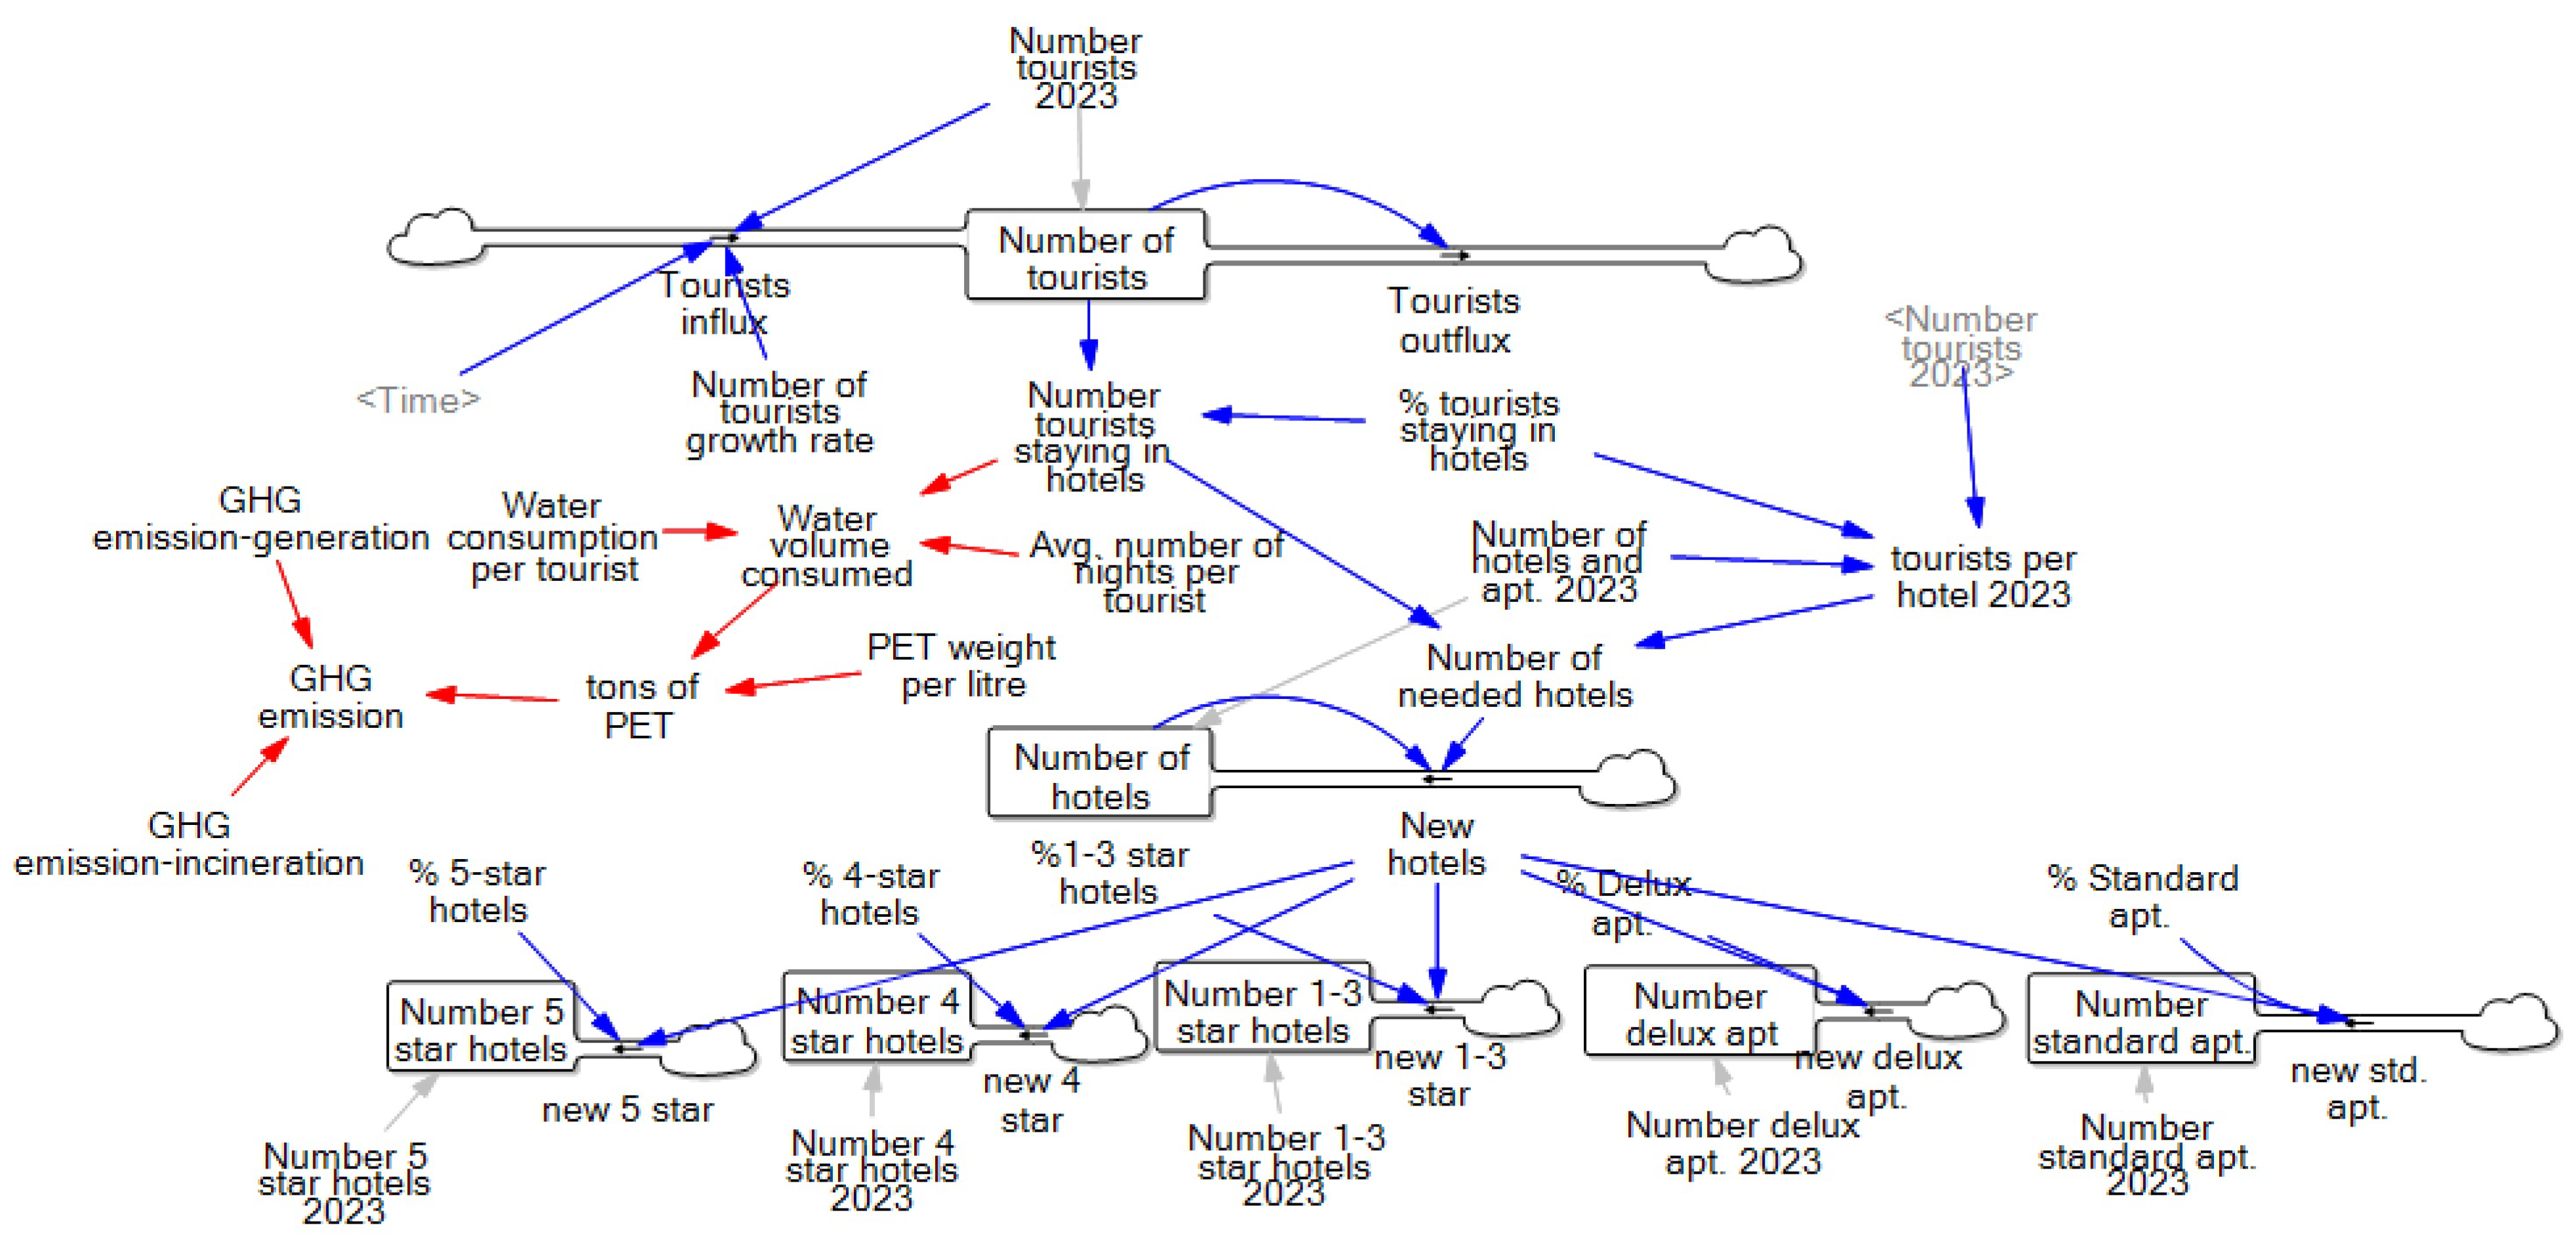
3.1. Forecasting Tourism Evolution and Its Environmental Impacts in Dubai

Figure 2 shows an SD model that forecasts the number of tourists that will visit Dubai in the next 25 years. Moreover, it shows the different hotel categories.
The following stock variables were needed to develop the SD model shown in Figure 2:
  • The number of tourists: This stock variable indicates the expected number of annual tourists. Equation (7) depicts the inflow into this stock variable, while the output is the number of tourists. This stock variable’s initial value is 17.15 million tourists, the anticipated number of tourists in 2023.
    T o u r i s t ( y e a r ) = T o u r i s t s ( 2023 ) × ( 1 + g r o w t h r a t e ) ( y e a r 2023 + 1 ) ;
  • The number of hotels: This stock variable indicates the annual number of hotels. The model assumes all hotels will remain in operation, so there will be no outflow. This stock variable’s initial value is 809, which is the sum of all available hotels and apartments in 2023, as shown in Table 4. Due to the rise in the number of tourists, it is necessary to add new hotels each year to the hotel inventory. Consequently, we calculate the average ratio of tourists staying in each hotel in 2023 and assume that this ratio will remain constant. Therefore, maintaining this ratio can determine the number of hotels in any given year. The model’s “New Hotels” variable represents the new number of hotels to be added to the stock as the difference between the number of required and available hotels;
  • Hotel-related stocks: There are five stock variables representing the number of hotels in each category. Using the “New Hotels” variable, the stock of each hotel category is increased to maintain its proportion in 2023. In 2023, for example, 152 out of 809 hotels will be five-star accommodations. Thus, 18.8% of the “New Hotels” variable corresponds to the proportion of new five-star hotels among the new hotels joining.
The red arrows in Figure 2 show the GHG emission calculations. First, the average amount of PET per liter of water is calculated. Using the average amounts of PET for each bottle size from Table 5 and assuming that all bottles will be used equally, the average weight of PET per bottle is calculated to be 30.89 g/L. Multiplying the volume of water consumed by tourists by 30.89 g/L yields the annual weight of PET. GHG emissions due to manufacturing and incineration are 2.1 MtCO2e/PET ton and 1.85 MtCO2e/PET ton, respectively [22]. Using these values, the GHG emissions resulting from the weight of PET used by tourists are calculated.
Running the SD model for 25 years, it is anticipated that the number of tourists visiting Dubai will reach 24 million in 2048, while the number of hotels will reach 1020. The expected total amount of GHG emissions over the next 25 years is 457,174 MtCO2e, assuming that PET water bottles are still used.

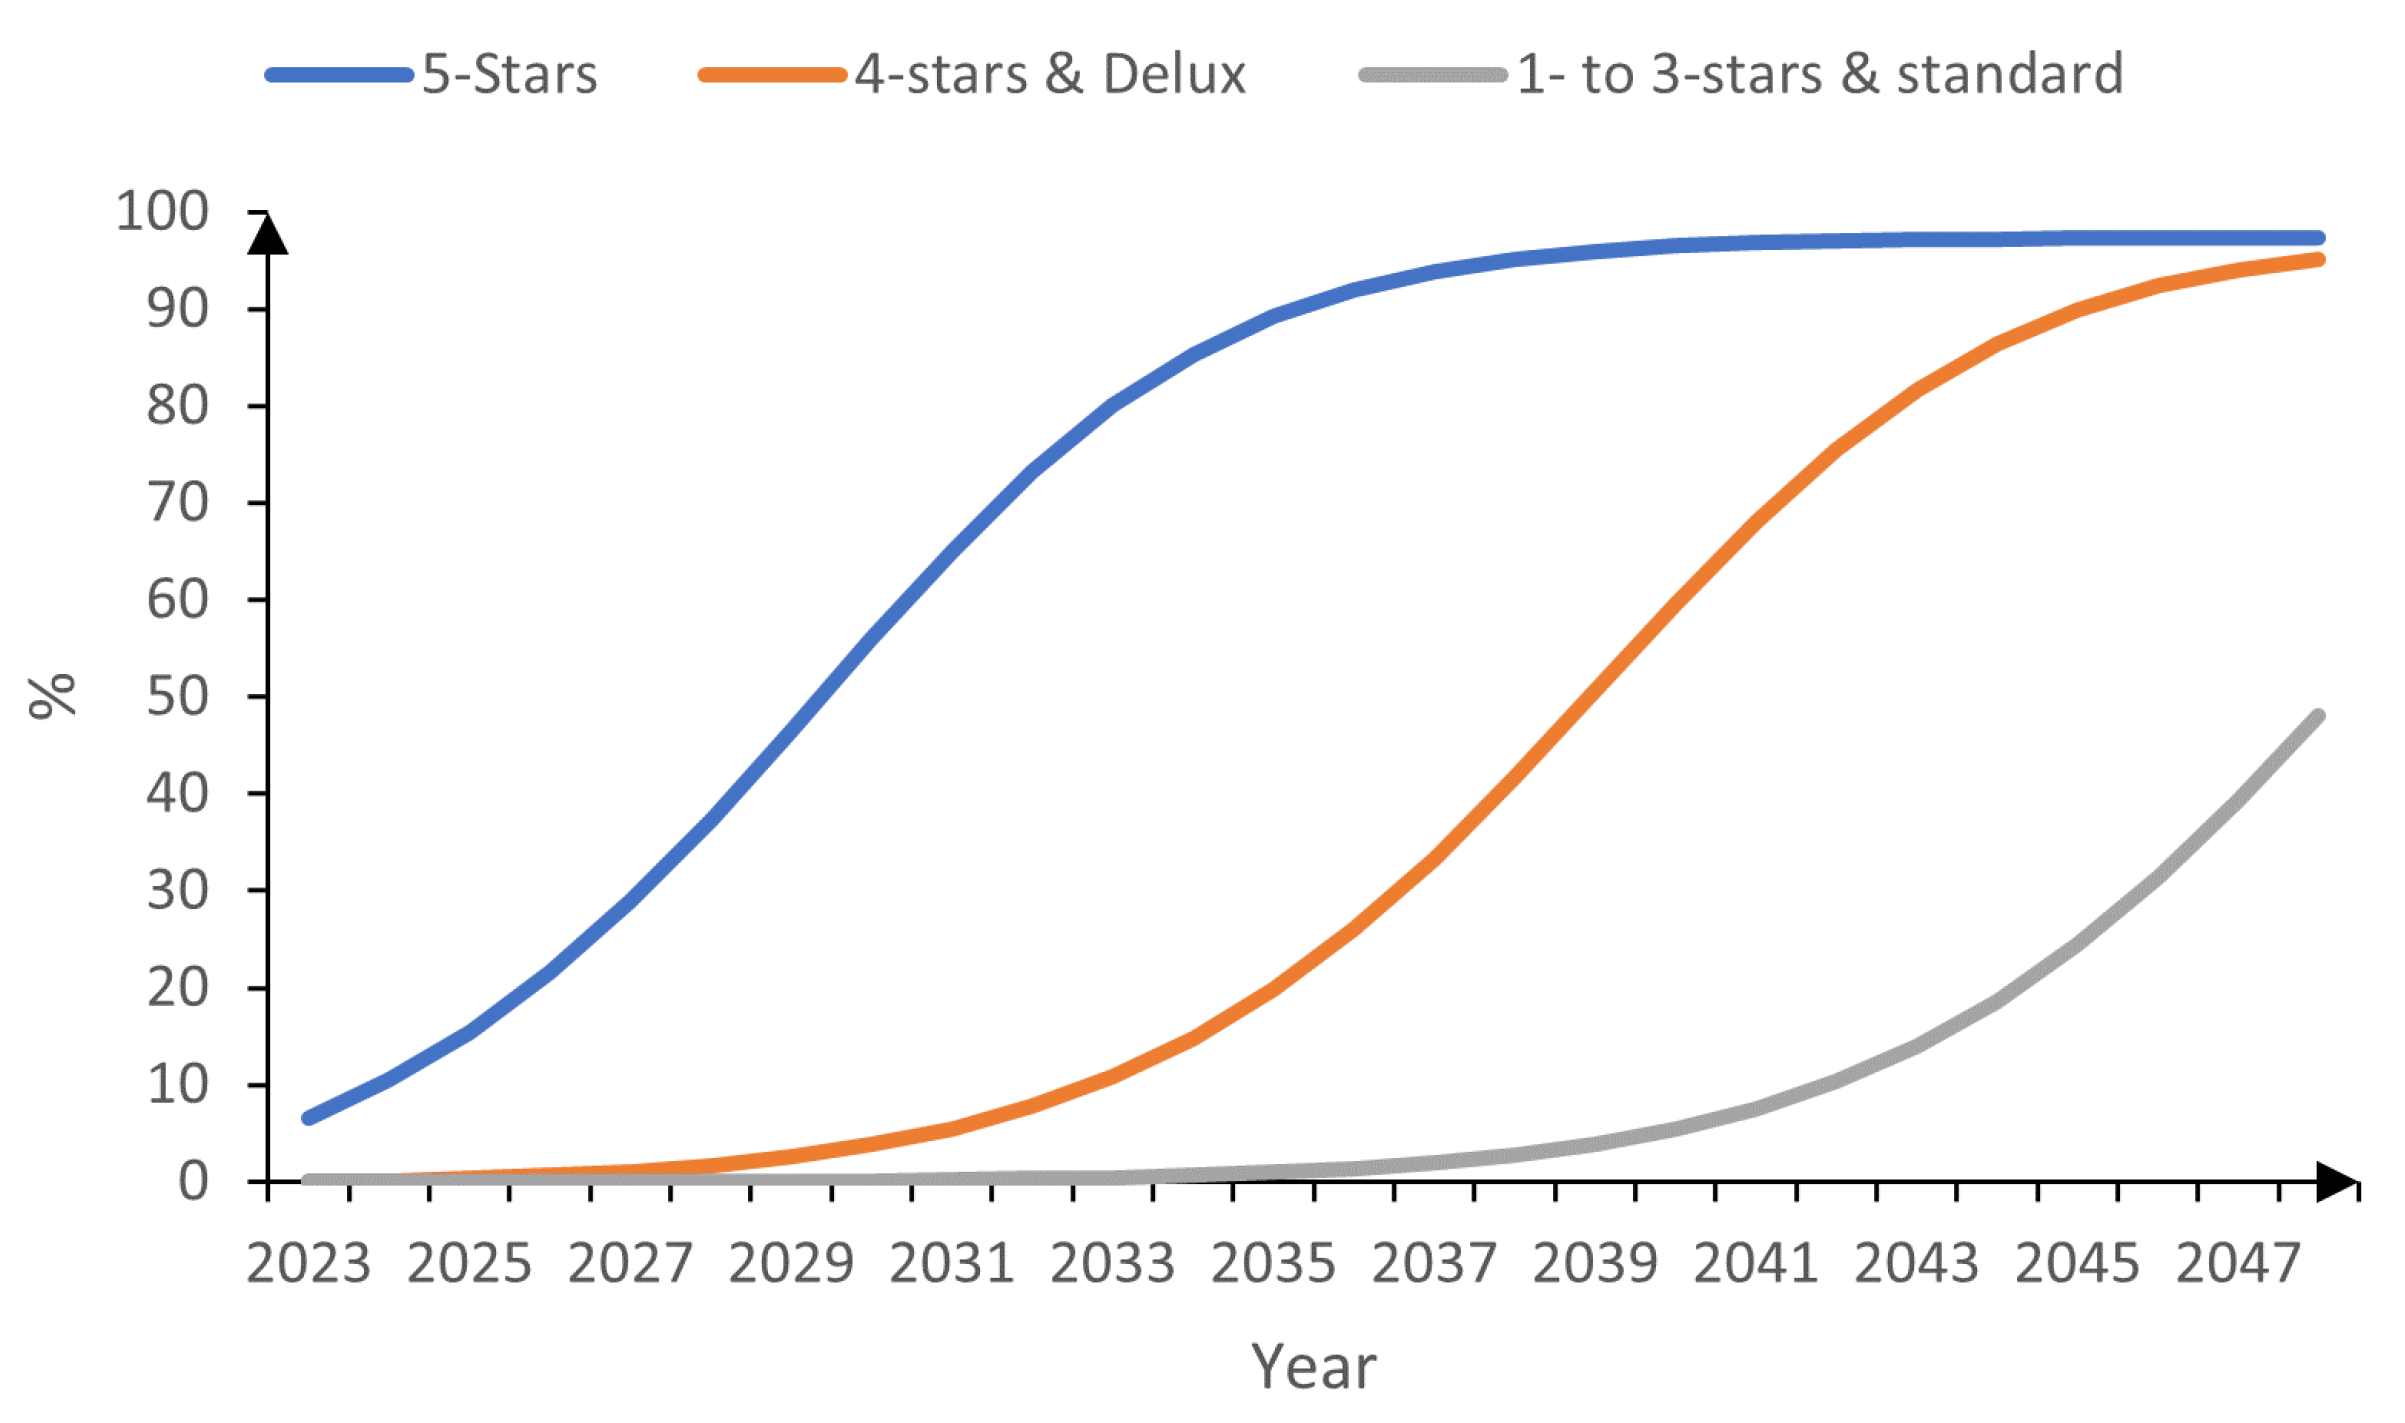
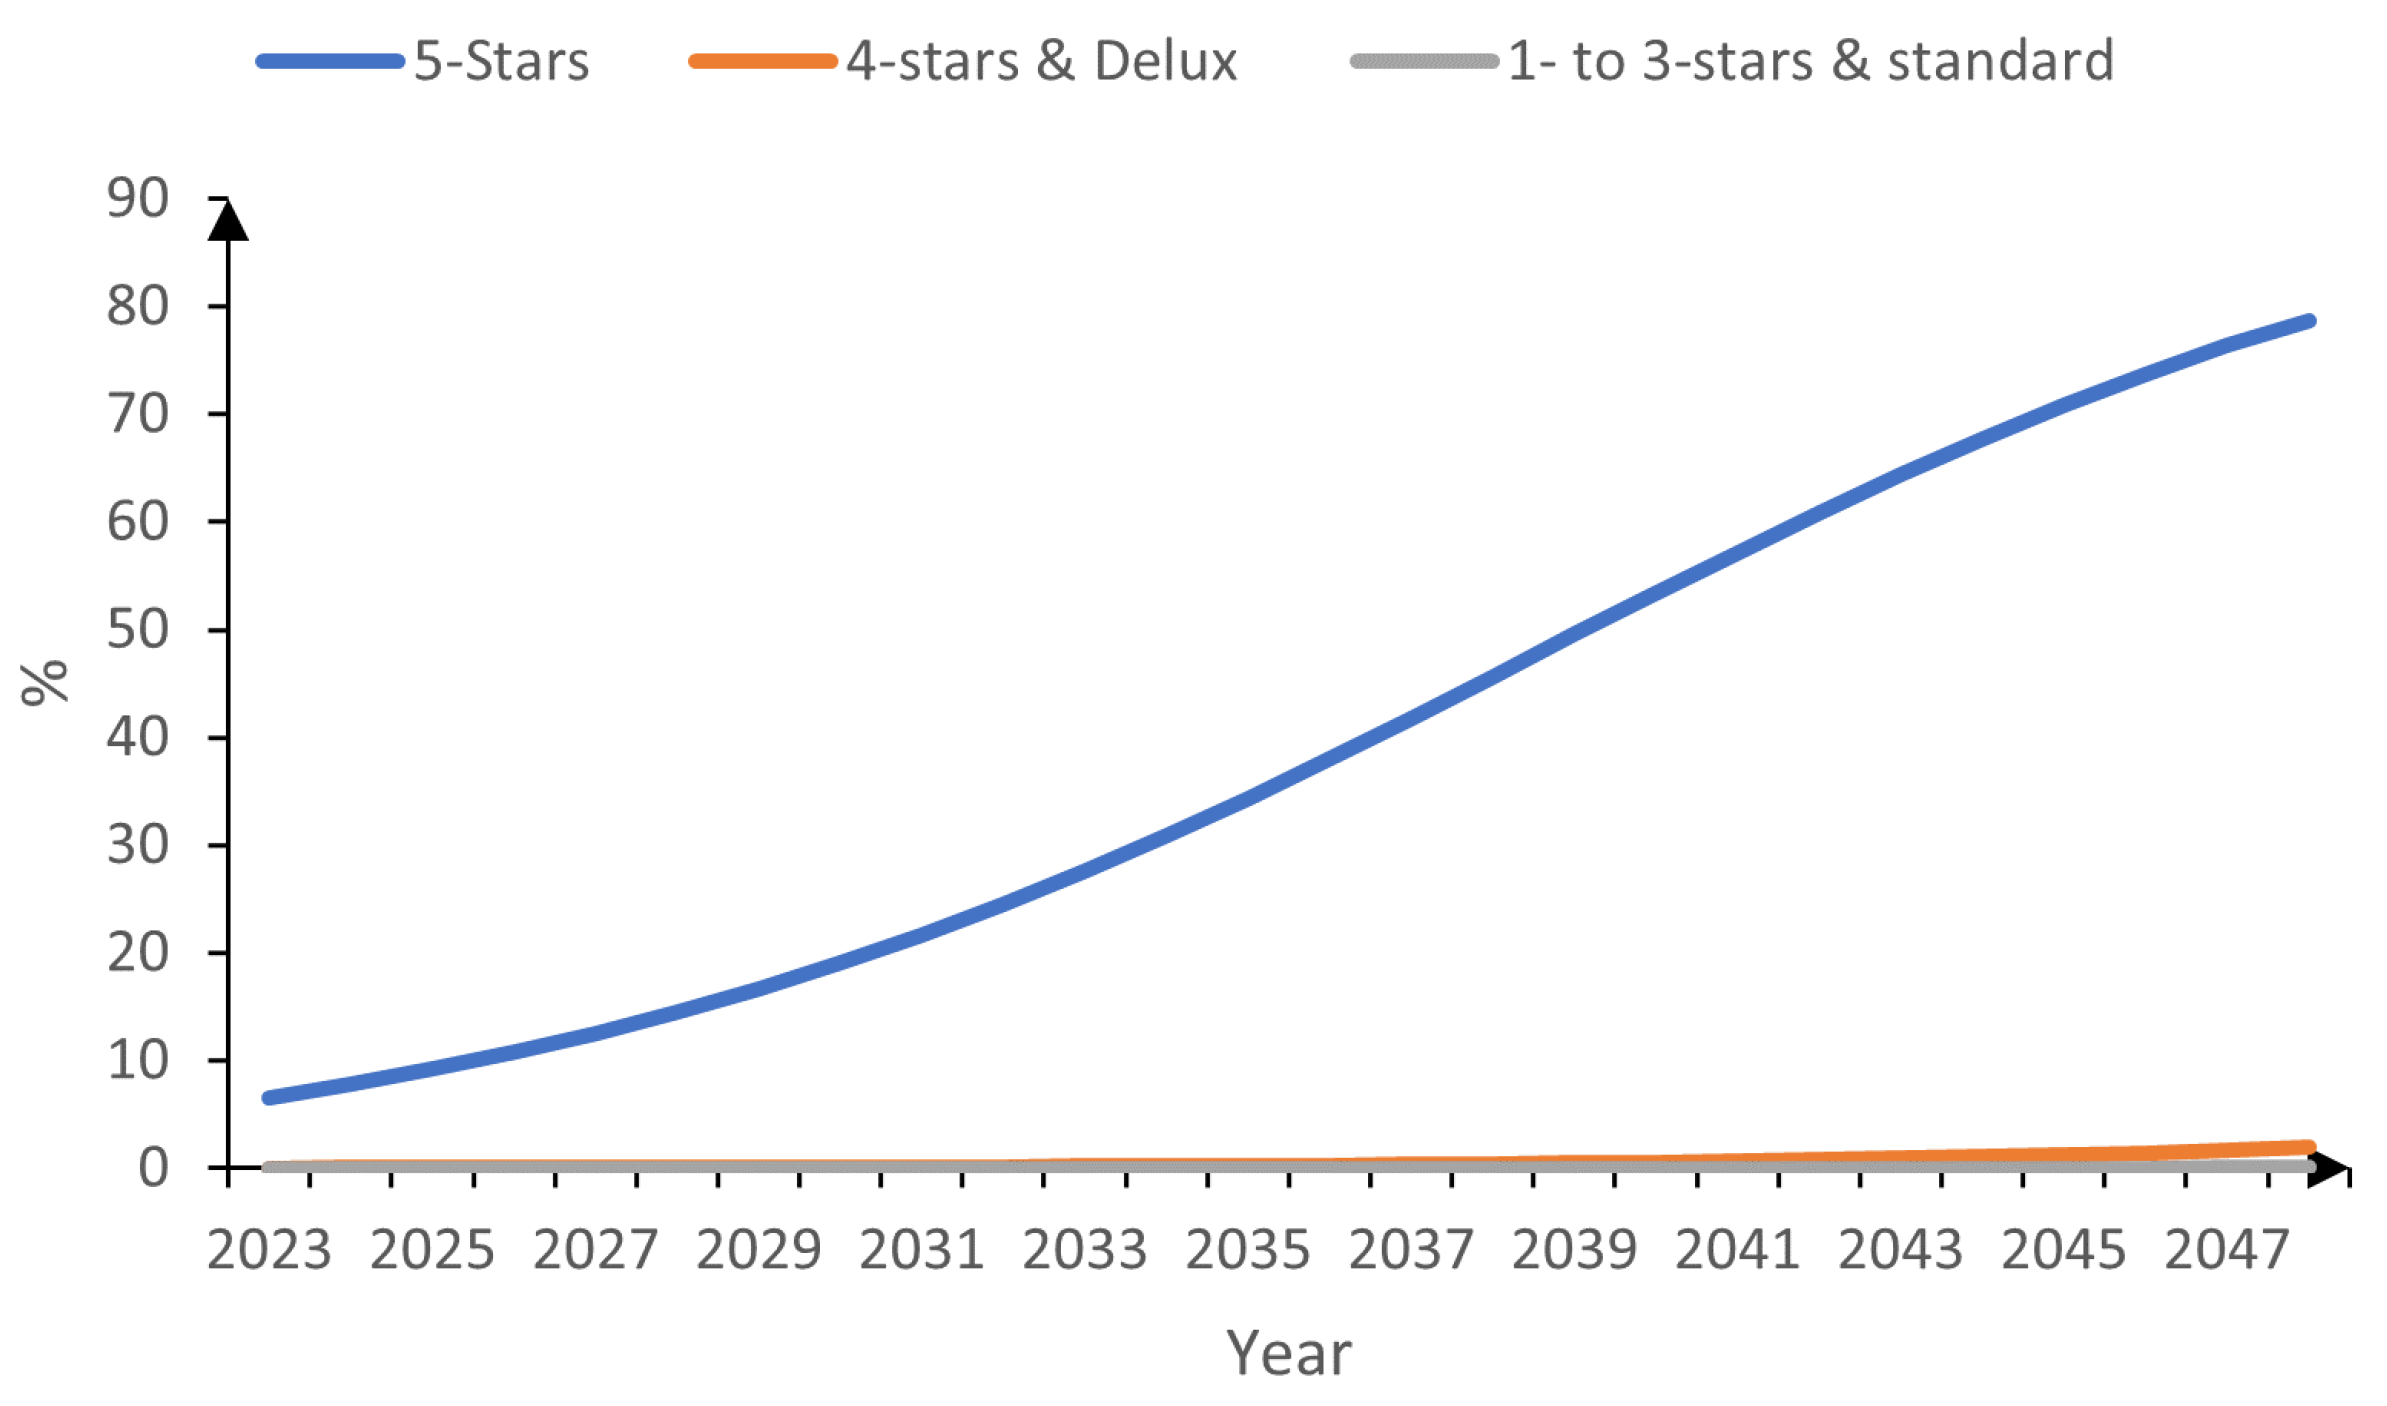
3.2. Diffusion Model

The SD model shown in Figure 2 was extended by including the innovation diffusion models of the five hotel categories, as shown in Figure 3. The SD model shown in Figure 3 has five subsystems representing the different types of hotels. Each of these five subsystems utilizes two stock variables: one for hotels that use PET and the other for hotels that do not. Transition equations, Equations (3)–(6), govern the movement of hotels from PET users to non-PET users stocks. Two additional flows depict the number of new hotels joining PET and non-PET users. This quantity is dependent on the following three variables: (i) the number of new hotels, as shown in Figure 2; (ii) the percentage of hotels in each category; and (iii) the percentage of hotels that will join each stream. For the percentage of hotels that will join each stream, it is assumed that (i) all new hotels will join the PET users in the worst-case scenario, (ii) all new hotels will join the non-PET users in the best-case scenario, and (iii) it will be proportional to the percentage of each type of hotel in the average scenario.
The green arrows in Figure 3 illustrate how the GHG emission savings were calculated. First, the sum of non-PET hotels was found. This number was then multiplied by the previously described number of tourists per hotel to determine the number of tourists who will not use PET bottles. The avoided GHG emissions were calculated using this figure and the same assumptions as the previous model.

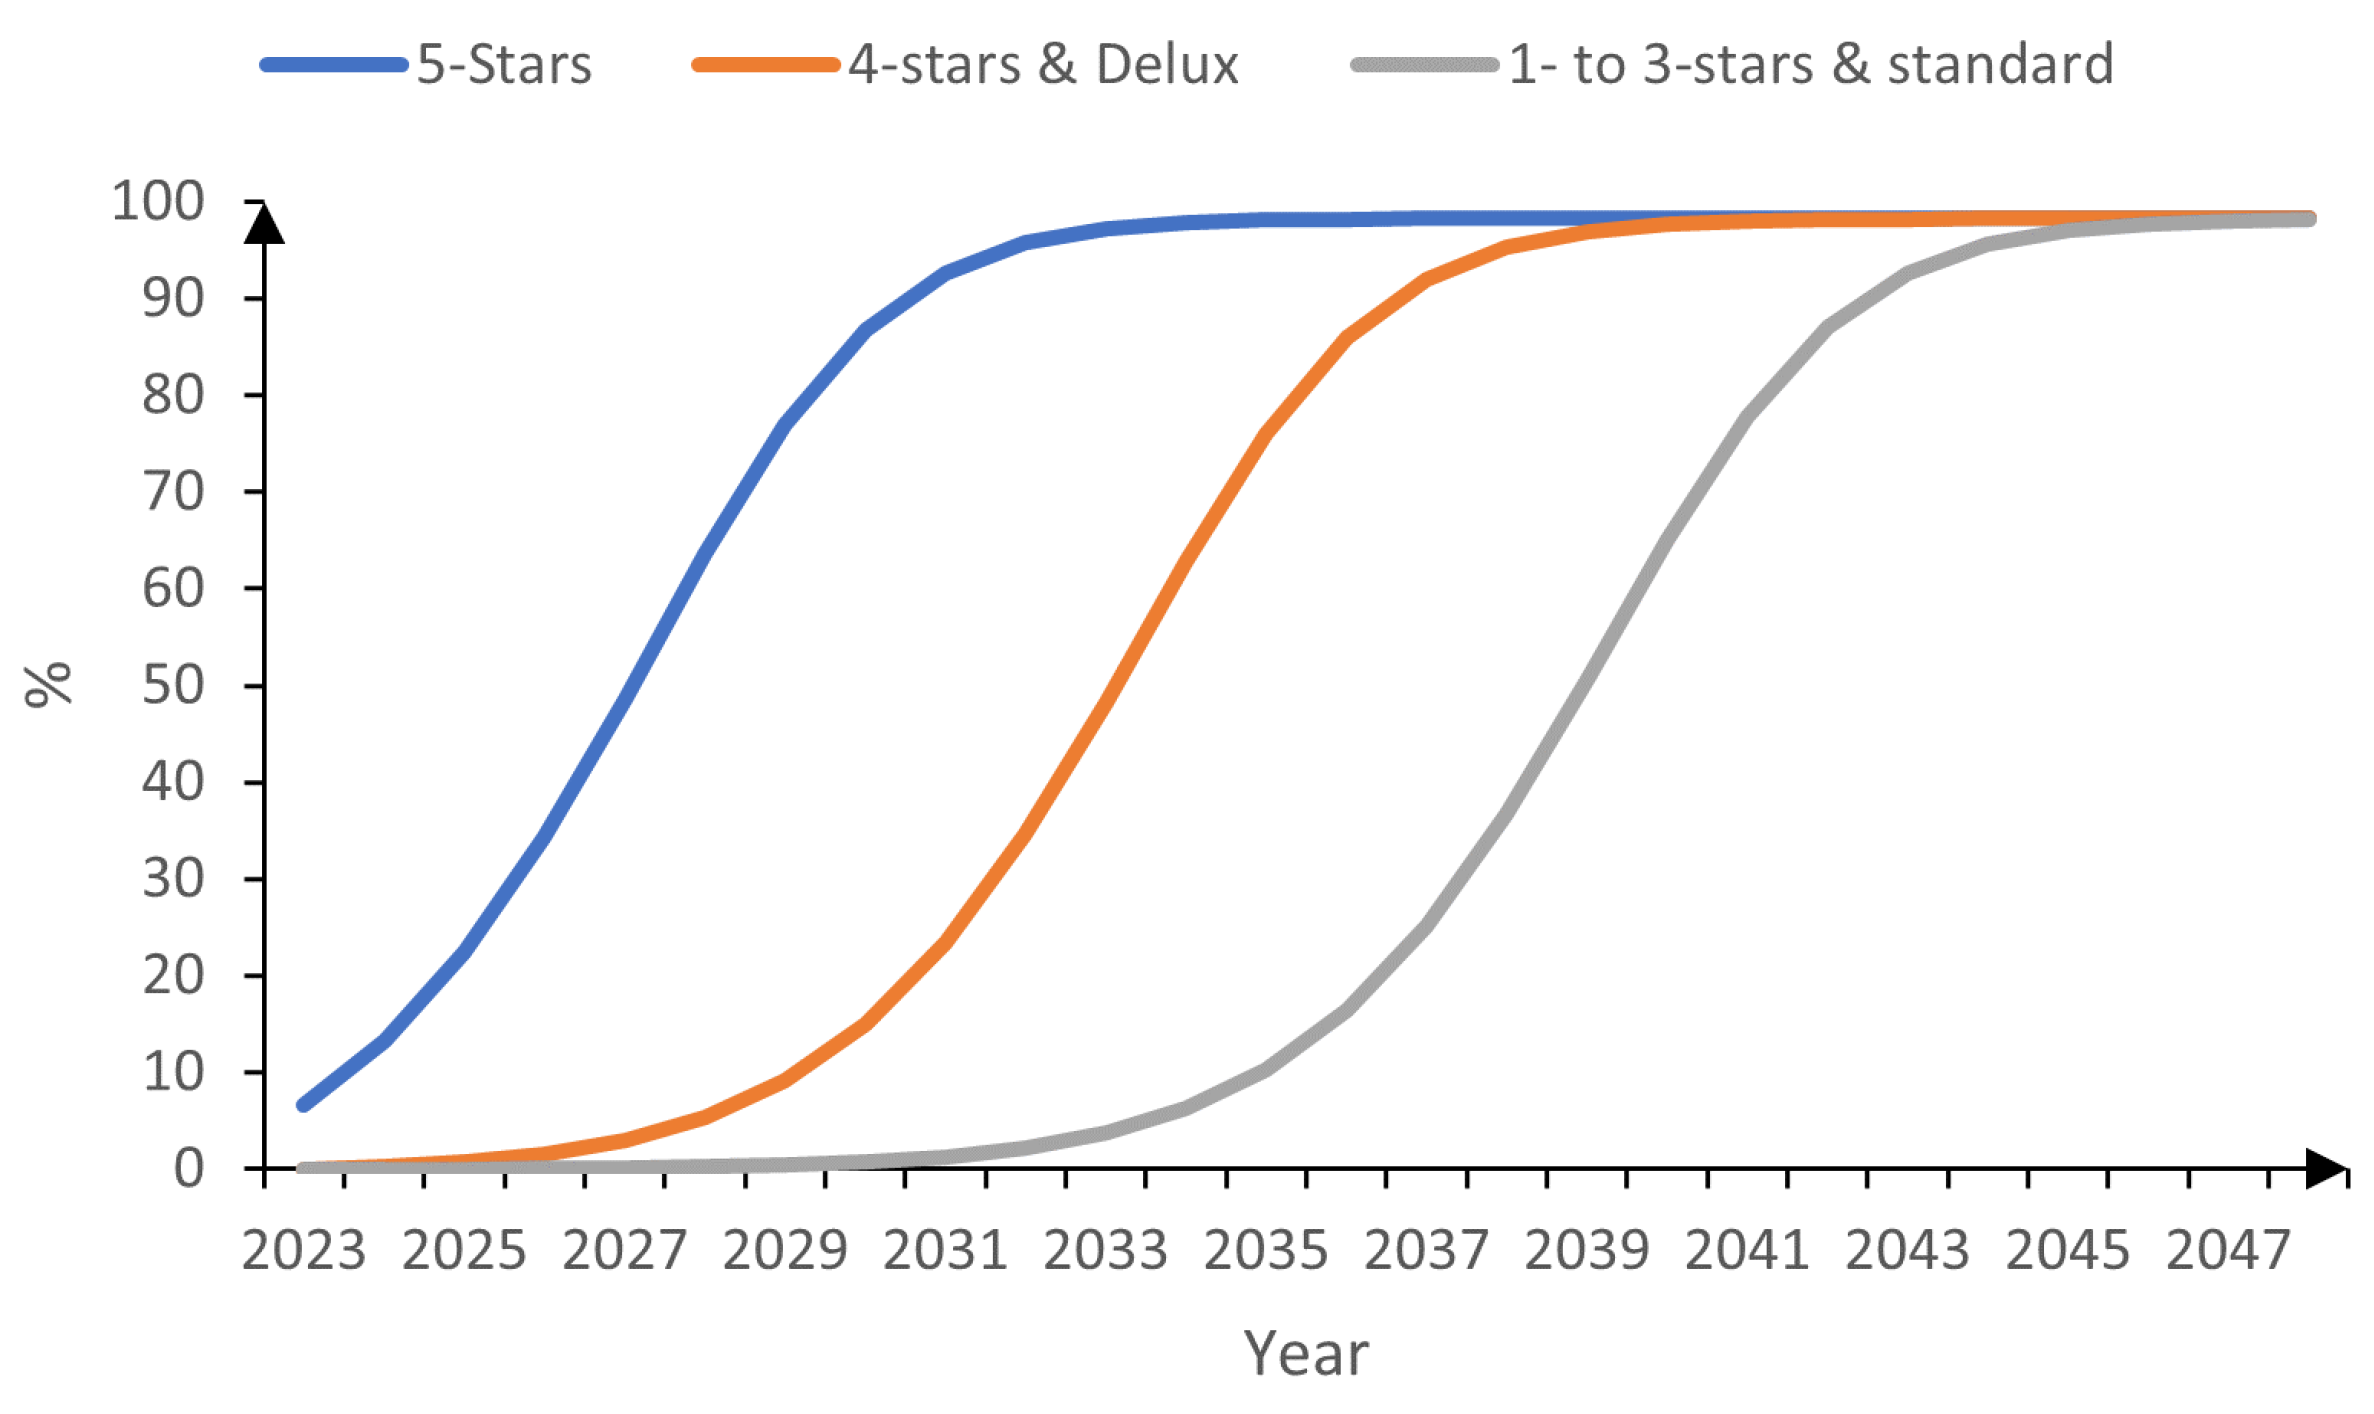
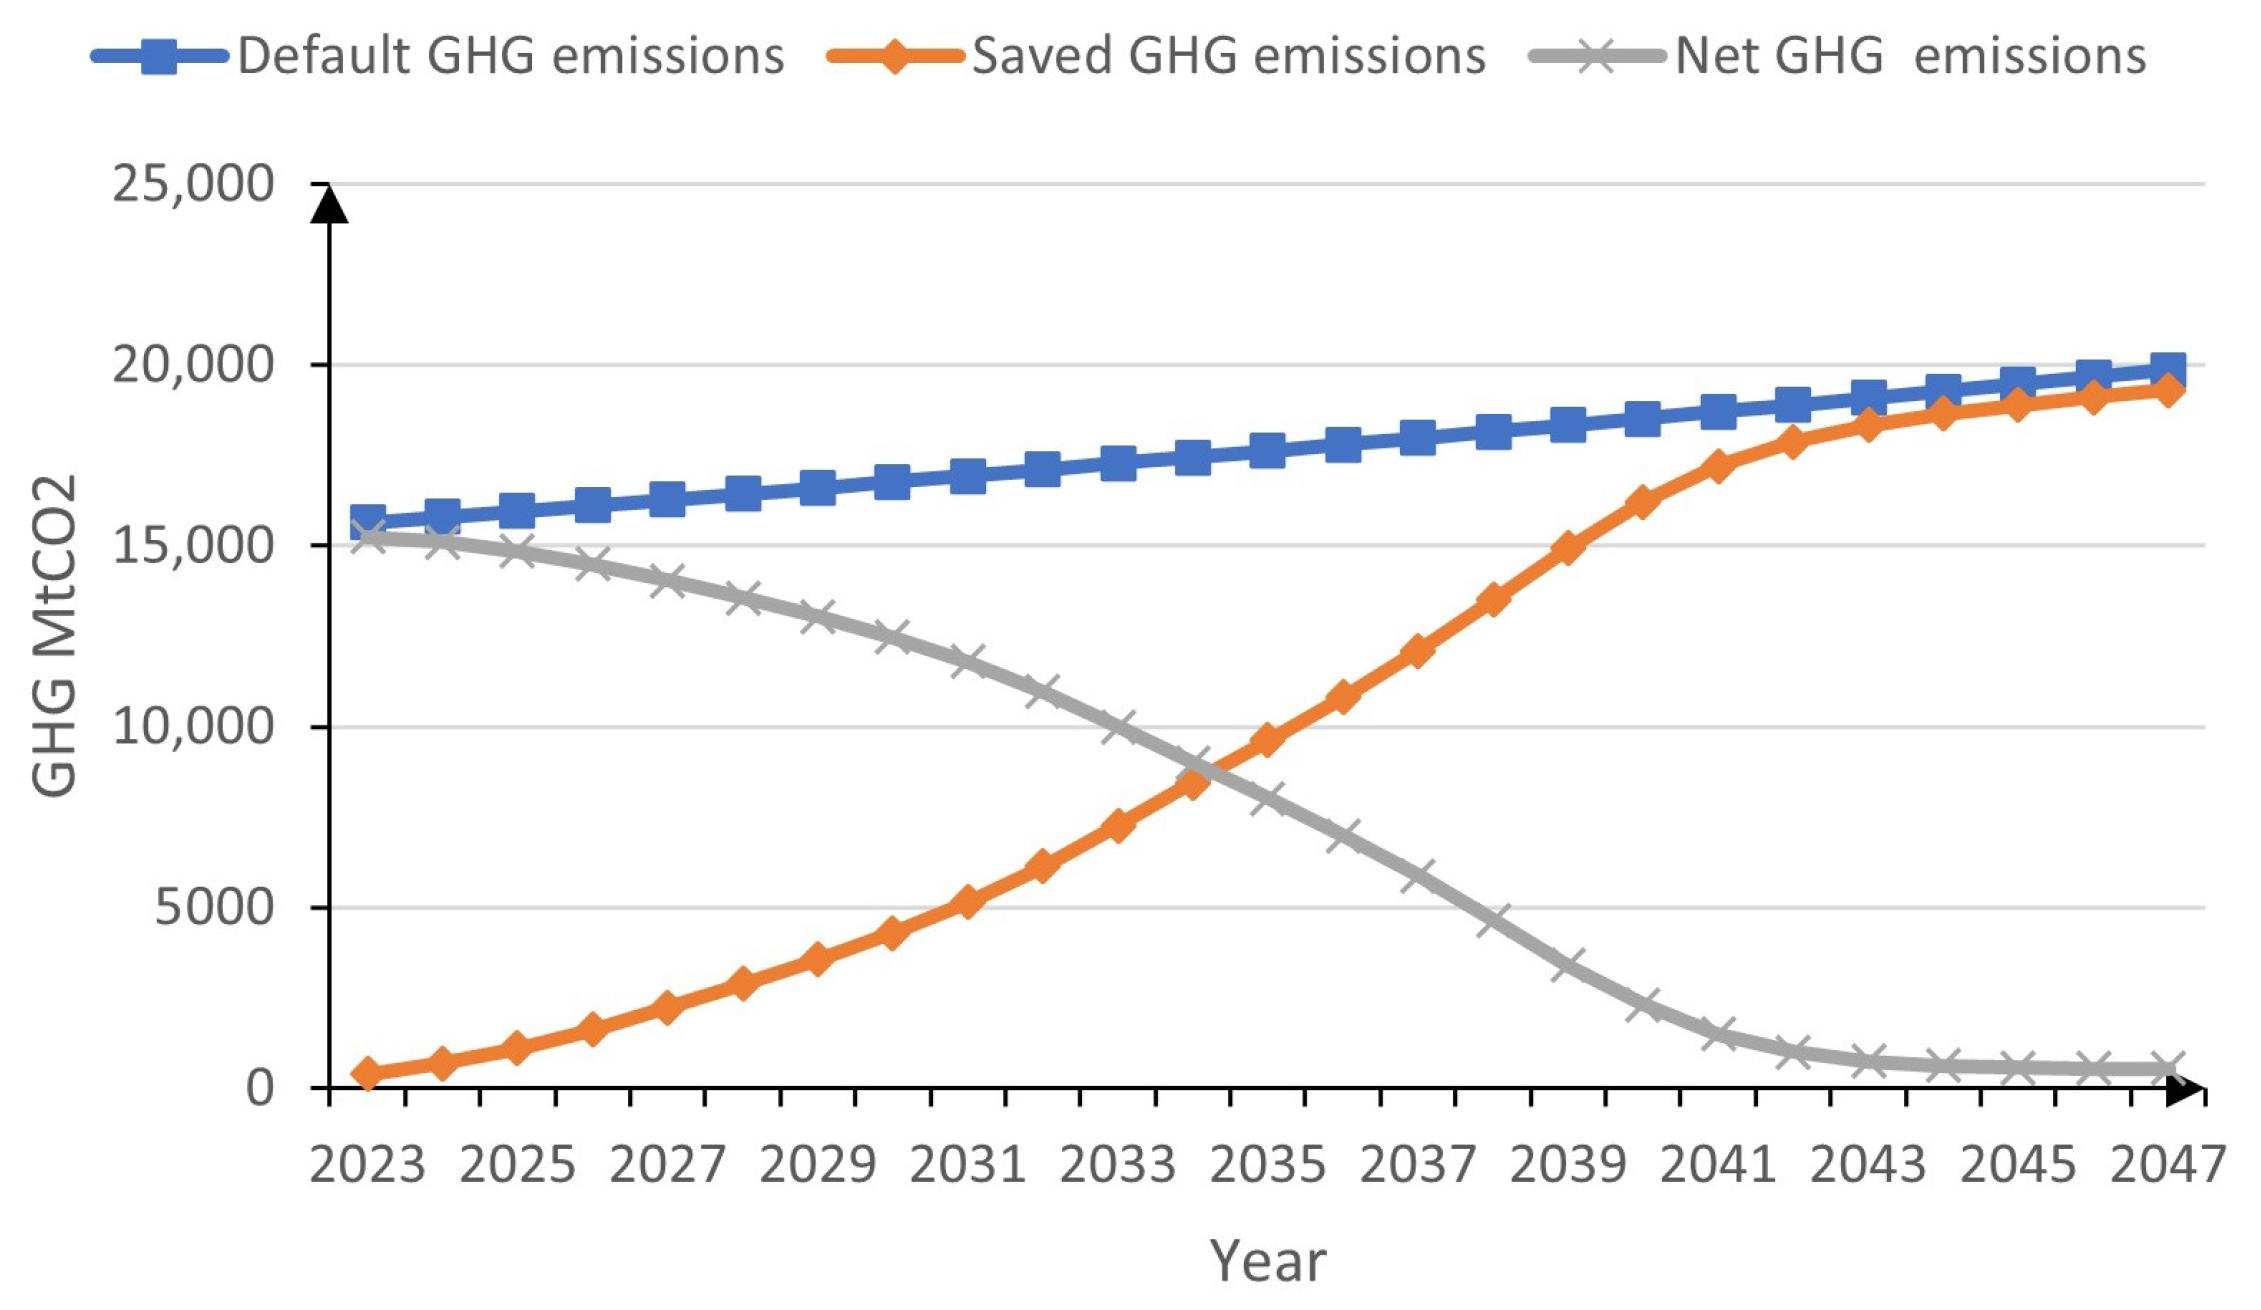
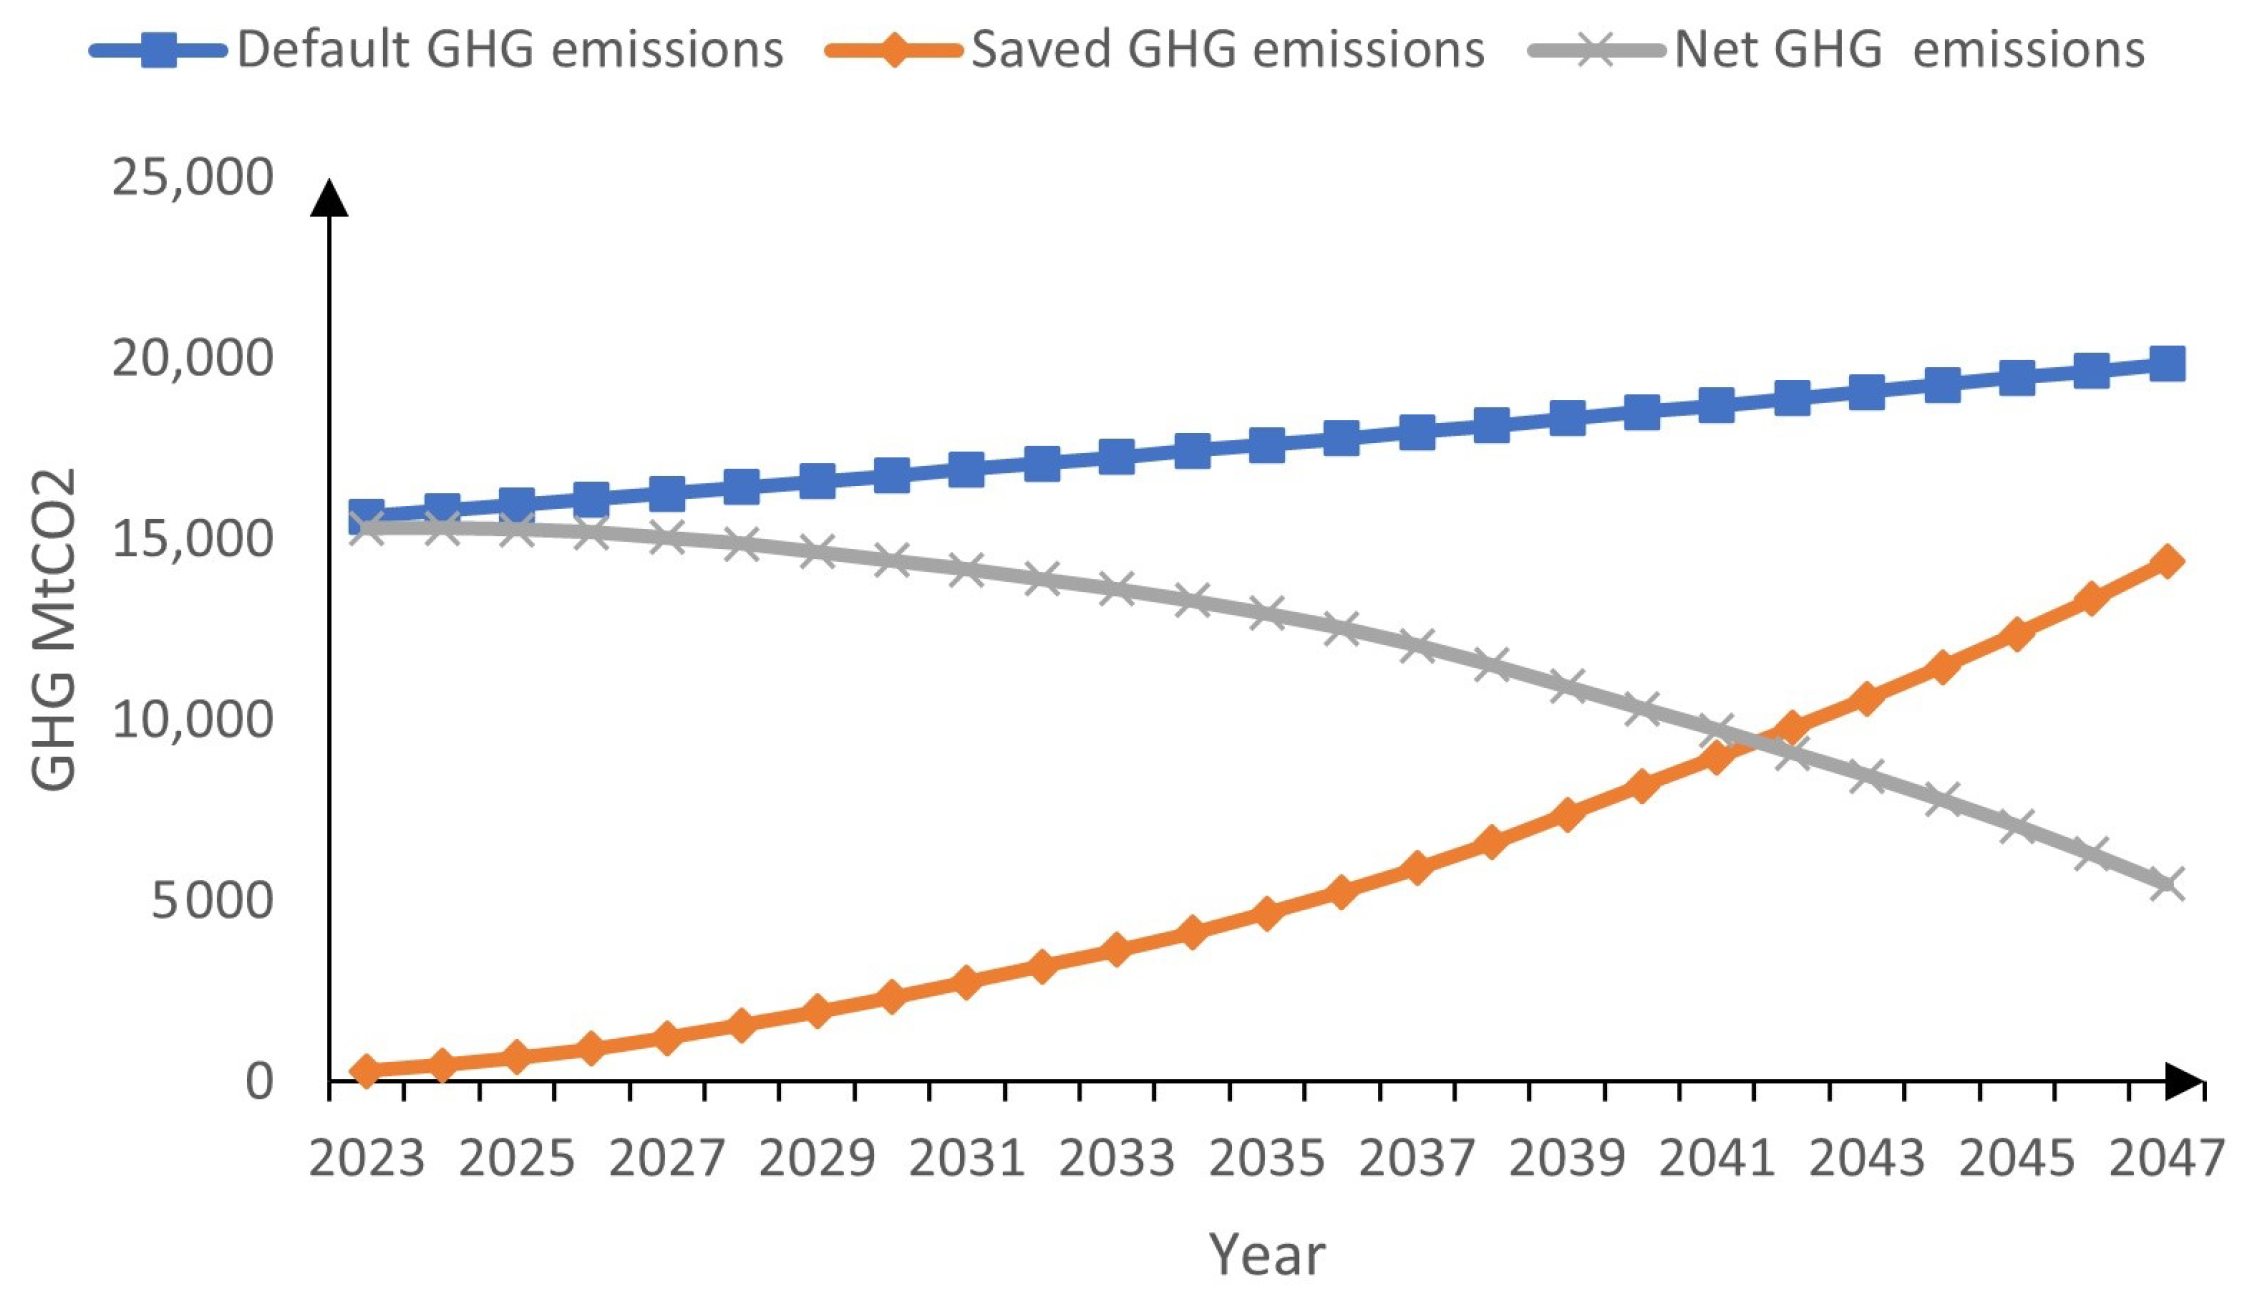
3.3. Forecasting Best, Average, and Worst Transition Scenarios

In this experiment, several transition rates of hotels from being PET users to non-PET users were examined. Best, worst, and average scenarios were assumed, with p and q values determining the scenario type. Using 13 actual cases, it was found in [75] that the p range is between 0.0025 and 0.0347, while the q range is between 0.1711 to 0.5541. These values were used by several researchers studying the diffusion of renewable energy technologies, such as [47,49]. As shown in columns 2 and 3 of Table 6, this experiment evaluated the best, worst, and average outcomes based on the p and q selections. Column 4 of Table 6 indicates which group of hotels new hotels will join. In the best-case scenario, hotels will join the group of non-PET users, and, in the worst-case scenario, they will not. In the average case, the probability of hotels joining non-PET users depends on their percentage. The final column displays the total GHG emissions that would be avoided in each scenario, while the previous experiments showed that, if all tourists use PET bottles, then GHG emissions would be 441,690 MtCO2e.
Figure 4, Figure 5, Figure 6, Figure 7, Figure 8 and Figure 9 show the simulation results of the three scenarios. As depicted in Figure 5, under the best-case scenario, GHG emissions from PET bottles will approach zero in less than 25 years. The reason for this is illustrated in Figure 4, which demonstrates that all hotels will have abandoned PET bottles by this time. Figure 4 demonstrates that hotels across all categories will exhibit the same transitional behavior with a time lag between categories. The savings in GHG emissions in 25 years following the best-case scenario is 250,306/457,174 = 54.75%, with 250,306 MtCO2 being saved due to this scenario, as shown in Table 6.
Figure 6 shows the percentage of hotels in each category using average parameters. The five-star and four-star hotels and deluxe hotel apartments are projected to stop using PET bottles in 25 years, whereas other hotel categories will continue to do so. As shown in Table 6 and Figure 7, the GHG savings due to this scenario are 31%.
Unfortunately, the worst-case savings scenario is less than 8%. Figure 8 demonstrates that only five-star hotels will abandon PET bottles within the next 25 years. However, the GHG savings are minimal since five-star hotels represent only 18.8% of all hotels. Only 16% of all hotels in the UAE would eliminate PET bottles in 25 years in the worst-case scenario. Extending the simulation time, it would take nearly a century for 90% of hotels to eliminate PET bottle use.

4. Discussion

GHG emissions from PET water bottles in Dubai hotels are compared to those of gasoline-powered vehicles to assess the environmental impact of this practice. With an annual mileage of 11,500 miles and a fuel economy of 22.2 miles per gallon, the average passenger vehicle produces around 4.6 MtCO2e of emissions, according to [84]. So, over the next 25 years, PET water bottles in Dubai hotels will cause 457,174 MtCO2e of greenhouse gas emissions, which is the same as driving about 100,000 cars for a year. In the best scenario, the GHG savings are equivalent to not using 54,000 cars annually. Thus, decision-makers need to make sure that hotels follow the best-case scenario, in which all hotels will stop using PET water bottles by 2050. These values show that small steps matter toward saving the environment.
Two years after the Dubai Can initiative was launched, several hotels have banned the use of PET bottles on their premises. Examples of these hotels include five-star hotels like Anantra®, The Palm Dubai, the InterContinental®, Dubai Festival City, the Sheraton®, and Sheikh Zayed; four-star hotels like the Delta® Hotel and First Collection®; and three-star hotels like Rove® at the Park. Observing this hotel sample, most of them are classified as either five star or four star. Water filtration and bottling plants have mostly replaced PET-bottled water in hotels. The Delta® Hotel, which converts atmospheric moisture to potable water, is an exception.
Decision-makers expect over 20% of the four- and five-star hotels to have already abandoned the use of PET water bottles. Moreover, several hotels expressed their intentions to stop using PET bottle. For the decision-makers, these results show that four- and five-star hotels’ transition to being non-PET users is following the best-case scenario. However, it is too early to judge how quickly one- to three-star hotels will abolish the use of PET bottles. If this segment of hotels is slow in abandoning PET water bottles, then officials in Dubai could think of an incentive to push one- to three-star hotels to abolish PET water bottles, e.g., favoring hotels that adopt sustainable practices when holding conferences or hosting governmental guests.

5. Conclusions

Every year, Dubai welcomes a large number of tourists. Tourists in Dubai drink water from PET bottles because this is the norm in Dubai. Dubai has launched an initiative to reduce the reliance of its residents on PET bottles, and this paper investigates whether this initiative could also include hotels eventually stopping using PET bottles.
This study uses Delphi techniques and a survey to identify potential factors that may influence hotels’ decisions to eliminate PET bottles. After identifying these factors, the AHP is utilized to assign weights to the identified factors. Peer pressure and superior pressure are the primary determinants of hotel decisions. These two factors can be modeled elegantly for each hotel category using a GBM. Consequently, an SD model is constructed to include all hotel categories and stimulate tourism growth and the number of hotels in each category.
Three scenarios are tested regarding how hotels will transition from being PET users to non-users. In 25 years, according to the best- and average-case scenarios, all hotels will have eliminated the use of PET bottles. In the worst-case scenario, however, only 16% of hotels will cease using PET bottles during the same time frame.
Unlike for single-use plastic bags, Dubai has not passed a law to abolish single-use water bottles; however, it has launched an initiative. The analysis suggests that decision-makers should keep track of how hotels eliminate PET bottles. If the percentage of hotels abandoning PET bottles follows the worst-case scenario, then decision-makers might push hotels to adopt more environmentally friendly practices. For example, favoring eco-friendly hotels when hosting government officials. In addition to Dubai officials, decision-makers in other countries would also benefit from this project and its effects. This is especially true in GCC countries, where PET bottles are common in the hospitality industry. It is always possible to pass legislation prohibiting PET bottles, but it is preferable if the goal of outlawing unsustainable practices is accomplished without one.
This work must be updated once data are available to determine which scenario hotels have followed. In addition, it is possible to decide later the optimal p and q values for the GBMs of each hotel category. Other environmental impacts in addition to greenhouse gas emissions can be compared by researchers. Additionally, a comparison can be made regarding the financial ramifications of this transition. As mentioned in the introduction, models based on the diffusion of innovation theory have already been used to examine how renewable energy options are adopted in various countries; nevertheless, additional research is required to comprehend how sustainable behaviors are changing. Furthermore, while it may be most convenient to implement regulations to impose a change, decision-makers must explore alternative approaches to promote transformation. Therefore, further investigation is needed to identify policies, incentives, or alternative strategies that policymakers can adopt instead of legislation to promote more sustainable conduct.

Author Contributions

Conceptualization, S.A.-S., F.D. and M.F.A.B.; methodology, S.A.-S., R.A. and Z.C.A.; software, S.A.-S. and M.F.A.B.; validation, S.A.-S. and R.A.; formal analysis, S.A.-S. and M.O.; writing—original draft, S.A.-S., M.O. and F.D.; writing—review & editing, Z.C.A., M.O. and M.F.A.B. All authors have read and agreed to the published version of the manuscript.

Funding

This research received no external funding.

Institutional Review Board Statement

Not applicable.

Informed Consent Statement

Not applicable.

Data Availability Statement

Data is contained within the article.

Conflicts of Interest

The authors declare no conflicts of interest.

References

  1. Horton, A.A. Plastic pollution: When do we know enough? J. Hazard. Mater. 2022, 422, 126885. [Google Scholar] [CrossRef] [PubMed]
  2. PLASTICS EUROPE. Plastics—The Facts 2022. 2022. Available online: https://plasticseurope.org/wp-content/uploads/2022/10/PE-PLASTICS-THE-FACTS_V7-Tue_19-10-1.pdf (accessed on 20 March 2024).
  3. Agenda, I. The New Plastics Economy Rethinking the Future of Plastics; World Economic Forum: Cologny, Switzerland, 2016; Volume 36. [Google Scholar]
  4. Phuong, N.N.; Zalouk-Vergnoux, A.; Poirier, L.; Kamari, A.; Châtel, A.; Mouneyrac, C.; Lagarde, F. Is there any consistency between the microplastics found in the field and those used in laboratory experiments? Environ. Pollut. 2016, 211, 111–123. [Google Scholar] [CrossRef] [PubMed]
  5. Evode, N.; Qamar, S.A.; Bilal, M.; Barceló, D.; Iqbal, H.M. Plastic waste and its management strategies for environmental sustainability. Case Stud. Chem. Environ. Eng. 2021, 4, 100142. [Google Scholar] [CrossRef]
  6. Benyathiar, P.; Kumar, P.; Carpenter, G.; Brace, J.; Mishra, D.K. Polyethylene terephthalate (PET) bottle-to-bottle recycling for the beverage industry: A Review. Polymers 2022, 14, 2366. [Google Scholar] [CrossRef] [PubMed]
  7. El Essawy, N.A.; Ali, S.M.; Farag, H.A.; Konsowa, A.H.; Elnouby, M.; Hamad, H.A. Green synthesis of graphene from recycled PET bottle wastes for use in the adsorption of dyes in aqueous solution. Ecotoxicol. Environ. Saf. 2017, 145, 57–68. [Google Scholar] [CrossRef] [PubMed]
  8. Bałazińska, M.; Kruczek, M.; Bondaruk, J. The environmental impact of various forms of waste PET bottle management. Int. J. Sustain. Dev. World Ecol. 2021, 28, 473–480. [Google Scholar] [CrossRef]
  9. Benavides, P.T.; Dunn, J.B.; Han, J.; Biddy, M.; Markham, J. Exploring comparative energy and environmental benefits of virgin, recycled, and bio-derived PET bottles. ACS Sustain. Chem. Eng. 2018, 6, 9725–9733. [Google Scholar] [CrossRef]
  10. Foolmaun, R.K.; Ramjeawon, T. Life Cycle Assessment (LCA) of PET bottles and comparative LCA of three disposal options in Mauritius. Int. J. Environ. Waste Manag. 2008, 2, 125–138. [Google Scholar] [CrossRef]
  11. Al-Shihabi, S.; Barghash, M. A System Dynamic Model for Polyethylene Terephthalate Supply Chain in the United Arab Emirates—Status, Projections, and Environmental Impacts. Sustainability 2023, 15, 13119. [Google Scholar] [CrossRef]
  12. Rowell, C.; Kuiper, N.; Shomar, B. Potential health impacts of consuming desalinated bottled water. J. Water Health 2015, 13, 437–445. [Google Scholar] [CrossRef]
  13. Grisales, V.; Tua, C.; Rigamonti, L. Life cycle assessment of bottled mineral water for the hospitality industry in Northern Italy. Packag. Technol. Sci. 2022, 35, 301–314. [Google Scholar] [CrossRef]
  14. Ajaj, R.; Abu Jadayil, W.; Anver, H.; Aqil, E. A Revision for the Different Reuses of Polyethylene Terephthalate (PET) Water Bottles. Sustainability 2022, 14, 4583. [Google Scholar] [CrossRef]
  15. Gulf News. How Much Money Will Filtered Tap Water Save You? 2020. Available online: https://gulfnews.com/your-money/saving-investment/how-much-money-will-filtered-tap-water-save-you-1.1582815501994 (accessed on 15 December 2023).
  16. Rajput, H.; Maraqa, M.A.; Zraydi, F.; Al Khatib, L.A.; Ameen, N.; Ben ElKaid, R.; Al Jaberi, S.S.; Alharbi, N.A.; Howard, R.; Aly Hassan, A. A survey on the use of plastic versus biodegradable bottles for drinking water packaging in the United Arab Emirates. Sustainability 2022, 14, 2664. [Google Scholar] [CrossRef]
  17. Times, K. Dubai Can Initiative: Is It Safe to Drink Tap Water in UAE? 2022. Available online: https://www.khaleejtimes.com/environment/dubai-can-initiative-is-it-safe-to-drink-tap-water-in-uae (accessed on 15 December 2023).
  18. Business Insider. The 20 Most Visited Cities Around the World in 2018. 2018. Available online: https://www.businessinsider.com/most-visited-cities-in-the-world-2018-9 (accessed on 15 April 2023).
  19. Media Office. Dubai Achieves Its Best-Ever Annual Tourism. 2024. Available online: https://mediaoffice.ae/en/news/2024/February/07-02/Dubai-achieves-its-best-ever-annual-tourism#:~:text=Dubai%20welcomed%20more%20tourists%20than,Economy%20and%20Tourism%20(DET) (accessed on 15 April 2023).
  20. Tourism, D. Tourism Performance Report January–March 2023. 2023. Available online: https://www.dubaitourism.gov.ae/en/research-and-insights/tourism-performance-report-march-2023 (accessed on 15 October 2023).
  21. Islam, M.S.; Uddin, M.J.; Alshehri, K. Plastic waste and carbon footprint generation due to the consumption of bottled waters in Saudi Arabia. Res. Dev. Mater. Sci. 2018, 5, 1–3. [Google Scholar] [CrossRef]
  22. EPA. Documentation for Greenhouse Gas Emission and Energy Factors Used in the Waste Reduction Model (WARM)-Containers, Packaging, and Non-Durable Good Materials Chapters. 2022. Available online: https://www.epa.gov/warm/documentation-chapters-greenhouse-gas-emission-energy-and-economic-factors-used-waste (accessed on 15 December 2023).
  23. Chatterjee, S.; Hazra, D.; Byun, Y.C. IncepX-Ensemble: Performance Enhancement Based on Data Augmentation and Hybrid Learning for Recycling Transparent PET Bottles. IEEE Access 2022, 10, 52280–52293. [Google Scholar] [CrossRef]
  24. News, U. Dubai Launches New Green Strategy to End Dependence on Landfill. 2021. Available online: https://www.thenationalnews.com/uae/environment/2021/08/03/dubai-launches-new-strategy-to-boost-recycling-rates-and-end-dependence-on-landfill-sites (accessed on 15 December 2023).
  25. HOTELIER. Jumeirah Beach Hotel Phases Out Plastic Bottle Use, Creates Onsite Bottling Plant. 2022. Available online: https://www.hoteliermiddleeast.com/properties/jumeirah-beach-hotel-bottle-plant (accessed on 15 December 2023).
  26. News, G. 50 Dubai Can Drinking Water Fountains by Year End. 2022. Available online: https://www.linkedin.com/pulse/50-dubai-can-drinking-water-fountains-year-end-stephan-buultjens (accessed on 15 December 2023).
  27. Al-Shihabi, S. The Polyethylene Terephthalate Water Bottles Problem in Dubai Hotels-Would an Initiative Solve this Problem or Does it Need a Law? Front. Sustain. Cities 2023, 5, 1244439. [Google Scholar] [CrossRef]
  28. Rigamonti, L.; Grosso, M.; Møller, J.; Sanchez, V.M.; Magnani, S.; Christensen, T.H. Environmental evaluation of plastic waste management scenarios. Resour. Conserv. Recycl. 2014, 85, 42–53. [Google Scholar] [CrossRef]
  29. Alhazmi, H.; Almansour, F.H.; Aldhafeeri, Z. Plastic waste management: A review of existing life cycle assessment studies. Sustainability 2021, 13, 5340. [Google Scholar] [CrossRef]
  30. Huang, S.; Wang, H.; Ahmad, W.; Ahmad, A.; Ivanovich Vatin, N.; Mohamed, A.M.; Deifalla, A.F.; Mehmood, I. Plastic waste management strategies and their environmental aspects: A scientometric analysis and comprehensive review. Int. J. Environ. Res. Public Health 2022, 19, 4556. [Google Scholar] [CrossRef] [PubMed]
  31. Sinha, V.; Patel, M.R.; Patel, J.V. PET waste management by chemical recycling: A review. J. Polym. Environ. 2010, 18, 8–25. [Google Scholar] [CrossRef]
  32. Al-Sabagh, A.; Yehia, F.; Eshaq, G.; Rabie, A.; ElMetwally, A. Greener routes for recycling of polyethylene terephthalate. Egypt. J. Pet. 2016, 25, 53–64. [Google Scholar] [CrossRef]
  33. Malik, N.; Kumar, P.; Shrivastava, S.; Ghosh, S.B. An overview on PET waste recycling for application in packaging. Int. J. Plast. Technol. 2017, 21, 1–24. [Google Scholar] [CrossRef]
  34. Nisticò, R. Polyethylene terephthalate (PET) in the packaging industry. Polym. Test. 2020, 90, 106707. [Google Scholar] [CrossRef]
  35. Kang, D.; Auras, R.; Singh, J. Life cycle assessment of non-alcoholic single-serve polyethylene terephthalate beverage bottles in the state of California. Resour. Conserv. Recycl. 2017, 116, 45–52. [Google Scholar] [CrossRef]
  36. Saylor, A.; Prokopy, L.S.; Amberg, S. What’s wrong with the tap? Examining perceptions of tap water and bottled water at Purdue University. Environ. Manag. 2011, 48, 588–601. [Google Scholar] [CrossRef] [PubMed]
  37. Geerts, R.; Vandermoere, F.; Van Winckel, T.; Halet, D.; Joos, P.; Van Den Steen, K.; Van Meenen, E.; Blust, R.; Borregán-Ochando, E.; Vlaeminck, S.E. Bottle or tap? Toward an integrated approach to water type consumption. Water Res. 2020, 173, 115578. [Google Scholar] [CrossRef] [PubMed]
  38. Arnold, J.T.; Chapman, S.N. Introduction to Materials Management; Pearson Education India: Delhi, India, 2004. [Google Scholar]
  39. Rebala, G.; Ravi, A.; Churiwala, S. An Introduction to Machine Learning; Springer: New York, NY, USA, 2019. [Google Scholar]
  40. Meade, N.; Islam, T. Forecasting the diffusion of innovations: Implications for time-series extrapolation. In Principles of Forecasting: A Handbook for Researchers and Practitioners; Springer: Boston, MA, USA, 2001; pp. 577–595. [Google Scholar] [CrossRef]
  41. Ilonen, J.; Kamarainen, J.K.; Puumalainen, K.; Sundqvist, S.; Kälviäinen, H. Toward automatic forecasts for diffusion of innovations. Technol. Forecast. Soc. Chang. 2006, 73, 182–198. [Google Scholar] [CrossRef]
  42. Al-Jabri, I.; Sohail, M.S. Mobile banking adoption: Application of diffusion of innovation theory. J. Electron. Commer. Res. 2012, 13, 379–391. [Google Scholar]
  43. Chang, H.C. A new perspective on Twitter hashtag use: Diffusion of innovation theory. Proc. Am. Soc. Inf. Sci. Technol. 2010, 47, 1–4. [Google Scholar] [CrossRef]
  44. Lee, H.J.; Oh, H. A study on the deduction and diffusion of promising artificial intelligence technology for sustainable industrial development. Sustainability 2020, 12, 5609. [Google Scholar] [CrossRef]
  45. Meade, N.; Islam, T. Modelling and forecasting the diffusion of innovation—A 25-year review. Int. J. Forecast. 2006, 22, 519–545. [Google Scholar] [CrossRef]
  46. Dearing, J.W.; Cox, J.G. Diffusion of innovations theory, principles, and practice. Health Aff. 2018, 37, 183–190. [Google Scholar] [CrossRef] [PubMed]
  47. Dhirasasna, N.; Sahin, O. A system dynamics model for renewable energy technology adoption of the hotel sector. Renew. Energy 2021, 163, 1994–2007. [Google Scholar] [CrossRef]
  48. Toka, A.; Iakovou, E.; Vlachos, D.; Tsolakis, N.; Grigoriadou, A.L. Managing the diffusion of biomass in the residential energy sector: An illustrative real-world case study. Appl. Energy 2014, 129, 56–69. [Google Scholar] [CrossRef]
  49. Baur, L.; Uriona, M. Diffusion of photovoltaic technology in Germany: A sustainable success or an illusion driven by guaranteed feed-in tariffs? Energy 2018, 150, 289–298. [Google Scholar] [CrossRef]
  50. Lee, J.H.; Hardman, S.J.; Tal, G. Who is buying electric vehicles in California? Characterising early adopter heterogeneity and forecasting market diffusion. Energy Res. Soc. Sci. 2019, 55, 218–226. [Google Scholar] [CrossRef]
  51. Krzymowski, A. Role and significance of the United Arab Emirates foreign aid for its soft power strategy and sustainable development goals. Soc. Sci. 2022, 11, 48. [Google Scholar] [CrossRef]
  52. Schwarz, N.; Ernst, A. Agent-based modeling of the diffusion of environmental innovations—An empirical approach. Technol. Forecast. Soc. Chang. 2009, 76, 497–511. [Google Scholar] [CrossRef]
  53. Vishwanath, A. Impact of personality on technology adoption: An empirical model. J. Am. Soc. Inf. Sci. Technol. 2005, 56, 803–811. [Google Scholar] [CrossRef]
  54. Roehrich, G. Consumer innovativeness: Concepts and measurements. J. Bus. Res. 2004, 57, 671–677. [Google Scholar] [CrossRef]
  55. Bourdieu, P. Distinction: A social critique of the judgement of taste. In Social Stratification, Class, Race, and Gender in Sociological Perspective, Second Edition; Routledge: London, UK, 2019; pp. 499–525. [Google Scholar]
  56. Jeyaraj, A.; Rottman, J.W.; Lacity, M.C. A review of the predictors, linkages, and biases in IT innovation adoption research. J. Inf. Technol. 2006, 21, 1–23. [Google Scholar] [CrossRef]
  57. Faiers, A.; Neame, C. Consumer attitudes towards domestic solar power systems. Energy Policy 2006, 34, 1797–1806. [Google Scholar] [CrossRef]
  58. Jager, W. Stimulating the diffusion of photovoltaic systems: A behavioural perspective. Energy Policy 2006, 34, 1935–1943. [Google Scholar] [CrossRef]
  59. Lee, N.R.; Kotler, P. Social Marketing: Influencing Behaviors for Good; SAGE Publications: Thousand Oaks, CA, USA, 2011. [Google Scholar]
  60. Simon, H.A. A behavioral model of rational choice. Q. J. Econ. 1955, 69, 99–118. [Google Scholar] [CrossRef]
  61. Von Der Gracht, H.A. Consensus measurement in Delphi studies: Review and implications for future quality assurance. Technol. Forecast. Soc. Chang. 2012, 79, 1525–1536. [Google Scholar] [CrossRef]
  62. Vaidya, O.S.; Kumar, S. Analytic hierarchy process: An overview of applications. Eur. J. Oper. Res. 2006, 169, 1–29. [Google Scholar] [CrossRef]
  63. Guidolin, M.; Guseo, R. The German energy transition: Modeling competition and substitution between nuclear power and Renewable Energy Technologies. Renew. Sustain. Energy Rev. 2016, 60, 1498–1504. [Google Scholar] [CrossRef]
  64. Wani, T.A.; Ali, S. Innovation diffusion theory. J. Gen. Manag. Res. 2015, 3, 101–118. [Google Scholar]
  65. Coyle, R.G. System dynamics modelling: A practical approach. J. Oper. Res. Soc. 1997, 48, 544. [Google Scholar] [CrossRef]
  66. Yeung, J.F.; Chan, A.P.; Chan, D.W.; Li, L.K. Development of a partnering performance index (PPI) for construction projects in Hong Kong: A Delphi study. Constr. Manag. Econ. 2007, 25, 1219–1237. [Google Scholar] [CrossRef]
  67. Hasson, F.; Keeney, S.; McKenna, H. Research guidelines for the Delphi survey technique. J. Adv. Nurs. 2000, 32, 1008–1015. [Google Scholar] [CrossRef]
  68. Chyung, S.Y.; Roberts, K.; Swanson, I.; Hankinson, A. Evidence-based survey design: The use of a midpoint on the Likert scale. Perform. Improv. 2017, 56, 15–23. [Google Scholar] [CrossRef]
  69. Singh, A.; Malik, S.K. Major MCDM Techniques and their application—A Review. IOSR J. Eng. 2014, 4, 15–25. [Google Scholar] [CrossRef]
  70. Ishizaka, A.; Labib, A. Review of the main developments in the analytic hierarchy process. Expert Syst. Appl. 2011, 38, 14336–14345. [Google Scholar] [CrossRef]
  71. Emerson, R.W. Convenience sampling, random sampling, and snowball sampling: How does sampling affect the validity of research? J. Vis. Impair. Blind. 2015, 109, 164–168. [Google Scholar] [CrossRef]
  72. Wedley, W.C. Consistency prediction for incomplete AHP matrices. Math. Comput. Model. 1993, 17, 151–161. [Google Scholar] [CrossRef]
  73. Saaty, T.L. What is the Analytic Hierarchy Process? Springer: New York, NY, USA, 1988. [Google Scholar]
  74. Rogers, E.M.; Singhal, A.; Quinlan, M.M. Diffusion of Innovations; Routledge: London, UK, 2014; pp. 432–448. [Google Scholar]
  75. Bass, F.M. A new product growth for model consumer durables. Manag. Sci. 1969, 15, 215–227. [Google Scholar] [CrossRef]
  76. Mahajan, V.; Muller, E.; Bass, F.M. New product diffusion models in marketing: A review and directions for research. J. Mark. 1990, 54, 1–26. [Google Scholar] [CrossRef]
  77. Toşa, C.; Miwa, T.; Morikawa, T. Modelling and forecasting car ownership in Romania’s counties using bass diffusion model. In Proceedings of the European Transport Conference, Frankfurt, Germany, 28–30 September 2015; pp. 28–30. [Google Scholar]
  78. Horvat, A.; Fogliano, V.; Luning, P.A. Modifying the Bass diffusion model to study adoption of radical new foods—The case of edible insects in the Netherlands. PLoS ONE 2020, 15, e0234538. [Google Scholar] [CrossRef]
  79. Dunn, A.G.; Braithwaite, J.; Gallego, B.; Day, R.O.; Runciman, W.; Coiera, E. Nation-scale adoption of new medicines by doctors: An application of the Bass diffusion model. BMC Health Serv. Res. 2012, 12, 248. [Google Scholar] [CrossRef]
  80. Bass, F.M.; Krishnan, T.V.; Jain, D.C. Why the Bass model fits without decision variables. Mark. Sci. 1994, 13, 203–223. [Google Scholar] [CrossRef]
  81. Sterman, J. Business Dynamics; Irwin/McGraw-Hill: Boston, MA, USA, 2010. [Google Scholar]
  82. Barlas, Y. Formal aspects of model validity and validation in system dynamics. Syst. Dyn. Rev. J. Syst. Dyn. Soc. 1996, 12, 183–210. [Google Scholar] [CrossRef]
  83. Senge, P.M.; Forrester, J.W. Tests for building confidence in system dynamics models. Syst. Dyn. TIMS Stud. Manag. Sci. 1980, 14, 209–228. [Google Scholar]
  84. EPA. Tailpipe Greenhouse Gas Emissions from a Typical Passenger Vehicle. 2023. Available online: https://nepis.epa.gov/Exe/ZyPDF.cgi?Dockey=P1017FP5.pdf (accessed on 15 December 2023).
Figure 1. Research main steps.
Sustainability 16 03121 g001
Figure 2. SD model representing the growth in tourists, GHG emissions, and number of hotels in each category.
Sustainability 16 03121 g002
Figure 3. Extension to the SD model shown in Figure 2 to account for hotel transition to being non-PET users.
Sustainability 16 03121 g003
Figure 4. Percentage of hotels in each group that are not using PET bottles in the best-case scenario.
Sustainability 16 03121 g004
Figure 5. Best-case scenario GHG emissions.
Sustainability 16 03121 g005
Figure 6. Percentage of hotels in each group that are not using PET bottles in the average-case scenario.
Sustainability 16 03121 g006
Figure 7. Average-case scenario GHG emissions.
Sustainability 16 03121 g007
Figure 8. Percentage of hotels in each group that are not using PET bottles in the worst-case scenario.
Sustainability 16 03121 g008
Figure 9. Worst-case scenario GHG emissions.
Sustainability 16 03121 g009
Table 1. Questions addressing hotels’ perspectives about abolishing PET bottles.
Question μ σ
Cost is the major obstacle to not abolishing PET bottles in hotels1.450.56
If hotels of the same category abolish using PET bottles, then my hotel would do the same4.230.73
If hotels of higher category abolish using PET bottles then my hotel would do the same3.820.89
Tourists value sustainable practices like providing them with alternatives to PET water bottles3.020.78
Table 2. AHP scale used to compare the identified factors.
RankDescription
1Equally important
3Moderately important
5Strongly important
7Significantly important
9Extremely important
Table 3. AHP comparison matrix using random values.
Peer PressureSuperior PressureTourist Pressure
Peer pressure11/570.28
Superior pressure5150.64
Tourist pressure1/71/510.08
6.141.413
Table 4. Number of hotels and rooms and occupancy rates in Dubai hotels. Source: www.dubaitourism.gov.ae/en/research-and-insights/tourism-performance-report-jan-2023 (Accessed on 15 December 2023).
CategoryNumberRoomsOccupancy
5-Star15249,99078%
4-Star19142,71081%
1–3-Star27328,82780%
Deluxe Apartments8112,90984%
Standard Apartment11212,76384%
Table 5. Average weight of PET bottles by capacity based on Islam et al. (2018) [21] and a generic PET bottle used for calculations.
Bottle Size (mL)Average Weight (g)PET Weight (g)/L
2506.4125.64
33014.3143.36
60019.7132.85
150032.621.73
Generic (1000)30.8930.89
Table 6. Values of p and q used in the three scenarios and the GHG savings for 25 years based on each scenario.
ScenariopqNew HotelsGHG Savings (MtCO2e)
Best0.03470.5541Non-PET250,306
Average0.01860.3626Proportional142,391
Worst0.00250.1711PET36,452
Disclaimer/Publisher’s Note: The statements, opinions and data contained in all publications are solely those of the individual author(s) and contributor(s) and not of MDPI and/or the editor(s). MDPI and/or the editor(s) disclaim responsibility for any injury to people or property resulting from any ideas, methods, instructions or products referred to in the content.

