1. Introduction
The COVID-19 pandemic significantly impacted our everyday activities and the usage of open public spaces in cities [
1]. Different measures worldwide included regulations on the maximum number of people in a public space, the maximum time spent outdoors, and social distancing measures. These regulations varied regionally, but they all had one thing in common—controlling the way and means of using open public spaces. The pandemic was declared in Serbia in March 2020, followed by regulations based on WHO suggestions and the country’s overall healthcare status. Between March and July 2020, the Serbian government implemented various social measures, such as restrictions and lockdowns, thus seriously transforming everyday life that could affect citizens’ physical and mental health [
1,
2].
Regardless of the pandemic context, spending time in open spaces, especially OGS, can benefit public health for multiple reasons. Natural open space elements have a rather important role in improving public health, focusing on characteristics that influence our sensory systems [
3]. More precisely, greenery and landscape vistas, sunlight, and even natural sounds and smells can lower stress levels, affecting physical health and enhancing the physiological processes in the body, resulting in overall better health outcomes and well-being [
4,
5,
6,
7]. Frederick Law Olmsted underlines that parks are the lungs of a city [
8]. However, in the state of a pandemic, the usage of these spaces is regulated and limited, primarily due to the concern for personal safety. At the same time, people are afraid to use OGS freely. In this research, the focus is on the users’ perception regarding their perceived safety and satisfaction. The main research questions are: Does the pandemic state influence the usage of OGS in cities, and how? What could be the possible solution for spending more time in OGS during and after the pandemic?
Based on the overall topic of this paper, the available literature, research problems, and the identified research gap, the goal of this paper is to (1) analyze the usage of OGS during and after the pandemic, mainly from the perspective of perceived safety and (2) to explore the possible role of ICT—Information and communication Technology (usage of mobile applications by OGS users)—in increasing personal and perceived safety, therefore increasing the overall usage of OGS under conditions such as pandemics and after pandemic periods. Regarding the post-COVID-19 period, the additional aim of this research is to (3) assess the possible long-term effects that COVID-19 had on the usage of OGS, as well as (4) provide a comparison of OGS usage during and after the pandemic. Additionally, the essential goal is to bridge the research gap by considering age or gender variations, i.e., the possible effect on questions regarding perceived safety in OGS and willingness to use aforementioned mobile applications.
2. Background Research
The term open green space (with variations: OGS, green space, urban green space, open space, and others) is well known and commonly used. Nevertheless, there are numerous definitions, so Taylor and Hochuli D.F. emphasize the importance of the research context, discipline, culture, and regional specificities [
9]. Of those mentioned in Taylor and Hochuli’s article, the definition that open greenspace is urban vegetation and nature in the urban context is closer to the context of this research. On the other hand, Vilcins, Sly, Scarth and Mavoa state that open green space includes forested land, public parks, land within private institutions, golf courses, and natural land around waterways, all in private and public land [
10]. Similarly, other authors include the following open green spaces: urban green parks, square spaces, and waterfront spaces. Aiming to use the term open greenspace(s) correctly in the research context, this research includes the following urban open greenspaces (OGS): urban parks, squares, open greenspaces along waterfronts, and urban forested lands [
11]. In this paper, the following understanding of the term “park” has been implied (unless the authors of references given in the paper used a different meaning): (Urban) park is a public greenspace located in any part of the city which with its position, size, equipment, capacity, quality and accessibility, can attract and serve residents of a part of the city or several city municipalities [
12]. Likewise, the following definition of an (urban) square has also been implied: “Square is a landscaped green area, intended for public use, with an area of less than 1 ha, maintained to provide conditions for a short-term relaxation of residents and improvement of the visual quality of the environment” [
12].
2.1. The Importance of OGS for Health and Well-Being
The understanding of health has shifted from a medical term to the well-being of the body, soul and mind [
5,
7], while care for public health and a healthy lifestyle has become a new imperative, thus creating a need for designing healthier environments. Spending time in OGS is one of the crucial elements that can influence overall public health and well-being [
13].
Just like pandemics have repeatedly reshaped city environments throughout history [
14], the COVID-19 pandemic has influenced everyday life in urban areas and how people work, travel and socialize [
15]. It imposed staying indoors for a great deal of time and altered OGS visit patterns, which is not sustainable in the long run as it can lead to mental and physical health issues [
16,
17]. In parallel, virtual space threatened to replace the real space, thus decreasing the overall usage of OGS. During the pandemic and with the help of mobile applications, people attended virtual social events in a virtual environment, making a virtual alternative for public life and socialization [
18]. In the post-pandemic times, when there are no space-related restrictions, it is necessary to encourage the use of OGS from a public health point of view.
According to environmental psychology, the use of natural green environments and OGS significantly lowers stress levels and anxiety, resulting in better health outcomes [
6,
19,
20]. Ulrich states that even a passive form of spending time in OGS, such as a view towards the green landscape, is salutogenic and can help reduce stress [
21]. Further, the psycho-evolutionary theory argues that people have an inherited ability to respond positively to various elements of nature [
6,
21]. Natural characteristics such as greenery, landscape, sunlight, fresh air and natural sounds can influence overall health by reducing stress levels [
22,
23,
24]. In the 1980s, Kaplan and Kaplan established the Attention Restoration Theory [
25], which explains how spending time in the natural environment can lead to mental resting and regaining psychological strength. Also, exposure to natural conditions strengthens the immune system and reduces the risk of chronic diseases. Natural elements of OGS induce positive behavioral and psychological changes, emotions, and cognitive activities, which reduce the risk of mental illness, psychosis, depression, and anxiety [
7,
21,
23,
24,
25,
26,
27,
28]. The usage of OGS, especially during the pandemic, is gaining even more importance [
29].
2.2. Monitoring the Usage of OGS during the Pandemics
Following the WHO’s recommendations during the pandemic, OGS were closed in many countries worldwide [
30,
31] to prevent the spread of COVID-19. Later, one of the main restrictions worldwide, other than the WHO’s recommendations regarding the 2 m social distancing rule [
32,
33], considered the number of users in specific spaces based on the presumptions regarding the possible spreading of the virus. Distancing rules had to consider multiple factors, including viral load, ventilation, type of activity, indoor and outdoor settings, and masking [
33]. After OGS reopened, a maximum of five people were allowed to stay close to each other, provided they wore masks, and a distance of 2 m between people was recommended. The COVID-19 pandemic, which initially prompted widespread lockdowns, subsequently inspired people around the globe to seek out OGS near their homes.
During the two-year pandemic, significant research was conducted on using and controlling OGS through surveys about the frequency, duration, and types of activities, but with different research aims [
31,
34]. Research from Hungary presented how people had used public OGS before and after the first wave of the pandemic and their expectations of OGS use in the post-pandemic period [
35]. The paper also emphasized the significance of OGS use in maintaining the livability of Hungarian settlements [
35]. Research in Krakow (Poland) aimed to demonstrate the impact of the COVID-19 pandemic on the significance of urban green areas, specifically regarding the mental and physical health of the population, which had become a significant challenge [
31,
34]. Their results empirically demonstrated the importance of OGS for residents and how they can influence urban spatial policy and the management of these areas [
31].
On the other hand, Curtis, D. et al., in a study titled: “Policy and Environmental Predictors of Park Visits During the First Months of the COVID-19 Pandemic: Getting Out While Staying in”, used 620 weekly cell phone location data from the US countries during the pandemic in 2020 [
36], aiming to identify the factors influencing park visitation patterns in the early stages of the pandemic. This study’s significance lies in analyzing the relationship between policy measures, environmental factors, and individuals’ decisions to visit parks. By examining these predictors, the study provides valuable insights into how public health policies and environmental characteristics shape people’s behaviors and choices concerning park visits during a pandemic [
36]. Similarly, a study of various OGS in New Jersey analyzed geotagged social media data to investigate whether OGS’s visitation increased during the onset of the COVID-19 pandemic and whether shutdown orders effectively deterred OGS usage [
17]. They examined OGS usage during four specific stages in spring 2020: (1) before the pandemic, (2) during the initial phase of the pandemic, (3) during a state-wide OGS shutdown order, and (4) after the lifting of the shutdown. Their findings indicate that OGS visitation experienced a significant increase when the pandemic began. The subsequent OGS shutdown order resulted in a severe decline in visitation, while OGS that remained open continued to have high visitation levels. Visitation returned to the elevated levels seen before the shutdown once closed, and OGS were allowed to reopen. Volenec Z. et al. emphasized the ongoing significance of OGS as valuable community resources and their vital role in promoting public health and psychological well-being [
17], especially in limited recreational opportunities.
2.3. Monitoring the Usage of OGS after Pandemics
This part of this research considers the post-COVID-19 period from 2023, as the pandemic’s end was proclaimed in May 2023 [
37]. Research on the post-COVID-19 consequences of OGS usage is numerous, but it has different outcomes, examines different demographic groups, and uses quite different methods, thus making it rather tricky to summarize “the common ground” for further research and leaving a research gap.
The research on green space and the health of older adults during and after the pandemic in Tehran showed that older people visited smaller, neighboring OGS during the pandemic, as opposed to the period after the pandemic when they mostly visited the larger OGS [
38]. In their study on changes in visits to OGS during and after the pandemic in Japan, Hyerin Kim et al. (2023), using Mobile phone GPS data and census data, concluded that the number of visitors to urban OGS has decreased after the pandemic, while at the same time, the number of visits has increased on most nature trails in the backcountry [
39]. In the case of Madrid, the data given by Talavera-Garcia, Perez-Campaña & Cara-Santana unveiled the pandemic’s impact on visits to Madrid’s parks during and after the pandemic [
40]. Their insights from mobile phone data analysis using Big Data imply a general decrease in trips to urban parks post-COVID-19. In contrast, smaller, local, community-led parks suffered a smaller decline in visitors and even an increase in the number of visits. Recent research in monitoring OGS use, specifically the spatiotemporal patterns of recreational activities in three urban parks in Moscow, Russia, before, during, and after the COVID-19 pandemic, indicates a decrease in activities and subsequent reactivation [
41].
A study regarding planning for Egyptian cities in the post-COVID-19 era suggests different and more networked urban green places in green infrastructure, thus connecting all kinds of OGS (even green roofs) so that residents can move more easily and connect to nature [
42]. Qualitative and quantitative studies on Wuhan citizens using OGS after the pandemic indicate changes in visitations to such places regarding the preferred areas, duration, purpose, frequency, and other aspects [
43]. Positive trends are manifested through an increased number of residents choosing to use OGS for relaxation and physical exercise, more considerable frequency and duration, and increased general citizens’ willingness to visit green spaces.
2.4. ICT Mobile Applications in Controlling the Usage of OGS
In his paper, Kummitha investigated the contrasting approaches of China and Western democracies in utilizing smart technologies to combat perceived safety and space usage during the COVID-19 pandemic [
1]. The author emphasized the difference between the Chinese top-down, technology-driven approach with active national government coordination (possibly related to control and censorship) and the Western, human-driven approach, which mainly relies on technology to inform, persuade, and achieve consensus among citizens. There is concern that some governments might exploit the pandemic to extend technological surveillance over citizens beyond the scope of pandemic control [
1].
Cui, Malleson, Houlden and Comber discuss using social media data—Twitter—to examine spatiotemporal changes in OGS use in London, comparing georeferenced Tweets during three-month periods from 2019 to 2023 [
44]. This method can help in informing policy makers to plan and manage OGS during a crisis. The previous study by the same authors, through extensive literature research, examined using volunteered geographical information and social media data to understand OGS usage [
45]. Their research on more than 170 research papers summarizes the characteristics and usage of data from different platforms: Twitter and Weibo (providing text-based data), Instagram and Flickr (providing image-based data), and OpenStreetMap (providing map-based data) for gathering information. This directs future research on using existing social media to generate information about safety in OGS. Park S, Kim S, Lee J, and Heo B. analyzed social media data on OGS perception changes before and after the COVID-19 pandemic using a machine-learning approach for New York, New Jersey, and Connecticut [
46]. In contrast to the other studies, this study focused on human perception changes and people’s emotional experiences.
Finally, it is helpful to mention the systematic overview by Zabelskyte, G., Kabisch, N., and Stasiskiene, Z. on social media data applications concerning visitations to urban OGS [
47]. The study’s findings managed to identify the patterns of OGS use and analyze visitors’ needs and demands, as well as the advantages and limitations of using social media data regarding potentially biased information and data security issues.
All the studies emphasized the significance of OGS for mental and physical health and the necessity of controlling them during a pandemic due to the fear of COVID-19 infections. Increasing the availability of natural green areas and integrating them into urban green infrastructure may be the most relevant policy to acknowledge the crucial role of urban nature as a source of resilience in turbulent times [
41].
From the previous literature overview, it can be concluded that the use of different ICT tools by researchers was and still is widespread, intending to establish patterns of behavior of OGS users during and after the pandemic. It is fair to say that it was conducted based on available means and not a standard methodology; furthermore, the application of ICT tools in monitoring the use of OGS comes mostly from researchers or (local, national) government and not so much from the users of these areas themselves. This represents the research gap aimed to be resolved by involving the survey questions about the usage of ICT tools by OGS users to monitor and, to some extent, control the safety of these urban green areas.
3. Methodology
The paper’s methodology encompasses qualitative and quantitative methods, including (1) theoretical background research and focused content analysis, (2) an exploratory case study with expert observation and a focus on conducting two survey questionnaires among the users and data analysis.
- (1)
The content analysis research included an extensive literature review of current studies and primary research topics in the domain of OGS and health, COVID-19 regulations, with a particular focus on the usage of OGS during the pandemics and the possible use of ICT for crowd monitoring. Further, the research results regarding OGS usage before and during the pandemics were compared.
- (2)
The case study was developed by analyzing the OGS areas in Belgrade, Serbia. Since the main focus of this research is on the usage of these spaces, 42 OGS from all over the city of Belgrade were selected as the research polygon. Participants were the users of OGS in Belgrade. They were asked several questions regarding the usage of approximately 30 public OGS in 10 different Belgrade municipalities. Two similar surveys were conducted in the same location but during different periods: the first survey was done in 2020 to gather data about the users of OGS during the pandemic, and the second in 2024, after the pandemic, to determine the possible long-term effects of the COVID-19 pandemic on OGS usage and enable comparison of the results from the two surveys.
The first survey was conducted during the lockdown period in April and May 2020. A total of n = 412 people participated in the survey. The questionnaire contained precoded questions divided into two parts—A and B. At the beginning of the questionnaire, general data about the users, such as age, gender, and location (municipality) where they use open greenspace most often, were gathered. Part A included questions about OGS usage during a pandemic, such as the duration, frequency, and activity of OGS visits before and during the pandemic. Also, the participants were asked if they behaved according to social distancing regulations and perceived safety.
Part B of the questionnaire was oriented towards analyzing the possible interest of users in OGS crowd tracking via customized mobile applications. These questions focused on perceived safety in the context of monitoring the OGS. Therefore, users were asked whether they would be interested in ICT, such as mobile applications, that would allow them to know the frequency of users in a specific OGS and if they would be willing to provide their phone’s location to use such applications.
Survey data analysis included several statistical methods. Regarding the 2020 research survey, the statistical process of the gathered results was divided into three parts. In the preliminary stage, the descriptive structure of the data, with tables and graphical plots, was analyzed. This analysis aimed to obtain a comprehensive overview of the survey results.
In the second stage, χ2 independence tests were conducted to investigate the dependence structure among selected features. The results allowed us to identify relationships between features or to rule out links between them. The independence hypothesis is rejected if its p-value is below a chosen significance level. If that is the case, we reject that the two features are statistically independent. Otherwise, we cannot deny their independence.
The third and final step involved a machine learning prediction to forecast perceived safety enhancements from possible monitoring via mobile apps. The machine learning model used is the state-of-the-art Random Forest Classifier with ten features. The predictions with those from the Xgboost model are compared. [
48].
The second survey presented the continuation of the 2020 survey and was conducted in January and February 2024. It consisted of nine post-COVID-19-related questions (Q1–Q9) that 451 survey participants answered. The questions were similar but not identical to the 2020 survey. They focused on the possible pandemic influence on OGS usage today, almost four years after the first COVID-19 outbreak in Serbia.
The outcomes of the 2024 survey in multiple χ2 Independence Tests were analyzed. The dependence between demographic features, perceived safety-related features and interest in the mobile apps was tested. Finally, COVID-19 and post-COVID-19-related differences were compared with two-sample proportion tests to check the differences in mobile app interest and perceived safety enhancements with data and knowledge of the pre- and post-pandemic survey.
All the questions from the 2020 and 2024 surveys are listed in
Table A1 in the
Appendix A.
4. Results
This research monitored the usage of OGS—specifically urban locations in Belgrade, Serbia—during and after the COVID-19 pandemic. OGS, as defined in
Section 2, represented the survey site conducted in 2020 and 2024. Belgrade is home to more than 40 OGS spread across ten municipal areas, with a concentration in Savski Venac and Zemun municipalities, while the OGS of the municipality of Novi Beograd occupy the largest expanse. OGS cover over 385 hectares and presents significant land usage in the city [
49,
50,
51,
52,
53]. The development of OGS in Belgrade commenced during the reign of Prince Miloš, with most OGS dating back to the latter half of the 19th and the early 20th century. In the 1840s, the first rows of trees were planted in Belgrade, and the oldest city park, Financial Park, was established in 1860 [
54].
All major OGS in Belgrade municipalities were taken into consideration. Municipalities such as “Stari grad” and “Savski Venac” were among the most frequently used OGS, alongside other OGS in municipalities shown in
Figure 1. A total of 42 OGS in Belgrade were used as the research polygon, and their distribution in Belgrade municipalities is shown in
Figure 1 below.
4.1. Data Analysis of User Perception on OGS Usage during the Pandemic in 2020
This survey includes a questionnaire comprising the questions in the two-part questionnaire (List of questions, see
Table A1 in
Appendix A). In the first step, the descriptive nature of the data for each question is analyzed. The majority of participants are female (67.5%, and male 32.5%). Most attendants are between 15 and 24 years old (39.8%), and the average respondent is around 35. Older participants, aged 41 years or more, form 29.2% of the population. The remaining 31.0% of the population are participants between 25 and 40 (see
Table A2 in
Appendix B).
Firstly, the participants were asked about their OGS-visiting habits. The questions target their pre- and during-pandemic OGS visiting routine. Data showed that most participants are frequent OGS visitors, which speaks to the representativeness of this questionnaire. Key observations are: half of the participants (49.5%) were frequent OGS visitors with at least a few times per week visits before the pandemic, and only 2.3% of all users stated they did not visit the OGS before the pandemic. For the majority, this did not change during the pandemic. A total of 64.7% of the participants report visiting OGS at least as frequently as before the pandemic. A portion of 40.5% even increased their visits. The preferred time for more than half of users (68.3%) extends to 1 h spent in the OGS (see
Table A3 and
Table A4 in
Appendix B).
The most popular OGS visited by users are located in Novi Beograd (17.3%), Vračar (14.9%), Stari grad (14.4%), Palilula (12.7%) and Zemun (11.6%). A detailed overview of the remaining municipalities is provided in
Table A5 in
Appendix B.
Participants could select from multiple choices regarding the social aspects of OGS visits. The majority (73.5%) prefer to spend their visit to OGS with others, either with a partner or a friend (35.6%), groups of friends (31.1%) or with children (6.8%). The remaining (26.5%) prefer to visit the OGS alone or with a pet. Meetings in larger groups are unpopular (5.4%) (see
Table A6 in
Appendix B).
One of the principal COVID-19-related regulations in Serbia targeted the reduced number of visitors in specific OGS. Participants were asked about their interest in using a possible mobile application that could track their location and inform them about the frequency of users in the selected OGS and whether usage of these applications would enhance their subjective physical and COVID-19-related safety. Interestingly, the majority of participants (64.2%) were interested in using this kind of application and many (57.0%) would anonymously share their location to use the app (see
Table A7 and
Table A8 in
Appendix B). Data further show that OGS monitoring through the apps would provide an increased feeling of physical safety to more than half of all users—the 54.2% of all the participants. Moreover, 56.2% of the participants would feel more safe from possible COVID-19 infections while using the app (see
Table A9 and
Table A10 in
Appendix B).
In the second stage of this research, the dependency structure between features, is analyzed by testing independence between selected features of interest. The independence hypothesis is rejected if its p-value is below a chosen significance level. If that was the case, the two statistically independent features were rejected. Otherwise, their independence cannot be denied.
Given the 5% confidence level, analyzing and considering OGS visit preferences among demographic groups began. The consideration of age group implies categorical variables equivalent to a child, young, middle-aged or old. Specifically, independence between demographics (age, gender) and OGS visit preferences, app interest, and subjective safety is tested.
First, three χ
2 independence tests are performed to test the independence between the gender and any OGS visit-related features. The test results are presented in
Table 1,
Table 2,
Table 3,
Table 4,
Table 5,
Table 6,
Table 7 and
Table 8 below. Pre-pandemic OGS visits by gender are shown in Contingency
Table 1. Given a
p-value of 62.39%, the hypothesis that gender is independent of any OGS visit-related features cannot be rejected.
Table 3 and
Table 4 are contingency tables demonstrating how the visiting frequency increased during the pandemic by gender and age, respectively.
Table 5 summarises pre-pandemic OGS visits by age. With strong significance (
p-value = 0.01%), the independence test indicates dependence between age and pre-pandemic OGS visits.. The resulting independence tests lead to the
p-values
p = 16.02% and
p = 7%. Thus, the hypothesis that changes in the frequency of visits are independent of demographic characteristics cannot be rejected. Contingency
Table 2 and
Table 6 summarise time spent in an OGS during the pandemic by gender and age, respectively. The test results provide the
p-values
p = 6.94% and
p = 12%, respectively. Hence, the hypothesis that time spent in an OGS during the pandemic is independent of demographics (
p-value > 5%) cannot be rejected. Contingency
Table 7 presents results of pandemic-related visiting habit changes by age.
Table 8 presents Chi-square test result that relates to Contingency
Table 5,
Table 6 and
Table 7, respectively.
Second, the independence between demographics (age, gender) and the interest in the app were analyzed. The interest in the app by gender and age, respectively, is presented in
Table A11 and
Table A12 in
Appendix B. The test results are found in
Table 9,
Table 10,
Table 11 and
Table 12 below. Contigency
Table 9 presents the Location sharing by gender.
Table 10 presents Chi-square test results that relates to Contigency
Table A11 (in
Appendix B) and
Table 9, respectively. On the one hand, the hypothesis that gender is independent of the interest in app technology (
p-value = 57.38%) cannot be rejected. On the other hand, the independence between the age and the interest in the app (
p-value < 5%) was rejected. Location-sharing willingness by demographics is presented in
Table 9 and
Table 11. According to the test results in
Table 12, both tests cannot be rejected (
p-value = 0.57;
p-value = 0.69).
The independence of safety-related features and demographics was questioned. The gender-related test results are listed in
Table 13,
Table 14,
Table 15 and
Table 16, and the age-related results are in
Table 17,
Table 18,
Table 19 and
Table 20. Subjective physical safety is compared by gender and age in
Table 13 and
Table 17, respectively. The independence between enhanced physical safety through the app and gender (
p-value = 4%) was rejected. With strong significance, the independence of physical safety enhancement and age (
p < 0.01%) was rejected. In Contingency
Table 14 and
Table 18, COVID-19-related safety by gender and age, respectively, was compared. While the independence of COVID-19-related safety and gender (
p-value = 56%) cannot be rejected, with strong significance, the independence between age and COVID-19-related safety enhancements by monitoring (
p < 0.01%) is rejected.
A third pair of contingency tables compare social distancing practices by gender in
Table 15 and age in
Table 19. According to the test results, the independence of demographic features from social distancing practices (
p-value = 0.27;
p-value = 0.14) cannot be rejected.
It is interesting to analyze the dependence between the interest in the app and features relating to OGS visits. Contingency
Table 21 compares the interest in the app to pre-pandemic OGS visit habits. The test results are listed in Contingency
Table 22. With strong significance (
p < 0.01%), dependence between pre-pandemic OGS visit habits and interest in the app was tested. The test result rejects the independence of time spent in the OGS and interest in the app with strong significance (
p < 0.01%). Interest in the app could be evaluated by increased visit frequency during the pandemic, and the independence of these two features cannot be rejected (
p = 10.56%).
Lastly, the dependence structure between interest in app technology (personal location sharing) and perceived safety enhancement (physical, COVID-19-related) was analyzed.
Table 23 shows interest in the app through its physical safety enhancements.
Table 24 illustrates the interest in the app by perceived COVID-19-related safety enhancements. According to the test results provided in
Table 25, the interest in the app is not independent of perceived safety enhancements with strong significance (
p-value < 0.01% in both cases). This result is expected since all safety-related questions are related to interest in monitoring technology.
Machine Learning
Considering the overall aim of this research and the survey, the prediction of perceived safety enhancements through monitoring was analyzed. Specifically, the goal was to determine safety prediction based on the survey results. The target variable ‘safety’ is defined as an intersection of the variables ‘physical perceived safety’ (Q8) and ‘COVID-19-related safety’ (Q9). On the conservative approach, the individual perception was labelled as safe if ‘physical perceived safety’ (Q8) and ‘COVID-19-related safety’ (Q9) were satisfied (For a list of questions, see
Table A1 in
Appendix A). The Random Forest and Xgboost models are classification models used to estimate the probability of perceived safety. Broadly, these models are tree-based models that generate a multitude of decision trees and output decision tree averages. One decision tree is illustrated in
Figure 2. The input of these models includes ten features such as age, gender, municipality visited, location, duration, frequency, and activities of OGS visits. Given some threshold probability, these estimated models help us to predict whether someone feels safe in OGS.
The model’s performance is evaluated by the generalization accuracy on a test set that contains 25% of the initial data set. According to the accuracy metrics in
Table 26, the Xgboost model performs slightly better than the Random Forest model. A test set performance of 73% means that 73% of the cases are correctly classified whether someone feels safe. The above metric classifies safety if the estimated probability is above a threshold of 50%. If the aim is to ensure perceived safety at any threshold, a suggestion is to look at the Receiver operating characteristic (ROC) illustrated in
Figure 3. They are under this curve (AUC), which determines the quality of the prediction. As the quality of both estimators is approximately 76% of the entire area, the estimation quality is satisfactory.
It is interesting to have an insight into which features are relevant to the prediction mentioned above. The contribution is evaluated by impurity-based feature importance. The results are illustrated in
Figure 4 and
Figure 5 and
Table 27. The most contributing variable in both models is the pandemic-related frequency change in OGS visits. Additional contributing features are the willingness to share one’s location and the activities done in OGS.
4.2. Data Analysis of User Perception on OGS Usage after the Pandemic 2024
The second survey was conducted from 8 January 2024 to 1 February 2024 and consisted of nine post-COVID-19-related questions, while the total number of participants was 451 (List of questions, see
Table A1 in
Appendix A). Regarding the demographic structure, most participants (57%) are female. The average participant is 38 years old, with a median of 37 years and a standard deviation of 12.43. The youngest is 18 years old, and the oldest is 83 years old (see
Table A15 in the
Appendix C).
The most popular OGS that the participants visited in 2024 are located in Novi Beograd (31.5%), Stari Grad (26.4%) and Vracar (26.2%) (see
Table A16 in
Appendix C). The majority of users (89.8%) feel safe while visiting OGS. However, if feeling unsafe, the dominant safety concerns are OGS visits at night (40.4%), OGS visits in deprived areas (21.1%) and unsafe playgrounds (20.4%) (see
Table A17 and
Table A18 in
Appendix C).
Approximately one-third of the participants reported increased post-pandemic OGS visits (30.8%), while one-tenth (10.6%) started going to parks less often after the pandemic (see
Table A19 in
Appendix C). Nearly one-quarter of the participants (23.9%) feel post-pandemic safer in open green spaces, and only a small proportion (10.6%) feel less safe (see
Table A20 in
Appendix C).
Many survey participants (53%) expressed their interest in using the ICT mobile applications (Q8), and a large proportion (58.5%) believed that this app would provide physical safety enhancements for them (see
Table A21 and
Table A22 in the
Appendix C).
χ2 Independence Tests
Links between the selected variables are analyzed in multiple χ
2 Independence tests. In the first analysis, the general safety perception (Q5) was researched to determine whether it was independent of the interest in the app (Q7). A contingency table is provided in
Table 28. According to the test results in
Table 29, the independence between app monitoring and general physical safety is rejected.
Second, a test for independence between safety concerns (Q9) and gender (Q1), interest in the app (Q8) and physical safety enhancements through the app (Q7), respectively, was done. The corresponding contingency tables are illustrated in
Table 30,
Table 31 and
Table 32. According to the test results in
Table 33, the null hypothesis is rejected in all three tests. Precisely, the independence between safety concerns and gender (
p < 0.01%), interest in the app (
p < 0.1%) and physical safety enhancements through the app (
p < 5%) is rejected (
Table 28 and
Table 29, respectively).
Additional χ
2 independence tests look at the independence between gender (Q1) and post-COVID-19 greenspace usage (Q4), the general safety perception (Q5), post-COVID-19 safety perception changes (Q6), physical safety enhancements through the app (Q7) and interest in the app (Q8), respectively. The corresponding contingency tables are consolidated into
Table 33. Given the test results in
Table 34. the independence between gender and post-COVID-19 greenspace usage (
p < 5%) and the general perception of safety (
p < 0.01%) is rejected. In all remaining cases, the hypothesis that the named variables are independent of gender cannot be rejected (
Table 30).
4.3. Two-Sample t-Tests (Comparison of the Data Gathered through Surveys in 2020 and 2024)
Two two-sample proportion tests were performed to investigate whether there are differences in the interest in the mobile app usage and differences in physical safety enhancements from the app, respectively. Each test is one sided and tests against the alternative, that the differences in a proportion have increased.
The first test tested whether the proportions of people interested in the app differ during and post-pandemic. The test results are summarised in
Table 35. Given a 95% confidence level, a change in the proportion of people interested in the app was tested. The second test is performed to question differences in the safety enhancements through the app. The respective test results are given in
Table 36. Given a 95% confidence level, the hypothesis that physical safety enhancement perceptions are identical in pre-during and post-pandemic samples cannot be rejected.
This section presents the results from the two surveys and data from the questionnaires. All additional results are presented in tables in the appendixes. All of the aforementioned results are transparent and reproducible. The code is available at
https://github.com/lilimatic/greenspace/tree/master (accessed on 30 March 2024).
5. Discussion and Conclusions
We live in a time when health has become one of the crucial resources, challenged by the impact of global warming, stress-induced lifestyles, and, most recently, the consequences of the COVID-19 pandemic. Therefore, it is imperative to improve public health, particularly in urban areas with more exposure to risk factors. Spending time in OGS in cities is essential as this improves the overall physical and mental health benefits. During the pandemic, OGS usage was regulated, either entirely restricted or limited to a specified number of visitors or a limited amount of time per day.
The research survey focuses on a thorough analysis of the pandemic-related usage of OGS and its aftermath after the pandemic. The main research questions concentrated on analyzing the influence of the pandemic on OGS usage, as shown in the example of Belgrade. The survey was done at the pandemic’s peak in 2020 and almost four years later in 2024.
The 2020 survey targeted frequent OGS visitors who prefer multiple visits per week. Research showed that many participants reported even increased OGS visits during the pandemic. Similarly, the studies above showed increased public OGS visits at the beginning of pandemics. However, this study showed users mostly visited OGS near their residences due to the time and space pandemic-related restrictions, while large public OGS remained relatively empty, which is actually in contrast with some of the findings from presented studies.
Through the data gathered in the survey, the exploratory statistical analysis presents that OGS visits are independent of demographics and how the level of perceived safety influences most OGS usage during the pandemics. In contrast, previous research studies showed how public health policies and environmental characteristics mainly influenced the OGS visits during the pandemic.
Additionally, this study tests the possibility of spending more time in OGS by introducing mobile apps that could provide information regarding the frequency of users in OGS. The survey showed that most respondents expressed interest in the proposed mobile apps and stated that this form of OGS monitoring would improve their physical perceived safety while visiting OGS during the pandemic. The results of the hypothesis tests indicate that the interest in the app is independent of gender but dependent on the age group. Further analysis suggests that possible physical safety enhancement through monitoring is linked to gender. Apart from demographics, this study points out that the interest in possible mobile app usage depends on pre-pandemic- and pandemic-related OGS-visiting habits.
As a central part of the methodology, the descriptive structure of the data was studied, and the results were analyzed using explorative data analysis. The predictive power of data in a machine learning prediction task was challenged. A machine learning classification task challenges the predictive power of features extracted in the 2020 survey to classify perceived safety enhancements with a Random Forest model. The predictive performance is satisfactory, and the most relevant features for this type of classification are the frequency change in OGS visits during the pandemic, the willingness to share one’s location, the specific location where the survey took place, and the activities done in the OGS. Apart from that, it can be concluded that mobile app usage can increase perceived safety and influence the frequency, duration, and activities in OGS during the pandemic.
The second survey in 2024 aimed to detect the possible long-term effects of the pandemic and evaluate and compare the features of OGS usage during (2020) and after the pandemic (2024). The post-pandemic survey reveals that COVID-19 may have had a positive influence on the frequency of OGS visits since almost one-third of all 2024 survey participants reported increased OGS visits since the pandemic, and more than 20% of all users stated they feel safer in OGS after the pandemic.
Since the 2024 data analysis revealed a statistical dependence between the interest in the aforementioned mobile app and safety concerns or perceived safety, the important question of the 2024 survey was whether the users were still interested in mobile apps since the safety concerns of virus infections were significantly lower than in 2020. Despite a statistically significant decrease in interest in the apps, most 2024 survey participants still stated they would use them while visiting OGS. In addition, changes in possible physical safety enhancements from the app usage are statistically insignificant.
Concerning the survey results presented above, it can be concluded that developing the suggested mobile apps for OGS user tracking could provide more frequent usage of OGS due to increased levels of perceived safety among the majority of users. Previous research conducted on the usage of OGS during and post-pandemic focuses on safety concerns through the geotracking of residents. This research focuses on analyzing the management of OGS usage with mobile apps, which allows for improving safety efficiently and with limited resources. Furthermore, the proposed approach is data-privacy friendly, as users voluntarily provided data for this specific purpose; the data was not gathered from social media, as in some similar OGS monitoring proposes. Further research might deal with the issues regarding the regulation of OGS from the perspective of safety and in the context of the use of mobile applications, as this field is yet to be researched and defined worldwide and in Serbia.
One of the study limitations was connected with the sensitive time of this research. The first survey was conducted during a pandemic-related lockdown period in Belgrade. At that time, most people feared socializing and were unwilling to participate in the survey or use the OGS. Also, research focuses on perceived safety concerns, which may lead to data that are subjective to the personal perception of users and could be influenced by unlimited reasons unrelated to the study. However, in addition to the limitations, this research successfully met all the predefined research goals: (1) research analyzed the specific usage of OGS during the pandemic, especially from the perspective of perceived safety; (2) explored the possible role of location-tracking mobile apps in increasing personal and perceived safety; (3) analyzed the possible long-term effects that COVID-19 had on the increased frequency of OGS usage; and (4) provided the comparison of aforementioned OGS usage and willingness of participants to use mobile apps during and after the pandemic.
There are two main scientific contributions of this research: (a) a better understanding of OGS usage in the context of users’ perceived safety during and after the pandemic, and (b) analyzing the possible solution to the safety issue that could improve the overall OGS usage in urban areas. Its additional scientific value and significance is that it considers age and gender variations that may have a role in determining the perceived safety among the users of OGS since this aspect is not reflected in previous similar research studies.
Possible future research based on this study’s data analysis and results should consider analyzing OGS usage in unexpected scenarios other than pandemics, which could involve risk management and assessment. Also, possible research topics of interest are potential urban regulations and urban design transformations regarding the spatial characteristics of OGS in the form of guidelines for adapting future urban design to better usage in the pandemic. This paper can influence policy makers, urban planners, and public health officials to develop effective strategies to manage OGS usage and promote public health during similar crises. Finally, this paper offers valuable insights to guide future pandemic response planning and can inform OGS management strategies.
Author Contributions
Conceptualization, D.G.M. and J.M.; methodology, J.L.M. and J.M; software, J.L.M.; validation, D.G.M., J.M. and J.L.M.; formal analysis, J.M.; investigation, D.G.M., J.M. and O.K.; resources, D.G.M. and J.M.; data curation, J.L.M. and O.K.; writing—original draft preparation, J.M., D.G.M., B.M. and J.L.M.; writing—review and editing, R.G., B.M. and O.K.; visualization, J.M. and R.G.; supervision, D.G.M., J.M. and B.M.; project administration, R.G. and B.M. All authors have read and agreed to the published version of the manuscript.
Funding
This research received no external funding.
Institutional Review Board Statement
Not applicable.
Informed Consent Statement
Informed consent was obtained from all subjects involved in this study. By taking part in the survey, the participants gave their consent for the survey results to be published for scientific research purposes without publishing any personal data.
Data Availability Statement
Acknowledgments
The authors express gratitude to Robin Schupper (Keiser University Flagship Campus, Florida Institute of Technology) for her valuable support and suggestions. We would like to thank Andrija Matić for support, suggestions and topical discussions. The authors also express gratitude to Nikola Knežević for his professional assistance.
Conflicts of Interest
The authors declare no conflicts of interest.
Appendix A
Table A1.
Questions from the 2020 and 2024 surveys.
Table A1.
Questions from the 2020 and 2024 surveys.
| The 2020 survey | - List of questions from Part A |
| Qa,b | Gender and Age |
| Q1 | How often have you visited parks or squares in 2019 during the day? |
| Q2 | Regarding the parks or squares you visited in 2019, did you visit parks or squares more frequently during the day before the coronavirus outbreak? |
| Q3 | How much time have you usually spent in parks or squares since the coronavirus outbreak in Serbia? |
| Q4 | When you are in parks or squares, what do you typically do? |
| Q5 | When visiting parks or squares, who are you often in company with? |
| Q6 | While using parks or squares, do you behave according to social distancing regulations, standing at least 2.0 m apart from others? |
| Q7 | Do you feel safe visiting parks or squares, regardless of the coronavirus? |
| - List of questions from Part B |
| Q8 | Would you feel physically safe if there was a park or square usage monitoring that you could access through your phone? |
| Q9 | Would you feel secure regarding the coronavirus if there was monitoring of park or square usage that you could access through your phone? |
| Q10 | Would you be interested in technology that would allow you to know how many people are there in a specific place (e.g., shopping mall, clubs…) you would like to go? |
| Q11 | If your identity was not revealed, would you want to provide your phone’s location (see question 10)? |
| Q12 | Circle the municipality in which you visit the parks or squares. |
| The 2024 survey | Q1.2 | Gender and Age |
| Q3 | Municipality in which you visit parks or squares after the pandemic? |
| Q4 | Has the COVID-19 pandemic modified your usage of open greenspaces? |
| Q5 | Do you generally feel safe when you visit parks or squares? |
| Q6 | Did the COVID-19 pandemic influence your safety perception in parks or squares? |
| Q7 | Would you feel physically secure knowing that park or square usage is monitored and accessible through your phone? |
| Q8 | Would you be interested in technology that enables you to track how many people are in specific open greenspace at any time? |
| Q9 | What particular safety concerns bother you? |
Appendix B
The below tables present the additional results within the 2020 survey.
Table A2.
Gender and age of the participants presented as the total number and percentage.
Table A2.
Gender and age of the participants presented as the total number and percentage.
| | | Absolute | Percentage (%) |
|---|
| Gender | Male | 270 | 67.5 |
| Female | 130 | 32.5 |
| Age | 15–24 | 159 | 39.8 |
| 25–40 | 124 | 31.0 |
| 41–64 | 117 | 29.2 |
Table A3.
Time spent in parks during the pandemic (Q3).
Table A3.
Time spent in parks during the pandemic (Q3).
| | Absolute | Relative (%) |
|---|
| Not at all (1) | 46 | 11.5 |
| Up to 15 min (3) | 86 | 21.5 |
| From 15 to 30 min (2) | 69 | 17.3 |
| From 30 min to one hour (5) | 118 | 29.5 |
| More than one hour (4) | 81 | 20.2 |
Table A4.
Pre-pandemic park visits (Q1).
Table A4.
Pre-pandemic park visits (Q1).
| | Absolute | Relative (%) |
|---|
| Not at all | 9 | 2.3 |
| Rarely, a couple of times per year | 44 | 11.0 |
| Sometimes, a couple of times per month | 149 | 37.2 |
| Often, a couple of times per week | 110 | 27.5 |
| Always, almost every day | 88 | 22.0 |
Table A5.
Parks or squares/green spaces in Belgrade municipalities most visited by the participants (multiple entries permitted).
Table A5.
Parks or squares/green spaces in Belgrade municipalities most visited by the participants (multiple entries permitted).
| Municipality Visits | Absolute | Relative (%) |
|---|
| Novi Beograd | 137 | 17.3 |
| Vračar | 118 | 14.9 |
| Stari grad | 114 | 14.4 |
| Palilula | 101 | 12.7 |
| Zemun | 92 | 11.6 |
| Zvezdara | 65 | 8.2 |
| Čukarica | 48 | 6.1 |
| Voždovac | 44 | 5.5 |
| Savski Venac | 32 | 4.0 |
| Rakovica | 23 | 2.9 |
| Others | 19 | 2.4 |
Table A6.
Social aspects of a park visit (Q5).
Table A6.
Social aspects of a park visit (Q5).
| | Absolute | Relative (%) |
|---|
| With a partner or a friend (two adults) | 195 | 35.6 |
| Alone or with pets | 145 | 26.5 |
| With a small group of friends (up to 5 persons) | 141 | 25.7 |
| With children | 37 | 6.8 |
| With a large group of friends (More than 5 people) | 30 | 5.5 |
Table A7.
Interest in the app (Q10).
Table A7.
Interest in the app (Q10).
| | Count | Relative (%) |
|---|
| Yes | 257 | 64.2 |
| No | 143 | 35.8 |
Table A8.
Location sharing (Q11).
Table A8.
Location sharing (Q11).
| | Count | Relative (%) |
|---|
| Yes, at all times | 95 | 23.8 |
| Yes, while using the app | 133 | 33.2 |
| No, not at all | 172 | 43.0 |
Table A9.
SARS COVID-19 2 safety enhancements from monitoring (Q9).
Table A9.
SARS COVID-19 2 safety enhancements from monitoring (Q9).
| | Count | Relative (%) |
|---|
| Yes | 225 | 56.2 |
| No | 175 | 43.8 |
Table A10.
Physical safety enhancements from monitoring (Q8).
Table A10.
Physical safety enhancements from monitoring (Q8).
| | Count | Relative (%) |
|---|
| Yes | 217 | 54.2 |
| No | 183 | 45.8 |
Table A11.
Contingency Table: Interest in the app (Q10) by gender.
Table A11.
Contingency Table: Interest in the app (Q10) by gender.
| Gender | No | Yes | All | No (%) | Yes (%) | All (%) |
|---|
| Female | 94 | 176 | 270 | 23.5 | 44 | 67.5 |
| Male | 49 | 81 | 130 | 12.25 | 20.25 | 32.5 |
| All | 143 | 257 | 400 | 35.75 | 64.25 | 100 |
Table A12.
Contingency Table: Interest in the app (Q10) by age.
Table A12.
Contingency Table: Interest in the app (Q10) by age.
| Age | No | Yes | All | No (%) | Yes (%) | All (%) |
|---|
| 15–24 | 51 | 66 | 117 | 12.75 | 16.5 | 29.25 |
| 25–40 | 57 | 102 | 159 | 14.25 | 25.5 | 39.75 |
| 41–64 | 35 | 89 | 124 | 8.75 | 22.25 | 31 |
| All | 143 | 257 | 400 | 35.75 | 64.25 | 100 |
Table A13.
Contingency Table: Interest in the app (Q10) by time spent in parks during the pandemic (Q3).
Table A13.
Contingency Table: Interest in the app (Q10) by time spent in parks during the pandemic (Q3).
| Would You Be Interested in Technology That Would Allow You to Know How Many People Are in a Place You Would Like to Go? | From 15 to 30 min | From 30 min to One Hour | More than One Hour | Not at All | Up to 15 min | All | From 15 to 30 min
(%) | From 30 min to One Hour (%) | More than One Hour (%) | Not at All
(%) | Up to 15 min
(%) | All
(%) |
|---|
| No | 15 | 42 | 41 | 23 | 22 | 143 | 3.75 | 10.5 | 10.25 | 5.75 | 5.5 | 35.75 |
| Yes | 54 | 76 | 40 | 23 | 64 | 257 | 13.5 | 19 | 10 | 5.75 | 16 | 64.25 |
| All | 69 | 118 | 81 | 46 | 86 | 400 | 17.25 | 29.5 | 20.25 | 11.5 | 21.5 | 100 |
Table A14.
Contingency Table: Interest in the app (Q10) by pandemic-related visiting habits changes (Q2).
Table A14.
Contingency Table: Interest in the app (Q10) by pandemic-related visiting habits changes (Q2).
| | As Frequently | Less Frequently | More Frequently | Not at All | All | As Frequently (%) | Less Frequently (%) | More Frequently (%) | Not at All (%) | All (%) |
|---|
| No | 42 | 35 | 53 | 13 | 143 | 10.5 | 8.75 | 13.25 | 3.25 | 35.75 |
| Yes | 55 | 79 | 109 | 14 | 257 | 13.75 | 19.75 | 27.25 | 3.5 | 64.25 |
| All | 97 | 114 | 162 | 27 | 400 | 24.25 | 28.5 | 40.5 | 6.75 | 100 |
Appendix C
The below tables present additional results within the 2024 survey.
Table A15.
The gender and age of the participants are presented as the total number and percentage.
Table A15.
The gender and age of the participants are presented as the total number and percentage.
| | | Absolute | Percentage (%) |
|---|
| Gender (Q1) | Male | 191 | 42.3 |
| Female | 257 | 57 |
| Other | 3 | 0.7 |
Table A16.
Municipalities in which participants visited the open greenspaces (multiple entries permitted) (Q3).
Table A16.
Municipalities in which participants visited the open greenspaces (multiple entries permitted) (Q3).
| Municipality Visits | Absolute | Relative (%) |
|---|
| Novi Beograd | 142 | 14.9 |
| Vracar | 118 | 12.4 |
| Stari Grad | 119 | 12.5 |
| Zemun | 91 | 9.5 |
| Zvezdara | 90 | 9.4 |
| Vozdovac | 75 | 7.9 |
| Palilula | 70 | 7.3 |
| Savski venac | 70 | 7.3 |
| Cukarica | 59 | 6.2 |
| Rakovica | 32 | 3.4 |
| Mladenovac | 19 | 2 |
| Surcin | 16 | 1.7 |
| Grocka | 15 | 1.6 |
| Obrenovac | 15 | 1.6 |
| Sopot | 10 | 1 |
| Barajevo | 7 | 0.7 |
| Lazarevac | 6 | 0.6 |
Table A17.
General safety perception (Q5).
Table A17.
General safety perception (Q5).
| | Count | Relative (%) |
|---|
| Yes | 405 | 89.8% |
| No | 46 | 10.2% |
Table A18.
Safety concerns (Q9).
Table A18.
Safety concerns (Q9).
| | Count | Relative (%) |
|---|
| Park visits at night | 182 | 40.4 |
| Park visits in deprived areas | 95 | 21.1 |
| Unsafe playgrounds | 92 | 20.4 |
| Visits of overcrowded greenspaces | 82 | 18.1 |
Table A19.
Post-COVID-19 greenspace usage (Q4).
Table A19.
Post-COVID-19 greenspace usage (Q4).
| | Count | Relative (%) |
|---|
| Usage unchanged | 264 | 58.6 |
| I visit greenspaces more frequently and actively than before the pandemic | 139 | 30.8 |
| My visits have become less frequently | 48 | 10.6 |
Table A20.
Post-COVID-19 safety perception changes (Q6).
Table A20.
Post-COVID-19 safety perception changes (Q6).
| | Count | Relative (%) |
|---|
| My perception of safety remained unchanged | 295 | 65.4% |
| I feel safer in open spaces | 108 | 24.0% |
| I feel less safe | 48 | 10.6 |
Table A21.
Interest in the app (Q8).
Table A21.
Interest in the app (Q8).
| | Count | Relative (%) |
|---|
| Yes | 239 | 53.0% |
| No | 212 | 47.0% |
Table A22.
Physical safety enhancements from monitoring (Q7).
Table A22.
Physical safety enhancements from monitoring (Q7).
| | Count | Relative (%) |
|---|
| Yes | 264 | 58.5% |
| No | 187 | 41.5% |
References
- Kummitha, R.K. Smart technologies for fighting pandemics: The techno-and human-driven approaches in controlling the virus transmission. Gov. Inf. Q. 2020, 37, 101481. [Google Scholar] [CrossRef] [PubMed]
- Ueno, Y.; Kato, S.; Mase, T.; Funamoto, Y.; Hasegawa, K. Human Flow Dataset Reveals Changes in Citizens’ Outing Behaviors including Greenspace Visits before and during the First Wave of the COVID-19 Pandemic in Kanazawa, Japan. Int. J. Environ. Res. Public Health 2022, 19, 8728. [Google Scholar] [CrossRef]
- Rakonjac, I.; Zorić, A.; Rakonjac, I.; Milošević, J.; Marić, J.; Furundžić, D. Increasing the Livability of Open Public Spaces during Nighttime: The Importance of Lighting in Waterfront Areas. Sustainability 2022, 14, 6058. [Google Scholar] [CrossRef]
- Thake, C.L.; Bambling, M.; Edirippulige, S.; Marx, E. A psychoevolutionary approach to identifying preferred nature scenes with the potential to provide restoration from stress. HERD Health Environ. Res. Des. J. 2017, 10, 111–124. [Google Scholar] [CrossRef] [PubMed]
- World Health Organization. Urban Green Spaces and Health; Document Number: WHO/EURO:2016-3352-43111-60341; WHO Regional Office for Europe: Copenhagen, Denmark, 2016; Available online: https://www.who.int/europe/publications/i/item/WHO-EURO-2016-3352-43111-60341 (accessed on 27 December 2023).
- Ulrich, R.S. Aesthetic and affective response to the natural environment. In Behavior and the Natural Environment; Altman, I., Wohlwill, J.F., Eds.; Plenum: New York, NY, USA, 1983; pp. 85–125. [Google Scholar]
- Maric, J.; Aleksandra, D.; Antonic, B.; Furundzic, D.; Parezanin, V. The Effects of Open Space on Reducing Workplace Stress: Case Study of Business Park in the Post-Socialist Urban Setting. Sustainability 2021, 13, 336. [Google Scholar] [CrossRef]
- Olmsted, F.L. Writings on Landscape, Culture and Society; Beveridge, C., Ed.; Library of America: New York, NY, USA, 2015. [Google Scholar]
- Taylor, L.; Hochuli, D.F. Defining greenspace: Multiple uses across multiple disciplines. Landsc. Urban Plan. 2017, 158, 25–38. [Google Scholar] [CrossRef]
- Vilcins, D.; Sly, P.D.; Scarth, P.; Mavoa, S. Green space in health research: An overview of common indicators of greenness. Rev. Environ. Health 2022. [Google Scholar] [CrossRef] [PubMed]
- Wang, H.; Dai, X.; Wu, J.; Wu, X.; Nie, X. Influence of urban green open space on residents’ physical activity in China. BMC Public Health 2019, 19, 1093. [Google Scholar] [CrossRef]
- Urban Planning Institute of Belgrade. Plan Generalne Regulacije Sistema Zelenih Površina Beograda (General Regulation Plan of the Greenspace System in Belgrade/in Serbian), 2019. Sl. List Grada Beograda 110/19 (Official Gazette of the City of Belgrade 110/19). Available online: https://www.urbel.com/planovi/1547/ (accessed on 30 March 2024).
- Han, S.; Song, D.; Xu, L.; Ye, Y.; Yan, S.; Shi, F.; Zhang, Y.; Liu, X.; Du, H. Behaviour in public open spaces: A systematic review of studies with quantitative research methods. Build. Environ. 2022, 223, 109444. [Google Scholar] [CrossRef]
- Esparza, J. Lessons from history: What can we learn from 300 years of pandemic flu that could inform the response to COVID-19? Am. J. Public Health 2020, 110, 1160. [Google Scholar] [CrossRef]
- Abid, H.; Mohd, M.; Raju, V. Effects of COVID-19 pandemic in daily life. Curr. Med. Res. Pract. 2020, 10, 78–79. [Google Scholar] [CrossRef]
- Kashdan, T.B.; Rottenberg, J. Psychological flexibility as a fundamental aspect of health. Clin. Psychol. Rev. 2010, 30, 865–878. [Google Scholar] [CrossRef] [PubMed]
- Volenec, Z.M.; Abraham, J.O.; Becker, A.D.; Dobson, A.P. Public parks and the pandemic: How park usage has been affected by COVID-19 policies. PLoS ONE 2021, 16, e0251799. [Google Scholar] [CrossRef] [PubMed]
- Mantey, D. Functions of public space and virtual space–post-pandemic scenario. In Sustainable Development; Czerny, M., Mendoza, C.S.M., Eds.; Wydawnictwa Uniwersytetu Warszawskiego: Warsaw, Poland, 2021; pp. 127–146. [Google Scholar]
- Djukanović, Z.; Marić, J.; Giofrè, F. Evaluation of hospital outdoor spaces through users participation analysis. Facta Univ. Ser. Archit. Civ. Eng. 2017, 73–84. [Google Scholar] [CrossRef]
- Hartig, T.; Mang, M.; Evans, G.W. Restorative effects of natural environment experiences. Environ. Behav. 1991, 23, 3–26. [Google Scholar] [CrossRef]
- Ulrich, R.S. View through a window may influence recovery from surgery. Science 1984, 224, 420–421. [Google Scholar] [CrossRef] [PubMed]
- Giles-Corti, B.; Donovan, R.J. Relative influences of individual, social environmental, and physical environmental correlates of walking. Am. J. Public Health 2003, 93, 1583–1589. [Google Scholar] [CrossRef] [PubMed]
- Hartig, T.; Mitchell, R.; De Vries, S.; Frumkin, H. Nature and health. Annu. Rev. Public Health 2014, 35, 207–228. [Google Scholar] [CrossRef] [PubMed]
- Ulrich, R.S.; Simons, R.F.; Losito, B.D.; Fiorito, E.; Miles, M.A.; Zelson, M. Stress recovery during exposure to natural and urban environments. J. Environ. Psychol. 1991, 11, 201–230. [Google Scholar] [CrossRef]
- Kaplan, R.; Kaplan, S. The Experience of Nature: A Psychological Perspective; Cambridge University Press: New York, NY, USA, 1989. [Google Scholar]
- Gidlow, C.J.; Ellis, N.J.; Bostock, S. Development of the neighbourhood green space tool (NGST). Landsc. Urban Plan. 2012, 106, 347–358. [Google Scholar] [CrossRef]
- Thompson, C.W.; Roe, J.; Aspinall, P.; Mitchell, R.; Clow, A.; Miller, D. More green space is linked to less stress in deprived communities: Evidence from salivary cortisol patterns. Landsc. Urban Plan. 2012, 105, 221–229. [Google Scholar] [CrossRef]
- Stigsdotter, U.; Grahn, P. Experiencing a garden: A healing garden for people suffering from burnout diseases. J. Ther. Hortic. 2003, 14, 38–48. Available online: https://www.researchgate.net/publication/234071989_Experiencing_a_Garden_A_Healing_Garden_for_People_Suffering_from_Burnout_Diseases#fullTextFileContent (accessed on 27 December 2023).
- Lekić Glavan, O.; Nikolić, N.; Folić, B.; Vitošević, B.; Mitrović, A.; Kosanović, S. COVID-19 and City Space: Impact and Perspectives. Sustainability 2022, 14, 1885. [Google Scholar] [CrossRef]
- Benzell, S.G.; Collis, A.; Nicolaides, C. Rationing social contact during the COVID-19 pandemic: Transmission risk and social benefits of US locations. Proc. Natl. Acad. Sci. USA 2020, 117, 14642–14644. [Google Scholar] [CrossRef] [PubMed]
- Noszczyk, T.; Gorzelany, J.; Kukulska-Kozieł, A.; Hernik, J. The impact of the COVID-19 pandemic on the importance of urban green spaces to the public. Land Use Policy 2022, 113, 105925. [Google Scholar] [CrossRef] [PubMed]
- World Health Organization. Coronavirus Disease (COVID-19) Advice for the Public. Available online: https://www.who.int/emergencies/diseases/novel-coronavirus-2019/advice-for-public (accessed on 27 December 2023).
- Qureshi, Z.; Jones, N.; Temple, R.; Larwood, P.J.; Greenhalgh, T.; Bourouiba, L. What Is the Evidence to Support the 2-Metre Social Distancing Rule to Reduce COVID-19 Transmission? on the Website: “The Centre for Evidence-Based Medicine”. 2020. Available online: https://www.cebm.net/covid-19/what-is-the-evidence-to-support-the-2-metre-social-distancing-rule-to-reduce-covid-19-transmission/ (accessed on 27 December 2023).
- Jia, Z.; Xu, S.; Zhang, Z.; Cheng, Z.; Han, H.; Xu, H.; Wang, M.; Zhang, H.; Zhou, Y.; Zhou, Z. Association between mental health and community support in lockdown communities during the COVID-19 pandemic: Evidence from rural China. J. Rural. Stud. 2021, 82, 87–97. [Google Scholar] [CrossRef] [PubMed]
- Jóna, L. The effect of the pandemic on the use of public spaces in Hungary. In Proceedings of the REAL CORP 2021. CITIES 20.50 Creating Habitats for the 3rd Millennium, Vienna, Austria, 7–10 September 2021; pp. 1239–1246. Available online: https://www.corp.at/archive/CORP2021_14.pdf (accessed on 27 December 2023).
- Curtis, D.S.; Rigolon, A.; Schmalz, D.L.; Brown, B.B. Policy and environmental predictors of park visits during the first months of the COVID-19 pandemic: Getting out while staying in. Environ. Behav. 2022, 54, 487–515. [Google Scholar] [CrossRef]
- World Health Organization. WHO Director-General’s Opening Remarks at the Media Briefing—5 May 2023. Available online: https://www.who.int/director-general/speeches/detail/who-director-general-s-opening-remarks-at-the-media-briefing---5-may-2023 (accessed on 7 February 2024).
- Tabrizi, N.; Lak, A.; Moussavi, A.S.M.R. Green space and the health of the older adult during pandemics: A narrative review on the experience of COVID-19. Front. Public Health/Sect. Aging Public Health 2023, 11, 1218091. [Google Scholar] [CrossRef] [PubMed]
- Kim, H.; Shoji, Y.; Mameno, K.; Kubo, T.; Aikoh, T. Changes in visits to green spaces due to the COVID-19 pandemic: Focusing on the proportion of repeat visitors and the distances between green spaces and visitors’ places of residences. Urban For. Urban Green. 2023, 80, 127828. [Google Scholar] [CrossRef]
- Talavera-Garcia, R.; Perez-Campaña, R.; Cara-Santana, Y. Unveiling the pandemic’s impact on visits to Madrid’s parks: Insights from mobile phone data analysis. J. Maps 2023, 19, 2274466. [Google Scholar] [CrossRef]
- Matasov, V.; Vasenev, V.; Matasov, D.; Dvornikov, Y.; Filyushkina, A.; Bubalo, M.; Nakhaev, M.; Konstantinova, A. COVID-19 pandemic changes the recreational use of Moscow parks in space and time: Outcomes from crowd-sourcing and machine learning. Urban For. Urban Green. 2023, 83, 127911. [Google Scholar] [CrossRef] [PubMed]
- Eltarabily, S.; Elgheznawy, D. Post-Pandemic Cities—The Impact of COVID-19 on Cities and Urban Design. Archit. Res. 2020, 10, 75–84. [Google Scholar]
- Chen, L.; Liu, L.; Wu, H.; Peng, Z.; Sun, Z. Change of Residents’ Attitudes and Behaviors toward Urban Green Space Pre- and Post-COVID-19 Pandemic. Land 2022, 11, 1051. [Google Scholar] [CrossRef]
- Cui, N.; Malleson, N.; Houlden, V.; Comber, A. Using social media data to understand the impact of the COVID-19 pandemic on urban green space use. Urban For. Urban Green. 2022, 74, 127677. [Google Scholar] [CrossRef] [PubMed]
- Cui, N.; Malleson, N.; Houlden, V.; Comber, A. Using VGI and Social Media Data to Understand Urban Green Space: A Narrative Literature Review. ISPRS Int. J. Geo-Inf. 2021, 10, 425. [Google Scholar] [CrossRef]
- Park, S.; Kim, S.; Lee, J.; Heo, B. Evolving norms: Social media data analysis on parks and greenspaces perception changes before and after the COVID-19 pandemic using a machine learning approach. Sci. Rep. 2022, 12, 13246. [Google Scholar] [CrossRef] [PubMed]
- Zabelskyte, G.; Kabisch, N.; Stasiskiene, Z. Patterns of Urban Green Space Use Applying Social Media Data: A Systematic Literature Review. Land 2022, 11, 238. [Google Scholar] [CrossRef]
- Bentéjac, C.; Csörgő, A.; Martínez-Muñoz, G. A comparative analysis of gradient boosting algorithms. Artif. Intell. Rev. 2021, 54, 1937–1967. [Google Scholar] [CrossRef]
- GCAP—Green City Action Plan for City of Belgrade. March 2021. Available online: https://ebrdgreencities.com/assets/Uploads/PDF/Belgrade-GCAP.pdf (accessed on 30 March 2024).
- EBRD Green Cities. Available online: https://www.ebrdgreencities.com (accessed on 30 March 2024).
- City Authority—City of Belgrade, The Secretariat for Environmental Protection, Project: Green Regulations of Belgrade (Gradska Uprava—Grad Beograd, Sekretarijat za Zaštitu Životne Sredine, Projekat: Zelena Regulativa Beograda). Green Space Geographic Information System for Belgrade (GIS zelenih površina Beograda/in Serbian). Available online: http://gispublic.zelenilo.rs/giszppublic/Map (accessed on 30 March 2024).
- Belgrade Institute for Urban Planning, Belgrade Master Plan 2016–2020 (General Urban Plan GUP/in Serbian) (“Official Gazette of the City of Belgrade” No. 11/16). Available online: https://www.beoland.com/en/plans/master-plan-belgrade/ (accessed on 30 March 2024).
- Belgrade City Environmental Protection Program 2015–2025 (Program Zaštite Životne Sredine Grada Beograda/in Serbian). “Official Gazette of the City of Belgrade” No. 72/15. Available online: http://sllistbeograd.rs/pdf/download/853/ (accessed on 30 March 2024).
- Milinković, M.; Ćorović, D.; Vuksanović-Macura, Z. Historical Enquiry as a Critical Method in Urban Riverscape Revisions: The Case of Belgrade’s Confluence. Sustainability 2019, 11, 1177. [Google Scholar] [CrossRef]
Figure 1.
Map with specific locations of greenspaces in Belgrade municipalities used in this research (source: Open Street Map:
https://openstreetmap.rs/ (accessed on 30 March 2024) (author: Darinka Matić).
Figure 1.
Map with specific locations of greenspaces in Belgrade municipalities used in this research (source: Open Street Map:
https://openstreetmap.rs/ (accessed on 30 March 2024) (author: Darinka Matić).
Figure 2.
Example of one resulting decision tree (author: Jovanka Lili Matić).
Figure 2.
Example of one resulting decision tree (author: Jovanka Lili Matić).
Figure 3.
ROC curve (author: Jovanka Lili Matić).
Figure 3.
ROC curve (author: Jovanka Lili Matić).
Figure 4.
Variable importance of Random Forest estimator (author: Jovanka Lili Matić).
Figure 4.
Variable importance of Random Forest estimator (author: Jovanka Lili Matić).
Figure 5.
Variable importance of the Xgboost model (author: Jovanka Lili Matić).
Figure 5.
Variable importance of the Xgboost model (author: Jovanka Lili Matić).
Table 1.
Contingency Table: Pre-pandemic park visits (Q1) by gender.
Table 1.
Contingency Table: Pre-pandemic park visits (Q1) by gender.
| | Female | Male | All | Female (%) | Male (%) | All (%) |
|---|
| Always, almost every day | 64 | 24 | 88 | 16 | 6 | 22 |
| Not at all | 6 | 3 | 9 | 1.5 | 0.75 | 2.25 |
| Often, a couple of times per week | 75 | 35 | 110 | 18.75 | 8.75 | 27.5 |
| Rarely, a couple of times per year | 26 | 18 | 44 | 6.5 | 4.5 | 11 |
| Sometimes, a couple of times per month | 99 | 50 | 149 | 24.75 | 12.5 | 37.25 |
| All | 270 | 130 | 400 | 67.5 | 32.5 | 100 |
Table 2.
Contingency Table: Time spent in the park during the pandemic (Q3) by gender.
Table 2.
Contingency Table: Time spent in the park during the pandemic (Q3) by gender.
| | Female | Male | All | Female (%) | Male (%) | All (%) |
|---|
| From 15 to 30 min | 42 | 27 | 69 | 10.5 | 6.75 | 17.25 |
| From 30 min to one hour | 90 | 28 | 118 | 22.5 | 7 | 29.5 |
| More than one hour | 49 | 32 | 81 | 12.25 | 8 | 20.25 |
| Not at all | 34 | 12 | 46 | 8.5 | 3 | 11.5 |
| Up to 15 min | 55 | 31 | 86 | 13.75 | 7.75 | 21.5 |
| All | 270 | 130 | 400 | 67.5 | 32.5 | 100 |
Table 3.
Contingency Table: Pandemic-related visiting habits changes Q2 by gender.
Table 3.
Contingency Table: Pandemic-related visiting habits changes Q2 by gender.
| | Female | Male | All | Female (%) | Male (%) | All (%) |
|---|
| As frequently | 70 | 27 | 97 | 17.5 | 6.75 | 24.25 |
| Less frequently | 81 | 33 | 114 | 20.25 | 8.25 | 28.5 |
| More frequently | 105 | 57 | 162 | 26.25 | 14.25 | 40.5 |
| Not at all | 14 | 13 | 27 | 3.5 | 3.25 | 6.75 |
| All | 270 | 130 | 400 | 67.5 | 32.5 | 100 |
Table 4.
Chi-square test result table that relates to Contingency
Table 1,
Table 2 and
Table 3, respectively.
Table 4.
Chi-square test result table that relates to Contingency
Table 1,
Table 2 and
Table 3, respectively.
| Question and Gender | Value | DoF | p-Value |
|---|
| Visits 2019 | 2.62 | 4 | 0.6239 |
| Time spent during the Pandemic | 8.69 | 4 | 0.0694 |
| Frequency to pre-COVID | 5.1643 | 3 | 0.1602 |
Table 5.
Contingency Table: Pre-pandemic park visits (Q1) by age.
Table 5.
Contingency Table: Pre-pandemic park visits (Q1) by age.
| Age | Always, Almost Every Day | Not at All | Often, a Couple of Times per Week | Rarely, a Couple of Times Per Year | Sometimes, a Couple of Times per Month | All | Always, Almost Every Day (%) | Not at All
(%) | Often, a Couple of Times per Week (%) | Rarely, a Couple of Times per Year (%) | Sometimes, a Couple of Times per Month (%) | All (%) |
|---|
| 15–24 | 18 | 2 | 47 | 10 | 42 | 119 | 4.41 | 0.49 | 11.52 | 2.45 | 10.29 | 29.17 |
| 25–40 | 44 | 4 | 39 | 14 | 60 | 161 | 10.78 | 0.98 | 9.56 | 3.43 | 14.71 | 39.46 |
| 41–64 | 29 | 3 | 24 | 23 | 48 | 127 | 7.11 | 0.74 | 5.88 | 5.64 | 11.76 | 31.13 |
| 7–14 | 1 | 0 | 0 | 0 | 0 | 1 | 0.25 | 0 | 0 | 0 | 0 | 0.25 |
| All | 92 | 9 | 110 | 47 | 150 | 408 | 22.55 | 2.21 | 26.96 | 11.52 | 36.76 | 100 |
Table 6.
Contingency Table: Time spent in parks during the pandemic (Q3) by age.
Table 6.
Contingency Table: Time spent in parks during the pandemic (Q3) by age.
| Age | From 15 to 30 min | From 30 min to One Hour | More than One Hour | Not at All | Up to 15 min | All | From 15 to 30 Min
(%) | From 30 min to One Hour (%) | More than One Hour
(%) | Not at All
(%) | Up to 15 min
(%) | All (%) |
|---|
| 15–24 | 27 | 32 | 20 | 20 | 20 | 119 | 6.62 | 7.84 | 4.9 | 4.9 | 4.9 | 29.17 |
| 25–40 | 24 | 51 | 38 | 16 | 32 | 161 | 5.88 | 12.5 | 9.31 | 3.92 | 7.84 | 39.46 |
| 41–64 | 21 | 38 | 23 | 10 | 35 | 127 | 5.15 | 9.31 | 5.64 | 2.45 | 8.58 | 31.13 |
| 7–14 | 1 | 0 | 0 | 0 | 0 | 1 | 0.25 | 0 | 0 | 0 | 0 | 0.25 |
| All | 73 | 121 | 81 | 46 | 87 | 408 | 17.89 | 29.66 | 19.85 | 11.27 | 21.32 | 100 |
Table 7.
Contingency Table: Pandemic-related visiting habit changes (Q2) by age.
Table 7.
Contingency Table: Pandemic-related visiting habit changes (Q2) by age.
| Age | As Frequently | Less Frequently | More Frequently | Not at All | All | As Frequently (%) | Less Frequently (%) | More Frequently (%) | Not at All
(%) | All (%) |
|---|
| 15–24 | 28 | 36 | 46 | 8 | 118 | 6.88 | 8.85 | 11.3 | 1.97 | 28.99 |
| 25–40 | 35 | 49 | 72 | 5 | 161 | 8.6 | 12.04 | 17.69 | 1.23 | 39.56 |
| 41–64 | 35 | 29 | 46 | 17 | 127 | 8.6 | 7.13 | 11.3 | 4.18 | 31.2 |
| 7–14 | 0 | 0 | 1 | 0 | 1 | 0 | 0 | 0.25 | 0 | 0.25 |
| All | 98 | 114 | 165 | 30 | 407 | 24.08 | 28.01 | 40.54 | 7.37 | 100 |
Table 8.
Chi-square test result table that relates to Contingency
Table 5,
Table 6 and
Table 7, respectively.
Table 8.
Chi-square test result table that relates to Contingency
Table 5,
Table 6 and
Table 7, respectively.
| Question and Gender | Value | DoF | p-Value |
|---|
| Visits 2019 | 25.67 | 12 | 0.01 |
| Time spent during the Pandemic | 17.87 | 12 | 0.12 |
| Frequency to pre-COVID | 15.91 | 9 | 0.07 |
Table 9.
Contingency Table: Location sharing (Q11) by gender.
Table 9.
Contingency Table: Location sharing (Q11) by gender.
| Gender | No, Not at All | Yes, at All Time | Yes, While Using the App | All | No, Not at All
(%) | Yes, at All Times (%) | Yes, While Using the App (%) | All
(%) |
|---|
| Female | 120 | 63 | 87 | 270 | 30 | 15.75 | 21.75 | 67.5 |
| Male | 52 | 32 | 46 | 130 | 13 | 8 | 11.5 | 32.5 |
| All | 172 | 95 | 133 | 400 | 43 | 23.75 | 33.25 | 100 |
Table 10.
Chi-square test result table that relates to Contingency
Table A11 and
Table 9, respectively.
Table 10.
Chi-square test result table that relates to Contingency
Table A11 and
Table 9, respectively.
| Question and Gender | Value | DoF | p-Value |
|---|
| Interest | 0.3163 | 1 | 0.57 |
| Location | 0.73 | 2 | 0.69 |
Table 11.
Contingency Table: Location sharing (Q11) by age.
Table 11.
Contingency Table: Location sharing (Q11) by age.
| Age | No, Not at All | Yes, at All Time | Yes, While Using the App | All | No, Not at All (%) | Yes, At all Times (%) | Yes, While Using the App (%) | All
(%) |
|---|
| 15–24 | 61 | 19 | 37 | 117 | 15.25 | 4.75 | 9.25 | 29.25 |
| 25–40 | 72 | 39 | 48 | 159 | 18 | 9.75 | 12 | 39.75 |
| 41–64 | 39 | 37 | 48 | 124 | 9.75 | 9.25 | 12 | 31 |
| All | 172 | 95 | 133 | 400 | 43 | 23.75 | 33.25 | 100 |
Table 12.
Chi-square test result table that relates to Contingency
Table A12 and
Table 11, respectively.
Table 12.
Chi-square test result table that relates to Contingency
Table A12 and
Table 11, respectively.
| Question and Gender | Value | DoF | p-Value |
|---|
| Interest | 0.3163 | 1 | 0.57 |
| Location | 0.73 | 2 | 0.69 |
Table 13.
Contingency Table: Physical safety enhancements from monitoring (Q8) by gender.
Table 13.
Contingency Table: Physical safety enhancements from monitoring (Q8) by gender.
| Gender | No | Yes | All | No (%) | Yes (%) | All (%) |
|---|
| Female | 133 | 137 | 270 | 33.25 | 34.25 | 67.5 |
| Male | 50 | 80 | 130 | 12.5 | 20 | 32.5 |
| All | 183 | 217 | 400 | 45.75 | 54.25 | 100 |
Table 14.
Contingency Table: COVID-19 safety enhancements from monitoring (Q9) by gender.
Table 14.
Contingency Table: COVID-19 safety enhancements from monitoring (Q9) by gender.
| Gender | No | Yes | All | No (%) | Yes (%) | All (%) |
|---|
| Female | 127 | 143 | 270 | 31.75 | 35.75 | 67.5 |
| Male | 48 | 82 | 130 | 12 | 20.5 | 32.5 |
| All | 175 | 225 | 400 | 43.75 | 56.25 | 100 |
Table 15.
Contingency Table: Social distancing (Q6) by gender.
Table 15.
Contingency Table: Social distancing (Q6) by gender.
| Gender | No | Yes | All | No (%) | Yes (%) | All (%) |
|---|
| Female | 65 | 205 | 270 | 16.25 | 51.25 | 67.5 |
| Male | 38 | 92 | 130 | 9.5 | 23 | 32.5 |
| All | 103 | 297 | 400 | 25.75 | 74.25 | 100 |
| Question and Gender | Value | DoF | p-Value |
|---|
| Physical safety | 4.12 | 1 | 0.04 |
| App-related safety | 3.65 | 1 | 0.56 |
| Social distancing | 1.22 | 1 | 0.27 |
Table 17.
Contingency Table: Physical safety enhancements from monitoring (Q8) by age.
Table 17.
Contingency Table: Physical safety enhancements from monitoring (Q8) by age.
| Age | No | Yes | All | No (%) | Yes (%) | All (%) |
| 15–24 | 72 | 45 | 117 | 18 | 11.25 | 29.25 |
| 25–40 | 69 | 90 | 159 | 17.25 | 22.5 | 39.75 |
| 41–64 | 42 | 82 | 124 | 10.5 | 20.5 | 31 |
| All | 183 | 217 | 400 | 45.75 | 54.25 | 100 |
Table 18.
Contingency Table: COVID-19-related safety enhancements through monitoring (Q9) by age.
Table 18.
Contingency Table: COVID-19-related safety enhancements through monitoring (Q9) by age.
| Age | No | Yes | All | No (%) | Yes (%) | All (%) |
|---|
| 15–24 | 68 | 49 | 117 | 17 | 12.25 | 29.25 |
| 25–40 | 69 | 90 | 159 | 17.25 | 22.5 | 39.75 |
| 41–64 | 38 | 86 | 124 | 9.5 | 21.5 | 31 |
| All | 175 | 225 | 400 | 43.75 | 56.25 | 100 |
Table 19.
Contingency Table: Social distancing (Q6) by age.
Table 19.
Contingency Table: Social distancing (Q6) by age.
| Age | No | Yes | All | No (%) | Yes (%) | All (%) |
|---|
| 15–24 | 34 | 83 | 117 | 8.5 | 20.75 | 29.25 |
| 25–40 | 45 | 114 | 159 | 11.25 | 28.5 | 39.75 |
| 41–64 | 24 | 100 | 124 | 6 | 25 | 31 |
| All | 103 | 297 | 400 | 25.75 | 74.25 | 100 |
| Question and Age | Value | DoF | p-Value |
|---|
| Physical safety | 19.17 | 2 | 0.0001 |
| App-related safety | 18.48 | 2 | 0.0001 |
| Social distancing | 3.86 | 2 | 0.14 |
Table 21.
Contingency Table: Interest in the app (Q10) by pre-pandemic park visits (Q1).
Table 21.
Contingency Table: Interest in the app (Q10) by pre-pandemic park visits (Q1).
| Would You Be Interested in Technology That Would Allow You to Know How Many People Are in a Place You Would like to Go? | Always, Almost Every Day | Not at All | Often, a Couple of Times per Week | Rarely, a Couple of Times per Year | Sometimes, a Couple of Times per Month | All | Always, Almost Every Day (%) | Not at All
(%) | Often, a Couple of Times per Week
(%) | Rarely, a Couple of Times per Year
(%) | Sometimes, a Couple of Times per Month
(%) | All
(%) |
|---|
| No | 19 | 6 | 50 | 21 | 47 | 143 | 4.75 | 1.5 | 12.5 | 5.25 | 11.75 | 35.75 |
| Yes | 69 | 3 | 60 | 23 | 102 | 257 | 17.25 | 0.75 | 15 | 5.75 | 25.5 | 64.25 |
| All | 88 | 9 | 110 | 44 | 149 | 400 | 22 | 2.25 | 27.5 | 11 | 37.25 | 100 |
| Questions and Interest in the App | Value | DoF | p-Value |
|---|
| Time spent pre-pandemic | 19.832 | 4 | 0.0005 |
| Time spent during the pandemic | 21.631 | 4 | 0.0002s |
| Frequency increase during the pandemic | 6.13 | 3 | 0.1056 |
Table 23.
Contingency Table: Interest in tech (Q10) and physical safety enhancements by the app.
Table 23.
Contingency Table: Interest in tech (Q10) and physical safety enhancements by the app.
| | No | Yes | All | No (%) | Yes (%) | All (%) |
|---|
| No | 107 | 36 | 143 | 26.75 | 9 | 35.75 |
| Yes | 76 | 181 | 257 | 19 | 45.25 | 64.25 |
| All | 183 | 217 | 400 | 45.75 | 54.25 | 100 |
Table 24.
Contingency Table: Interest in tech (Q10) and COVID-19-related perceived safety enhancement.
Table 24.
Contingency Table: Interest in tech (Q10) and COVID-19-related perceived safety enhancement.
| | No | Yes | All | No (%) | Yes (%) | All |
|---|
| No | 117 | 26 | 143 | 29.25 | 6.5 | 35.75 |
| Yes | 58 | 199 | 257 | 14.5 | 49.75 | 64.25 |
| All | 175 | 225 | 400 | 43.75 | 56.25 | 100 |
Table 25.
Chi-square test result table that relates to Contingency
Table 23 and
Table 24, respectively.
Table 25.
Chi-square test result table that relates to Contingency
Table 23 and
Table 24, respectively.
| Questions and Interest in the App | Value | DoF | p-Value |
|---|
| Physical safety | 75.80 | 1 | 0 |
| Enhanced safety | 131.07 | 1 | 0 |
Table 26.
Regression model accuracy metrics.
Table 26.
Regression model accuracy metrics.
| | Training (%) | Test (%) | AUC (%) |
|---|
| Accuracy | Random Forest | 87.00 | 70.00 | 76.07 |
| Xgboost | 57.67 | 47.00 | y |
Table 27.
Variable importance of Random Forest and Xgboost.
Table 27.
Variable importance of Random Forest and Xgboost.
| Importance |
|---|
| Feature | Random Forest | Xgboost |
|---|
| distancing | 0.03 | 0.00 |
| gender | 0.05 | 0.04 |
| time | 0.05 | 0.03 |
| socializing | 0.08 | 0.05 |
| age | 0.09 | 0.06 |
| pre-COVID | 0.09 | 0.07 |
| activity | 0.12 | 0.05 |
| municipalities | 0.13 | 0.09 |
| location | 0.13 | 0.05 |
| frequency change | 0.23 | 0.56 |
Table 28.
Contingency Table: Interest in the app (Q8) and general physical safety perception (Q5).
Table 28.
Contingency Table: Interest in the app (Q8) and general physical safety perception (Q5).
| | No | Yes | All | No (%) | Yes (%) | All (%) |
|---|
| No | 11 | 35 | 46 | 2.44 | 7.76 | 10.2 |
| Yes | 201 | 204 | 405 | 44.57 | 45.23 | 89.8 |
| All | 212 | 239 | 451 | 47.01 | 52.99 | 100 |
Table 29.
Chi-square test result table that relates to Contingency
Table 28.
Table 29.
Chi-square test result table that relates to Contingency
Table 28.
| Topic and Interest in App | Value | DoF | p-Value |
|---|
| General safety | 9.96 | 1 | 0.0016 |
Table 30.
Safety concern (Q9) by interest in the app (Q8).
Table 30.
Safety concern (Q9) by interest in the app (Q8).
| | Park Visits at Night | Park Visits in Deprived Areas | Unsafe Playgrounds | Visits of Overcrowded Greenspaces | All | Park Visits at Night | Park Visits in Deprived Areas | Unsafe Playgrounds | Visits of Overcrowded Greenspaces | All |
|---|
| No | 79 | 45 | 58 | 30 | 212 | 17.52 | 9.98 | 12.86 | 6.65 | 47.01 |
| Yes | 103 | 50 | 34 | 52 | 239 | 22.84 | 11.09 | 7.54 | 11.53 | 52.99 |
| All | 182 | 95 | 92 | 82 | 451 | 40.35 | 21.06 | 20.4 | 18.18 | 100 |
Table 31.
Safety concern (Q9) by gender (Q1).
Table 31.
Safety concern (Q9) by gender (Q1).
| | Park Visits at Night | Park Visits in Deprived Areas | Unsafe Playgrounds | Visits of Overcrowded Greenspaces | All | Park Visits at Night | Park Visits in Deprived Areas | Unsafe Playgrounds | Visits of Overcrowded Greenspaces | All |
|---|
| Female | 127 | 44 | 45 | 41 | 257 | 28.16 | 9.76 | 9.98 | 9.09 | 56.98 |
| Male | 54 | 51 | 45 | 41 | 191 | 11.97 | 11.31 | 9.98 | 9.09 | 42.35 |
| Other | 1 | 0 | 2 | 0 | 3 | 0.22 | 0 | 0.44 | 0 | 0.67 |
| All | 182 | 95 | 92 | 82 | 451 | 40.35 | 21.06 | 20.4 | 18.18 | 100 |
Table 32.
Safety concern (Q9) by physical safety enhancements through the app (Q7).
Table 32.
Safety concern (Q9) by physical safety enhancements through the app (Q7).
| | Park Visits at Night | Park Visits in Deprived Areas | Unsafe Playgrounds | Visits of Overcrowded Greenspaces | All | Park Visits at Night | Park Visits in Deprived Areas | Unsafe Playgrounds | Visits of Overcrowded Greenspaces | All |
|---|
| No | 69 | 40 | 51 | 27 | 187 | 15.3 | 8.87 | 11.31 | 5.99 | 41.46 |
| Yes | 113 | 55 | 41 | 55 | 264 | 25.06 | 12.2 | 9.09 | 12.2 | 58.54 |
| All | 182 | 95 | 92 | 82 | 451 | 40.35 | 21.06 | 20.4 | 18.18 | 100 |
Table 33.
Multiple contingency tables.
Table 33.
Multiple contingency tables.
| | Female | Male | Other | All | Female | Male | Other | All |
|---|
| Post-COVID-19 greenspace usage | | | | | | | | |
| My visits have become less frequently | 24 | 23 | 1 | 48 | 5.32 | 5.1 | 0.22 | 10.64 |
| No, not at all | 86 | 80 | 0 | 166 | 19.07 | 17.74 | 0 | 36.81 |
| The usage remained unchanged | 52 | 46 | 0 | 98 | 11.53 | 10.2 | 0 | 21.73 |
| I visit greenspaces more frequently and actively than before the pandemic | 95 | 42 | 2 | 139 | 21.06 | 9.31 | 0.44 | 30.82 |
| All | 257 | 191 | 3 | 451 | 56.98 | 42.35 | 0.67 | 100 |
| General safety perception | |
| No | 27 | 16 | 3 | 46 | 5.99 | 3.55 | 0.67 | 10.2 |
| Yes | 230 | 175 | 0 | 405 | 51 | 38.8 | 0 | 89.8 |
| All | 257 | 191 | 3 | 451 | 56.98 | 42.35 | 0.67 | 100 |
| Post-COVID-19 safety perception change | |
| I feel less safe | 25 | 22 | 1 | 48 | 5.54 | 4.88 | 0.22 | 10.64 |
| I feel safer in open spaces | 57 | 49 | 2 | 108 | 12.64 | 10.86 | 0.44 | 23.95 |
| safety unchanged | 175 | 120 | 0 | 295 | 38.8 | 26.61 | 0 | 65.41 |
| All | 257 | 191 | 3 | 451 | 56.98 | 42.35 | 0.67 | 100 |
| Physical safety enhancements | |
| No | 101 | 86 | 0 | 187 | 22.39 | 19.07 | 0 | 41.46 |
| Yes | 156 | 105 | 3 | 264 | 34.59 | 23.28 | 0.67 | 58.54 |
| All | 257 | 191 | 3 | 451 | 56.98 | 42.35 | 0.67 | 100 |
| Monitoring | |
| No | 123 | 89 | 0 | 212 | 27.27 | 19.73 | 0 | 47.01 |
| Yes | 134 | 102 | 3 | 239 | 29.71 | 22.62 | 0.67 | 52.99 |
| All | 257 | 191 | 3 | 451 | 56.98 | 42.35 | 0.67 | 100 |
Table 34.
χ
2-Test result table that relates to Contingency
Table 33.
Table 34.
χ
2-Test result table that relates to Contingency
Table 33.
| Topic and Gender | Value | DoF | p-Value |
|---|
| Post-COVID-19 greenspace usage | 16.07 | 6 | 0.0134 |
| General safety perception | 27.13 | 2 | 0.0000 |
| Post-COVID-19 safety perception changes | 7.09 | 4 | 0.1314 |
| Physical safety enhancements | 3.62 | 2 | 0.1637 |
| Interest in the app | 2.75 | 2 | 0.253 |
Table 35.
Interest in the app monitoring by survey.
Table 35.
Interest in the app monitoring by survey.
| | | COVID | Post-COVID |
|---|
| Interest in app one-sided two-sample proportion test | size | 257 | 239 |
| mean | 0.64 | 0.53 |
| standard deviation | 0.024 | 0.0235 |
| Test results | Standard error | 0.0339 |
| Value | 3.32 |
| p-value | 0.0004 |
Table 36.
Physical safety enhancements by survey.
Table 36.
Physical safety enhancements by survey.
| | | COVID | Post-COVID |
|---|
| Interest in app one-sided two-sample proportion test | size | 217 | 264 |
| mean | 0.54 | 0.59 |
| standard deviation | 0.0249 | 0.0232 |
| Test results | Standard error | 0.034 |
| Value | −1.26 |
| p-value | 0.8959 |
| Disclaimer/Publisher’s Note: The statements, opinions and data contained in all publications are solely those of the individual author(s) and contributor(s) and not of MDPI and/or the editor(s). MDPI and/or the editor(s) disclaim responsibility for any injury to people or property resulting from any ideas, methods, instructions or products referred to in the content. |
© 2024 by the authors. Licensee MDPI, Basel, Switzerland. This article is an open access article distributed under the terms and conditions of the Creative Commons Attribution (CC BY) license (https://creativecommons.org/licenses/by/4.0/).

 ,
, 

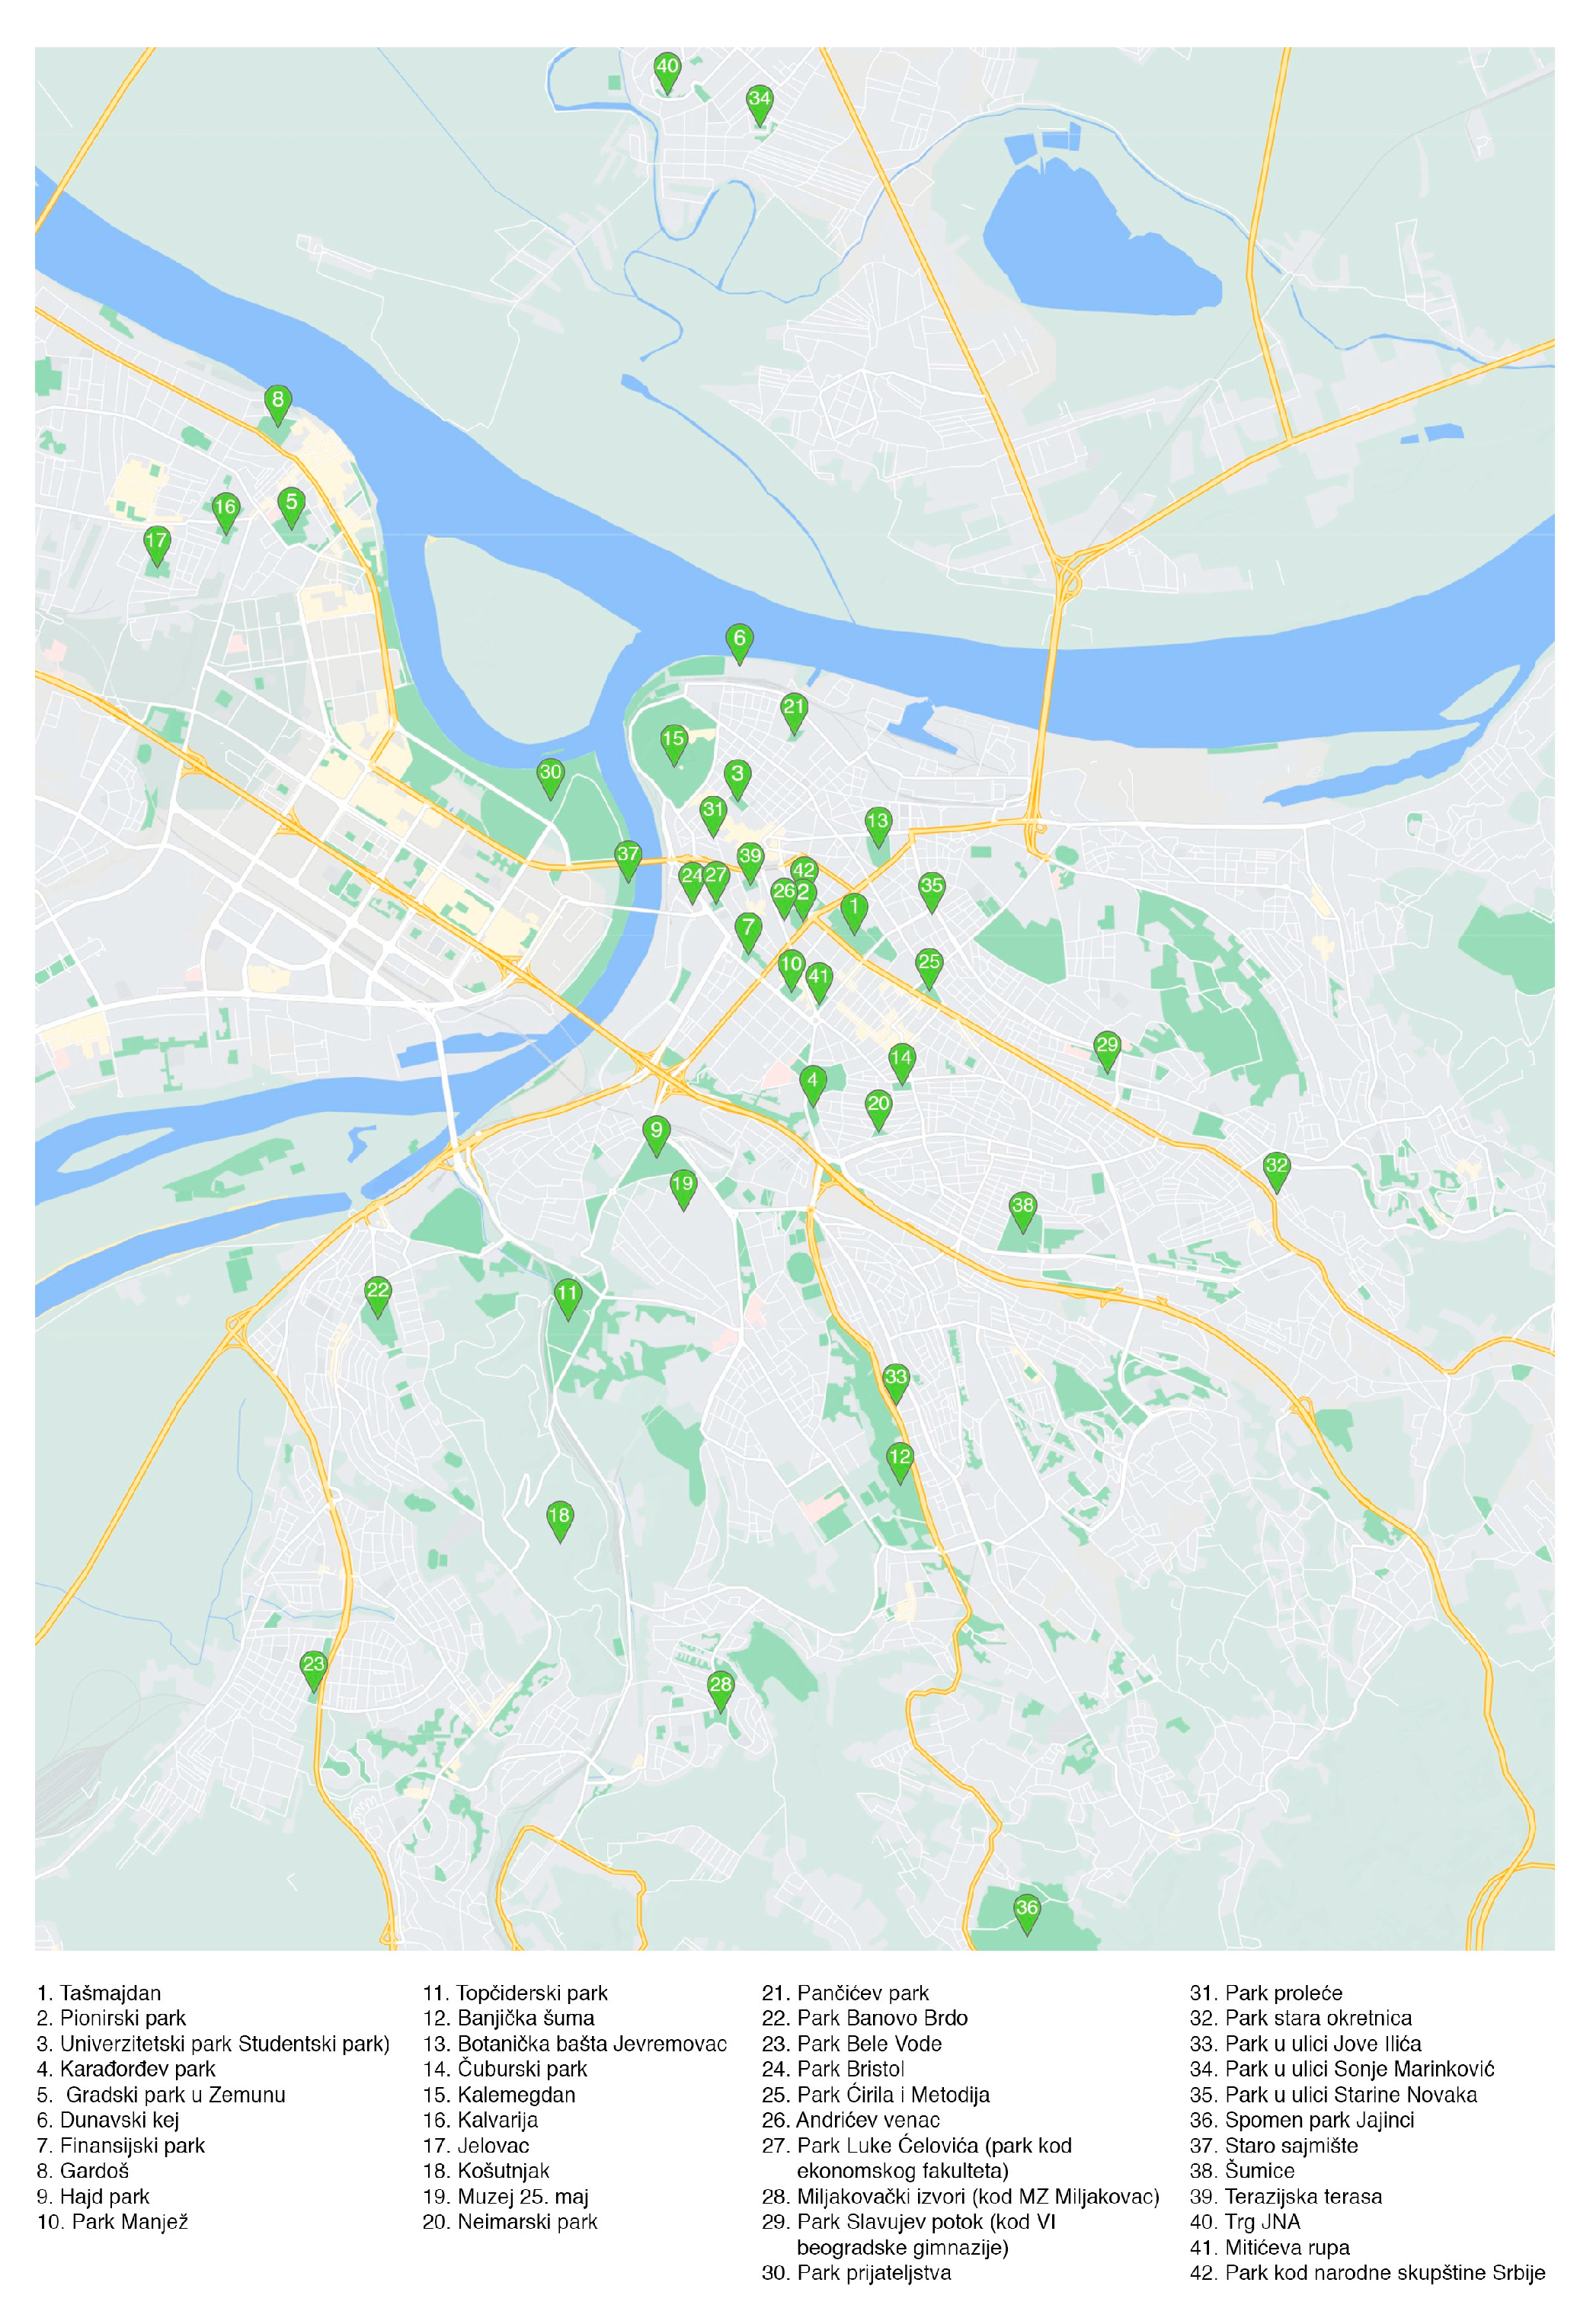
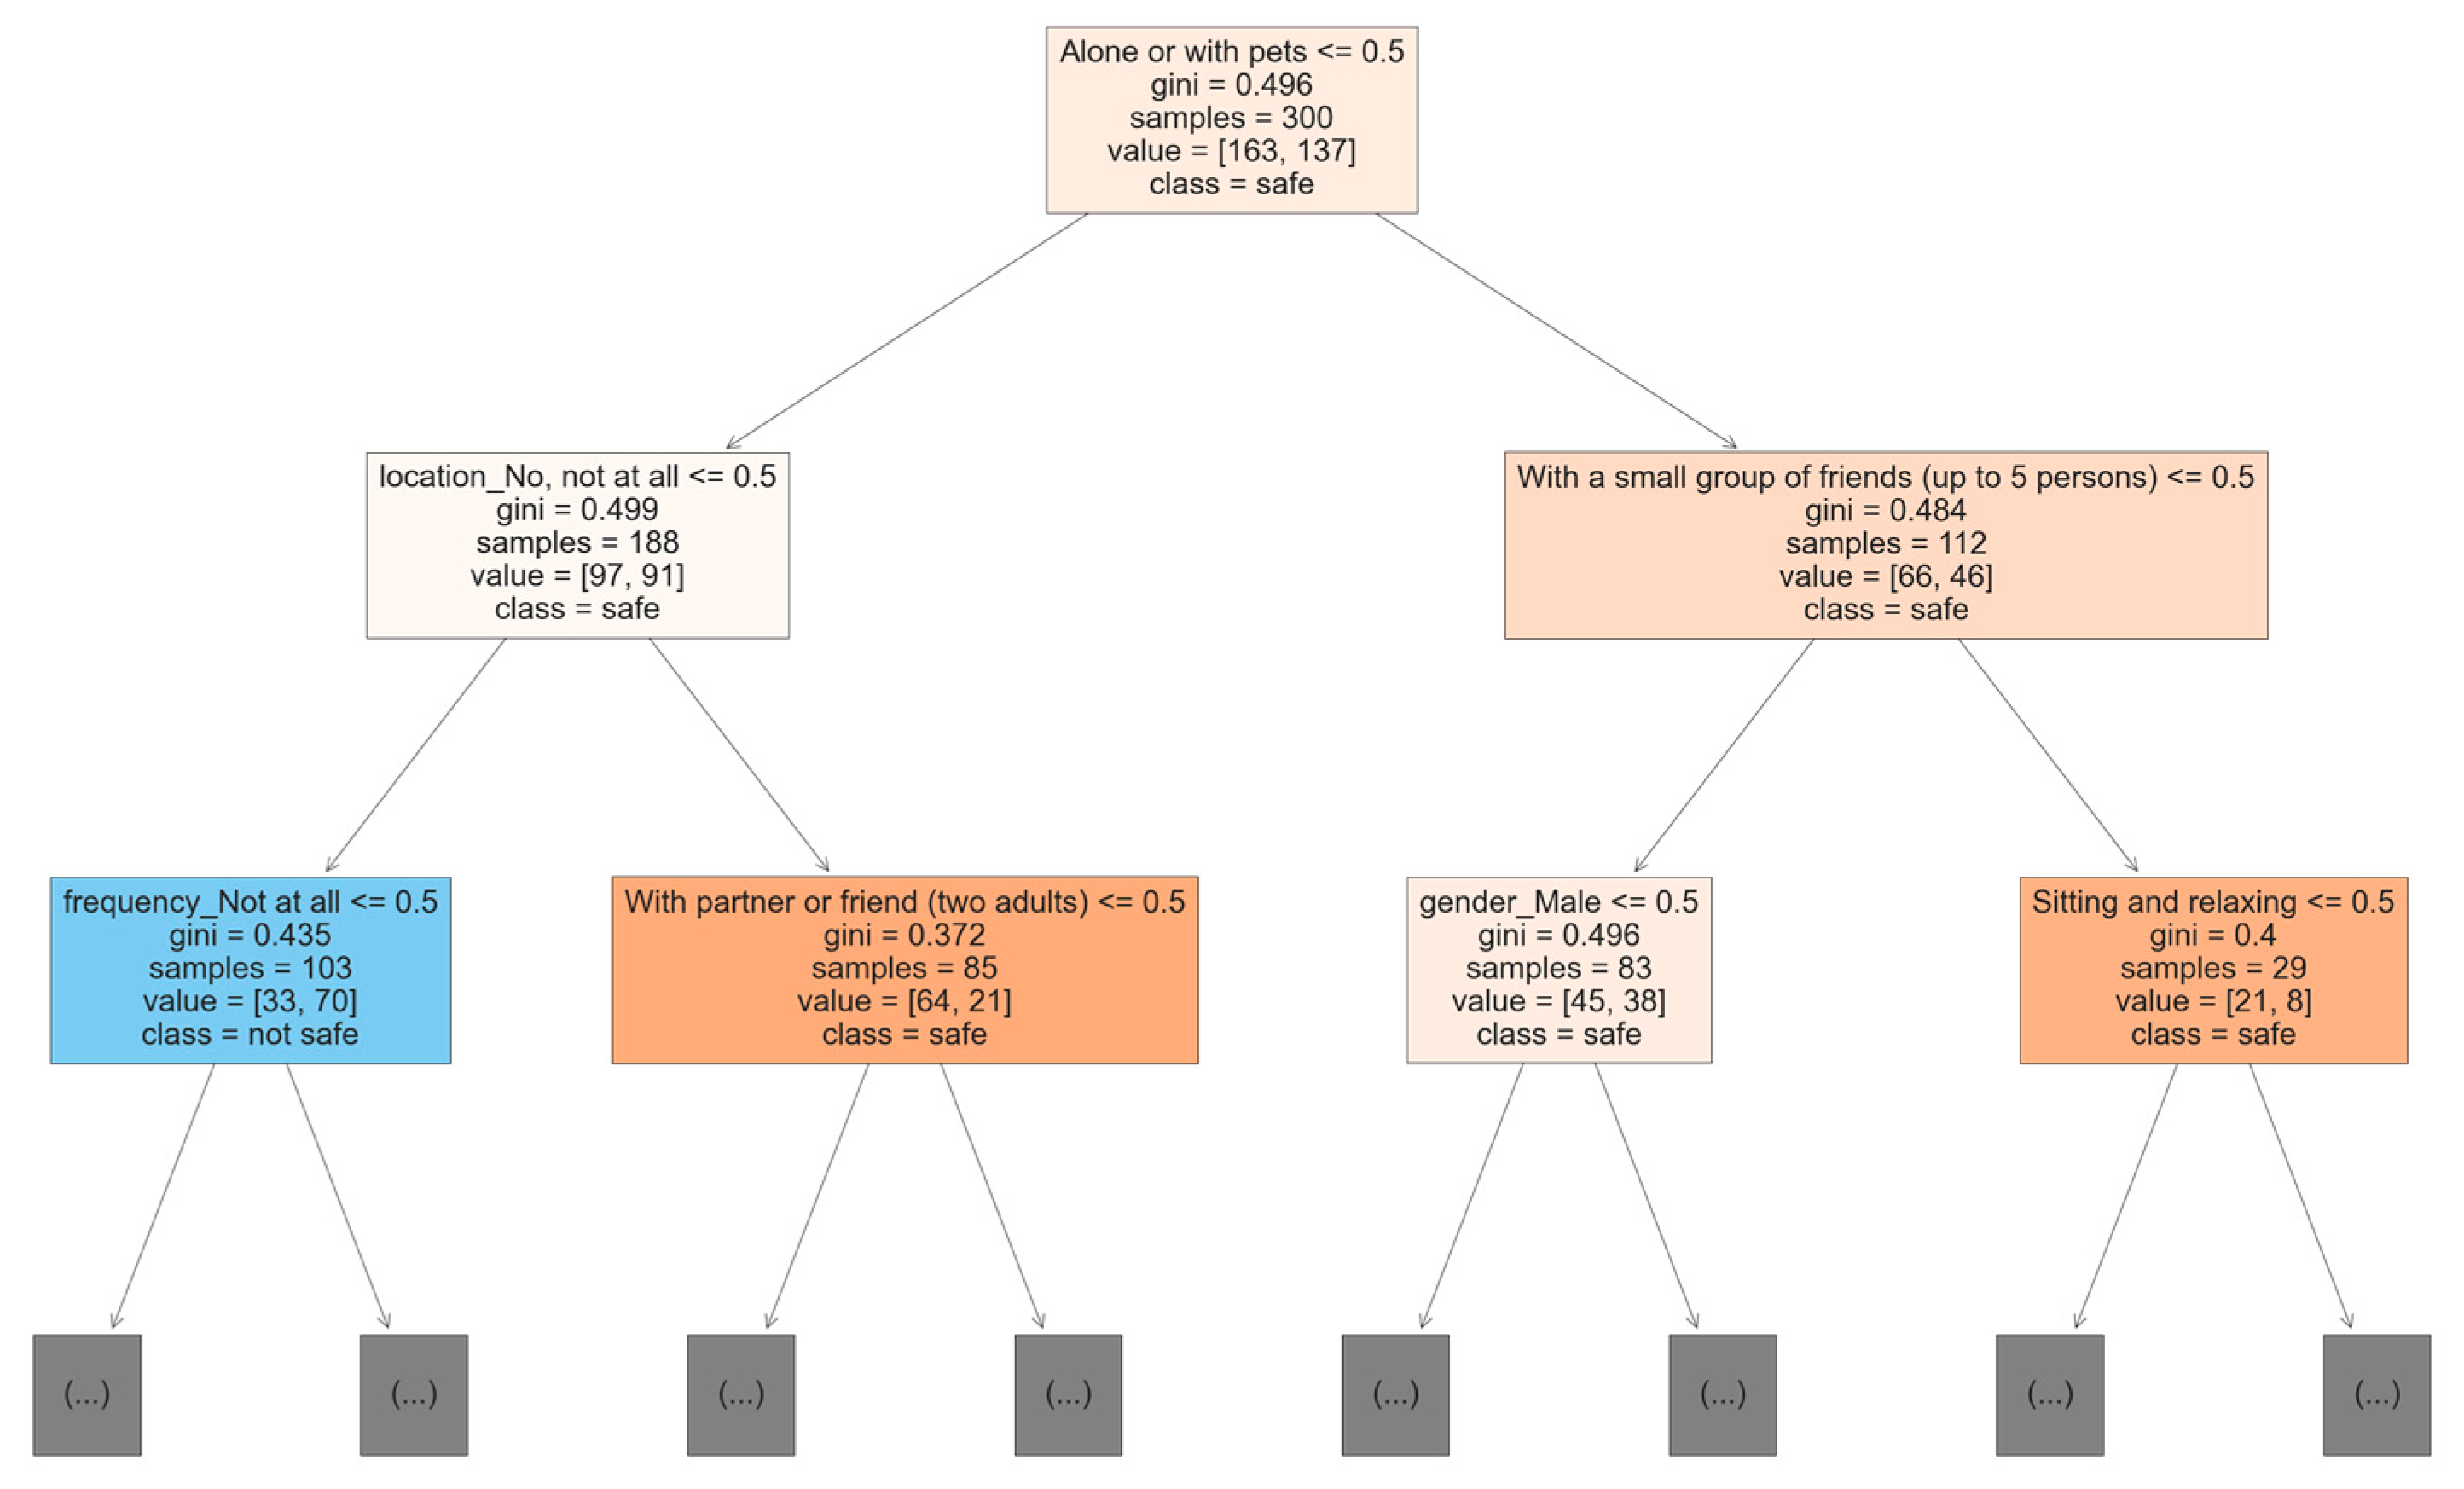
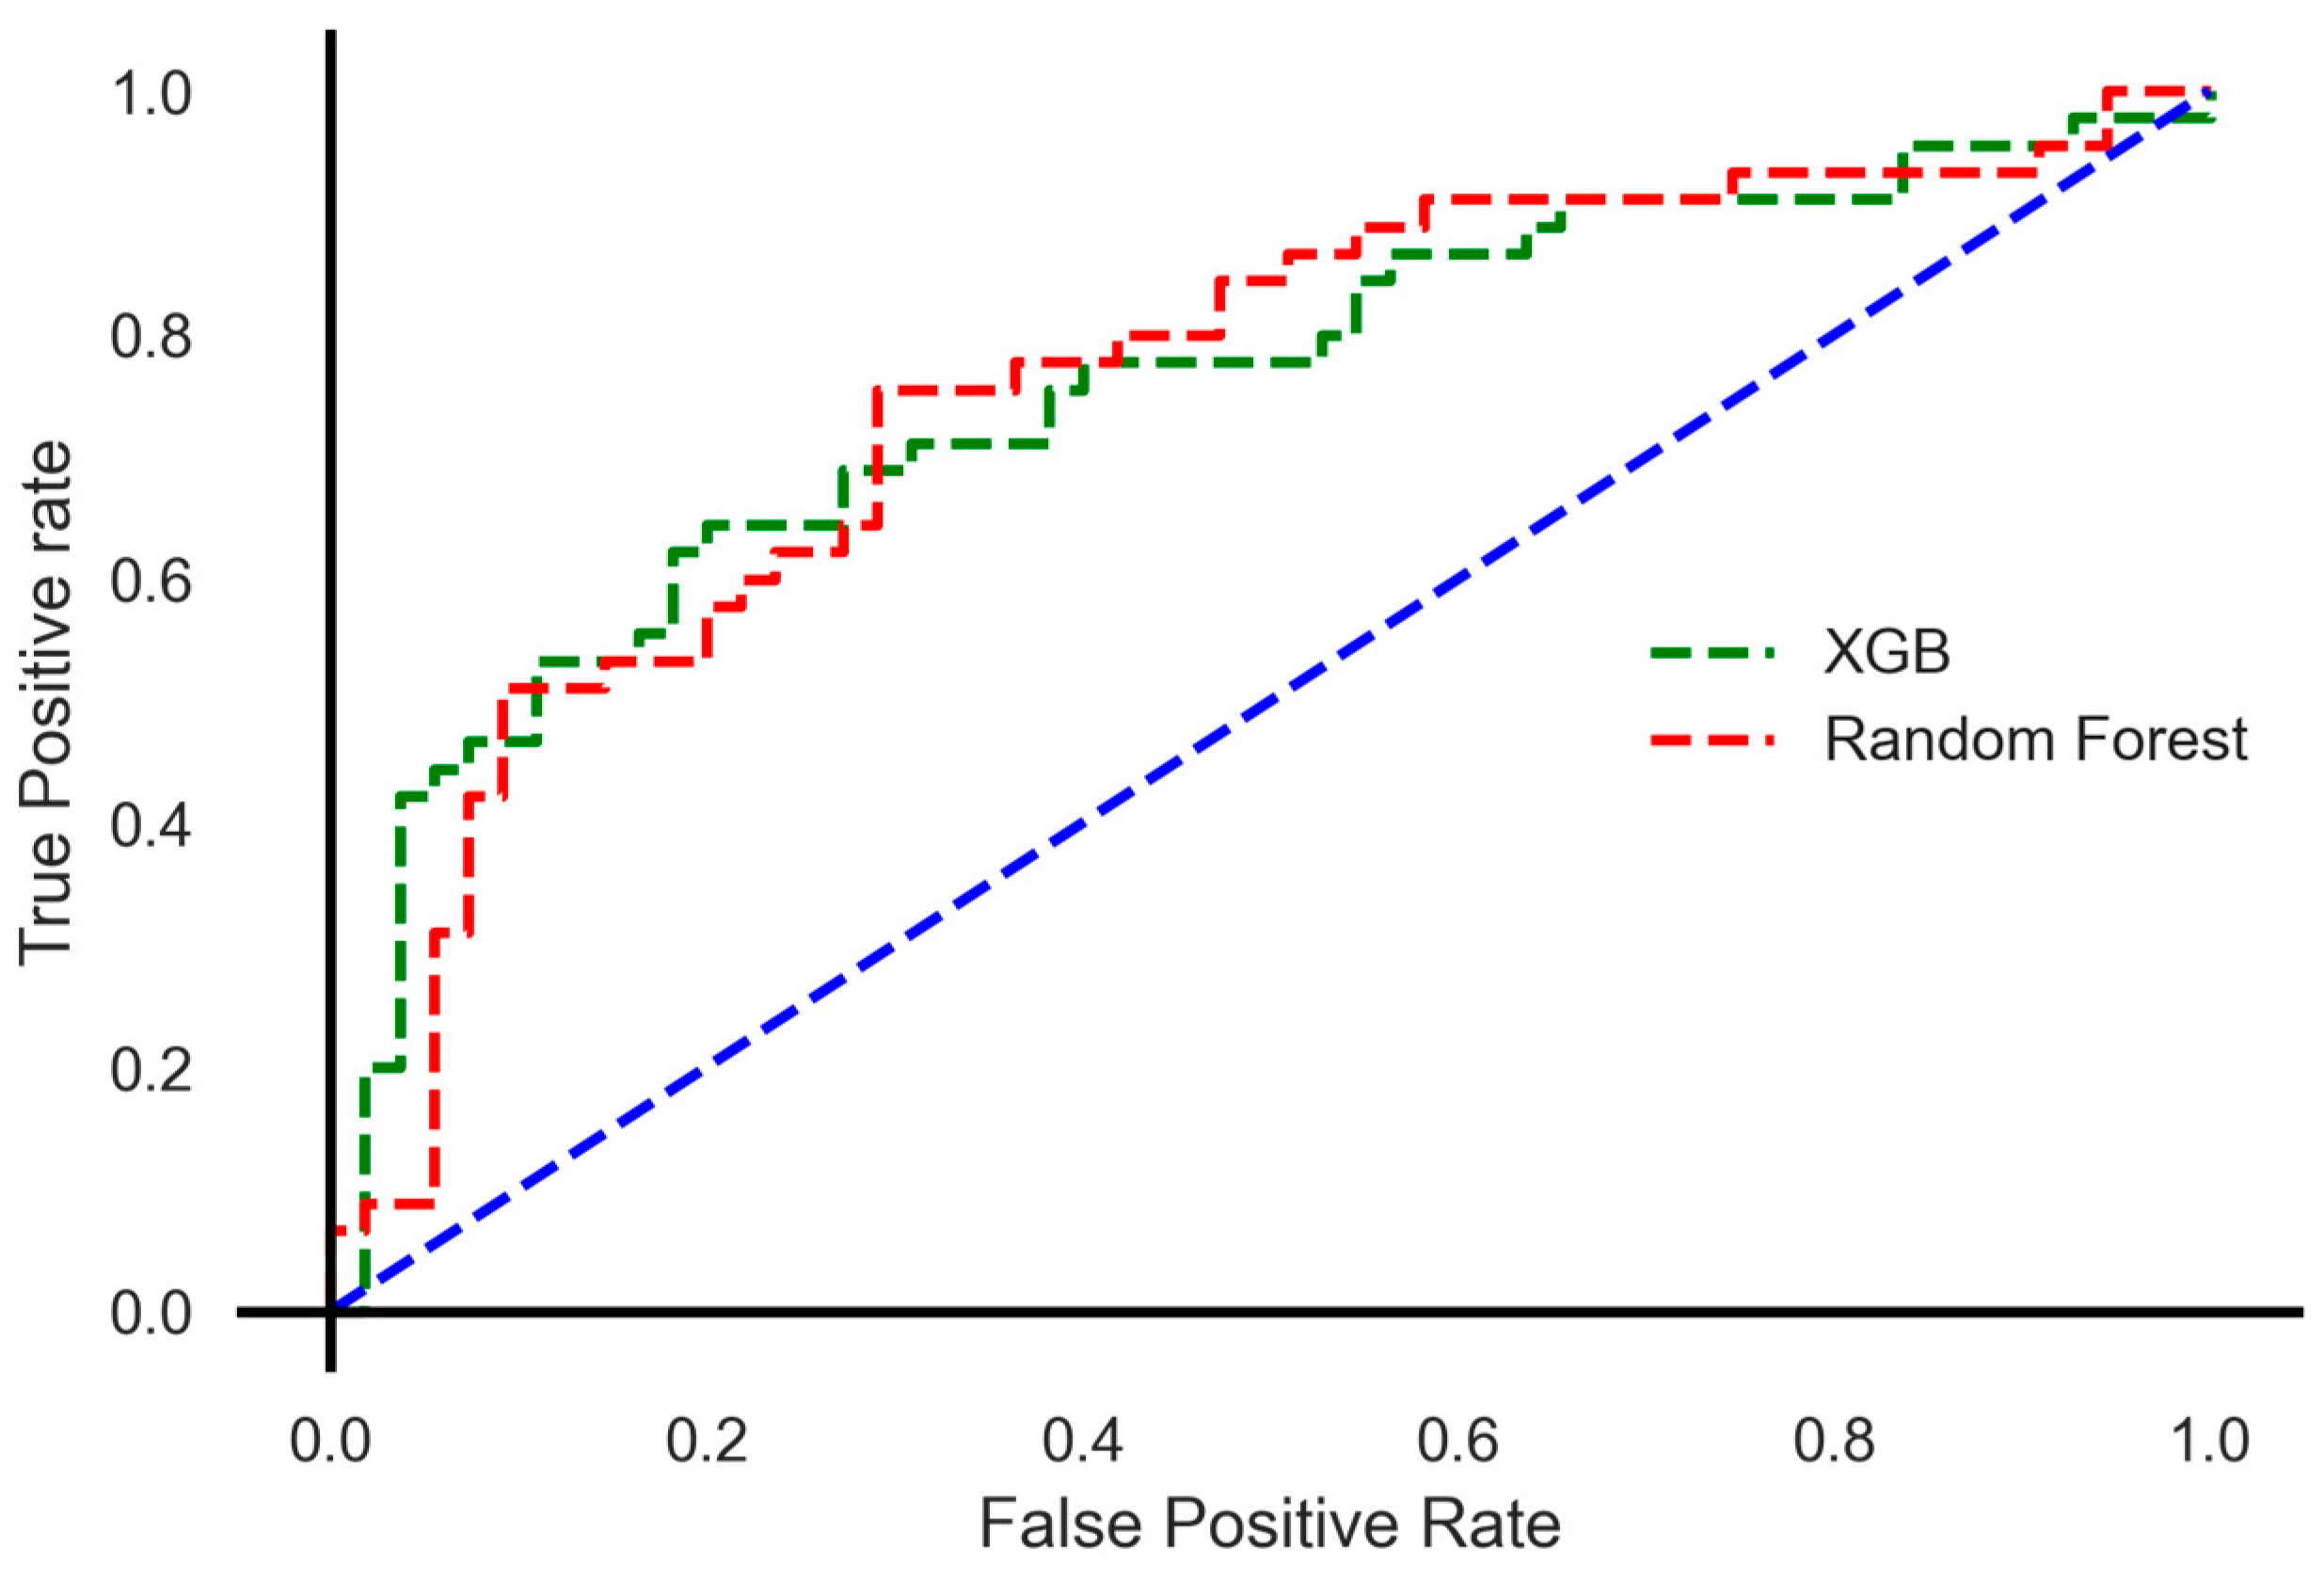
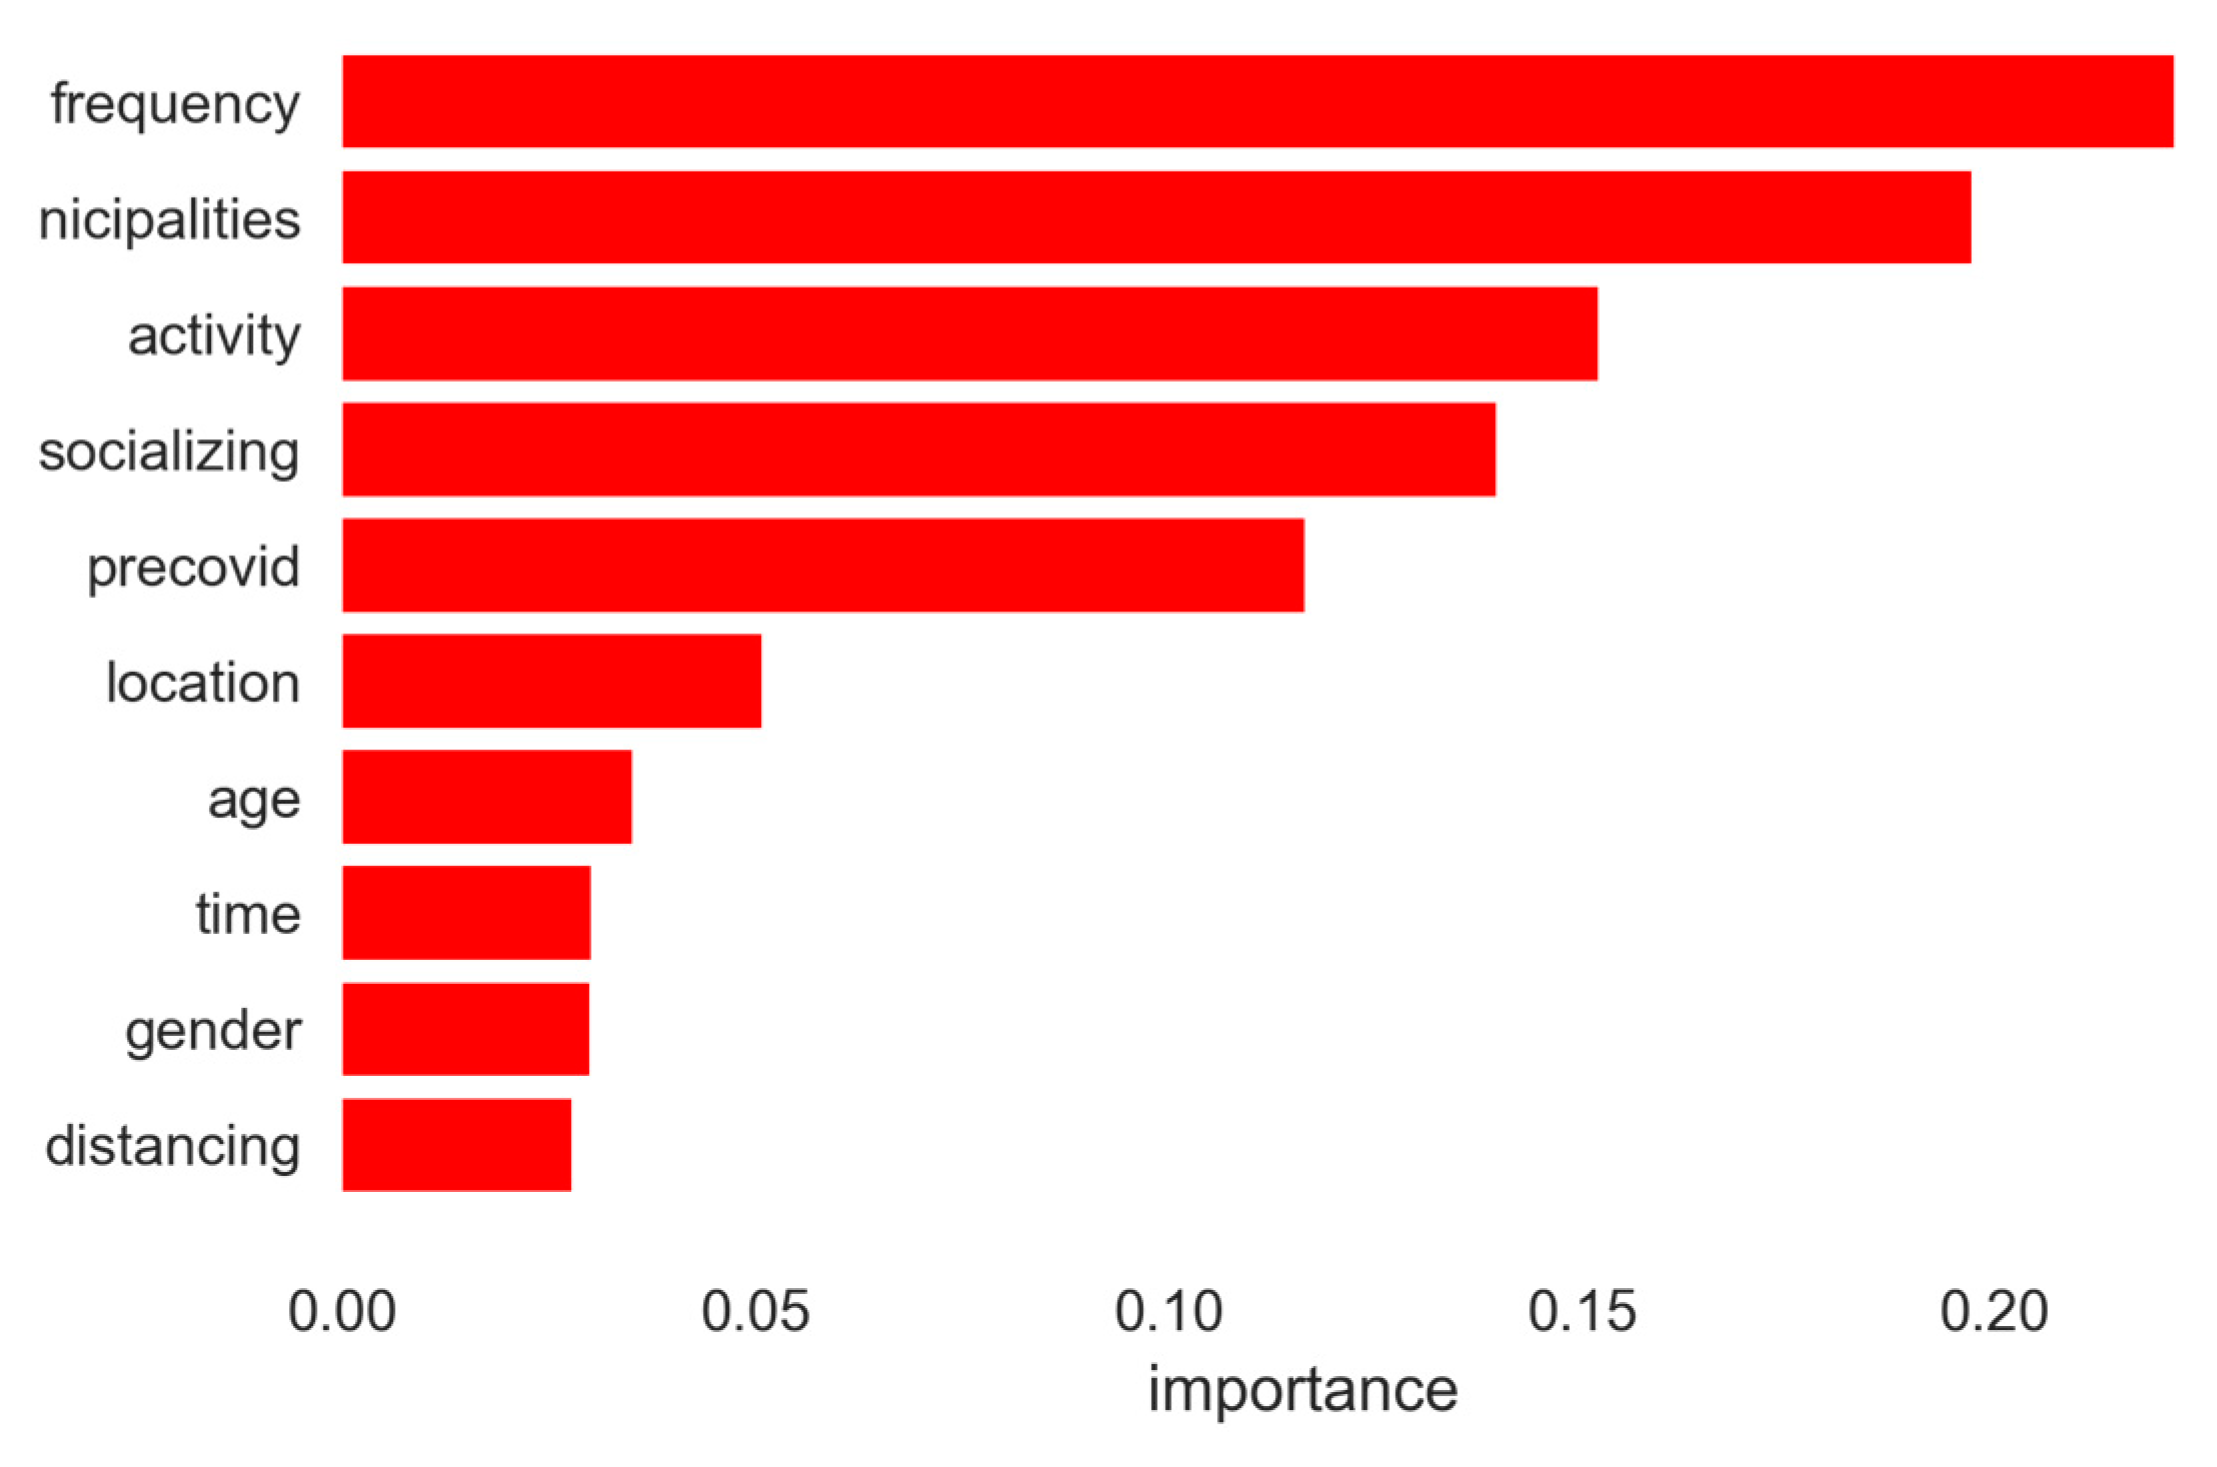
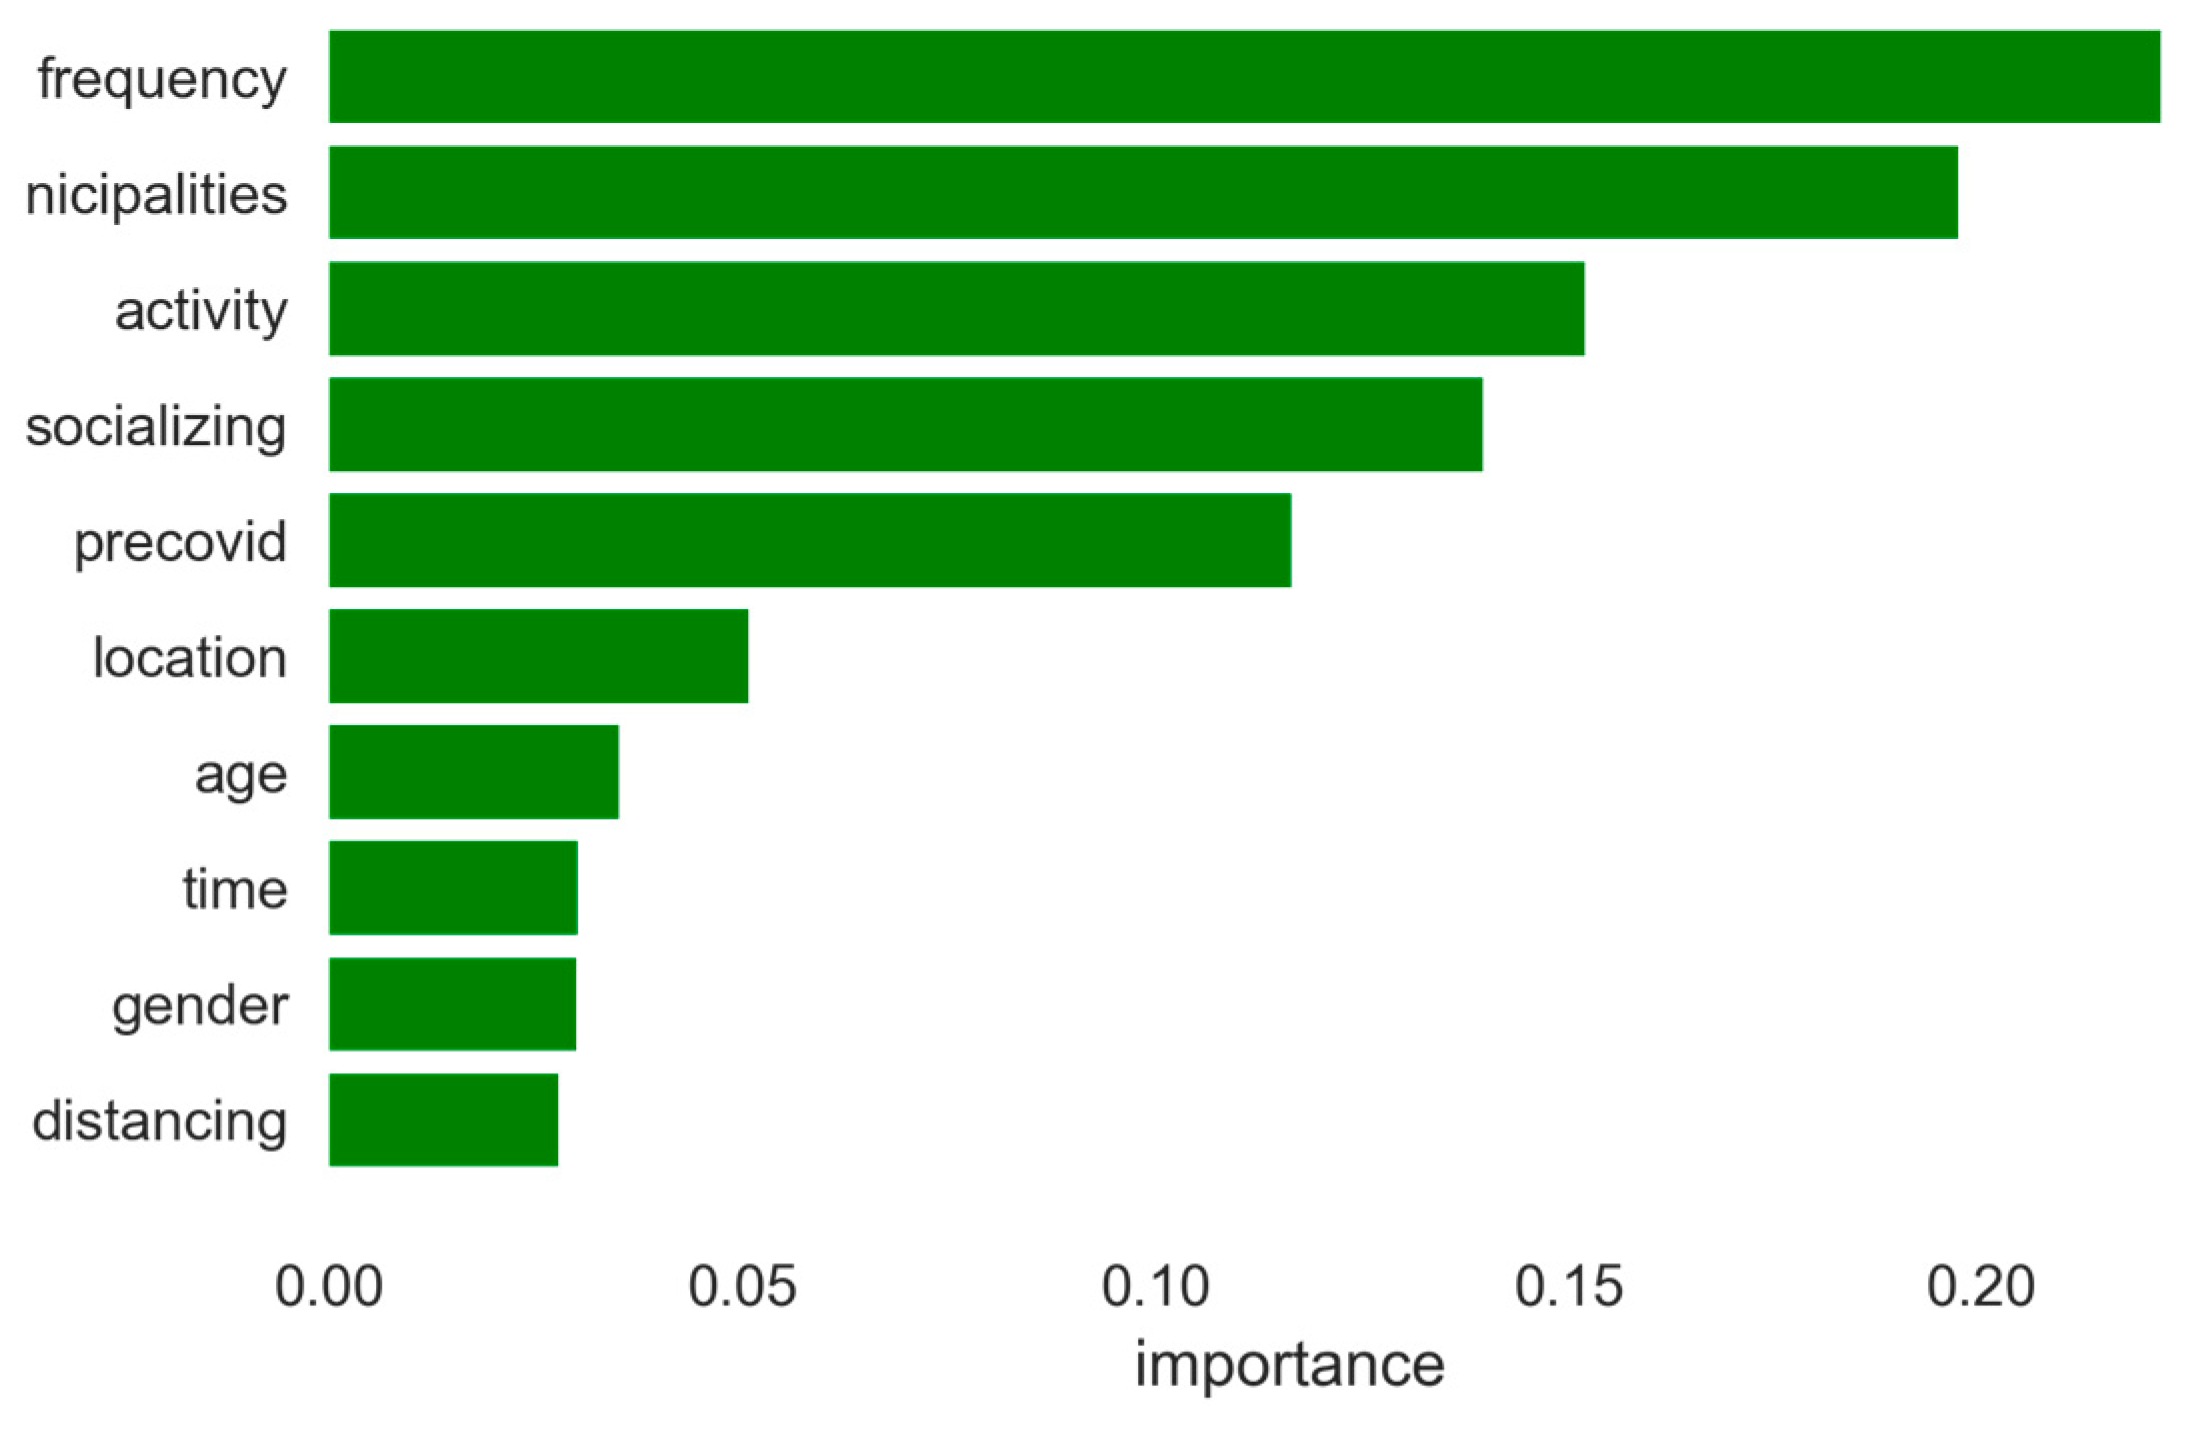


