
Unlocking Urban Accessibility: Proximity Analysis in Bangkok, Thailand’s Mega City


Abstract
1. Introduction
2. Literature Review
2.1. The Significance of Spatial Accessibility and Urban Activity
2.2. Transport Accessibility Evaluation
3. Methodology
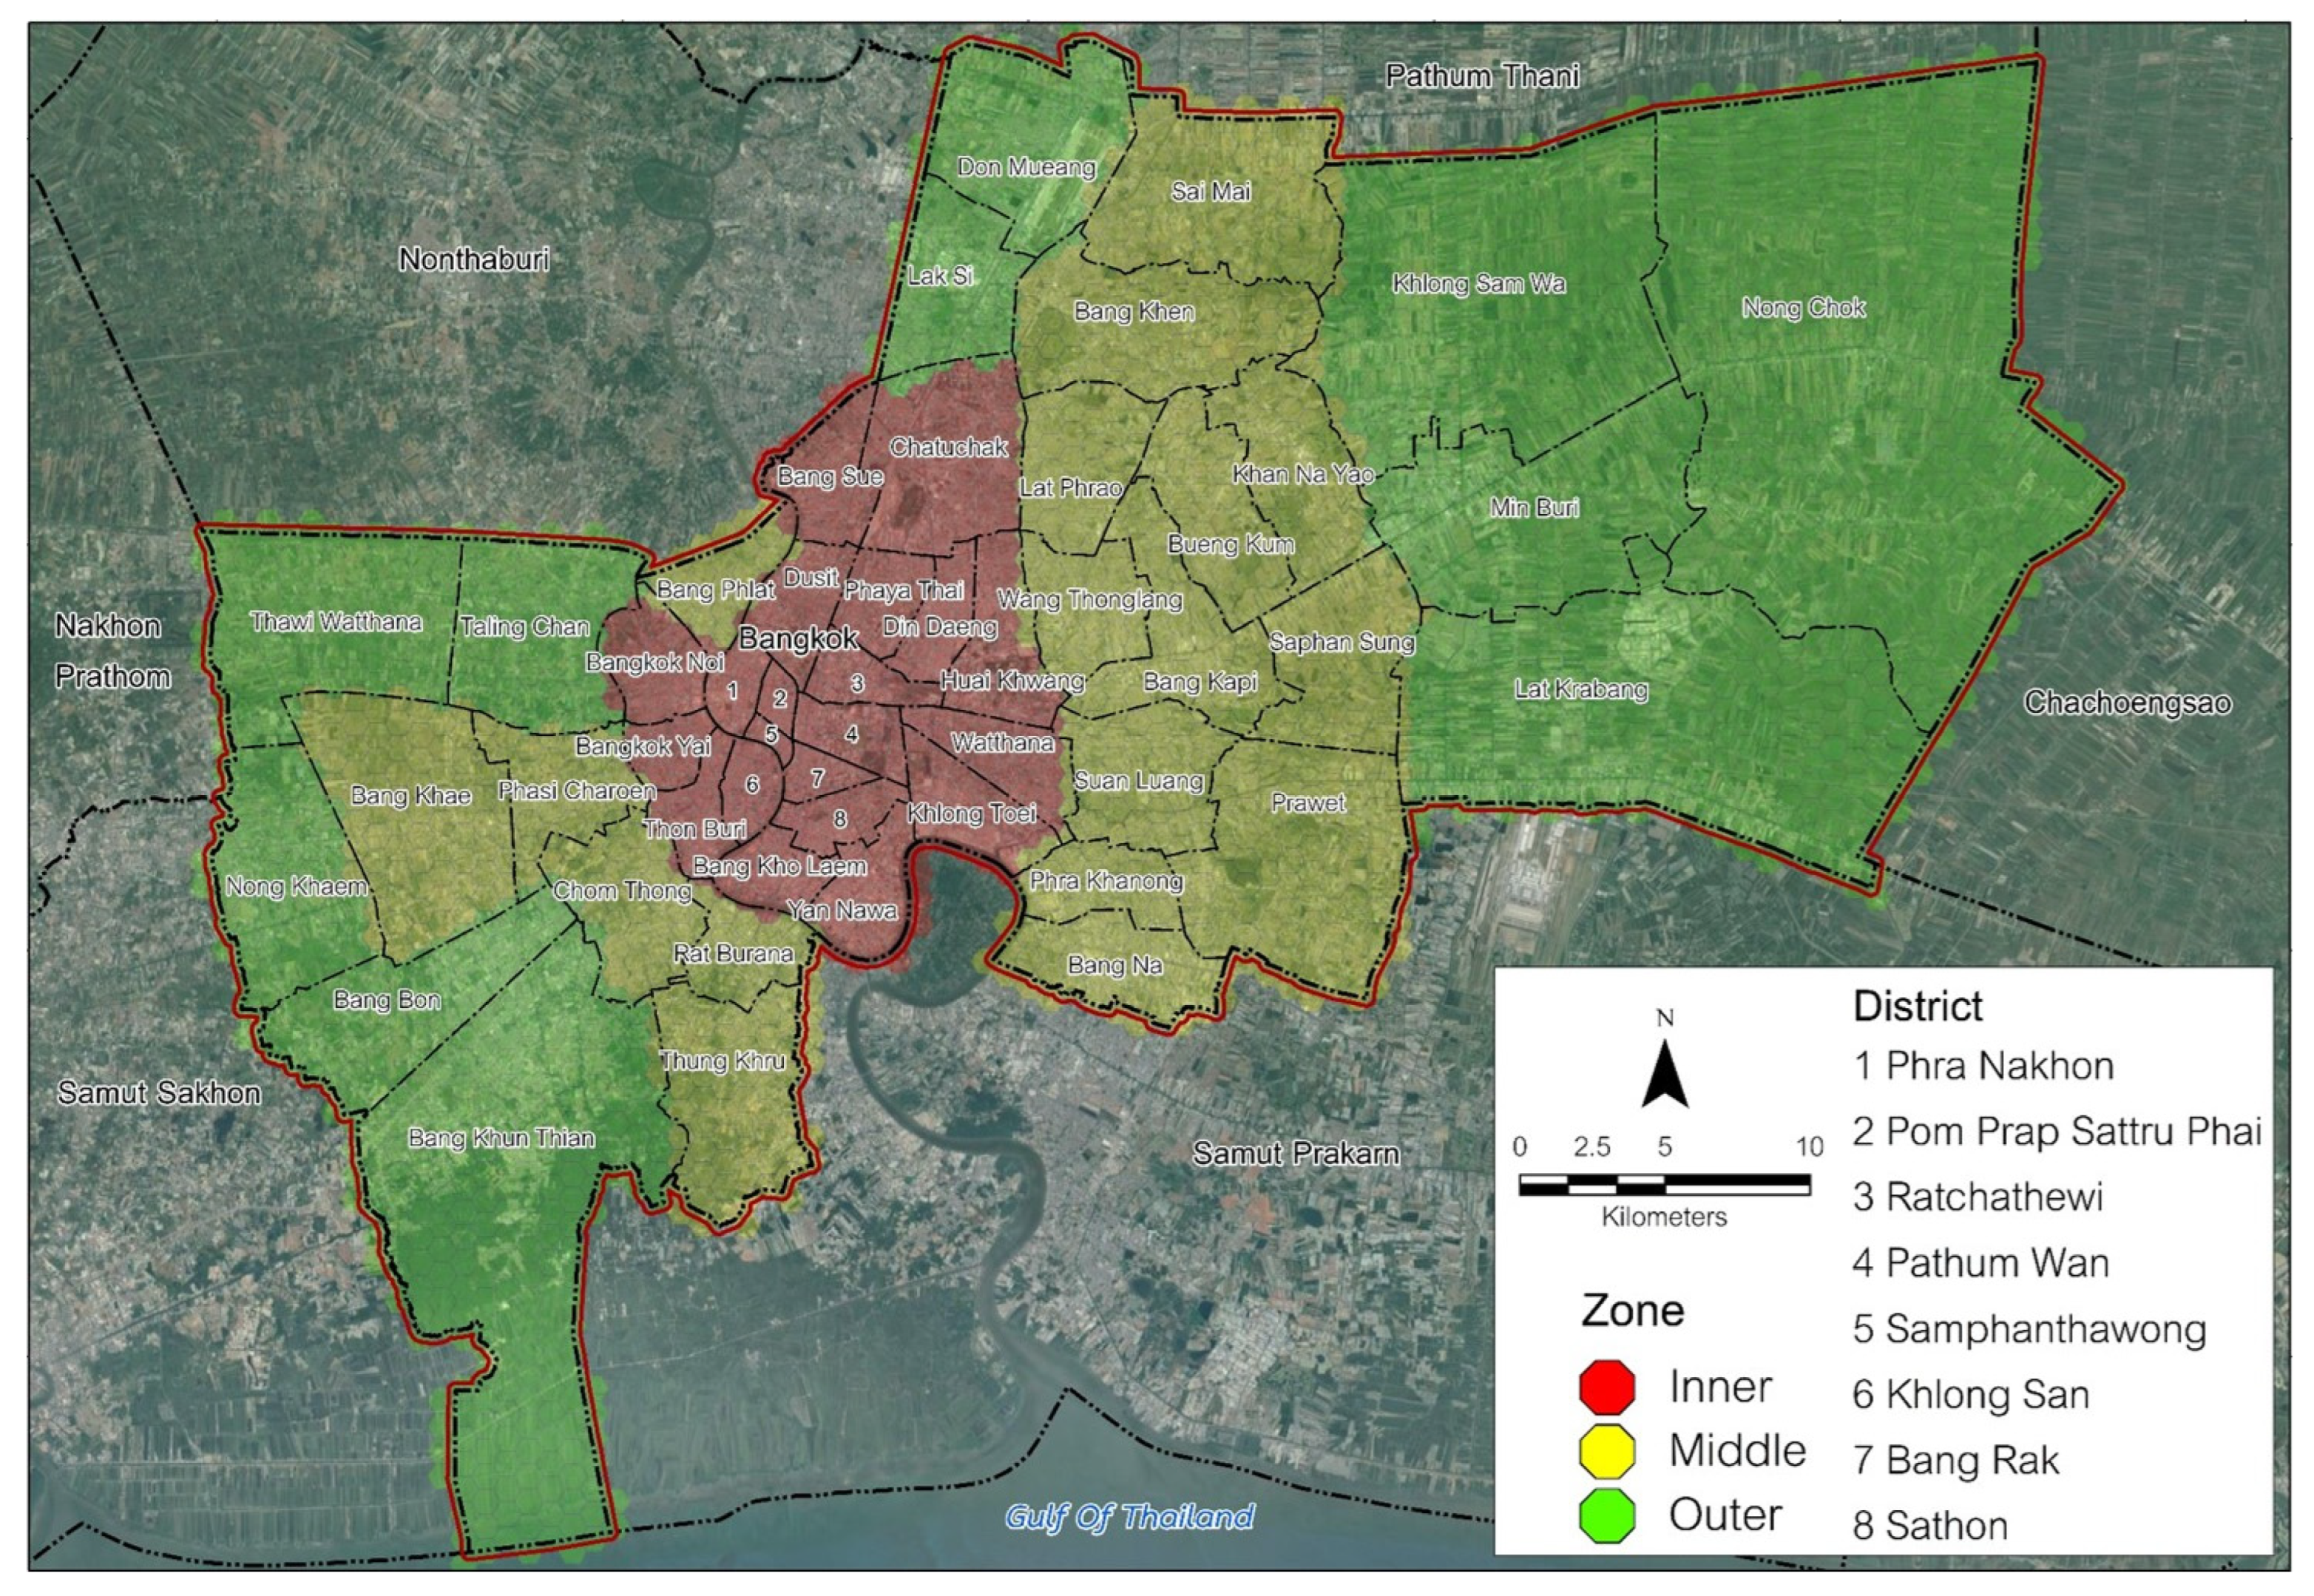
3.1. Study Area
3.2. Datasets
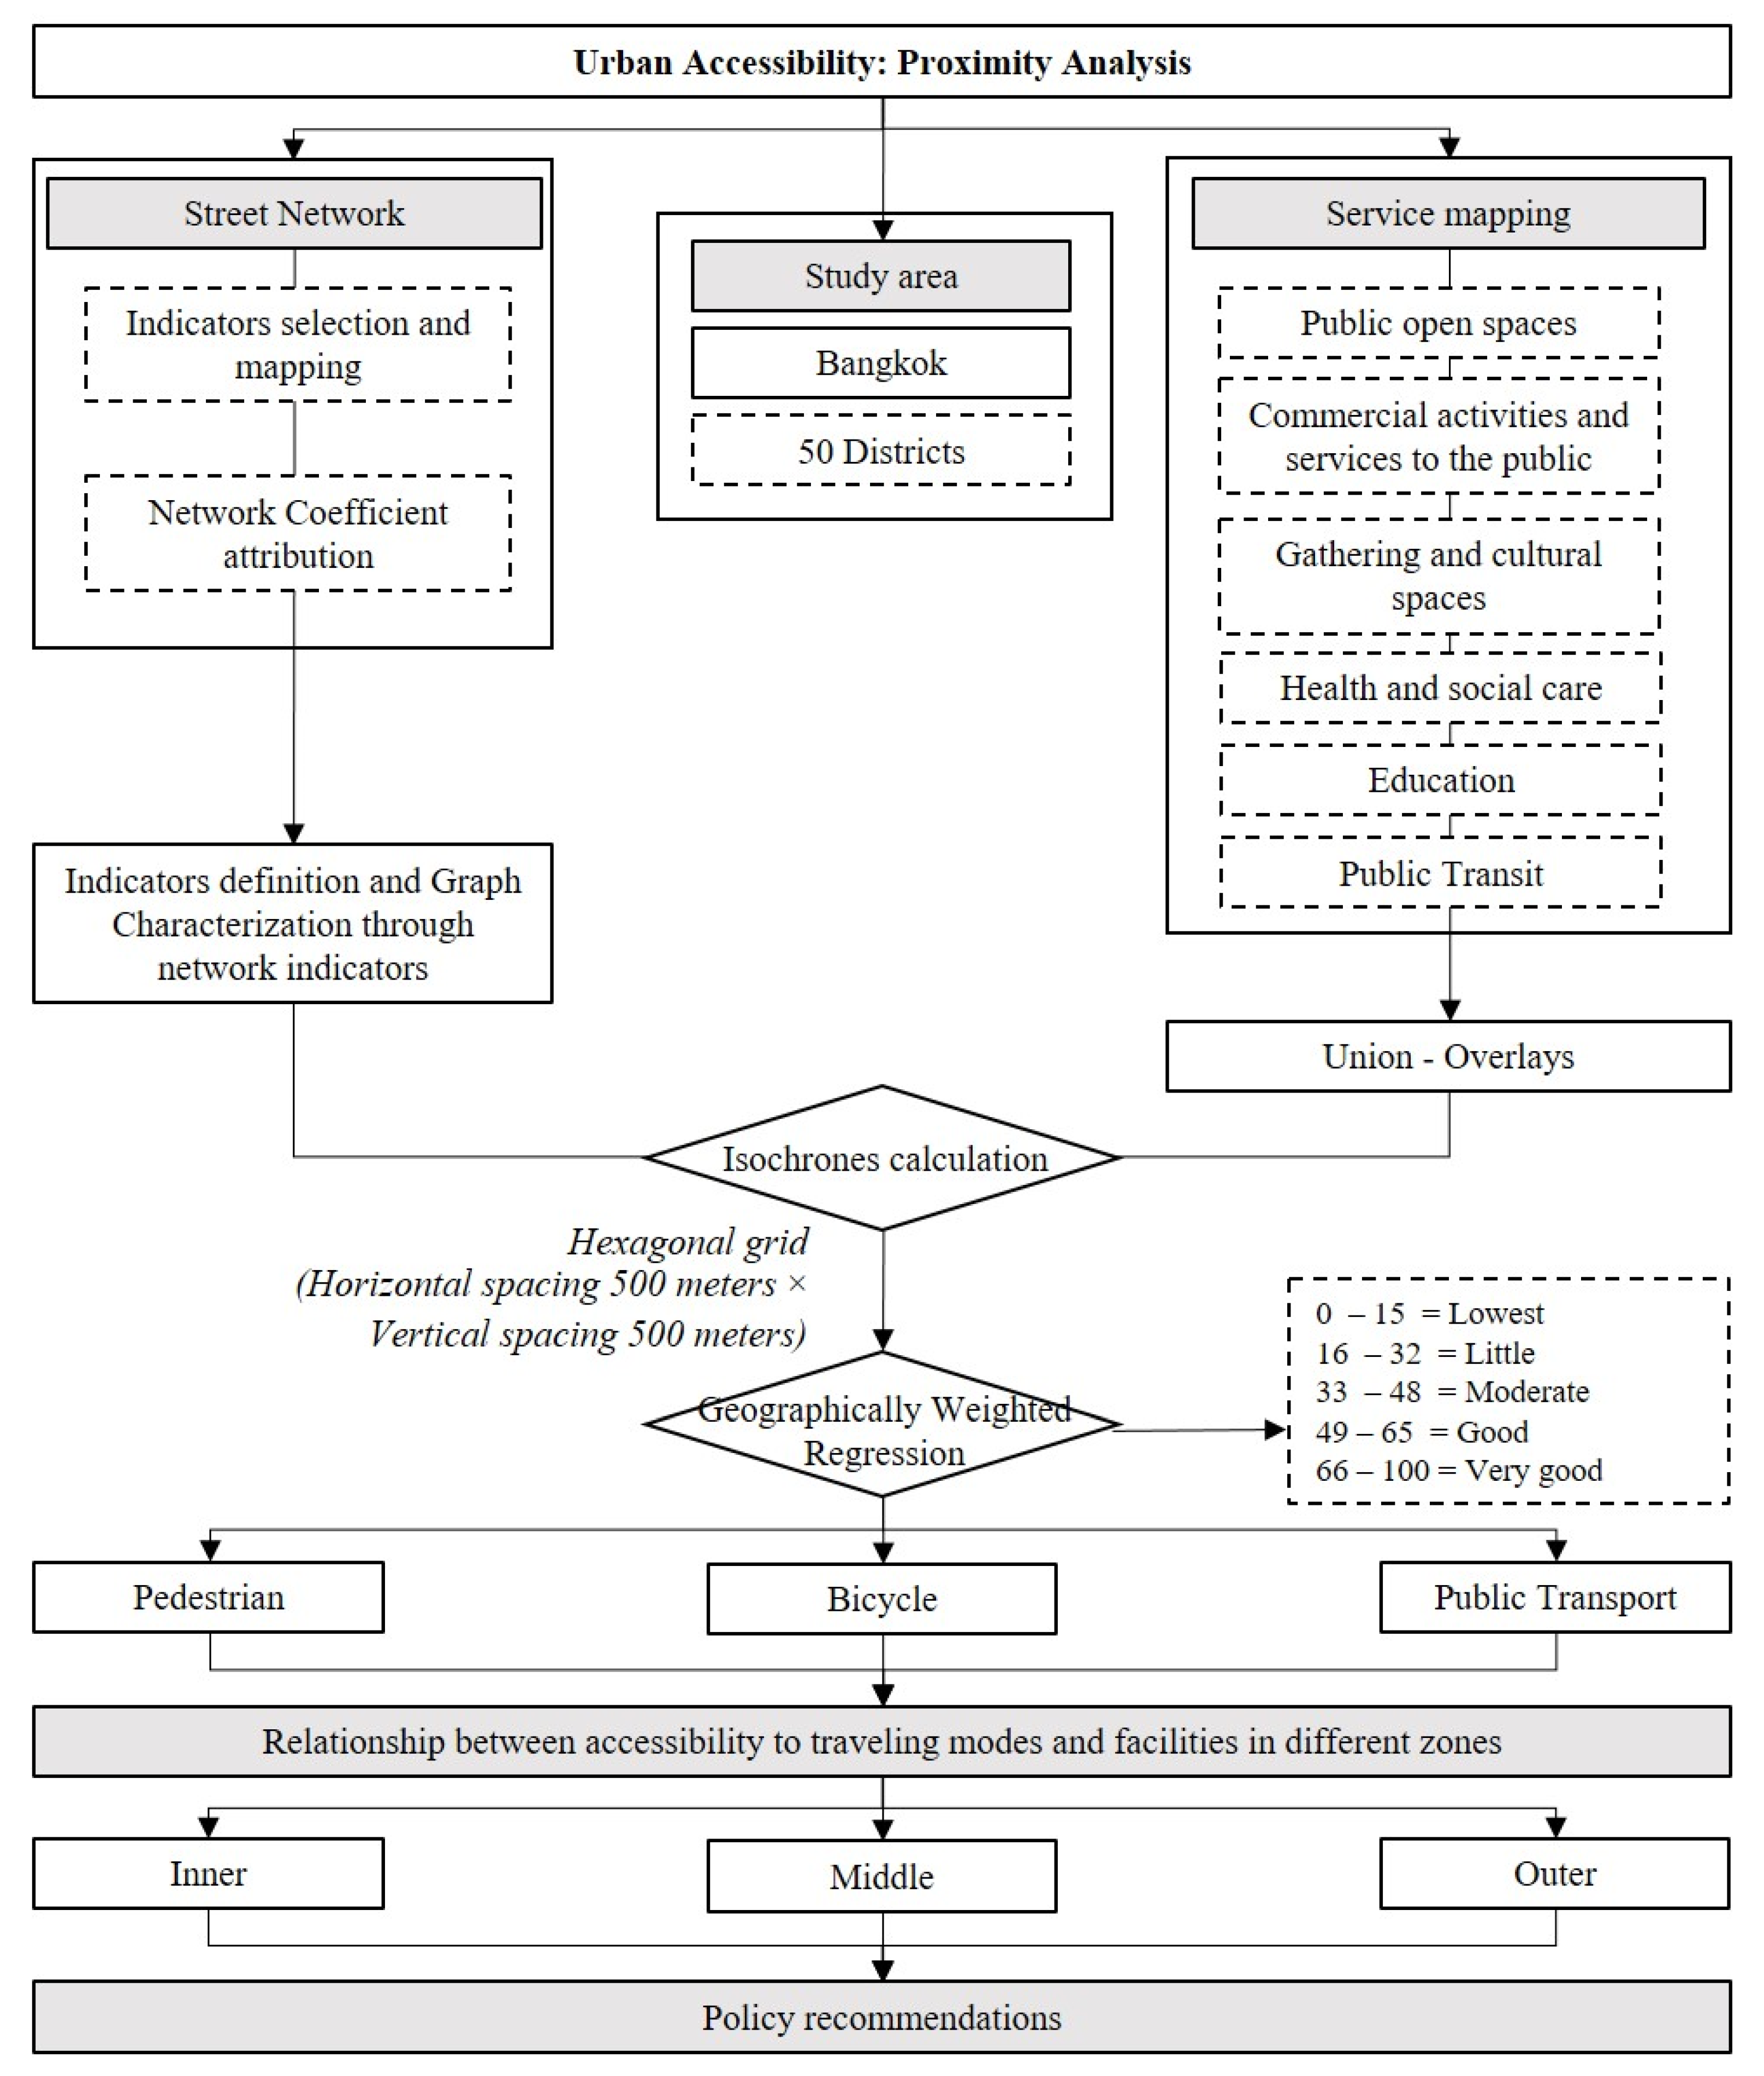
3.3. Process and Data Analysis
- 1.
- In the first step, accessibility measures must be created for each activity. Equation (2) presents a modified gravity measure that combines two parameters. The first parameter is the spatial component (named SEij), and the second parameter is the travel element (named TrEij) (Equation (2)). To determine the proposed spatial composition of each activity (SEij), this equation incorporates the effect of the factor expressing the importance of activity j (ωij) across all i, weighted by the individual activity space [41].
- SEij: spatial element per daily activity j;
- Actspacei: factor of individual activity space i;
- ωij: factor of importance per activity j for the individual i.
- Equation (3) represents the proposed function of the “Travel Element” per daily activity j. The travel element (TrEij) is a function that encompasses the travel cost. The negative exponential function is commonly utilized to model travel behavior. In this case, the Gaussian type is chosen as the function for the TrEij, as it effectively accounts for the abrupt changes in accessibility levels as an individual moves away from the city center [42]. In Figure 2, travel patterns are divided into three modes based on travel inputs identified in the study area. This includes the format of Non-Motorized Transport (NMT), commonly freely and actively utilized in the study area for sustainable and environmentally friendly transportation. Hence, travel modes are categorized into walking, bicycling, and public transport, as illustrated in Figure 2.
- 2.
- In the second step, integrated accessibility measures must be created for all individual activities on a daily basis. The final form of the proposed composite “accessibility” measure (ACCi) serves as a synthesis of various daily activities. These measures, both fixed and flexible, are exponentially weighted by the temporal component factor (TEij). The suggested temporal component is incorporated into the final measure to reflect participation in each activity on that day. For further analysis, an individual’s engagement in each activity is defined by the total daily hours (hij) spent by person i in activity j. Thus, the temporal component (TEij) is defined according to Equation (4) [5]:
- hij is the total individual daily hours for every activity j;
- maxj hij is the maximum time attendance of the total individual activities j.
- Specifically, the proposed composite individual accessibility measure (ACCi) is determined according to the equation below (Equation (5)) [43]:
4. Results
5. Discussion
6. Conclusions
Author Contributions
Funding
Institutional Review Board Statement
Informed Consent Statement
Data Availability Statement
Acknowledgments
Conflicts of Interest
References
- National Oceanic and Atmospheric Administration. Version 4 DMSP-OLS Nighttime Lights Time Series [Database]. 2019. Available online: https://www.ngdc.noaa.gov/eog/dmsp/downloadV4composites.html (accessed on 30 October 2023).
- INRIX. Global Traffic Scorecard. 2022. Available online: https://inrix.com/scorecard/ (accessed on 30 October 2023).
- Yan, X.-Y.; Wang, W.-X.; Gao, Z.-Y.; Lai, Y.-C. Universal model of individual and population mobility on diverse spatial scales. Nat. Commun. 2017, 8, 1639. [Google Scholar] [CrossRef] [PubMed]
- United Nations, Department of Economic and Social Affairs, Population Division. World Urbanization Prospects: The 2022 Revision (ST/ESA/SER.A/420); United Nations: New York, NY, USA, 2023; Available online: https://population.un.org/wup/ (accessed on 30 October 2023).
- Cai, J.; Huang, C.; Deng, Z.; Li, L. Transport accessibility and poverty alleviation in Guizhou Province of China: Spatiotemporal pattern and impact analysis. Sustainability 2023, 15, 3143. [Google Scholar] [CrossRef]
- Santos, T.; Ramalhete, F.; Julião, R.P.; Soares, N.P. Sustainable living neighbourhoods: Measuring public space quality and walking environment in Lisbon. Geogr. Sustain. 2022, 3, 289–298. [Google Scholar] [CrossRef]
- Marquet, O.; Miralles-Guasch, C. The Walkable city and the importance of the proximity environments for Barcelona’s everyday mobility. Cities 2015, 42, 258–266. [Google Scholar] [CrossRef]
- Capasso da Silva, D.; King, D.A.; Lemar, S. Accessibility in practice: 20-minute city as a sustainability planning goal. Sustainability 2020, 12, 129. [Google Scholar] [CrossRef]
- Delclòs-Alió, X.; Miralles-Guasch, C. Looking at Barcelona through Jane Jacobs’s eyes: Mapping the basic conditions for urban vitality in a Mediterranean conurbation. Land Use Policy 2018, 75, 505–517. [Google Scholar] [CrossRef]
- Abdelfattah, L.; Boni, G.; Carnevalini, G.; Choubassi, R.; Gorrini, A.; Messa, F.; Presicce, D. A user-centric approach to the 15-minute city. Examining children’s walkability in Bologna. In Proceedings of the 57th ISOCARP World Planning Congress (ISOCARP 2021), Doha, Qatar, 8–11 November 2021; pp. 582–591. [Google Scholar]
- Iamtrakul, P.; Chayphong, S. Exploring Spatial Accessibility to Urban Activities Based on the Transit-Oriented Development Concept in Pathum Thani, Thailand. Sustainability 2024, 16, 2195. [Google Scholar] [CrossRef]
- Ferreira, A.; Batey, P. Re-Thinking Accessibility Planning: A Multi-Layer Conceptual Framework and Its Policy Implications. Town Plan. Rev. 2007, 78, 429–458. [Google Scholar] [CrossRef]
- Appleyard, B. New methods to measure the built environment for human-scale travel research: Individual access corridor (IAC) analytics to better understand sustainable active travel choices. J. Transp. Land Use 2015, 9, 121–145. [Google Scholar] [CrossRef][Green Version]
- Arellana, J.; Saltarín, M.; Larranaga, A.M.; Gonzalez, V.B.; Henao, C.A. Developing an urban bikeability index for different types of cyclists as a tool to prioritise bicycle infrastructure investments. Transp. Res. A Policy Pract. 2020, 139, 310–334. [Google Scholar] [CrossRef]
- Caiello, S.; Bottini, L. Walkability and soft mobility propensity: A research on two Italian urban neighbourhoods. Appl. Mobilities 2022, 7, 107–123. [Google Scholar] [CrossRef]
- Campisi, T.; Ignaccolo, M.; Inturri, G.; Tesoriere, G.; Torrisi, V. Evaluation of walkability and mobility requirements of visually impaired people in urban spaces. Res. Transp. Bus. Manag. 2021, 40, 100592. [Google Scholar] [CrossRef]
- Clifton, K.J.; Livi Smith, A.D.; Rodriguez, D. The development and testing of an audit for the pedestrian environment. Landsc. Urban Plan. 2007, 80, 95–110. [Google Scholar] [CrossRef]
- Currie, G.; Delbosc, A. Modelling the social and psychological impacts of transport disadvantage. Transportation 2010, 37, 953–966. [Google Scholar] [CrossRef]
- Ferreira, A.; Bertolini, L.; Næss, P. Immobility as resilience A key consideration for transport policy and research. Appl. Mobilities 2017, 2, 16–31. [Google Scholar] [CrossRef]
- Gaglione, F.; Gargiulo, C.; Zucaro, F. Where can the elderly walk A spatial multi-criteria method to increase urban pedestrian accessibility. Cities 2022, 127, 103724. [Google Scholar] [CrossRef]
- Kenyon, A.P.; Pearce, J. The socio-spatial distribution of walkable environments in urban Scotland: A case study from Glasgow and Edinburgh. SSM Popul. Health 2019, 9, 10046. [Google Scholar] [CrossRef] [PubMed]
- Yang, X.; Niu, F.; Sun, D. Evaluation of Urban Spatial Equality Based on Accessibility to Economic Activities: Beijing as a Case Study. Complexity 2020, 2020, 4560146. [Google Scholar] [CrossRef]
- Mitropoulos, L.; Karolemeas, C.; Tsigdinos, S.; Vassi, A.; Bakogiannis, E. A composite index for assessing accessibility in urban areas: A case study in Central Athens, Greece. J. Transp. Geogr. 2023, 108, 103566. [Google Scholar] [CrossRef]
- Hansen, W.G. How Accessibility Shapes Land Use. J. Am. Inst. Plan. 1959, 25, 73–76. [Google Scholar] [CrossRef]
- Geurs, K.T.; van Wee, B. Accessibility evaluation of land-use and transport strategies: Review and research directions. J. Transp. Geogr. 2004, 12, 127–140. [Google Scholar] [CrossRef]
- Kittelson & Associates, Inc. Transit Capacity and Quality of Service Manual, 2nd ed.; TCRP Project 100; TRB, National Research Council: Washington, DC, USA, 2003; Available online: https://onlinepubs.trb.org/onlinepubs/tcrp/docs/tcrp100/Part3.pdf (accessed on 30 October 2023).
- Yang, L.; Zhang, B.; Zhang, X.; Zhang, S.; Yin, L. Exploring the spatial correlation between accessibility to urban vibrancy centers and housing price from a time-dynamic perspective. GIScience Remote Sens. 2023, 60, 2232191. [Google Scholar] [CrossRef]
- Polzin, S.E.; Pendyala, R.M.; Navari, S. Development of time-of-day-based transit accessibility analysis tool. Transp. Res. Rec. J. Transp. Res. Board 2002, 1799, 35–41. [Google Scholar] [CrossRef]
- Ryus, P.; Ausman, J.; Teaf, D. Development of Florida’s transit level-of-service indicator. Transp. Res. Rec. J. Transp. Res. Board 2000, 1731, 123–129. [Google Scholar] [CrossRef]
- Transport for London. Assessing Public Transport Accessibility Level in London (PTAL). 2020. Available online: http://content.tfl.gov.uk/connectivity-assessment-guide.pdf (accessed on 2 February 2024).
- Su, R.; Goulias, K. Untangling the relationships among residential environment, destination choice, and daily walk accessibility. J. Transp. Geogr. 2023, 109, 103595. [Google Scholar] [CrossRef]
- Bernardi, S.; La Paix-Puello, L.; Geurs, K. Modelling route choice of Dutch cyclists using smartphone data. J. Transp. Land Use 2018, 11, 883–900. [Google Scholar] [CrossRef]
- Boulange, C.; Gunn, L.; Giles-Corti, B.; Mavoa, S.; Pettit, C.; Badland, H. Examining associations between urban design attributes and transport mode choice for walking, cycling, public transport and private motor vehicle trips. J. Transp. Health 2017, 6, 155–166. [Google Scholar] [CrossRef]
- Ferrer-Ortiz, C.; Marquet, O.; Mojica, L.; Vich, G. Barcelona under the 15-minute city lens: Mapping the accessibility and proximity potential based on pedestrian travel times. Smart Cities 2022, 5, 146–161. [Google Scholar] [CrossRef]
- Gao, J.; Kamphuis, C.B.M.; Helbich, M.; Ettema, D. What is ‘neighborhood walkability’? How the built environment differently correlates with walking for different purposes and with walking on weekdays and weekends. J. Transp. Geogr. 2020, 88, 102860. [Google Scholar] [CrossRef]
- Vale, D.S.; Saraiva, M.; Pereira, M. Active accessibility: A review of operational measures of walking and cycling accessibility. J. Transp. Land Use 2016, 9, 209–235. [Google Scholar] [CrossRef]
- Wang, F.; Wang, K. Measuring spatial accessibility to ecological recreation spaces in the Pearl River delta region: An improved two-step floating catchment area method. J. Spat. Sci. 2018, 63, 279–295. [Google Scholar] [CrossRef]
- EI-Ashmawy, K. Testing the positional accuracy of OpenStreetMap data for mapping applications. Geod. Cartogr. 2016, 42, 25–30. [Google Scholar] [CrossRef]
- Zheng, S.; Zheng, J. Assessing the Completeness and Positional Accuracy of OpenStreetMap in China. In Thematic Cartography for the Society; Bandrova, T., Konecny, M., Zlatanova, S., Eds.; Lecture Notes in Geoinformation and Cartography; Springer: Cham, Switzerland, 2014. [Google Scholar] [CrossRef]
- Wang, J.; Kwan, M.-P.; Cao, W.; Gong, Y.; Guo, L.; Liu, Y. Assessing changes in job accessibility and commuting time under bike-sharing scenarios. Transp. A Transp. 2022, 20, 36. [Google Scholar] [CrossRef]
- Guo, C.; Zhou, W.; Jing, C.; Zhaxi, D. Mapping and measuring urban-rural inequalities in accessibility to social infrastructures. Geogr. Sustain. 2024, 5, 41–51. [Google Scholar] [CrossRef]
- Xie, S.; Liu, S.; Li, Q. Availability of Infrastructure and Rural Poverty Reduction: Empirical Analysis from Micro data in China. Chin. Rural Econ. 2018, 5, 112–131. [Google Scholar]
- Basu, T.; Das, A.; Pereira, P. Exploring the drivers of urban expansion in a medium-class urban agglomeration in India using the remote sensing techniques and geographically weighted models. Geogr. Sustain. 2023, 4, 150–160. [Google Scholar] [CrossRef]


| Services | Use | Source |
|---|---|---|
| Categories: Living, Working, Commerce, Healthcare, Education, Entertainment | Definition | [32] |
| Services: Education (school or training institution), medical care (hospital or pharmacy), municipal administration (public transport, park and square, sports venue, cultural venue), finance and telecommunication (finance and post office), commercial service (restaurant, shopping, entertainment venue), elderly care (nursing home or elderly education) | Measuring walkable neighborhoods | [33] |
| Categories: Work, Basic Healthcare, Cultural and Recreational Opportunities | Assessing/evaluating transportation plans | [34] |
| Land-use types: Industrial, offices, commercial, sports, show business, leisure and hospitality, health, cultural, religious | Measuring walkability | [35] |
| Services: Schools (preschool, primary school, secondary school, technical college, high school), hospitals (general hospital, addiction services and psychiatric hospitals, other hospitals), other (supermarkets and employment centers) | Assessing urban accessibility (walking and cycling) | [36] |
| Categories: Education, Entertainment, Finance, Food, Government, Health, Professional, Recreation, Religion, Retail, Public Transport | Measuring 15 min accessibility (walking) | [37] |
| Category | Service | Description |
|---|---|---|
| Public open spaces | Public parks | City-level public park area, green spaces (sq.km.) |
| Playgrounds | Number of playgrounds includes playgrounds in schools and in the communities | |
| Commercial activities and services to the public | Convenience Store | Number of shops, excluding grocery stores, fresh produce, delis, and bakeries |
| Department Store | Number of department store | |
| Restaurants | Number of bars and restaurants | |
| Markets | Number of markets, street markets, night market | |
| Café | Number of cafés, coffee shops, dessert shops, and bakeries | |
| Hotels/Accommodations | Number of hotels, including condos and rental apartments | |
| Entertainment and Sport | Entertainment | Number of theaters and cinemas, museums, community centers, nightclubs |
| Sport fields | Number of sports centers, gyms, pools, sports fields | |
| Health and social care | Health care | Number of pharmacies, clinics, and hospital |
| Education | Libraries | Number of libraries, including community libraries |
| Educations | Number of schools, high schools, or higher education centers | |
| Public Transit | Bus stop | Number of bus stops, including in the private sector and the government sector |
| Bus network | Route of bus service (polyline overlay hexagonal grid) | |
| Pedestrians | Route of pedestrian networks (polyline overlay hexagonal grid) | |
| Bikeway | Route of bicycle network (polyline overlay hexagonal grid) | |
| Parking | Number of parking locations, including in the private and government sectors | |
| Piers | Number of piers, including in the private and government sectors |
| Public Open Spaces | |
|---|---|
 |  |
| a. Public park | b. Playgrounds |
| Commercial activities and services to the public | |
 |  |
| c. Department Store | d. Restaurant |
 |  |
| e. Convenience Store | f. Market |
 |  |
| g. Cafe | h. Hotel |
| Entertainment and Sport | |
 |  |
| i. Entertainment | j. Sport field |
| Health and social care | |
 | |
| k. Health Care | |
| Education | |
 |  |
| l. Education | m. Library |
| Public Transit | |
 |  |
| n. Bus stop | o. Bus network |
 |  |
| p. Pedestrian network | q. Bikeway |
 |  |
| r. Parking | s. Piers |
| Variables | Pedestrian | Bicycle | Public Transport | |||||||||
|---|---|---|---|---|---|---|---|---|---|---|---|---|
| Std. Error | Sig. | Avg. | Std. Error | Sig. | Avg. | Std. Error | Sig. | Avg. | ||||
| Public open spaces | 0.096 | 0.048 | 0.05 | 0.29 | 0.102 | 0.031 | 0.05 | 0.29 | 0.204 | 0.041 | 0.05 | 0.29 |
| Commercial activities and services to the public | 0.083 | 0.042 | 0.01 | 12.63 | 0.306 | 0.138 | 0.01 | 12.63 | 0.326 | 0.068 | 0.01 | 12.63 |
| Entertainment and sport | 0.075 | 0.036 | 0.05 | 2.34 | 0.201 | 0.044 | 0.05 | 2.34 | 0.226 | 0.035 | 0.05 | 2.34 |
| Health and social care | 0.103 | 0.062 | 0.05 | 15.64 | 0.322 | 0.046 | 0.05 | 15.64 | 0.368 | 0.062 | 0.05 | 15.64 |
| Education | 0.098 | 0.048 | 0.01 | 3.09 | 0.341 | 0.162 | 0.01 | 3.09 | 0.384 | 0.166 | 0.01 | 3.09 |
| Public Transit | 0.201 | 0.074 | 0.01 | 2.81 | 0.494 | 0.184 | 0.01 | 2.81 | 0.502 | 0.172 | 0.01 | 2.81 |
| Factor | t | df | Avg. | Sig. (2-Tailed) | Mean Difference | 95% Confidence Interval of the Difference | |
|---|---|---|---|---|---|---|---|
| Lower | Upper | ||||||
| Public open spaces | 32.908 | 2615 | 0.29 | 0.000 | 0.293 | 0.28 | 0.31 |
| Commercial activities | 22.431 | 2615 | 12.63 | 0.000 | 12.635 | 11.53 | 13.74 |
| Entertainment | 21.020 | 2615 | 2.34 | 0.000 | 2.337 | 2.12 | 2.55 |
| Health | 23.737 | 2615 | 2.26 | 0.000 | 2.259 | 2.07 | 2.45 |
| Education | 22.591 | 2615 | 3.09 | 0.000 | 3.091 | 2.82 | 3.36 |
| Public transit | 34.775 | 2615 | 2.81 | 0.000 | 2.808 | 2.65 | 2.97 |
| Modes | Pedestrian | Bicycle | Public Transport |
|---|---|---|---|
| Public open spaces |  |  |  |
| Commercial activities and servicesto the public |  |  |  |
| Entertainment and Sport |  |  |  |
| Health and social care |  |  |  |
| Education |  |  |  |
| Public Transit |  |  |  |
Disclaimer/Publisher’s Note: The statements, opinions and data contained in all publications are solely those of the individual author(s) and contributor(s) and not of MDPI and/or the editor(s). MDPI and/or the editor(s) disclaim responsibility for any injury to people or property resulting from any ideas, methods, instructions or products referred to in the content. |
© 2024 by the authors. Licensee MDPI, Basel, Switzerland. This article is an open access article distributed under the terms and conditions of the Creative Commons Attribution (CC BY) license (https://creativecommons.org/licenses/by/4.0/).
Share and Cite
Iamtrakul, P.; Padon, A.; Chayphong, S.; Hayashi, Y. Unlocking Urban Accessibility: Proximity Analysis in Bangkok, Thailand’s Mega City. Sustainability 2024, 16, 3137. https://doi.org/10.3390/su16083137
Iamtrakul P, Padon A, Chayphong S, Hayashi Y. Unlocking Urban Accessibility: Proximity Analysis in Bangkok, Thailand’s Mega City. Sustainability. 2024; 16(8):3137. https://doi.org/10.3390/su16083137
Chicago/Turabian StyleIamtrakul, Pawinee, Apinya Padon, Sararad Chayphong, and Yoshitsugu Hayashi. 2024. "Unlocking Urban Accessibility: Proximity Analysis in Bangkok, Thailand’s Mega City" Sustainability 16, no. 8: 3137. https://doi.org/10.3390/su16083137
APA StyleIamtrakul, P., Padon, A., Chayphong, S., & Hayashi, Y. (2024). Unlocking Urban Accessibility: Proximity Analysis in Bangkok, Thailand’s Mega City. Sustainability, 16(8), 3137. https://doi.org/10.3390/su16083137