Abstract
This research aims to examine the performance indicators that are crucial for assessing the implementation of environmental management plans (EMPs) in water projects. To achieve this aim, a questionnaire survey, integrating a systematic literature review (SLR), was used to identify the initial performance indicators. Subsequently, ten interviews with environmental professionals were carried out to uncover additional indicators not identified by the SLR. Following the survey design and pilot study of the survey, the data collection resulted in 112 valid responses from environmental professionals engaged in water projects in Saudi Arabia. The data analysis encompassed reliability tests, mean ranking, normalized mean analysis, exploratory factor analysis (EFA), and partial least squares structural equation modeling (PLS-SEM). The normalized mean analysis highlighted 13 critical parameters among 39 for further investigation. The EFA disclosed three underlying constructs: environmental impact indicators, operational and safety indicators, waste management, and public safety indicators. PLS-SEM was used to validate the relationship between these indicators and the successful implementation of EMPs. The results indicate that all three underlying constructs positively influence the effective execution of such plans. This is the first study to model the relationships of the performance indicators in water projects. The study’s findings underscore the importance of developing precise performance indicators tailored to diverse construction projects that are mainly focused on water facility construction. The identified performance indicators offer significant insights for policymakers, practitioners, and researchers and provide a solid foundation for the advancement of knowledge in the field of environmental management.
1. Introduction
Environmental management is of paramount importance when addressing the myriad challenges and concerns that are present in developing countries [1]. These challenges encompass diverse facets, such as the urgent need for pollution removal technology, energy conservation, and rigorous environmental impact assessment. The intricate nature of environmental plans, influenced by factors like human life, property, safety, and ecology, adds a layer of complexity that demands careful consideration [2]. Recognizing the significance of risk assessment and management in environmental planning is crucial. Moreover, the integration of social and physical dimensions in environmental management through policy planning, which underlines the need for a holistic approach, is one of the main issues that management currently faces [3,4,5]. The environmental management plan underscores the importance of establishing a centralized system for managing environmental data and facilitating streamlined processes [6]. A humane and participatory approach is needed for environmental management, one which emphasizes the importance of setting feasible targets and implementing practical strategies [7,8]. An ecological perspective on environmental management planning emphasizes the importance of considering regional factors and adopting process-oriented strategies. This holistic approach provides a more comprehensive and context-specific understanding [9]. Furthermore, a critical consideration across different contexts involves finding a balance between fostering economic growth and ensuring environmental protection, especially amid rapid industrial development [8].
Environmental management is facing a range of issues, including the need for advanced pollution removal technologies, energy conservation, and rigorous environmental impact assessments, which pose significant hurdles [1]. Organizations struggle with understanding and complying with intricate environmental regulations, implementing practical solutions to reduce environmental impacts, engaging leadership and employees in environmental practices, and maintaining process efficiency while incorporating environmental management practices [10]. In parallel, the global oil market’s increasing focus on enhancing oil recovery requires the addition of chemical components, such as surfactants, alkalis, and polymers, to oil reservoirs. These additions alter interface structures and impact fluid flow characteristics and phase interactions, influencing production efficiency and energy consumption throughout the oil recovery, gathering, processing, and transportation processes [11]. The environmental plans are complex, and there are many factors to consider, such as human life, property, safety, and ecology [2]. Emphasizing the importance of risk assessment and management in environmental planning and promoting the integration of social and physical dimensions through policy planning are essential considerations. These challenges highlight the need for comprehensive and adaptive environmental management strategies to effectively address the multifaceted issues that are faced on a global scale [12].
Comprehensive environmental management plans offer an array of benefits to organizations. Improved environmental performance, compliance with legislation, and cost savings are among the tangible advantages. Furthermore, they can lead to increased profits, provide access to new markets, and enhance the capability to secure grants [13]. The intangible benefits are equally significant, as environmental management plans contribute to a company’s positive image, showcase a commitment to clients’ well-being, and promote the efficient use of resources. Finally, they provide a structured format for measuring, managing, and auditing environmental processes, ensuring a systematic and accountable approach to sustainability goals. In summary, the importance of environmental management is underscored by the array of benefits it offers to organizations; it mitigates challenges while fostering sustainable practices and responsible corporate citizenship.
Despite the importance of having an environmental management plan, it has still not been fully implemented, especially in water projects. There has not yet been a study that examines the performance indicators that are crucial for assessing the implementation of environmental management plans in water projects. To fill this gap, this research aims to examine the performance indicators that are crucial for assessing the implementation of environmental management plans in water projects; this examination has the potential to offer valuable insights and advancements in the field. To achieve this aim, the research flow starts with a literature review to find previous works and to identify the research gap; this is followed by the research methodology, which consists of survey development, data collection, and data analysis. Then, the results are presented, followed by a discussion. Lastly, the research implications and conclusions are presented. Figure 1 below shows the conceptual framework of the study.
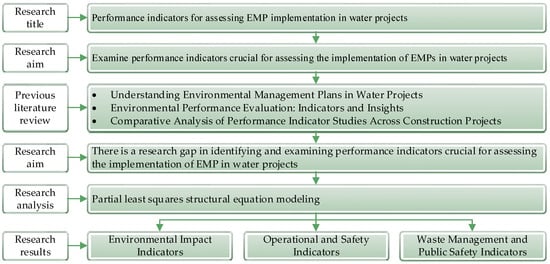
Figure 1.
Conceptual framework.
2. Literature Review
2.1. Understanding Environmental Management Plans in Water Projects
The existing body of literature reveals diverse perspectives on the implementation of environmental management plans (EMPs) in water projects. Researchers have explored the integration of environmental management systems (EMS) under the International Organization for Standardization (ISO14000) as a decision support tool [14], emphasizing its applicability in managing water environmental treatment projects [15]. The identification of construction types and environmental impact factors and the establishment of control schemes to prevent contamination have emerged as crucial components [15]. Furthermore, the studies have underscored the importance of creating environmental action plans (EAPs) tailored to water projects that succinctly summarize the constraints, adverse effects, mitigation measures, and monitoring requirements [16]. The historical awareness of the environmental consequences in irrigation and water works has prompted a call for the integration of environmental aspects into the planning process, with an emphasis on processes such as identification, implementation, monitoring, and performance measurement for successful environmental management [17,18]. The case studies on hydropower projects further demonstrate the successful integration of legal requirements and cooperative relationships among project participants; this integration allows alignment with the effective implementation of EMPs in water projects [19]. The challenges faced by water development projects, including delays and cancellations due to environmental impacts, have prompted the proposal of principles to integrate environmental considerations into decision-making processes [20], offering valuable insights for robust EMPs. The comprehensive analysis of future trends and directions in water management contributes to the shaping of EMPs that prioritize long-term sustainability and positive impacts [21]. The recommendations considering environmental flows in water projects align with the broader goal of ensuring sustainable infrastructure development through well-structured EMPs [22]. Finally, initiatives to anticipate and mitigate negative environmental impacts in hydropower projects, covering aspects from water quality to cultural relics, emphasize the need for comprehensive EMPs tailored to the specific challenges of water projects [23]. Collectively, this literature underscores the multifaceted approaches and considerations that have been explored in the past to enhance the effectiveness of EMP implementation in water projects.
2.2. Environmental Performance Evaluation: Indicators and Insights
The concept of environmental performance (EP) has been thoroughly scrutinized, with the findings providing a nuanced definition of EP as the culmination of an organization’s efforts to manage environmental aspects in alignment with its policy, objectives, targets, and other performance requirements [24]. The importance of environmental performance indicators emerges prominently, and the literature underscores their increasing significance at the company level [24]. The researchers advocate an integrated framework that not only evaluates performance but also uses advanced tools, like the Eco balance tool, to assess the environmental impact of a company’s products and processes. Simultaneously, the assessment of the current environmental management systems sheds light on the need for comprehensive comments on overall environmental performance and provides insights into the effectiveness of the control exercised by organizations [25]. Environmental performance evaluation, grounded in a life cycle perspective, is highlighted as essential for industrial improvement [26].
The literature emphasizes the role of indicators in conveying the current state of environmental issues and in driving the improvements that are beneficial to both the company and the environment [27]. The studies stress the strategic importance of developing environmental performance indicators for managerial control, strategic advantages, and performance reporting across different company functions. The assessment extends beyond traditional industry settings, with studies evaluating an industrial port and estate, utilizing specific environmental performance indicators to identify deficiencies, and recommending improvements [28]. The literature collectively underscores the increasing interest in environmental performance assessment, detailing historical contexts, diverse approaches, and the pivotal role of indicators as potent tools for both performance evaluation and public information [29]. This body of work contributes significantly to understanding the broader landscape of performance indicators for assessing environmental management plans and their relevance in diverse organizational contexts.
2.3. Comparative Analysis of Performance Indicator Studies across Construction Projects
Table 1 presents previous performance indicator studies across construction projects. In [30], the paper aimed to investigate the performance indicators (PIs) that are crucial for assessing EMP implementation in highway construction projects. The data collection methods involved a systematic review, interviews, and a questionnaire survey, while the data analysis employed mean score ranking, normalization, agreement analysis, factor analysis, and fuzzy synthetic evaluation (FSE). The findings revealed 21 critical PIs that are essential for evaluating EMP implementation in highway construction projects. Then, the next paper [8] focused on examining the PIs for assessing EMP implementation in road construction projects. As with the previous study, it used a systematic review, interviews, and a questionnaire survey for data collection, and it applied analytical methods such as mean score ranking, normalization, agreement analysis, overlap analysis, factor analysis, and fuzzy synthetic evaluation. The outcome of the analysis identified 18 key PIs that are crucial for monitoring EMP execution in road construction projects. The third paper [31] aimed to identify performance indicators for assessing EMPs in road and highway construction projects. It gathered qualitative data from certified environmental assessors and environmental observers from the Department of Environment through interviews and used thematic analysis for data interpretation. The study identified three themes and eight subthemes related to EMP performance indicators in road and highway construction projects. The fourth paper [32] focused on examining PIs for assessing EMP implementation in water supply construction projects. The data collection methods included a systematic review, interviews, and a questionnaire survey, while the data analysis techniques involved mean ranking analysis, the normalization method, principal component analysis (PCA), and FSE. The study identified 18 critical PIs that are essential for evaluating EMP implementation in water supply construction projects. In this study, the focus is on the critical indicators for assessing EMP implementation in water projects. The data collection methods encompassed a systematic review, interviews, and a questionnaire survey, while the data analysis techniques included reliability tests, mean ranking, normalized mean analysis, EFA, and partial least squares structural equation modeling (PLS-SEM).

Table 1.
Comparative analysis of performance indicator studies.
2.4. Research Gap
Despite the extensive exploration of the multifaceted approaches and considerations in EMPs for water projects, there is a research gap related to the identification and examination of the performance indicators that are crucial for assessing the implementation of EMPs. Further research is needed to develop a comprehensive understanding of the indicators that effectively measure the success and impact of EMPs in water projects in order contribute to improved environmental sustainability and management practices. Hence, to cover this gap, this research aims to examine the performance indicators that are crucial for assessing the implementation of EMPs in water projects.
3. Methodology
The methodological procedures for this research are separated into four phases to assist in achieving the research aim. Figure 2 illustrates the methodological procedures of this research.
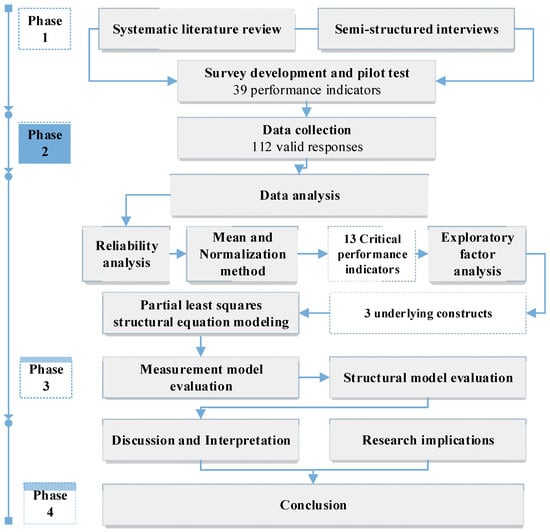
Figure 2.
Methodological procedures for this research.
3.1. Survey Development
This study employed a questionnaire survey to quantitatively assess the implementation of EMPs in water projects across Saudi Arabia. Surveys are a well-established and effective means of gathering a wide range of responses from professionals, especially when random sampling techniques are used [33]. The following sections will delve into the process of developing the survey used in this research.
It is worth noting that although the variables used in the study by Radzi et al. (2024) [32] and those in this study are similar, the analyses conducted are distinct. Despite both studies utilizing the same survey instrument, it is important to note that the analyses were conducted for different research objectives, resulting in variations in the findings and interpretations. The mean ranking table may appear identical because it represents an output of the process rather than direct replication. Moreover, this study is part of a broader research endeavor, contributing to a comprehensive understanding of the topic.
3.1.1. Systematic Literature Review
To identify potential performance indicators, a systematic literature review (SLR) was conducted. The SLR process began with a search for relevant articles in the Scopus database using the “title/abstract/keyword” function. The keywords used were “water” AND “construction” AND “indicator” AND “environment*”. As a result, 129 papers were identified. To ensure the selected literature was eligible for this review, inclusion and exclusion criteria were used. First, the articles were selected from peer-reviewed journals only due to their higher quality, which results from a more thorough peer review process [34]. Second, articles directly related to performance indicators in construction projects were considered. Third, the articles were written in English. After the initial screening of the abstracts, 26 articles were identified as potentially suitable for further review. After a comprehensive examination of their content, 13 articles were found to be valid for further investigation.
3.1.2. Semi-Structured Interview
Semi-structured interviews were conducted with environmental professionals. Non-probabilistic sampling, which is purposive sampling, was employed to select the participants. Ten environmental professionals were involved in the interviews to identify performance indicators that were not reported in the existing literature. This method of combining both SLR data and interview data to comprehensively identify the relevant variables during survey development has been employed in previous works [35]. The interview began with an introduction to the interview’s purpose and topic. The questions were then presented, with follow-up questions used when necessary to clarify responses. The questions were adjusted as needed to ensure accuracy. At the end of each interview, gratitude was expressed to the participants. After each interview, a summary was shared with the respondents for validation. Following Braun and Clarke’s technique, thematic analysis was applied to the interview data to develop a comprehensive list of performance indicators [34].
3.1.3. Survey Design
The performance indicators identified in both the semi-structured interviews and the SLR were combined to create the survey, resulting in a total of 39 indicators (see Table 2). The survey’s first page included the study objectives and contact information. The first part of the survey asked about the backgrounds of the respondents and their experience related to water projects. The Section 2 presented the list of performance indicators identified through the SLR and interviews. The respondents were requested to rank the performance indicators using a five-point Likert scale, with one being not important and five being very important. The Likert scale was chosen for its precision, and it is commonly used in construction management research [36]. Finally, the respondents were provided with space at the end of the survey to add and rank any additional performance indicators that they deemed necessary. It is important to clarify that the performance indicators listed in Table 1 were derived from a combination of sources, including SLRs, semi-structured interviews, and a pilot study. These indicators were not arbitrarily selected by the authors but emerged as outputs of the survey development process. They represent a synthesis of insights gathered from different approaches to ensure comprehensive coverage and relevance to the study objectives.
Table 2.
Performance indicators identified in prior works and semi-structured interviews.
3.1.4. Pilot Test
The feedback obtained from the pilot test is crucial for improving the survey’s quality and estimating completion time [56]. Hence, a pilot test involving ten personnel, from both industry and academia, with over ten years of experience in water projects, was conducted. Following feedback from the participants in the pilot test, adjustments were made to refine the survey, resulting in its finalization.
3.2. Data Collection
The target population for this study involved environmental professionals who had experience in water projects in Saudi Arabia. In this study, purposive sampling was employed. Purposive sampling involves selecting knowledgeable and skilled individuals [57] who are available, willing to participate, and capable of articulating their experiences and opinions clearly, expressively, and reflectively [58]. A total of 112 valid responses were obtained. Table 3 demonstrates that the majority of the respondents possessed ten or more years of experience in water projects. Additionally, 72.3% of the respondents reported involvement in at least two water projects. These findings suggested that the collected data were reliable for further analysis, given the significant level of professional experience in water projects among the respondents.
Table 3.
Background of respondents.
3.3. Data Analysis
3.3.1. Data Reliability
A reliability analysis was performed to assess the consistency and reliability of the survey. Cronbach’s alpha (α) coefficient was utilized to evaluate the internal consistency of the 39 performance indicators. A value of α equal to or greater than 0.70 is commonly regarded as acceptable [59]. The 39 performance indicators yielded an overall score of 0.944 at a significance level of 5%, confirming the reliability of the data. Next, the dataset underwent screening using the two-standard deviation approach to identify any outliers [32]. Based on the calculation, the calculated intervals for the two-standard deviation method were 4.178 and 2.504. Hence, IND29 and IND28 were identified as outliers as they fell outside the two-standard deviation interval values. As a result, IND29 was excluded from further analysis as it was considered less critical by professionals compared to the other indicators. However, “Public safety” (IND28) was retained for further analysis, as it was deemed potentially very important. IND28 might be of paramount importance in a water project, justifying its retention despite its being an outlier.
3.3.2. Mean Ranking Analysis and Normalization Method
Initially, mean score ranking analysis was utilized to ascertain the relative rankings of the performance indicators. In instances where multiple indicators exhibited identical mean values, priority was accorded to those demonstrating the lowest standard deviation (SD). A lower standard deviation (SD) implies that the variations in responses are not statistically significant; thus, the reliability of the mean value as a representation for the majority of respondents is enhanced [59]. Following the ranking of performance indicators, a normalization method was applied to identify the crucial performance indicators [60]. Using this approach, the minimum mean value was standardized to 0, while the maximum mean value was standardized to 1. Subsequently, the remaining mean values were transformed into decimal values within the range of 0 to 1. The performance indicators with normalized values of 0.60 or higher were identified as critical performance indicators.
3.3.3. Exploratory Factor Analysis (EFA)
EFA is a statistical technique used to investigate potential correlations among performance indicators. To ascertain the sample size required for EFA, the ratio of the sample size to the number of variables was computed. With 13 critical performance indicators identified through the normalization method, the calculated ratio of the sample size to the number of variables exceeded the recommended threshold of 5 [61,62], indicating an adequate sample size. Next, the Kaiser–Meyer–Olkin (KMO) value and Bartlett’s test of sphericity were assessed to ensure the suitability of the data for conducting EFA. The KMO value should be greater than 0.50 [63]. Bartlett’s test of sphericity was used to evaluate the relationships between the variables. If the original correlation matrix is not an identity matrix, the data are deemed suitable for EFA [64]. Moreover, PCA was used to extract factors and to identify the underlying constructs within the dataset. In addition, variables with factor loadings of more than 0.50 were regarded as significant and valuable for the interpretation of these constructs [65].
3.3.4. Partial Least Squares Structural Equation Modeling (PLS-SEM)
In this study, structural equation modeling (SEM) was utilized to test the hypotheses. SEM facilitates the direct measurement of observed variables; latent variables are inferred from these observed variables. A structural equation model encompasses both measurement and structural components. The measurement model delineates the association between each observed variable and its corresponding latent variable, while the structural model elucidates the relationships among the latent variables. SEM exists in two principal forms: covariance-based SEM (CB-SEM) and partial least squares SEM (PLS-SEM). PLS-SEM was favored over CB-SEM due to its superior ability to handle non-normal datasets and small sample sizes [66]. Moreover, PLS-SEM is suitable for exploratory research involving theoretical models that are not well established [67].
PLS-SEM generates both measurement models and a structural model. The outer measurement model is designed to assess the consistency and validity of observed variables. Convergent validity and discriminant validity are key criteria used to evaluate the validity of the measurement model. To ascertain convergent validity, metrics such as Cronbach’s alpha, composite reliability (CR) scores, and average variance extracted (AVE) are employed. It is recommended that Cronbach’s alpha, which measures the internal consistency of indicators, should surpass a threshold of 0.5 [68], while CR scores should be above 0.6 [69]. Convergent validity is assessed using AVE, with a value greater than 0.5 considered satisfactory [69], indicating that, on average, the construct explains over 50% of the variance of its items. Then, the discriminant validity of the measurement model is assessed. Discriminant validity plays a crucial role in assessing theoretical relationships between constructs [70]. A study by Hulland [71] proposed two methods to evaluate discriminant validity: the Fornell–Larcker criterion and indicator cross-loading analysis. According to the Fornell–Larcker criterion, the variance within a construct should outweigh the variance between that construct and any other construct. Cross-loading analysis ensures that the indicators exhibit stronger correlations with the construct they are intended to measure compared to any other constructs in the model [72]. After evaluating the measurement model, the validity of the structural model is evaluated based on the significance and relevance of the relationships within the model.
4. Results
4.1. Result of Mean Ranking Analysis and Normalization Method
Table 4 displays the results of the mean ranking analysis and normalization method for assessing EMP implementation in water projects in Saudi Arabia. The critical performance indicators, identified by the fact that they have normalized mean values of at least 0.60, are presented. A total of thirteen indicators met this criterion; thus, they qualified as critical performance indicators. These thirteen indicators, with normalized values of 0.60 or above, are considered critical for the evaluation of EMP implementation in water projects in Saudi Arabia.
Table 4.
Critical performance indicators for assessing EMP implementation.
4.2. EFA Results
The Kaiser–Meyer–Olkin (KMO) value calculated for the performance indicators stands at 0.856, surpassing the minimum threshold of 0.50. Conversely, Bartlett’s test of sphericity yielded a significant p-value of 0, indicating that the dataset was not an identity matrix. Consequently, the data were deemed suitable for exploratory factor analysis (EFA). Table 5 presents all the critical performance indicators that were successfully loaded onto the three underlying constructs. Collectively, these constructs accounted for 58.838% of the total variance. To assign appropriate labels to each construct, factors with higher factor loadings or the complete set of variables can be considered [69]. Hence, these constructs were named ‘Environmental impact indicators’, ‘Operational and safety indicators’, and ‘Waste management and public safety indicators’.
Table 5.
Results of EFA.
4.3. Hypotheses Development
Based on the EFA results, three hypotheses were developed:
H1:
Environmental impact indicators positively influence EMP implementation.
H2:
Operational and safety indicators positively influence EMP implementation.
H3:
Waste management and public safety indicators positively influence EMP implementation.
4.4. PLS-SEM Results
4.4.1. Measurement Model Evaluation
Convergent validity refers to the level of agreement between two or more indicators of the same construct. Table 6 illustrates that all the indicator loadings exceeded the recommended value of 0.60 for exploratory research. According to Table 6, the Cronbach’s alpha values for all the constructs exceeded 0.5, indicating indicator reliability. Furthermore, the CR values, representing internal consistency, ranged from 0.898 to 0.771; thus, they all surpassed the 0.60 threshold and affirmed the adequacy of internal consistency reliability in this model. Additionally, the AVE values for all three constructs exceeded the 0.50 threshold required for convergent reliability.
Table 6.
Measurement model evaluation.
After evaluating the measurement model, the subsequent step involves assessing its discriminant validity using the Fornell and Larcker criterion. According to the findings in Table 7, the measurement indicates satisfactory discriminant validity, as the highest correlation of a construct is with itself. An alternative approach to the assessment of the discriminant validity of the measurement model involves examining the cross-loadings of the indicators. As shown in Table 8, each indicator displayed the highest factor loading on the construct it was designed to measure in the model. This confirmation indicates that the measurement model exhibits sufficient convergent and discriminant validity for structural path modeling.
Table 7.
Discriminant validity (Fornell–Larcker).
Table 8.
Indicators’ cross-loading.
4.4.2. Structural Model Evaluation
The structural model evaluation of PLS-SEM is crucial as it involves validating the proposed hypotheses using bootstrapping. Accordingly, the structural model evaluation conducts bootstrapping with 5000 subsamples [72]. Table 9 presents the results of the structural model evaluation. As a result, all three components are validated to induce EMP implementation positively.
Table 9.
Structural model evaluation.
5. Discussion
5.1. Environmental Impact Indicators
Environmental impact indicators, which are instrumental in steering the implementation of environmental management plans in Saudi Arabian water projects, have garnered significant attention due to their pronounced effects. Notably, the impact of chemical spills has been a subject of concern [73]. These spills pose a substantial threat to water quality, necessitating the detection, control, and removal of hazardous substances [74]. These recent studies collectively underscore the urgent need for comprehensive measures to prevent and address chemical spills. Similarly, the implementation of environmental management plans is significantly influenced by oil and fuel spills, events with the potential for severe pollution and environmental damage. It is highly critical for effective pollution prevention and control plans, especially in response to human errors and equipment failure. In [75], the research further emphasizes the importance of risk assessment and emergency treatment plans for water sources affected by oil spills, especially with regard to water quality and safety. Protection, response, and cleanup techniques play a critical role in minimizing the environmental impacts of the freshwater spill response.
These recent studies collectively stress the need for robust environmental management plans to address the potential impact of oil and fuel spills on water projects. Moreover, the aesthetic assessment of water bodies, including their color, plays a pivotal role in guiding water quality management and environmental impact analysis in water projects [75]. However, the implementation of environmental management plans faces challenges regarding the potential adverse effects of leaching from submerged soils, which affects water quality [76]. Additionally, water conservancy projects can induce significant hydro-ecological impacts, such as changes in river discharge and sediment, exacerbated by alterations in water color. Consequently, changes in the color of bodies of water directly impact the implementation of environmental management plans in water projects, especially with regard to water quality and ecological balance. Collectively, these insights underscore the intricate relationship between environmental impact indicators and the success of EMPs implementation in Saudi Arabian water projects [32].
5.2. Operational and Safety Indicators
Operational and safety indicators play a pivotal role in influencing the effective implementation of environmental management plans in water projects in Saudi Arabia. These indicators are essential components, ensuring the seamless execution of project activities while prioritizing the safety of personnel and the surrounding environment. The interconnected nature of operational efficiency, safety measures, and environmental management is critical in water projects, given the potential risks associated with construction and maintenance activities in ecologically sensitive areas. One key operational indicator that directly impacts the execution of an environmental management plan is restricted site accessibility. In Saudi Arabia, where water projects navigate diverse landscapes, the accessibility of project sites becomes paramount. Restricted access can impede the deployment of monitoring and mitigation measures, making it difficult to promptly address environmental concerns. An effective environmental management plan should incorporate strategies to overcome site accessibility challenges, facilitating efficient monitoring and intervention efforts. Irregular floods represent another operational and safety concern affecting the successful implementation of environmental management plans in water projects [77].
The unpredictable nature of floods poses threats to both project infrastructure and the surrounding environment. In Saudi Arabia, where flash floods are possible in many areas, integrating careful planning and preemptive measures into environmental management plans becomes crucial [78,79,80]. This includes establishing early warning systems and designing resilient infrastructure to withstand unforeseen flood events, safeguarding both operational continuity and the local ecosystem. Road safety hazards, although seemingly unrelated to environmental concerns, play a vital role in the overall success of environmental management plan implementation in water projects. The transportation of materials and personnel involves road networks that can pose risks to both human safety and the environment. Accidents or spills during transportation can have immediate consequences on water quality and nearby ecosystems. Therefore, an effective environmental management plan should incorporate stringent road safety protocols, minimizing the likelihood of accidents and ensuring the safe transportation of materials and consequently reducing potential environmental impacts [81,82].
5.3. Waste Management and Public Safety Indicators
Waste management and public safety indicators stand as pivotal elements influencing the robust implementation of environmental management plans in water projects across Saudi Arabia. The effective handling of waste, both during and after project execution, directly contributes to the preservation of ecosystems and the prevention of environmental degradation. Additionally, ensuring public safety is paramount in regions where water projects often intersect with inhabited areas. Recognizing the interconnectedness of waste management, public safety, and environmental sustainability is crucial for the successful execution of water projects in the kingdom [83]. The first critical indicator, increased schedule waste, poses a significant challenge to environmental management plan implementation. The generation of scheduled waste, such as hazardous materials, demands meticulous attention. Improper disposal or mismanagement of such waste can lead to soil and water contamination, endangering both human health and the environment. An effective environmental management plan must incorporate stringent waste management practices, including proper disposal and treatment procedures, to mitigate the potential adverse effects of increased scheduled waste.
Construction waste can have a significant impact on the environment, including pollution, habitat disruption, and visual blight. To minimize these impacts, an environmental management plan for water projects should include measures to reduce, reuse, and recycle construction waste. Such a plan should identify the types of debris that the project will generate, estimate the types and quantities of materials or waste generated by the project site, and propose intended disposal methods. Successful waste management plans should also contain goals for waste recycling, salvage, or reuse. A well-developed construction site waste management plan (SWMP) will help to eliminate or reduce construction waste and protect the environment and public health [84]. Public safety is an essential indicator that influences the success of environmental management plans in water projects. The interaction between project activities and the public requires careful consideration to prevent accidents and ensure the well-being of local communities. In water projects, potential hazards such as open excavation sites, heavy machinery, and altered traffic patterns can pose risks to public safety. A robust environmental management plan must integrate measures to address and mitigate these safety concerns, ensuring a harmonious coexistence between project activities and the surrounding communities [85].
6. Implications
6.1. Practical Implications: Environmental Impact Indicators
This comprehensive study of environmental impact indicators in Saudi Arabian water projects has significant practical implications for the effective implementation of EMPs. The identified environmental impact indicators, derived through a meticulous process involving a systematic literature review, interviews with environmental professionals, and a survey incorporating 39 performance indicators, offer valuable insights for practitioners. The study emphasizes the critical importance of addressing chemical spills, especially those threatening water quality; these spills necessitate robust detection, control, and removal measures. Moreover, the research underscores the need for effective pollution prevention and control plans, especially in response to oil and fuel spills, highlighting the urgent need for risk assessment and emergency treatment plans. Additionally, the study reveals the impact of aesthetic assessments, such as changes in watercolor, on water quality management, emphasizing the need for a holistic approach to environmental management plans in Saudi Arabian water projects. In practical terms, professionals in the field are urged to integrate these insights into their EMPs to enhance the overall environmental sustainability of water projects.
6.2. Theoretical Implications: Environmental Impact Indicators
The theoretical implications derived from the study of environmental impact indicators in Saudi Arabian water projects contribute significantly to the broader theoretical framework of environmental management in construction projects. By employing a systematic literature review, interviews, and a comprehensive survey, the study not only identifies the specific environmental impact indicators that are crucial for EMP implementation, it also highlights the intricate relationship between these indicators and project success. The incorporation of theoretical perspectives from environmental sciences, risk assessment, and emergency response planning enriches the understanding of how theoretical concepts translate into practical strategies for safeguarding water quality and ecological balance. The study underscores the relevance of considering aesthetic assessments, such as changes in watercolor, within the theoretical constructs of environmental impact analysis. The theoretical framework developed through this research provides a foundation for future studies in the field of construction management, offering insights into the interplay of environmental indicators and the success of EMP implementation. Researchers and academics can use these theoretical underpinnings to expand upon existing environmental management theories and refine conceptual models, fostering a deeper understanding of the theoretical landscape surrounding construction projects in ecologically sensitive areas.
7. Conclusions
This research aims to examine the performance indicators that are crucial for assessing the implementation of EMPs in water projects. To achieve the study’s aim, this paper conducted a questionnaire survey. The survey development included the conducting of an SLR to identify performance indicators. Subsequently, ten interviews were conducted with environmental professionals to identify potential indicators not identified by the SLR. After designing the survey and conducting a pilot study, the survey was finalized for data collection. In total, there were 112 valid responses from environmental professionals involved in water projects in Saudi Arabia. The data analysis included reliability tests, mean ranking, normalized mean analysis, EFA, and PLS-SEM. The normalized mean analysis identified 13 critical parameters out of 39 for subsequent analyses. EFA revealed three underlying constructs: environmental impact indicators, operational and safety indicators, and waste management and public safety indicators. PLS-SEM was employed to validate the relationship between these indicators and the implementation of the environmental management plan. Although the aim of the paper was achieved, it is essential to point out this limitation. The identified literature from the SLR comprised only 13 articles, which may have affected the quality of the results. The questionnaire survey and the interviews helped in overcoming this limitation.
This study stands out due to its comprehensive investigation of environmental impact indicators and their pivotal role in shaping EMPs for Saudi Arabian water projects. The findings suggest that all three underlying constructs positively influence the implementation of such plans. By delving into the specific importance and challenges of the EMP indicators, this research significantly enriches the field of environmental management. Furthermore, the study’s findings underscore the importance of developing precise performance indicators that are tailored to the diverse construction projects and are focused on the construction of water facilities. This broader implication highlights the crucial need for customized strategies to effectively address environmental concerns across different sectors, thereby fostering sustainable development practices. The identified performance indicators offer valuable insights for policymakers in shaping effective environmental management plans. Practitioners can benefit from the detailed analysis of the critical parameters and underlying constructs; this analysis enables them to enhance the implementation of such plans in water projects. Furthermore, researchers can build upon the findings of this study and contribute to the ongoing development of knowledge in the field of environmental management.
Author Contributions
Conceptualization, A.M.F., M.F., M.E., R.H. and R.A.R.; methodology, A.R.R., A.M.F., M.F., M.E., R.H., M.M.O. and R.A.R.; validation, R.A.R.; formal analysis, A.R.R.; resources, A.M.F., M.F., M.E. and R.A.R.; data curation, A.M.F., M.F. and M.E.; writing—original draft preparation, A.R.R.; writing—review and editing, A.M.F., N.S.R., M.F., M.E., R.H., M.M.O. and R.A.R.; visualization, A.R.R.; supervision, N.S.R., M.F., M.E. and R.A.R.; project administration, M.F. and R.A.R.; funding acquisition, M.F. All authors have read and agreed to the published version of the manuscript.
Funding
This study is supported and funded by the Deanship of Scientific Research at Imam Mohammad Ibn Saud Islamic University (IMSIU), grant number IMSIU-RG23107.
Institutional Review Board Statement
Not applicable.
Informed Consent Statement
Not applicable.
Data Availability Statement
The data presented in this study are available upon request from the corresponding authors. The data are not publicly available due to some of the data being proprietary or confidential in nature. Therefore, data may only be provided with restrictions.
Conflicts of Interest
The authors declare no conflicts of interest.
References
- Sikdar, P.K. Environmental Management: Issues and Concerns; Springer: Berlin/Heidelberg, Germany, 2021. [Google Scholar]
- Chen, Y.-C.; Lien, H.-P.; Tzeng, G.-H. Measures and evaluation for environment watershed plans using a novel hybrid MCDM model. Expert Syst. Appl. 2010, 37, 926–938. [Google Scholar] [CrossRef]
- Bryant, R.L.; Wilson, G.A. Rethinking environmental management. Prog. Hum. Geogr. 1998, 22, 321–343. [Google Scholar] [CrossRef]
- Chouhan, V.K.; Khan, S.H.; Hajiaghaei-Keshteli, M. Sustainable planning and decision-making model for sugarcane mills considering environmental issues. J. Environ. Manage. 2021, 303, 114252. [Google Scholar] [CrossRef] [PubMed]
- Wilson, G.A.; Bryant, R.L. Environmental Management; Routledge: London, UK, 2021. [Google Scholar]
- Xiang, X.; Li, Q.; Khan, S.; Khalaf, O.I. Urban water resource management for sustainable environment planning using artificial intelligence techniques. Environ. Impact Assess. Rev. 2021, 86, 106515. [Google Scholar] [CrossRef]
- Margerum, R.D. Integrated environmental management: The foundations for successful practice. Environ. Manag. 1999, 24, 151–166. [Google Scholar] [CrossRef]
- Dahalan, N.H.; Rahman, R.A.; Ahmad, S.W.; Ibrahim, C.K.I.C. Public monitoring of environmental management plan implementation in road construction projects: Key performance indicators. J. Eng. Des. Technol. 2023; ahead-of-print. [Google Scholar]
- Virapongse, A.; Brooks, S.; Metcalf, E.C.; Zedalis, M.; Gosz, J.; Kliskey, A.; Alessa, L. A social-ecological systems approach for environmental management. J. Environ. Manag. 2016, 178, 83–91. [Google Scholar] [CrossRef]
- Head, B.W. Managing environmental and sustainability challenges. In Wicked Problems in Public Policy: Understanding and Responding to Complex Challenges; Springer: Berlin/Heidelberg, Germany, 2022; pp. 83–106. [Google Scholar]
- Hong, J.; Wang, Z.; Li, J.; Xu, Y.; Xin, H. Effect of interface structure and behavior on the fluid flow characteristics and phase interaction in the petroleum industry: State of the art review and outlook. Energy Fuels 2023, 37, 9914–9937. [Google Scholar] [CrossRef]
- Na, N.A. Risk in the Modern Age: Social Theory, Science and Environmental Decision-Making; Springer: Berlin/Heidelberg, Germany, 2019. [Google Scholar]
- Yenidogan, A.; Gurcaylilar-Yenidogan, T.; Tetik, N. Environmental management and hotel profitability: Operating performance matters. Tour. Manag. Stud. 2021, 17, 7–19. [Google Scholar] [CrossRef]
- ISO 14000; Environmental Management. International Organization for Standardization: Geneva, Switzerland, 2017.
- Chen, D.; Chen, Y.; Li, N.; Zhang, H.; Duan, H.; Liu, J.; Sun, P. Environmental Management Scheme of EPC Model for Water Environmental Treatment Project. In Proceedings of the 23rd International Symposium on Advancement of Construction Management and Real Estate; Springer: Berlin/Heidelberg, Germany, 2021; pp. 376–389. [Google Scholar]
- Hickie, D.S. The Development of Environmental Assessment Processes for Projects within the Water Environment; Loughborough University: Loughborough, UK, 1998. [Google Scholar]
- Chitale, M.A. Environmental management in water resources projects: Indian experiences of irrigation and power projects. Int. J. Water Resour. Dev. 1988, 4, 108–116. [Google Scholar] [CrossRef]
- Herath, S.; Chong, S. Key components and critical success factors for project management success: A literature review. Oper. Supply Chain Manag. Int. J. 2021, 14, 431–443. [Google Scholar] [CrossRef]
- Zhang, Y.; Tang, W.; Duffield, C.F.; Zhang, L.; Hui, F.K.P. Environment management of hydropower development: A case study. Energies 2021, 14, 2029. [Google Scholar] [CrossRef]
- Adams, B. Green Development: Environment and Sustainability in a Developing World; Routledge: London, UK, 2008. [Google Scholar]
- Ke, Y.; Chen, Y.; Liang, S.; Hu, J.; Hou, H.; Quan, J.; Li, X.; Duan, H.; Yuan, S.; Yang, J. Environmentally sound management of industrial solid waste: A paradigm of proposed bi-tetrahedron. Resour. Conserv. Recycl. 2023, 198, 107212. [Google Scholar] [CrossRef]
- Hirji, R.; Davis, R. Environmental Flows in Water Resources Policies, Plans, and Projects: Findings and Recommendations; World Bank Publications: Herndon, VA, USA, 2009. [Google Scholar]
- Baby, S. Approach in developing environmental management plan (EMP). In Proceedings of the 2nd International Conference on Environmental Engineering and Application, Shanghai, China; IACSIT Press: Singapore, 2011; Volume 253. [Google Scholar]
- Azzone, G.; Noci, G.; Manzini, R.; Welford, R.; Young, C.W. Defining environmental performance indicators: An integrated framework. Bus. Strateg. Environ. 1996, 5, 69–80. [Google Scholar] [CrossRef]
- Rowland-Jones, R.; Pryde, M.; Cresser, M. An evaluation of current environmental management systems as indicators of environmental performance. Manag. Environ. Qual. Int. J. 2005, 16, 211–219. [Google Scholar] [CrossRef]
- Thoresen, J. Environmental performance evaluation—A tool for industrial improvement. J. Clean. Prod. 1999, 7, 365–370. [Google Scholar] [CrossRef]
- Metcalf, K.R.; Williams, P.L.; Minter, J.R.; Hobson, C.M. Environmental performance indicators for enhancing environmental management. Environ. Qual. Manag. 1996, 5, 7–11. [Google Scholar] [CrossRef]
- Saengsupavanich, C.; Coowanitwong, N.; Gallardo, W.G.; Lertsuchatavanich, C. Environmental performance evaluation of an industrial port and estate: ISO14001, port state control-derived indicators. J. Clean. Prod. 2009, 17, 154–161. [Google Scholar] [CrossRef]
- Gautam, R.; Singh, A. Critical environmental indicators used to assess environmental performance of business. Glob. Bus. Manag. Res. Int. J. 2010, 2, 224–236. [Google Scholar]
- Dahalan, N.H.; Rahman, R.A.; Hassan, S.H.; Ahmad, S.W. Performance indicators for public evaluation of environmental management plan implementation in highway construction projects. Int. J. Disaster Resil. Built Environ. 2023; ahead-of-print. [Google Scholar]
- Dahalan, N.H.; Rahman, R.A.; Ahmad, S.W. Environmental management plan (EMP): Performance indicators for road and highway construction. In AIP Conference Proceedings; AIP Publishing: College Park, MD, USA, 2022; Volume 2532. [Google Scholar]
- Radzi, A.R.; Farouk, A.M.; Romali, N.S.; Farouk, M.; Elgamal, M.; Rahman, R.A. Assessing Environmental Management Plan Implementation in Water Supply Construction Projects: Key Performance Indicators. Sustainability 2024, 16, 600. [Google Scholar] [CrossRef]
- Krosnick, J.A. Improving question design to maximize reliability and validity. In The Palgrave Handbook of Survey Research; Springer: Berlin/Heidelberg, Germany, 2018; pp. 95–101. [Google Scholar]
- Clarke, V.; Braun, V. Thematic analysis. In Encyclopedia of Critical Psychology; Springer: Berlin/Heidelberg, Germany, 2014; pp. 1947–1952. [Google Scholar]
- Rani, H.A.; Farouk, A.M.; Anandh, K.S.; Almutairi, S.; Rahman, R.A. Impact of COVID-19 on Construction Projects: The Case of India. Buildings 2022, 12, 762. [Google Scholar] [CrossRef]
- Farouk, A.M.; Rahman, R.A.; Romali, N.S. Economic analysis of rehabilitation approaches for water distribution networks: Comparative study between Egypt and Malaysia. J. Eng. Des. Technol. 2021, 21, 130–149. [Google Scholar] [CrossRef]
- Kaufman, M.M.; Wigston, D.L.; Perlman, E.B. Environmental evaluation of subdivision site developments. Environ. Manag. 2002, 29, 801–812. [Google Scholar] [CrossRef] [PubMed][Green Version]
- Niemeijer, D.; De Groot, R.S. A conceptual framework for selecting environmental indicator sets. Ecol. Indic. 2008, 8, 14–25. [Google Scholar] [CrossRef]
- Dangi, M.B.; Chaudhary, R.P.; Rijal, K.; Stahl, P.D.; Belbase, S.; Gerow, K.G.; Fernandez, D.; Pyakurel, B. Impacts of environmental change on agroecosystems and livelihoods in Annapurna Conservation Area, Nepal. Environ. Dev. 2018, 25, 59–72. [Google Scholar] [CrossRef]
- Gilchrist, A.; Allouche, E.N. Quantification of social costs associated with construction projects: State-of-the-art review. Tunn. Undergr. Sp. Technol. 2005, 20, 89–104. [Google Scholar] [CrossRef]
- Ramani, T.; Zietsman, J.; Eisele, W.; Rosa, D.; Spillane, D.; Bochner, B. Developing Sustainable Transportation Performance Measures for TXDOT’s Strategic Plan: Technical Report; Texas Transportation Institute: Bryan, TX, USA, 2009. [Google Scholar]
- Anderson, J.L.; Muench, S.T. Sustainability trends measured by the greenroads rating system. Transp. Res. Rec. 2013, 2357, 24–32. [Google Scholar] [CrossRef]
- Fernández-Sánchez, G.; Rodríguez-López, F. A methodology to identify sustainability indicators in construction project management—Application to infrastructure projects in Spain. Ecol. Indic. 2010, 10, 1193–1201. [Google Scholar] [CrossRef]
- Gallego, I. The use of economic, social and environmental indicators as a measure of sustainable development in Spain. Corp. Soc. Responsib. Environ. Manag. 2006, 13, 78–97. [Google Scholar] [CrossRef]
- Park, J.-W.; Ahn, Y.H. Development of a green road rating system for South Korea. Int. J. Sustain. Build. Technol. Urban Dev. 2015, 6, 249–263. [Google Scholar] [CrossRef]
- Shen, L.; Lu, W.; Peng, Y.; Jiang, S. Critical assessment indicators for measuring benefits of rural infrastructure investment in China. J. Infrastruct. Syst. 2011, 17, 176–183. [Google Scholar] [CrossRef]
- Tam, V.W.Y.; Tam, C.M.; Shen, L.Y.; Zeng, S.X.; Ho, C.M. Environmental performance assessment: Perceptions of project managers on the relationship between operational and environmental performance indicators. Constr. Manag. Econ. 2006, 24, 287–299. [Google Scholar] [CrossRef]
- Chang, A.S.; Tsai, C.Y. Sustainable design indicators: Roadway project as an example. Ecol. Indic. 2015, 53, 137–143. [Google Scholar] [CrossRef]
- Umer, A.; Hewage, K.; Haider, H.; Sadiq, R. Sustainability assessment of roadway projects under uncertainty using Green Proforma: An index-based approach. Int. J. Sustain. Built Environ. 2016, 5, 604–619. [Google Scholar] [CrossRef]
- Wang, Z.; He, X.; Zhang, C.; Xu, J.; Wang, Y. Evaluation of geological and ecological bearing capacity and spatial pattern along du-wen road based on the analytic hierarchy process (AHP) and the technique for order of preference by similarity to an ideal solution (TOPSIS) method. ISPRS Int. J. Geo-Inf. 2020, 9, 237. [Google Scholar] [CrossRef]
- Yang, H.; Wang, Z.; Dai, Q. Ecological impact assessment method of highways in Tibetan Plateau: A Case study of Gonghe-Yushu Expressway. J. Mt. Sci. 2020, 17, 1916–1930. [Google Scholar] [CrossRef]
- Sun, C.; Xu, S.; Qi, W.; Chen, C.; Deng, Y.; Pei, N.; König, H.J. Biodiversity constraint indicator establishment and its optimization for urban growth: Framework and application. Environ. Res. Lett. 2019, 14, 125006. [Google Scholar] [CrossRef]
- Goedkoop, M.; Spriensma, R. The Eco-Indicator 95; PRé Consultants Amersfoort: Amersfoort, The Netherlands, 1995. [Google Scholar]
- Jeon, C.M.; Amekudzi, A. Addressing sustainability in transportation systems: Definitions, indicators, and metrics. J. Infrastruct. Syst. 2005, 11, 31–50. [Google Scholar] [CrossRef]
- Venner, M. Environmental Stewardship Practices, Procedures, and Policies for Highway Construction and Maintenance; The National Academies of Sciences, Engineering, and Medicine: Washington, DC, USA, 2004. [Google Scholar]
- Fellows, R.F.; Liu, A.M.M. Research Methods for Construction; John Wiley & Sons: Hoboken, NJ, USA, 2021. [Google Scholar]
- Cresswell, J.W.; Clark, V.L.P. Designing and Conducting Mixed Methods Research; SAGE: Thousand Oaks, CA, USA, 2011. [Google Scholar]
- Bernard, H.R. Research Methods in Anthropology: Qualitative and Quantitative Approaches; Rowman & Littlefield: Lanham, MD, USA, 2017. [Google Scholar]
- Staplehurst, J.; Ragsdell, G. Knowledge sharing in SMEs: A comparison of two case study organisations. J. Knowl. Manag. Pract. 2010, 11, 1–16. [Google Scholar]
- Chan, A.P.C.; Lam, P.T.I.; Wen, Y.; Ameyaw, E.E.; Wang, S.; Ke, Y. Cross-sectional analysis of critical risk factors for PPP water projects in China. J. Infrastruct. Syst. 2015, 21, 4014031. [Google Scholar] [CrossRef]
- Gorsuch, R.L. Factor Analysis, Hillsdale, New Jersey, L.; Erlbaum Associates: Mahwah, NJ, USA, 1983. [Google Scholar]
- Kline, P. An Easy Guide to Factor Analysis; Routledge: London, UK, 2014. [Google Scholar]
- Field, A. Discovering Statistics Using SPSS; Sage: London, UK, 2009; pp. 175–179. [Google Scholar]
- Pallant, J. SPSS Survival Manual: A Step by Step Guide to Data Analysis Using IBM SPSS; Routledge: London, UK, 2020. [Google Scholar]
- Osborne, J.W. What is rotating in exploratory factor analysis? Pract. Assess. Res. Eval. 2015, 20, 2. [Google Scholar]
- Hair, F.H., Jr.; Sarstedt, M.; Hopkins, L.; Kuppelwieser, V.G. Partial least squares structural equation modeling (PLS-SEM): An emerging tool in business research. Eur. Bus. Rev. 2014, 26, 106–121. [Google Scholar] [CrossRef]
- Joreskog, K.G. The ML and PLS techniques for modeling with latent variables: Historical and comparative aspects. Syst. Under Indirect. Obs. Part I 1982, 263–270. [Google Scholar]
- Nunnally, J.C.; Bernstein, I.H. Psychometric Theory 3E; Tata McGraw-Hill Education: Columbus, OH, USA, 1994. [Google Scholar]
- Hair, J.F.; Ringle, C.M.; Sarstedt, M. PLS-SEM: Indeed a silver bullet. J. Mark. Theory Pract. 2011, 19, 139–152. [Google Scholar] [CrossRef]
- Henseler, J.; Ringle, C.M.; Sarstedt, M. A new criterion for assessing discriminant validity in variance-based structural equation modeling. J. Acad. Mark. Sci. 2015, 43, 115–135. [Google Scholar] [CrossRef]
- Hulland, J. Use of partial least squares (PLS) in strategic management research: A review of four recent studies. Strateg. Manag. J. 1999, 20, 195–204. [Google Scholar] [CrossRef]
- Fornell, C.; Larcker, D.F. Evaluating structural equation models with unobservable variables and measurement error. J. Mark. Res. 1981, 18, 39–50. [Google Scholar] [CrossRef]
- Sherif, M.; Liaqat, M.U.; Baig, F.; Al-Rashed, M. Water resources availability, sustainability and challenges in the GCC countries: An overview. Heliyon 2023, 9, e20543. [Google Scholar] [CrossRef] [PubMed]
- Nam, S.-H.; Ku, T.-G.; Park, Y.-L.; Kwon, J.-H.; Huh, D.-S.; Kim, Y.-D. Experimental study on the detection of hazardous chemicals using alternative sensors in the water environment. Toxics 2022, 10, 200. [Google Scholar] [CrossRef]
- He, F.; Ma, J.; Lai, Q.; Shui, J.; Li, W. Environmental Impact Assessment of a Wharf Oil Spill Emergency on a River Water Source. Water 2023, 15, 346. [Google Scholar] [CrossRef]
- Kaur, G.; Singh, G.; Motavalli, P.P.; Nelson, K.A.; Orlowski, J.M.; Golden, B.R. Impacts and management strategies for crop production in waterlogged or flooded soils: A review. Agron. J. 2020, 112, 1475–1501. [Google Scholar] [CrossRef]
- Addas, A. Exploring the pattern of use and accessibility of urban green spaces: Evidence from a coastal desert megacity in Saudi Arabia. Environ. Sci. Pollut. Res. 2022, 29, 55757–55774. [Google Scholar] [CrossRef] [PubMed]
- Abdulrazzak, M.; Elfeki, A.; Kamis, A.; Kassab, M.; Alamri, N.; Chaabani, A.; Noor, K. Flash flood risk assessment in urban arid environment: Case study of Taibah and Islamic universities’ campuses, Medina, Kingdom of Saudi Arabia. Geomat. Nat. Hazards Risk 2019, 10, 780–796. [Google Scholar] [CrossRef]
- El Bastawesy, M.; Al Ghamdi, K. Assessment and management of the flash floods in Al Qaseem Area, Kingdom of Saudi Arabia. Int. J. Water Resour. Arid Environ. 2013, 3, 146–157. [Google Scholar]
- Rahman, M.T.; Aldosary, A.S.; Nahiduzzaman, K.M.; Reza, I. Vulnerability of flash flooding in Riyadh, Saudi Arabia. Nat. Hazards 2016, 84, 1807–1830. [Google Scholar] [CrossRef]
- Jamal, A.; Rahman, M.T.; Al-Ahmadi, H.M.; Mansoor, U. The dilemma of road safety in the eastern province of Saudi Arabia: Consequences and prevention strategies. Int. J. Environ. Res. Public Health 2020, 17, 157. [Google Scholar] [CrossRef] [PubMed]
- Retallack, A.E.; Ostendorf, B. Current understanding of the effects of congestion on traffic accidents. Int. J. Environ. Res. Public Health 2019, 16, 3400. [Google Scholar] [CrossRef] [PubMed]
- Abubakar, I.R.; Maniruzzaman, K.M.; Dano, U.L.; AlShihri, F.S.; AlShammari, M.S.; Ahmed, S.M.S.; Al-Gehlani, W.A.G.; Alrawaf, T.I. Environmental sustainability impacts of solid waste management practices in the global South. Int. J. Environ. Res. Public Health 2022, 19, 12717. [Google Scholar] [CrossRef]
- Omer, M.M.; Rahman, R.A.; Almutairi, S. Construction waste recycling: Enhancement strategies and organization size. Phys. Chem. Earth Parts A/B/C 2022, 126, 103114. [Google Scholar] [CrossRef]
- Council, N.R. Prudent Practices in the Laboratory: Handling and Management of Chemical Hazards, Updated Version; National Academies Press: Cambridge, MA, USA, 2011. [Google Scholar]


Disclaimer/Publisher’s Note: The statements, opinions and data contained in all publications are solely those of the individual author(s) and contributor(s) and not of MDPI and/or the editor(s). MDPI and/or the editor(s) disclaim responsibility for any injury to people or property resulting from any ideas, methods, instructions or products referred to in the content. |
© 2024 by the authors. Licensee MDPI, Basel, Switzerland. This article is an open access article distributed under the terms and conditions of the Creative Commons Attribution (CC BY) license (https://creativecommons.org/licenses/by/4.0/).