Article

COVID-19 Impacts on the Spatial Network of City Tourism in Fujian Province, China

1
College of Tourism, Huaqiao University, Quanzhou 362000, China
2
College of Business, North Dakota State University, Fargo, ND 58108, USA
3
Department of Hospitality and Events, School of Hospitality and Tourism Management, University of Surrey, Guildford GU2 7XH, UK
*
Author to whom correspondence should be addressed.
Sustainability 2024, 16(8), 3162; https://doi.org/10.3390/su16083162
Submission received: 12 February 2024 / Revised: 25 March 2024 / Accepted: 7 April 2024 / Published: 10 April 2024

Abstract

:
This study examined the tourism spatial distribution of nine cities in the Fujian province and assessed the impacts of COVID-19. The modified gravity model found that it was widely dispersed, with uneven and relatively independent tourism development in different cities. The social network analysis showed that tourism connections across cities were significantly reduced after the pandemic. The impacts of brand awareness and transport accessibility on spatial networks were positive in the pre-pandemic period but became negative during the pandemic. In contrast, tourist volume had negative impacts on spatial networks pre-pandemic but had positive ones during the pandemic. Tourism resources and market performance had significantly positive impacts in the post-pandemic era. These findings provide advice on tourism recovery and destination management in coping with future critical events. In the spatial distribution network of the tourism economy in Fujian Province, cities have different positions and roles, so development strategies should be differentiated according to the characteristics of each city. For example, more supportive policies should be introduced to help the tourism development of cities with disadvantages. It also contributes to the theoretical gravity framework in tourism and the research scope of the social networks analysis at the city level.

1. Introduction

The spatially balanced distribution of tourism development is an integral part of the coordinated regional economy, profoundly influencing government policymaking and tourism market behavior [1] (Wang & Ye, 2022). Tourism development enhances not only the scale of economies within a region but also regional externalities such as the flow of resources (e.g., people, money, materials, information, and technology). Thus, spatially balanced tourism development eventually helps the mutual adoption of industries and stimulates the multiplier effect of industrial development [2] (Pascariu & Ibanescu, 2018). However, a previous unidentified coronavirus emerged from Wuhan, China, in December 2019 and it was later named Coronavirus Disease-2019 (COVID-19) by the World Health Organization in February 2020. The outbreak of the COVID-19 pandemic in early 2020 has had significant impacts on the tourism industry in China, and travel restrictions forced people to take short-distance regional trips instead of national/international travel [3,4] (Wen, Kozak, Yang, & Liu, 2021; Zhong, Sun, Law, & Li, 2021). Thus, the urban spatial network has been changed, while regional incoherence may have come to the fore [5] (Utkarsh & Sigala, 2021).
Previous research has mainly focused on a specific dimension of the spatial distribution of the tourism economy (e.g., commuter networks, railway networks, or social networks); rarely has attention been paid to assess tourism interactions across cities as reflected in spatial distribution [6] (Green, 2007). For instance, Qin et al., (2022) [7] revealed the spatial characteristics and spatial development patterns of tourist flow in Chinese rural tourism. Qu et al., (2023) [8] also adopted geospatial analyses to examine the spatial patterns of leisure and tourism facilities in China and found the influencing factors. Zhang et al., (2023) [9] found that there is a substantial imbalance in the allocation of A-level tourist attractions in central, southwest, northwest, and northeast China. Also, the existing studies have focused on the tourism spatial distribution simply in terms of tourism economic revenues and tourist volume, neglecting the interactions (i.e., cooperation and competition) between cities as well as the level of economic development and the local as a whole, which leaves the tourism spatial distribution fragmented (Wang & Ye, 2022) [1].
Considering that the tourism industry is historically known as vulnerable to crisis, the macro-level institutional travel restrictions and the micro-level behavioral change of tourists due to COVID-19 would have impacted the urban spatial network substantially (Gössling, Scott, & Hall, 2021) [10]. Because of its highly contagious nature, many countries adopted precautious measures to control possible outbreaks, such as entry bans and quarantine requirements, as well as regular testing to reduce the rapid spread of COVID-19 (Vaishar & Šťastná, 2022) [11]. Notably, these travel restrictions caused a great financial loss to international tourism (Bhuiyan, Crovella, Paiano, & Alves, 2021) [12]. When the travel bans were gradually eased in the post-pandemic era, tourism in China started to experience a fast recovery, especially for some neighboring cities within the same region (Li, Nguyen, & Coca-Stefaniak, 2021) [13]. Thus, studies empirically assessing these impacts are urgently needed for tourism recovery (Ritchie & Jiang, 2019) [14].
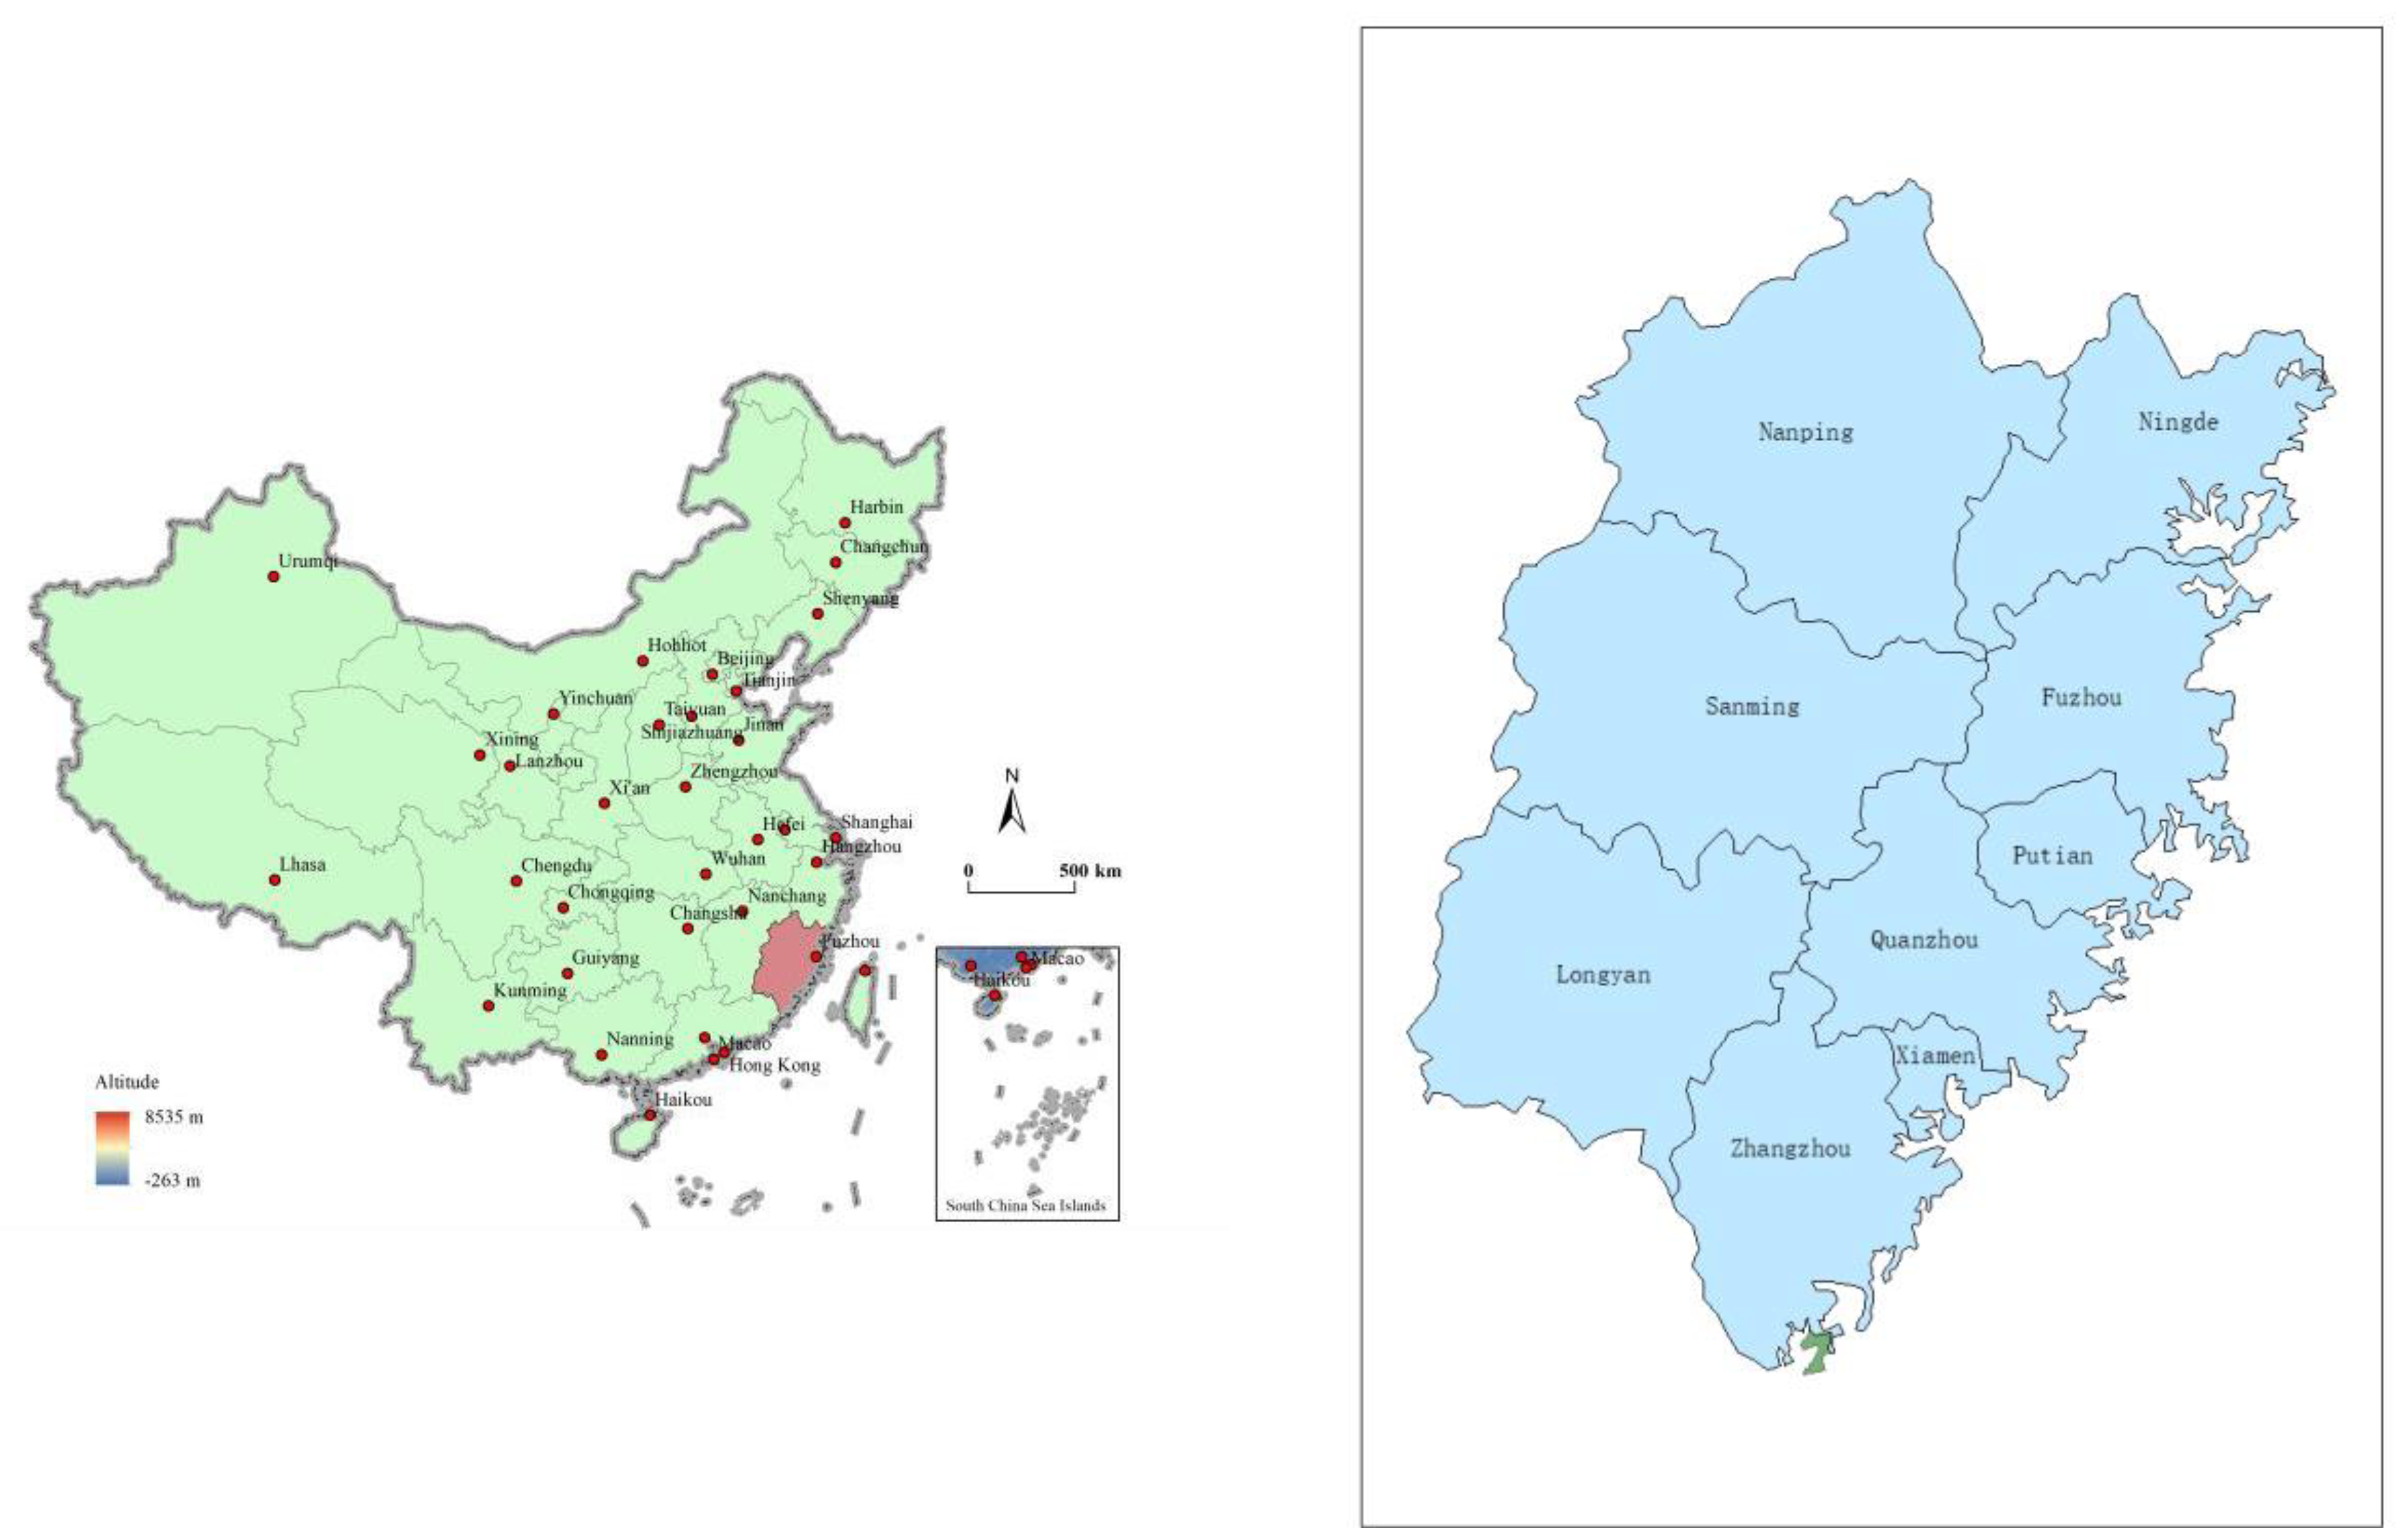
Cities have been closely connected because of the well-developed high-speed rail network in Fujian Province, which also makes Fujian a very suitable case for analysis of tourism links. However, travel restrictions weakened the links between the cities during the pandemic in 2020. In 2021, the tourism economy started to recover, and there were 651,100 international tourists and 406,805,100 domestic tourists, with USD 67,482.59 million in combined tourism revenue (Fujian Provincial Bureau of Statistics, 2022) [15]. As a result of this dynamic context, this study used the Fujian province to explore the tourism spatial distribution and its influencing factors.

2. Literature Review

2.1. Modified Gravity Model

The gravity model, which originates from Newton’s law of university gravitation, is a theoretical model that describes the connection between two objects (Anderson, 2011) [16]. It was first applied in tourism literature in the 1960s to assess the determinants of tourism flows between two places (i.e., nodes). The gravity model can capture the transport patterns, which are directly proportional to the nodes’ size and inversely proportional to the distance between them [17,18] (Nadal & Gallego, 2022; Wang, Qin, Zhao, Zhao & Han, 2023). For example, Goh, Li, & Li (2014) [19] applied the gravity model to compare the spatial distribution of the international tourism economy with the domestic one in China and found that the spatial development of the domestic tourism economy was uneven.
The modified gravity model extended the node to a regional aggregation such as the population and economic activity of a city/province, and distance can include both geographical distance and socioeconomic factors like connectivity and travel costs. Sun and Hou (2021) [20] explored the spatial distribution and evolution of tourism eco-efficiency based on a modified gravity model. They found that the weakening of network connectivity largely leads to the decline of regional tourism eco-efficiency, but this trend can be improved by optimizing the spatial distribution of urban agglomerations [21] (Wang, Xia, Dong, Li, Li, Ba, & Zhang, 2021). Wang et al., (2021) [22] used the modified gravity model to analyze the tourism spatial distribution of a national park. Their findings suggest that national parks play an important role in transmitting regional tourism economic factors. In particular, the associated subgroups formed are closely related to administrative divisions, and the regional subgroups formed are more related to the administrative division and cultural context. Nadal and Gallego (2022) [17] suggested using the modified gravity model to measure the strength of tourism linkages between different regions and to assess the spatial distribution of the tourism economy.
Despite the popularity of the model in tourism literature, previous studies have not taken into consideration the impacts of the pandemic on tourism spatial distribution. This is deemed a significant research gap that needs to be addressed because the pandemic has greatly impacted tourism, and empirical studies assessing these impacts are of great value for coping with future critical events. To address this research gap, this paper aims to identify the influential factors and advise on tourism recovery in the post-pandemic era.

2.2. Social Network Analysis

Social network analysis uses a network model and the study of graphs to examine the stakeholders and their relationships within the network [23] (Otte & Rousseau, 2002). Since the 1930s, it has been widely applied to examine the complicated interactions between cities ranging from place attributes to intercity relationships [24] (Butts, 2008). It uses the sociogram, where nodes represent individuals, groups, or organizations and lines investigate the relationships or flows between the nodes [25] (Vance-Borland & Holley, 2011).
The indicators of network characteristics usually include network density, degree centrality, network correlation, and network hierarchy [26] (Wang, Zhang, & Jin, 2021). Network density is a measure of the connectedness of the nodes from fully disconnected to fully connected in the spatial distribution, with values ranging between 0 and 1 [27] (Kohler, Behrman, & Watkins, 2001). It represents the closeness of the influence among cities in the correlation network in this study. The degree of centrality refers to the overall centralization of the spatial distribution and is equal to the number of connections that a stakeholder has with other stakeholders [28] (dos Muchangos, Tokai, & Hanashima, 2017). Degree centrality indicates whether a city is centrally located in the spatial network, and the higher the value of degree centrality, the more closely connected it is to other cities. Network correlation represents the robustness of the spatial distribution itself, with a higher network correlation indicating a deeper degree of cooperation between cities. Network hierarchy is a measure of the asymmetric accessibility of the relationship among nodes in the network [29] (Gilbert, Simonetto, Zaidi, Jourdan, & Bourqui, 2011), reflecting the asymmetric accessibility and rigid network of cities. Higher network hierarchy indicates that the hierarchical structure among cities in the network is relatively unequal.
However, these indicators have not been fully applied to examine the tourism spatial network across cities in tourism literature [30] (Wang, Liu, Xu, & Fujiki, 2020). Furthermore, the impact of the COVID-19 pandemic on the spatial network of city tourism has become increasingly prominent in the post-pandemic era. Therefore, it is of great value to compare the spatial network characteristics of city tourism along the pre-, present-, and post-pandemic periods to improve the market performance of urban tourism in coping with future critical events.
Based on the literature review above, Table 1 summarizes the variables related to the tourism spatial distribution, including tourist volume, transport accessibility, city brand market performance, city tourism brand awareness, infrastructure levels, regional industrial structures, tourism resources, and geospatial proximity.

3. Research Design

3.1. Samples

The Fujian province is located on the southeastern coast of China, with a population of 41.5 million, ranking 15th in population among Chinese provinces. The Fujian province is one of the most culturally and linguistically diverse provinces in China. It has an abundance of tourism resources, including 10 national 5A scenic spots, ranking first in the country with a forest coverage rate of 66.80% [15] (Fujian Provincial Bureau of Statistics, 2022). To determine the quality of tourist attractions in terms of tourist service, cleanliness, safety, sanitation, and transportation, the Ministry of Culture and Tourism of China (2003) built a tourist attraction rating system. There are five categories of rating, with 5A (AAAAA) as the highest level and 1A (A) as the lowest level. Figure 1 shows the nine prefecture-level cities in the Fujian province, including Fuzhou, Xiamen, Quanzhou, Zhangzhou, Putian, Longyan, Sanming, Nanping, and Ningde.
According to the statistical yearbooks of Fujian province and tourism economic-related data, all the A-class scenic spots in the nine cities in the Fujian province were selected for analysis [15] (Fujian Provincial Bureau of Statistics, 2022). At the same time, we have carefully included all the indicators from the municipal statistical yearbook for 2019, 2020, and 2021 to ensure data completeness and consistency. This study focused on a three-phase period: pre-pandemic (2019), pandemic (2020), and post-pandemic (2021). Table 2 shows the main variables below.

3.2. Models

Referring to the studies of [39] Nogle (1994) and [40] Seok, Barnett, & Nam (2021), the level of urban economic development (measured by the total GDP of the city), urban population, tourist volume, tourism revenue, and the number of tourism employees were included in the modified gravity models:
G = K i j P i R i T i P j R j T j 3 D i j 2 ,
K i j = g i g i + g j = G i V i G i V i + G j V j
where G is the tourism gravity of city i to city j; Pi and Pj are the tourism volume of city i and city j; Ri and Rj are the tourism revenue of city i and city j; Ti and Tj are the numbers of tourism employees of city i and city j; Kij is the correction factor; gi and gj are the GDP per capita of city i and city j; Gi and Gj are the GDP of city i and city j; and Vi and Vj are the population of city i and city j.
The study uses this modified gravity model to measure the strength of tourism linkages among cities in Fujian Province based on the tourist volume, tourism revenue, the number of tourism employees, GDP, the distance between two cities, and the urban population, and to measure the degree of association between cities. Based on the results of the modified gravity model, social network analysis is used to carve out the spatial distribution characteristics among cities in Fujian Province. After that, tourist volume, transport accessibility, city brand market performance, city tourism brand awareness, infrastructure levels, regional industrial structures, tourism resources, and geospatial proximity are selected and Quadratic Assignment Procedure (QAP) is used to explore the influencing factors of the spatial distribution of Fujian Province.

4. Findings

4.1. The Results of the Modified Gravity Model

The modified gravity model was used to calculate the maximum gravitational value of each city in the Fujian province to other cities. Then, the gravitational values of the cities were summed up to form the tourism economic correlation matrix with the tourism economic correlation between the cities. Table 3 shows the sum of the gravitational values exerted by each city on other cities in the Fujian province, the city with the largest exerted gravitational value, and the corresponding gravitational value.
Before the pandemic, Zhangzhou had the largest gravitational value (15,160.711) on other cities and exerted the greatest gravitational value (11,462.229) on Xiamen in 2019. It is worth noting that the maximum gravitational value of cities declined dramatically during the pandemic in 2020 compared with 2019, particularly in Zhangzhou, where the maximum gravitational value decreased substantially (3054.102). In 2020, Xiamen had the largest gravitational value (7059.328) among other cities, with the largest exerted gravitational value (3461.616) in Zhangzhou. Since the post-pandemic period in 2021, Xiamen’s gravitational value (9314.218) returned to the pre-pandemic level, with the highest exerted gravitational value (5097.084) on Zhangzhou. In 2021, inter-city gravitational values have increased, but are still below pre-epidemic levels.

4.2. Overall Network Characteristics

Based on the gravitational values, Ucinet 6 was used to calculate the network density, degree centrality, network correlation, and network hierarchy. The spatial structure of tourism linkages in the Fujian province was relatively dispersed in terms of network density values (0.125) (see Table 4). From pre-pandemic to post-pandemic periods, the value of degree centrality in the Fujian province was 0.278 (in 2019), 0.255 (in 2020), and 0.267 (in 2021), respectively, indicating that cities in the Fujian province were relatively independent. Predictably, the overall centrality of the tourism spatial distribution in 2020 decreased to 0.255, reflecting the decline of tourism flow due to the COVID-19 pandemic. Though lower than its pre-pandemic levels, in 2021 the centrality of the tourism spatial distribution partially recovered to 0.267. Across all periods, the network correlation in the Fujian province was all 1, indicating that the network correlation was robust, without substantial change in the degree of cooperation among cities. Furthermore, the network hierarchy degree was 0, which indicates the low-ranking degree of the tourism spatial distribution in the Fujian province and the relatively independent tourism development of each city.

4.3. Individual Network Characteristics

Table 5 shows the value of degree centrality in the Fujian province. During 2019–2021, the value of indegree for all cities in Fujian was 1, indicating that all nine cities were not closely connected and that no one city was in a relatively central position before, during, or after the pandemic. Fuzhou, Xiamen, and Quanzhou had a value of degree centrality above the in-degree, indicating that these cities did not benefit from city networks. In contrast, Sanming, Putian, Ningde, and Nanping each had a value of degree centrality below the in-degree, indicating that they benefited from city networks. Interestingly, the degree centrality in Zhangzhou has been steadily increasing from 0.385 in 2019 to 0.962 in 2020 and 1.123 in 2021.
Overall, the tourism spatial distribution in the Fujian province developed unevenly across cities, a pattern that remained before, during, and after the pandemic. Moreover, the tourism interactions between cities in the Fujian province during 2019–2021 were generally low. One explanation is that none of the cities were in a core position; thus, tourism in each city developed independently.

4.4. Clustering Structure Characteristics

Taking the analysis a step further, this research utilized the cohesive subgroups method to analyze the clustering structure characteristics. The members of the cohesive subgroups were very close to each other and interacted more closely than groups outside the subgroup [24] (Butts, 2008). In this study, cohesive subgroups were the subsets of cities in the tourism spatial distribution, revealing the actual or potential relationships of each city. Specifically, cities with a close tourism spatial distribution were combined to form a subgroup.
The cohesive subgroups were calculated using the iterative correlation convergence method, setting the maximum cut to 2 and the convergence criterion to 0.2, to obtain the density matrix. The density matrix was set to 1 for densities greater than the overall network density and 0 for densities less than the overall network density to form the like matrix. Table 6 presents the results of the density matrix and the like matrix from 2019 to 2021.
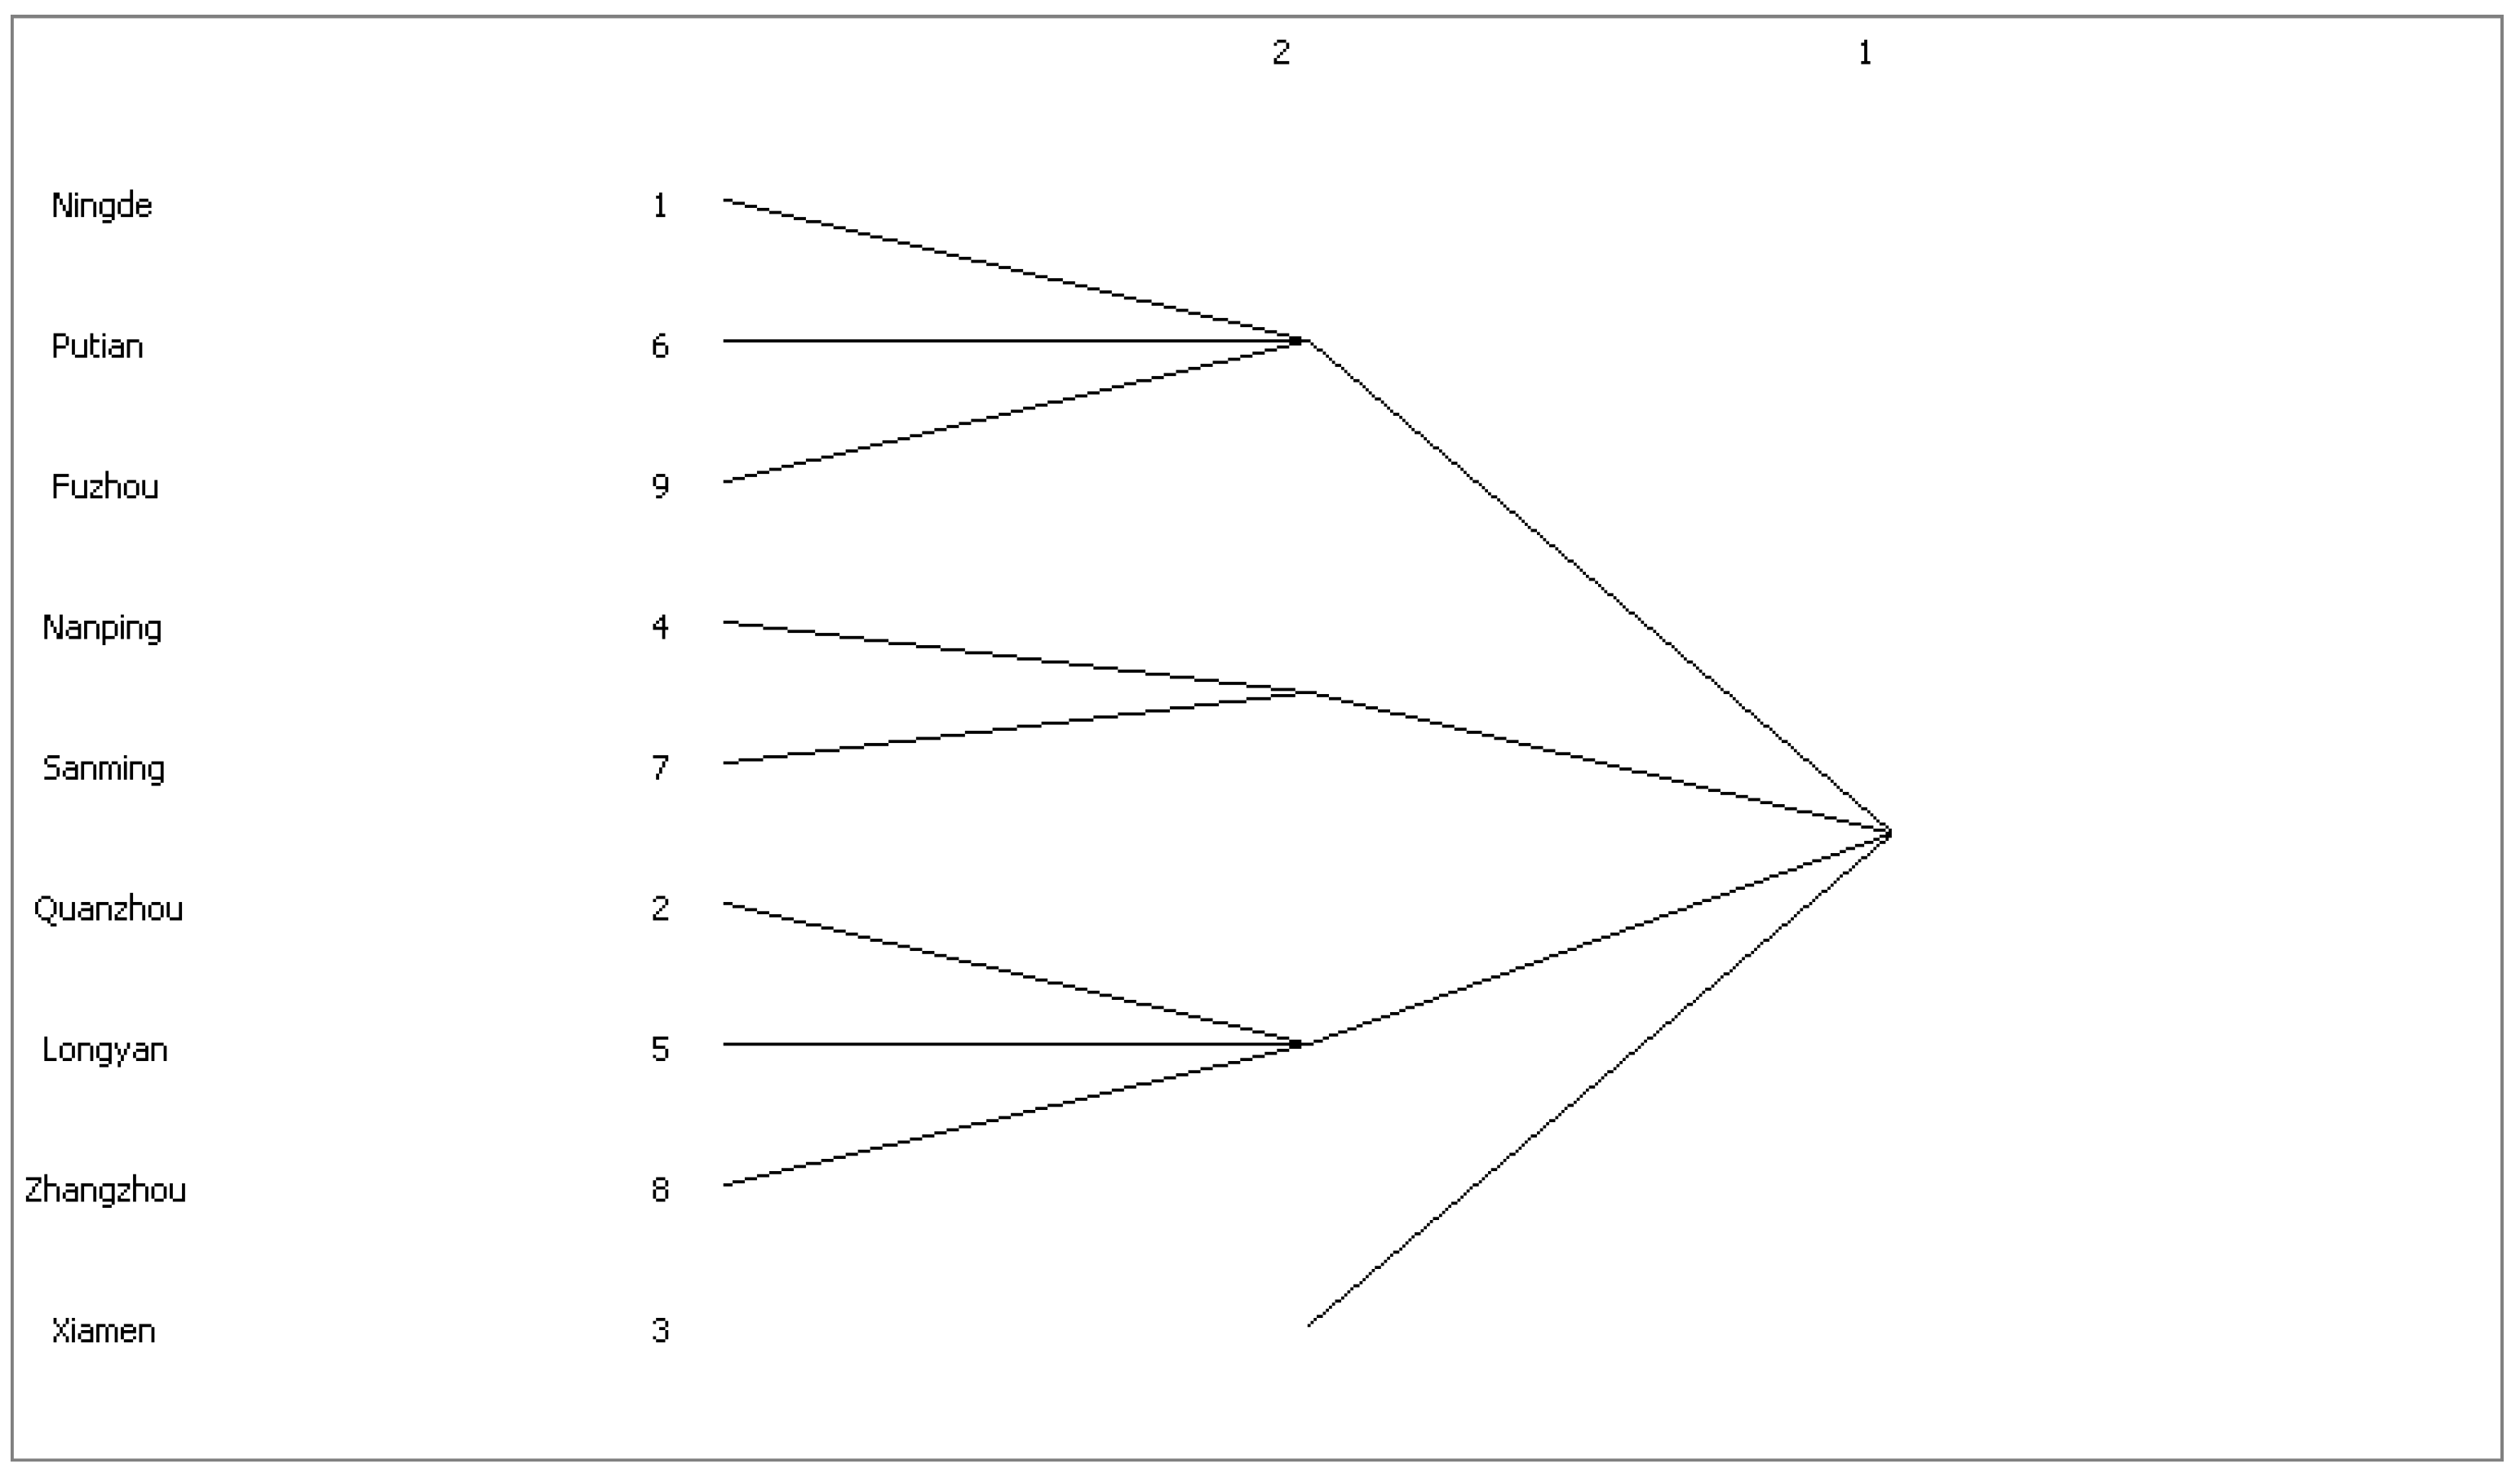
To better interpret the clustering structure characteristics, Figure 2 shows that a total of three subgroups were formed in 2019 and 2021: Fuzhou and Ningde joined subgroup 1; Putian, Nanping, and Sanming formed subgroup 2; and Quanzhou, Longyan, and Zhangzhou joined subgroup 3. Notably, Xiamen is relatively independent, thus it is not part of any subgroup. Interestingly, subgroup 1 and subgroup 2 were closely linked with similar patterns, while subgroup 3 was more connected with Xiamen.
Figure 3 shows the subgroup results in 2020: Ningde, Putian, and Fuzhou formed subgroup 1; Nanping and Sanming created subgroup 2; and Longyan, Quanzhou, and Zhangzhou formed subgroup 3. It also shows that Xiamen had similar patterns with subgroup 3, while the first two subgroups were more connected.
The results of the cohesive subgroup analysis highlight the different compositions of cities during the pandemic, compared to the pre-pandemic and post-pandemic periods. For example, in 2020, Putian joined subgroup 1 with Ningde and Fuzhou instead of remaining in the original subgroup 2 with Nanping and Sanming. Notably, Longyan, Zhangzhou, and Quanzhou formed a stable subgroup 3 from 2019 through 2021, which kept a close relationship with Xiamen in the three-phase period under analysis.

4.5. Comparison Analyses: Quadratic Assignment Procedure (QAP)

The quadratic assignment procedure (QAP), which is widely used in social network analysis, is a resampling-based method that calculates the correct standard errors similar to the bootstrap method [41] (Burkard, 1984). This study employed the QAP method to explore the influencing factors of tourism spatial distribution in the Fujian province. Based on the R2 value, the data can explain 39.0%, 39.1%, and 37.8% of the tourism spatial distribution in the Fujian province during the three-phase period (see Table 7).
In 2019, geospatial proximity characteristics, city tourism brand awareness, and transport accessibility had statistically significant positive impacts on the tourism spatial distribution, while the impacts of infrastructure levels and tourist volume were negative and statistically significant (p < 0.1). As the most influential factor, the coefficient on geospatial proximity is significant at the 1% level. For every one-unit increase, there is a 48.2% increase in the degree of city connection. In contrast, the coefficient of tourist volume is significant at the 5% level (β = −0.168), indicating that the more tourists in a city (for a one-unit increase), the weaker the degree of tourism linkages between cities (a 16.8% decrease).
During the pandemic, geospatial proximity characteristics had an even more influential impact (β = 0.513) on the tourism spatial distribution compared to the value in the pre-pandemic period (β = 0.482). Similarly, for each one-unit increase in tourists, tourism economic linkages between cities increased by 33.3% (p < 0.01). However, regional industrial structure, infrastructure level, tourism brand awareness, and transport accessibility had negative and statistically significant impacts on the tourism spatial distribution in the Fujian province. In 2021, geospatial proximity characteristics still play a significant role in the tourism spatial distribution (β = 0.498). Interestingly, both tourism resources (β = 0.001) and tourism brand market performance (β = 0.002) had significant positive impacts on the tourism spatial distribution in the Fujian province, indicating that tourism resources and marketing activities increased city networks after the pandemic. In contrast, a one-unit increase in single-city tourism brand awareness decreases the city networks by 13.3%.

5. Discussion

Geographic proximity characteristics, as the core influential factor, had a substantial effect on the tourism spatial distribution in the Fujian province before, during, and after the pandemic. Consistent with the friction of distance, interactions and tourism linkages strengthen with the decrease in geographic distance [42] (Gao, Yang, Li, & Qu, 2021). As a piece of empirical evidence, this study found that the coefficients on transport accessibility were positive in 2019 and 2021 but negative in 2020. Due to travel restrictions in 2020, transport accessibility has had negative impacts on tourism spatial distribution, and its impacts turned out to be positive compared to the pre-and post-pandemic periods.
Tourist volume had significant positive impacts on the tourism spatial distribution during the pandemic but had negative impacts in both pre-pandemic and post-pandemic periods. As long-distance travel was severely restricted due to the outbreak in 2020, tourists were more likely to travel to neighboring cities [43] (Jeon & Yang, 2021). Thus, the spillover effect of tourist volume was positive and statistically significant during the pandemic, but this effect was negative in the pre-and post-pandemic periods from the perspective of city networks. As evidence, Zhangzhou is experiencing rapid tourism development, despite the interruptions associated with the pandemic, and may not need to rely on city networks in the post-pandemic period. It also indicates that the tourism spatial distribution in the Fujian province was relatively independent, making the regional industrial structure have a statistically significant and negative effect during the pandemic, but not in pre- or post-pandemic periods.
In line with previous research, transport accessibility had a positive effect on economic interactions and city networks in the pre- and post-pandemic periods [30] (Wang et al., 2020). However, greater transport accessibility is associated with weaker COVID-19 prevention/controls and restrictions [44] (Yang et al., 2021). This in turn has been shown to weaken tourism links between cities because people are more likely to take long-distance travel in the global context [10] (Gössling et al., 2021). Similarly, city tourism brand awareness significantly contributed to the city networks pre-pandemic, but its impact was statistically significant and negative during and after the pandemic due to travel restrictions [45] (Borkowski et al., 2021). It appears to contradict the positive impact of tourism resources and city brand market performance in the post-pandemic period, suggesting the authorities consider tourism resource development as a whole instead of independent city brand promotions and marketing activities.

6. Implications

6.1. Theoretical Implications

This research utilizes the modified gravity model to explore the social network of tourism across cities in the Fujian Province, China. It found that tourism spatial distribution was widely dispersed, with uneven and relatively independent tourism development in different cities. The findings also showed that tourism connection across cities was significantly reduced after the pandemic. This study contributes to the existing literature on the modified gravity model and social network analysis. It also sheds some light on the scope and structure of the spatial network of city tourism before, during, and after the COVID-19 pandemic. Specifically, this paper is one of the first attempts to examine the impacts of the COVID-19 pandemic on the structure of the tourism spatial network from the perspective of a three-phase period: pre-pandemic, present-pandemic, and post-pandemic. This study extends the modified gravity model to handle the pandemic impacts from 2019 to 2021, which are also of great value to enrich the gravity framework in tourism.
This study focuses on social network analysis at the city level, also enriching the literature on tourism spatial networks across cities. The spatial network structure of city tourism proved to be both complex and dynamic: the results of the cohesive subgroup analysis highlight the different compositions of cities during the pandemic, compared to the pre-pandemic and post-pandemic periods. One plausible explanation for this is that COVID-19 induced temporary changes in tourism links between cities. These findings expand the research scope of the tourism spatial networks and enrich the literature on destination marketing and management with the pandemic impacts.

6.2. Practical Implications

This research found that the tourism spatial distribution in the Fujian province was relatively dispersed, and tourism development in each city was independent, occurring with few (or little) interactions across cities. These findings have industrial implications for the balanced tourism development of the destinations. Specifically, previous research found that the weak links between cities indicate a need to reduce administrative boundaries, break down barriers, expand the tourism economic exchange, form close city networks, promote the tourist flow between cities, and encourage cooperation across cities [46] (Gao, Peng, Lu, & Claramunt, 2022). Thus, related policies should be introduced to help cities work together to build sustainable networks of tourism development [47] (Rastegar & Ruhanen, 2022).
The impacts of brand awareness and transport accessibility were positive pre-pandemic but negative during the pandemic. In contrast, tourist volume was negative pre-pandemic but was positive during the pandemic. Possible explanations for this include the friction of distance, the spillover effect of tourist volume, and the pandemic-related travel restrictions. Furthermore, tourism resources and market performance had significantly positive impacts on tourism spatial distribution in the post-pandemic period. Destinations need interactions between cities, such as sharing tourist volume, tourism resources, and infrastructure, to achieve sustainable tourism development [48] (Wang, Huang, Gong, & Cao, 2020). In this way, the tourism links across cities could be strengthened, and balanced tourism spatial networks could be gradually formed [49] (Xiao, 2022). To promote sustainable and high-quality tourism development, cities in different positions should collaborate and differentiate tourism marketing promotions according to their tourism resources and specific characteristics [1] (Wang & Ye, 2022).
The findings in this study help to promote the balanced and high-quality development of tourism [1] (Wang & Ye, 2022). In the spatial distribution network of the tourism economy in Fujian Province, cities have different positions and roles, so development strategies should be differentiated according to the characteristics of each city. For example, more policies should be introduced to help the tourism development of the cities with disadvantages [47] (Rastegar & Ruhanen, 2022). Furthermore, they should also fully explore the quality tourism resources of each city, integrate resources as well as complementary advantages, promote the sharing of tourism resources between cities, form a resource linkage situation, strengthen the tourism economic ties between cities, and jointly contribute to the development of urban tourism [50] (Xie, Meng, Cenci, & Zhang, 2022). In addition, resources are the influencing elements of the spatial network of the tourism economy after the epidemic, so it is necessary to pay attention to the development and utilization of urban tourism resources and make full use of the tourism resources to promote the development of the tourism economy. Specifically, the provincial government should coordinate the tourism cooperation between various cities by formulating tourism development plans. The government also needs to introduce supportive policies, such as the establishment of tourism cooperation funds, to provide financial support. Cities may develop tourism products with local characteristics and enhance their diversity and attractiveness.

6.3. Limitations and Future Research Directions

The maximum gravitational value of the city tourism economy in the Fujian province from 2019 to 2021 was measured using the modified gravity model. The tourism spatial distribution, the network characteristics, and the clustering structure characteristics were examined using Ucinet 6. Further, QAP regression analysis was conducted to assess the influencing factors of the tourism spatial distribution and compare their impacts in the three-phase period: pre-pandemic, present-pandemic, and post-pandemic. This research found that geospatial proximity was the most influential factor of the tourism spatial distribution in the three-phase period before, during, and after the pandemic. However, the impacts of tourism resources and city brand market performance on the tourism spatial distribution fluctuated due to the pandemic. Therefore, attention needs to be paid to the utilization of tourism resources and city brand market performance in promoting tourism development across cities.
Although this paper employed social network analysis to compare the differences in the three-phase period, more comprehensive analyses regarding the impacts of the COVID-19 pandemic could be conducted in the future when detailed micro-data become available. Additionally, city tourism brand awareness also needs to be fully examined to jointly promote coordinated tourism development across cities [50] (Xie, Meng, Cenci, & Zhang, 2022). Since regions, countries, and areas have various natural and cultural characteristics and features, future studies may consider developing general theories regarding tourism spatial distribution to inform industry practices in tourism destination management and marketing.

Author Contributions

Conceptualization, H.S.; Methodology, W.Z.; Investigation, W.Z.; Resources, H.S.; Writing—original draft, H.S.; Writing—review & editing, W.Z. and J.M.C.; Supervision, E.M. All authors have read and agreed to the published version of the manuscript.

Funding

This study was funded by Huaqiao University High-level Scholars Foundation (Grant No. 21SKBS003).

Data Availability Statement

Data is contained within the article.

Acknowledgments

We thank the funder for the financial support of the data collection.

Conflicts of Interest

The authors declare no conflict of interest.

References

  1. Wang, G.; Ye, L. Spatial-temporal pattern of mismatch degree of high-quality tourism development and its formation mechanism in Taihu lake basin, China. Sustainability 2022, 14, 4812. [Google Scholar] [CrossRef]
  2. Pascariu, G.C.; Ibănescu, B.C. Determinants and implications of the tourism multiplier effect in EU economies. Towards a core-periphery pattern? Amfiteatru Econ. 2018, 20, 982–997. [Google Scholar] [CrossRef]
  3. Wen, J.; Kozak, M.; Yang, S.; Liu, F. COVID-19: Potential effects on Chinese citizens’ lifestyle and travel. Tour. Rev. 2021, 76, 74–87. [Google Scholar] [CrossRef]
  4. Zhong, L.; Sun, S.; Law, R.; Li, X. Tourism crisis management: Evidence from COVID-19. Curr. Issues Tour. 2021, 24, 2671–2682. [Google Scholar] [CrossRef]
  5. Sigala, M. A bibliometric review of research on COVID-19 and tourism: Reflections for moving forward. Tour. Manag. Perspect. 2021, 40, 100912. [Google Scholar] [CrossRef]
  6. Green, N. Functional polycentricity: A formal definition in terms of social network analysis. Urban Stud. 2007, 44, 2077–2103. [Google Scholar] [CrossRef]
  7. Qin, X.; Li, X.; Chen, W.; Tan, H.; Luo, L.; Xu, X. Tourists’ digital footprint: The spatial patterns and development models of rural tourism flows network in Guilin, China. Asia Pac. J. Tour. Res. 2022, 27, 1336–1354. [Google Scholar] [CrossRef]
  8. Qu, X.; Xu, G.; Qi, J.; Bao, H. Identifying the Spatial Patterns and Influencing Factors of Leisure and Tourism in Xi’an Based on Point of Interest (POI) Data. Land 2023, 12, 1805. [Google Scholar] [CrossRef]
  9. Zhang, X.; Han, H.; Tang, Y.; Chen, Z. Spatial Distribution Characteristics and Driving Factors of Tourism Resources in China. Land 2023, 12, 1029. [Google Scholar] [CrossRef]
  10. Gössling, S.; Scott, D.; Hall, C.M. Pandemics, tourism and global change: A rapid assessment of COVID-19. J. Sustain. Tour. 2021, 29, 1–20. [Google Scholar] [CrossRef]
  11. Vaishar, A.; Šťastná, M. Impact of the COVID-19 pandemic on rural tourism in Czechia Preliminary considerations. Curr. Issues Tour. 2022, 25, 187–191. [Google Scholar] [CrossRef]
  12. Bhuiyan, M.A.; Crovella, T.; Paiano, A.; Alves, H. A Review of Research on Tourism Industry, Economic Crisis and Mitigation Process of the Loss: Analysis on Pre, During and Post Pandemic Situation. Sustainability 2021, 13, 10314. [Google Scholar] [CrossRef]
  13. Li, J.; Nguyen, T.H.H.; Coca-Stefaniak, J.A. Understanding post-pandemic travel behaviours–China’s Golden Week. J. Hosp. Tour. Manag. 2021, 49, 84–88. [Google Scholar] [CrossRef]
  14. Ritchie, B.W.; Jiang, Y. A review of research on tourism risk, crisis, and disaster management: Launching the annals of tourism research curated collection on tourism risk, crisis and disaster management. Ann. Tour. Res. 2019, 79, 102812. [Google Scholar] [CrossRef]
  15. Fujian Provincial Bureau of Statistics. 2022. Available online: https://tjj.fujian.gov.cn/ (accessed on 1 May 2022).
  16. Anderson, J.E. The gravity model. Annu. Rev. Econ. 2011, 3, 133–160. [Google Scholar] [CrossRef]
  17. Nadal, J.R.; Gallego, M.S. Gravity models for tourism demand modeling: Empirical review and outlook. J. Econ. Surv. 2022, 36, 1358–1409. [Google Scholar] [CrossRef]
  18. Wang, S.; Qin, C.; Zhao, Y.; Zhao, J.; Han, Y. The Evolutionary Path of the Center of Gravity for Water Use, the Population, and the Economy, and Their Decomposed Contributions in China from 1965 to 2019. Sustainability 2023, 15, 9275. [Google Scholar] [CrossRef]
  19. Goh, C.; Li, H.; Li, M. A comparative analysis of domestic and international tourism spatial distribution: Trends and impacts. J. China Tour. Res. 2014, 10, 388–413. [Google Scholar] [CrossRef]
  20. Sun, Y.Y.; Hou, G.L. Analysis on the spatial-temporal evolution characteristics and spatial network structure of tourism eco-efficiency in the Yangtze river delta urban agglomeration. Int. J. Environ. Res. Public Health 2021, 18, 2577. [Google Scholar] [CrossRef]
  21. Wang, R.; Xia, B.; Dong, S.; Li, Y.; Li, Z.; Ba, D.; Zhang, W. Research on the Spatial Differentiation and Driving Forces of Eco-Efficiency of Regional Tourism in China. Sustainability 2021, 13, 280. [Google Scholar] [CrossRef]
  22. Wang, K.; Wang, M.; Gan, C.; Chen, Q.; Voda, M. Tourism economic network structural characteristics of national parks in the central region of China. Sustainability 2021, 13, 4805. [Google Scholar] [CrossRef]
  23. Otte, E.; Rousseau, R. Social network analysis: A powerful strategy, also for the information sciences. J. Inf. Sci. 2002, 28, 441–453. [Google Scholar] [CrossRef]
  24. Butts, C.T. Social network analysis: A methodological introduction. Asian J. Soc. Psychol. 2008, 11, 13–41. [Google Scholar] [CrossRef]
  25. Vance-Borland, K.; Holley, J. Conservation stakeholder network mapping, analysis, and weaving. Conserv. Lett. 2011, 4, 278–288. [Google Scholar] [CrossRef]
  26. Wang, Z.; Zhang, Z.; Jin, X. A study on the spatial network characteristics and effects of CDW generation in China. Waste Manag. 2021, 128, 179–188. [Google Scholar] [CrossRef] [PubMed]
  27. Kohler, H.-P.; Behrman, J.R.; Watkins, S.C. The density of social networks and fertility decisions: Evidence from South Nyanza district, Kenya. Demography 2001, 38, 43–58. [Google Scholar] [CrossRef] [PubMed]
  28. dos Muchangos, L.S.; Tokai, A.; Hanashima, A. Stakeholder analysis and social network analysis to evaluate the stakeholders of a MSWM system—A pilot study of Maputo City. Environ. Dev. 2017, 24, 124–135. [Google Scholar] [CrossRef]
  29. Gilbert, F.; Simonetto, P.; Zaidi, F.; Jourdan, F.; Bourqui, R. Communities and hierarchical structures in dynamic social networks: Analysis and visualization. Soc. Netw. Anal. Min. 2011, 1, 83–95. [Google Scholar] [CrossRef]
  30. Wang, Z.; Liu, Q.; Xu, J.; Fujiki, Y. Evolution characteristics of the spatial network structure of tourism efficiency in China: A province-level analysis. J. Destin. Mark. Manag. 2020, 18, 100509. [Google Scholar] [CrossRef]
  31. Khan, A. The spatial distribution and relationship of tourist flow in Turkey. Eur. J. Tour. Res. 2018, 19, 40–55. [Google Scholar] [CrossRef]
  32. Qi, J.; Lu, Y.; Han, F.; Ma, X.; Yang, Z. Spatial distribution characteristics of the rural tourism villages in the Qinghai-Tibetan plateau and its influencing factors. Int. J. Environ. Res. Public Health 2022, 19, 9330. [Google Scholar] [CrossRef]
  33. Bian, J.; Chen, W.; Zeng, J. Spatial distribution characteristics and influencing factors of traditional villages in China. Int. J. Environ. Res. Public Health 2022, 19, 4627. [Google Scholar] [CrossRef]
  34. Kladou, S.; Kehagias, J. Assessing destination brand equity: An integrated approach. J. Destin. Mark. Manag. 2014, 3, 2–10. [Google Scholar] [CrossRef]
  35. Gomez, M.; Fernandez, A.C.; Molina, A.; Aranda, E. City branding in European capitals: An analysis from the visitor perspective. J. Destin. Mark. Manag. 2018, 7, 190–201. [Google Scholar] [CrossRef]
  36. Gao, J.; Shao, C.; Chen, S. Evolution and driving factors of the spatiotemporal pattern of tourism efficiency at the provincial level in China based on SBM-DEA model. Int. J. Environ. Res. Public Health 2022, 19, 10118. [Google Scholar] [CrossRef]
  37. Li, S.; Ren, T.; Jia, B.; Zhong, Y. The spatial pattern and spillover effect of the eco-efficiency of regional tourism from the perspective of green development: An empirical study in China. Forests 2022, 13, 1324. [Google Scholar] [CrossRef]
  38. Park, C.; Kim, Y.-R.; Yeon, J. Stronger together: International tourists “spillover” into close countries. Tour. Econ. 2022, 29, 13548166221098320. [Google Scholar] [CrossRef]
  39. Nogle, J.M. The systems approach to international migration: An application of network analysis methods. Int. Migr. 1994, 32, 329–342. [Google Scholar] [CrossRef]
  40. Seok, H.; Barnett, G.A.; Nam, Y. A social network analysis of international tourism flow. Qual. Quant. 2021, 55, 419–439. [Google Scholar] [CrossRef]
  41. Burkard, R.E. Quadratic assignment problems. Eur. J. Oper. Res. 1984, 15, 283–289. [Google Scholar] [CrossRef]
  42. Gao, K.; Yang, Y.; Li, A.; Qu, X. Spatial heterogeneity in distance decay of using bike sharing: An empirical large-scale analysis in Shanghai. Transp. Res. Part D Transp. Environ. 2021, 94, 102814. [Google Scholar] [CrossRef]
  43. Jeon, C.-Y.; Yang, H.-W. The structural changes of a local tourism network: Comparison of before and after COVID-19. Curr. Issues Tour. 2021, 24, 3324–3338. [Google Scholar] [CrossRef]
  44. Yang, Y.; Cao, M.; Cheng, L.; Zhai, K.; Zhao, X.; De Vos, J. Exploring the relationship between the COVID-19 pandemic and changes in travel behaviour: A qualitative study. Transp. Res. Interdiscip. Perspect. 2021, 11, 100450. [Google Scholar] [CrossRef]
  45. Borkowski, P.; Jażdżewska-Gutta, M.; Szmelter-Jarosz, A. Lockdowned: Everyday mobility changes in response to COVID-19. J. Transp. Geogr. 2021, 90, 102906. [Google Scholar] [CrossRef]
  46. Gao, J.; Peng, P.; Lu, F.; Claramunt, C. A multi-scale comparison of tourism attraction networks across China. Tour. Manag. 2022, 90, 104489. [Google Scholar] [CrossRef]
  47. Rastegar, R.; Ruhanen, L. The injustices of rapid tourism growth: From recognition to restoration. Ann. Tour. Res. 2022, 97, 103504. [Google Scholar] [CrossRef]
  48. Wang, J.; Huang, X.; Gong, Z.; Cao, K. Dynamic assessment of tourism carrying capacity and its impacts on tourism economic growth in urban tourism destinations in China. J. Destin. Mark. Manag. 2020, 15, 100383. [Google Scholar] [CrossRef]
  49. Xiao, Y. Integrated development of the Yangtze river delta region: Status, problems and optimization. Stud. Soc. Sci. Humanit. 2022, 1, 26–30. [Google Scholar] [CrossRef]
  50. Xie, Y.; Meng, X.; Cenci, J.; Zhang, J. Spatial pattern and formation mechanism of rural tourism resources in China: Evidence from 1470 national leisure villages. ISPRS Int. J. Geo-Inf. 2022, 11, 455. [Google Scholar] [CrossRef]
Figure 1. Nine prefecture-level cities in the Fujian province.
Sustainability 16 03162 g001
Figure 2. Cohesive subgroups in 2019 and 2021.
Sustainability 16 03162 g002
Figure 3. 2020 cohesive subgroups.
Sustainability 16 03162 g003
Table 1. Measurements of observed variables.
VariableInterpretationIndex
Tourist volume [31] (Khan, 2018)The number of tourist visits received by the city in a year.Difference matrix of total tourism recipients in a year.
Tourism resources [32] (Qi, Lu, Han, Ma, & Yang, 2022)The variety and quality of tourism resources affect destination attractiveness, which in turn affects the traveler’s decision-making.The number of scenic spots above 4A in a city accounts for a matrix of differences in the number of scenic spots above 4A in the province in a year.
Transport accessibility [33] (Bian, Chen, & Zeng, 2022)Accessibility influences tourists’ choice of destinations and travel decisions and also affects cross-regional cooperation between cities.Difference matrix of the ratio of highway miles to the urban area in a year (square kilometers).
City brand market performance [34] (Kladou & Kehagias, 2014)The market value of the city’s tourism brand and its potential for future development.Difference matrix of the ratio of city tourist volume to provincial one in a year.
City tourism brand awareness [35] (Gomez, Fernandez, Molina, & Aranda, 2018). The higher the city’s tourism brand awareness, the more likely it is that the city and its attractions are chosen by tourists.Baidu index of cities and 5A scenic spots in a year
Infrastructure levels [36] (Gao, Shao, & Chen, 2022)The level of infrastructure determines the city’s tourism carrying capacity.Difference matrix of the number of urban accommodation businesses in a year.
Regional industrial structures [37] (Li, Ren, Jia, & Zhong, 2022)The differences in regional industrial structure characterize the complementarity of tourism development between regions. The greater the differences in regional industrial structure, the greater the complementarity of the tourism industry between cities, and the greater the likelihood of generating tourism linkages.Difference matrix of the ratio of the service sector value added to GDP in a year.
Geospatial proximity [38] (Park, Kim, & Yeon, 2022)Geographically closer regions are more likely to have strong linkages, so geospatial proximity is an important factor influencing the spatial distribution of the inter-regional tourism economy.Takes a value of 1 if the cities are geospatially contiguous, and 0 otherwise.
Table 2. Summary of main variables.
Index MaxMinAveNo. of Obs.
Tourist volume 10,000.000 55.470 5071.779 9*3
Transport accessibility5535.320 126.600 806.049 9*3
City brand market performance0.527 0.027 0.111 9*3
City tourism brand awareness11,145.000 1492.000 3989.519 9*3
Infrastructure levels290.000 49.000 135.852 9*3
Regional industrial structures0.601 0.332 0.448 9*3
Tourism resources0.174 0.035 0.111 9*3
Geospatial proximity 1.000 0.000 0.481 72*3
Notes: all the data were collected from the Statistical yearbook and Fujian Provincial Bureau of Statistics. The index data were calculated based on the instructions in Table 1, and the gravitational value was calculated via the modified gravity model below.
Table 3. Maximum gravitational value of a city to other cities.
City201920202021
Sum-gMax-CityMax-gSum-gMax-CityMax-gSum-gMax-CityMax-g
Fuzhou4190.546 Ningde1373.721 3265.251 Putian769.655 3169.855 Ningde911.439
Xiamen9154.398 Quanzhou 4065.512 7059.328 Zhangzhou3461.616 9314.218 Zhangzhou5097.084
Putian543.605 Fuzhou241.616 1127.990 Fuzhou452.521 909.462 Fuzhou358.152
Sanming644.887 Longyan160.212 511.885 Nanping199.148 931.301 Nanping323.723
Quanzhou 5215.985 Xiamen3310.902 3395.316 Xiamen2022.583 3983.433 Xiamen2477.352
Zhangzhou15,160.711 Xiamen11,462.229 3054.102 Xiamen2523.225 4562.779 Xiamen3792.476
Nanping712.361 Fuzhou254.450 963.762 Fuzhou310.554 980.060 Fuzhou329.364
Longyan2741.379 Xiamen1338.962 794.973 Xiamen324.535 1087.574 Xiamen446.074
Ningde1264.865 Fuzhou961.160 703.643 Fuzhou446.998 1043.898 Fuzhou677.907
Notes: Sum-g is the sum of the gravitational values exerted by the city on other cities; Max-City is the one whose city exerts the largest gravitational value on other cities; Max-g is the gravitational value between the city and the Max-City.
Table 4. Overall network characteristics.
Index201920202021
Network density0.1250.1250.125
Degree centrality0.2780.2550.267
Network correlation111
Network hierarchy000
Table 5. Degree centrality in the Fujian province.
City 201920202021
Degree CentralityBenefit Degree CentralityBenefit Degree CentralityBenefit
Xiamen 2.504No2.497No2.581No
Fuzhou 2.152No1.775No1.790No
Quanzhou 1.431No1.113No1.095No
Longyan 1.000No0.312Yes0.361Yes
Ningde 0.561Yes0.444Yes0.547Yes
Nanping 0.484Yes0.990Yes0.925Yes
Zhangzhou 0.385Yes0.962Yes1.123No
Sanming 0.296Yes0.290Yes0.290Yes
Putian 0.186Yes0.617Yes0.433Yes
Indegree1 1 1
Table 6. Density matrix and like matrix.
2019 Density matrixLike matrix
1234 1234
10.5440.2010.0540.04711100
20.0530.0640.0240.01620000
30.0640.1100.0970.28630001
40.1030.1390.626 4011
R2 = 0.744
2020Density matrixLike matrix
1234 1234
10.2630.1250.0450.03411100
20.0810.2660.0360.02420100
30.0650.0670.0920.28330001
40.1170.1580.610 4011
R2 = 0.629
2021Density matrixLike matrix
1234 1234
10.4680.1860.0380.02911100
20.0960.0950.0330.02020000
30.0470.0890.1030.29430001
40.1030.1710.621 4011
R2 = 0.682
Note: Network density = 0.125.
Table 7. Results of the QAP.
Variables201920202021
βpΒpβp
Geospatial proximity characteristics0.482 ***0.0020.513 ***0.0010.498 ***0.000
Regional industrial structures−0.1420.201−0.173 **0.0210.0040.464
Infrastructure levels−0.209 *0.051−0.361 ***0.0010.0580.341
Tourism resources0.0570.4850.0140.4970.001 ***0.000
City tourism brand awareness0.073 *0.091−0.224 **0.014−0.133 *0.058
City brand market performance0.0270.716−0.0031.0000.002 ***0.000
Tourist volume−0.168 **0.0220.333 ***0.000−0.3010.346
Transport accessibility0.016 **0.015−0.109 **0.0110.0690.176
R20.3900.3910.378
Notes: * p < 0.1, ** p < 0.05, *** p < 0.01.
Disclaimer/Publisher’s Note: The statements, opinions and data contained in all publications are solely those of the individual author(s) and contributor(s) and not of MDPI and/or the editor(s). MDPI and/or the editor(s) disclaim responsibility for any injury to people or property resulting from any ideas, methods, instructions or products referred to in the content.

