Abstract
This study examined the impact of using three types of in-store signage to educate consumers about packaging recyclability as well as to measure its effectiveness in increasing awareness of a store drop-off recycling method for packaged granola. A total of 67 shoppers were recruited and divided into two groups to shop for granola in a retail store. Group A was not exposed to signage near the granola, while Group B was exposed to the in-store signage comprising shelf strips and aisle invaders with How2Recycle educational information containing messaging about the store drop-off recycling. A store drop-off bin was positioned at the entrance of the testing environment for both groups. The results showed that Group B had a significantly higher total fixation duration (p = 0.02) and fixation count (p = 0.03) than Group A in response to the recycling instructions on the drop-off bin. When comparing the three methods of in-store signage—shelf strips, aisle invaders, and the printed store drop-off bin panels—the shelf strips performed the best with regard to total fixation duration (1.72 s) and fixation count (5.91 counts) and were noticed by the highest percentage of shoppers. The store drop-off bin panels had the best performance with regard to time to first fixation (0.12 s). The aisle invaders had the lowest performance in all three eye tracking key metrics and were noticed by the lowest percentage of participants. These responses illustrate shopper challenges related to plastic recycling. This study demonstrates that recycling information can be effectively provided through strategically positioned in-store signage, especially messaging on shelf strips. While consumers are open to the usage of Store Drop-off Bins, affirming customer knowledge of these processes is essential to develop new consumer recycling habits.
1. Introduction
As sustainability attracts more attention in the media, consumers are increasingly more aware of the environmental implications of their choices in daily life [1]. To reduce the burden on the environment in today’s world, there is a noticeable trend in consumer preferences toward more sustainable options in a variety of aspects with regard to their lifestyles [2,3]. From the food they eat to the clothing they wear, the sustainable expectations of consumers have grown substantially [1,4].
Consumer behavior plays a pivotal role in sustainability, particularly in an era marked by burgeoning populations and diminishing resources. Understanding the intricate relationship between consumer behavior and sustainability poses a significant challenge due to the multifaceted nature of both constructs. Consumer behavior studies must delve into factors such as needs, wants, and demands, alongside considerations of influencing factors, decision-making processes, and competitiveness. This multifaceted exploration is essential for gaining a holistic understanding of the dynamic interplay between consumer behavior and sustainability.
Numerous studies have investigated consumer behavior and its connection to sustainability, with researchers endeavoring to enhance the effectiveness of sustainability communication strategies targeted toward consumers through various approaches. Grebmer and Diefenbach’s study highlighted the effectiveness of verbal communication in reducing skepticism among highly environmentally conscious consumers, whereas nonverbal communication is more persuasive for low environmentally conscious consumers [5]. Acharya, Bali, and Bhatia highlighted the growing importance of sustainability in the beauty industry, stressing the shift toward eco-friendly options due to heightened consumer awareness of health and environmental issues, alongside the urgent requirement for businesses to prioritize environmental performance and manufacturing processes [6]. Buerke, Anja, et al. explored responsible consumption through a consumer-centric lens, proposing a two-dimensional framework and emphasizing the positive impact of consumer awareness and sustainability-focused values, advocating for effective communication strategies to promote responsible consumption [7].
Sustainability can be enhanced through various means, yet the role of packaging remains relatively unexplored in consumer behavior research. Given that consumer behavior significantly impacts post-product recycling, understanding consumer perceptions and intentions in the recycling process is crucial for advancing sustainability in retail. Packaging, as an essential part of almost every product in people’s daily life, plays an even more important role when it comes to the sustainability of products as a whole [8]. The rise in demand for sustainable packaging has prompted businesses to seek ways to improve their packaging’s sustainability, such as by reducing packaging materials or switching to more sustainable materials (recyclable, biodegradable, compostable, etc.).
While the search for sustainable packaging solutions is an ongoing process, some plastic pouches, bags, and wraps can still only be recycled through store drop-off programs because of their unique characteristics. Many plastic pouches and bags are made of a blend of polymers with add-on features such as metalized layers or inks [9]. The complexities of their structures could make it difficult to recycle them with other traditional plastic containers in many recycling facilities [9]. Plastic bags and wraps can also get tangled in the sorting machine, leading to a costly breakdown for recycling facilities; thus, standard recycling collectors often exclude plastic bags and wraps [9,10]. Moreover, some plastic pouches are designed to be recycled using a specific recycling system to ensure recycling efficiency. Therefore, store drop-off programs can be more effective in collecting those materials because they can target specific types of packaging that consumers generally return to their store location and know how to best avoid contamination with other types of packaging, increasing the chance of successful recycling.
Although store drop-off is widely available in many stores, the awareness of consumers regarding store drop-off programs is still an ongoing question. Do consumers know what packaging is acceptable in the store drop-off program at their local store? Are they aware that the packaging they used can be dropped off to recycle? Are they willing to return the packaging to the store drop-off bin? Have they ever noticed where the store drop-off bin is, and can they readily locate it in their local store? These are all questions that businesses and retailers assume consumers can answer. But do consumers really know the answers? It is important to understand the gap between assumed consumer knowledge and actual consumer awareness by conducting comprehensive research to gauge consumers’ attitudes and behavior regarding store drop-off programs. With this valuable information, retailers and brands can optimize their communication strategies and enhance consumer awareness and engagement with store drop-off programs.
In recent years, there has been a growing recognition of the potential of in-store signage as a powerful tool for conveying important information and influencing consumer behavior [11,12,13]. Kiran, et al., conducted a study using the signage of in-store promotions to test messaging about pricing, location, availability, helpful advice, targeted promotions, and more, which showed enhanced consumer self-service without waiting for a store associate [11]. As in-store signage has been commonly used as a place to provide information to consumers regarding products, pricing, and promotions [14,15,16], researchers are increasingly interested in using in-store signage to educate consumers on sustainability and store drop-off programs. This study not only investigated the above questions regarding consumers’ awareness of store drop-off programs but also tested the effectiveness of using in-store signage to educate consumers about such programs. The hypothesis is that, by strategically placing signs in the shopping environment, consumers will be more likely to pay attention and be aware of the store drop-off program and the drop-off bin at the exit of their local store.
2. Materials and Methods
2.1. Location and Participants
This study was conducted in collaboration with Package InSight by Quad and the GreenBlue Organization. It took place at Package InSight’s retail laboratory in Greenville, South Carolina. A total of 67 participants were recruited for the study, who were randomly divided into two groups: Group A (N = 33) and Group B (N = 34). To ensure that the participants had a genuine and relevant engagement level with the research topic, all participants were screened using the following screening criteria: (a) primary shopper in their household, (b) considerations of sustainability as an important factor when making purchasing decisions, and (c) had purchased granola (the target shopping category) in physical stores within the past 6 months.
The participant demographic comprised a total of 67 individuals aged 18 and above, exhibiting a broad spectrum of ages: 7.1% 18–25, 40.0% 26–34, 32.9% 35–44, 4.3% 45–49, 11.4% 50–65, and 4.3% 66+. In gender distribution, 71.4% identified as female, while 28.6% identified as male. Participants varied in educational backgrounds and household incomes, indicating comprehensive socioeconomic factors within the sample.
2.2. Eye-Tracking Apparatus
TobiiTM Eye Tracking Glasses 3 (manufactured by Tobii AB, Danderyd, Sweden) were used to record the eye movements of the participants at a sampling rate of 50 Hz. A TobiiTM recording device was connected to the glasses and used to collect eye-tracking data as videos with gaze movement, which were then transferred onto SD cards. TobiiTM Glasses 3 controller software (version 1.19.1) was used to guide the researcher through the calibration process and control the time of recording using the glasses.
2.3. Experimental Design and Test Variables
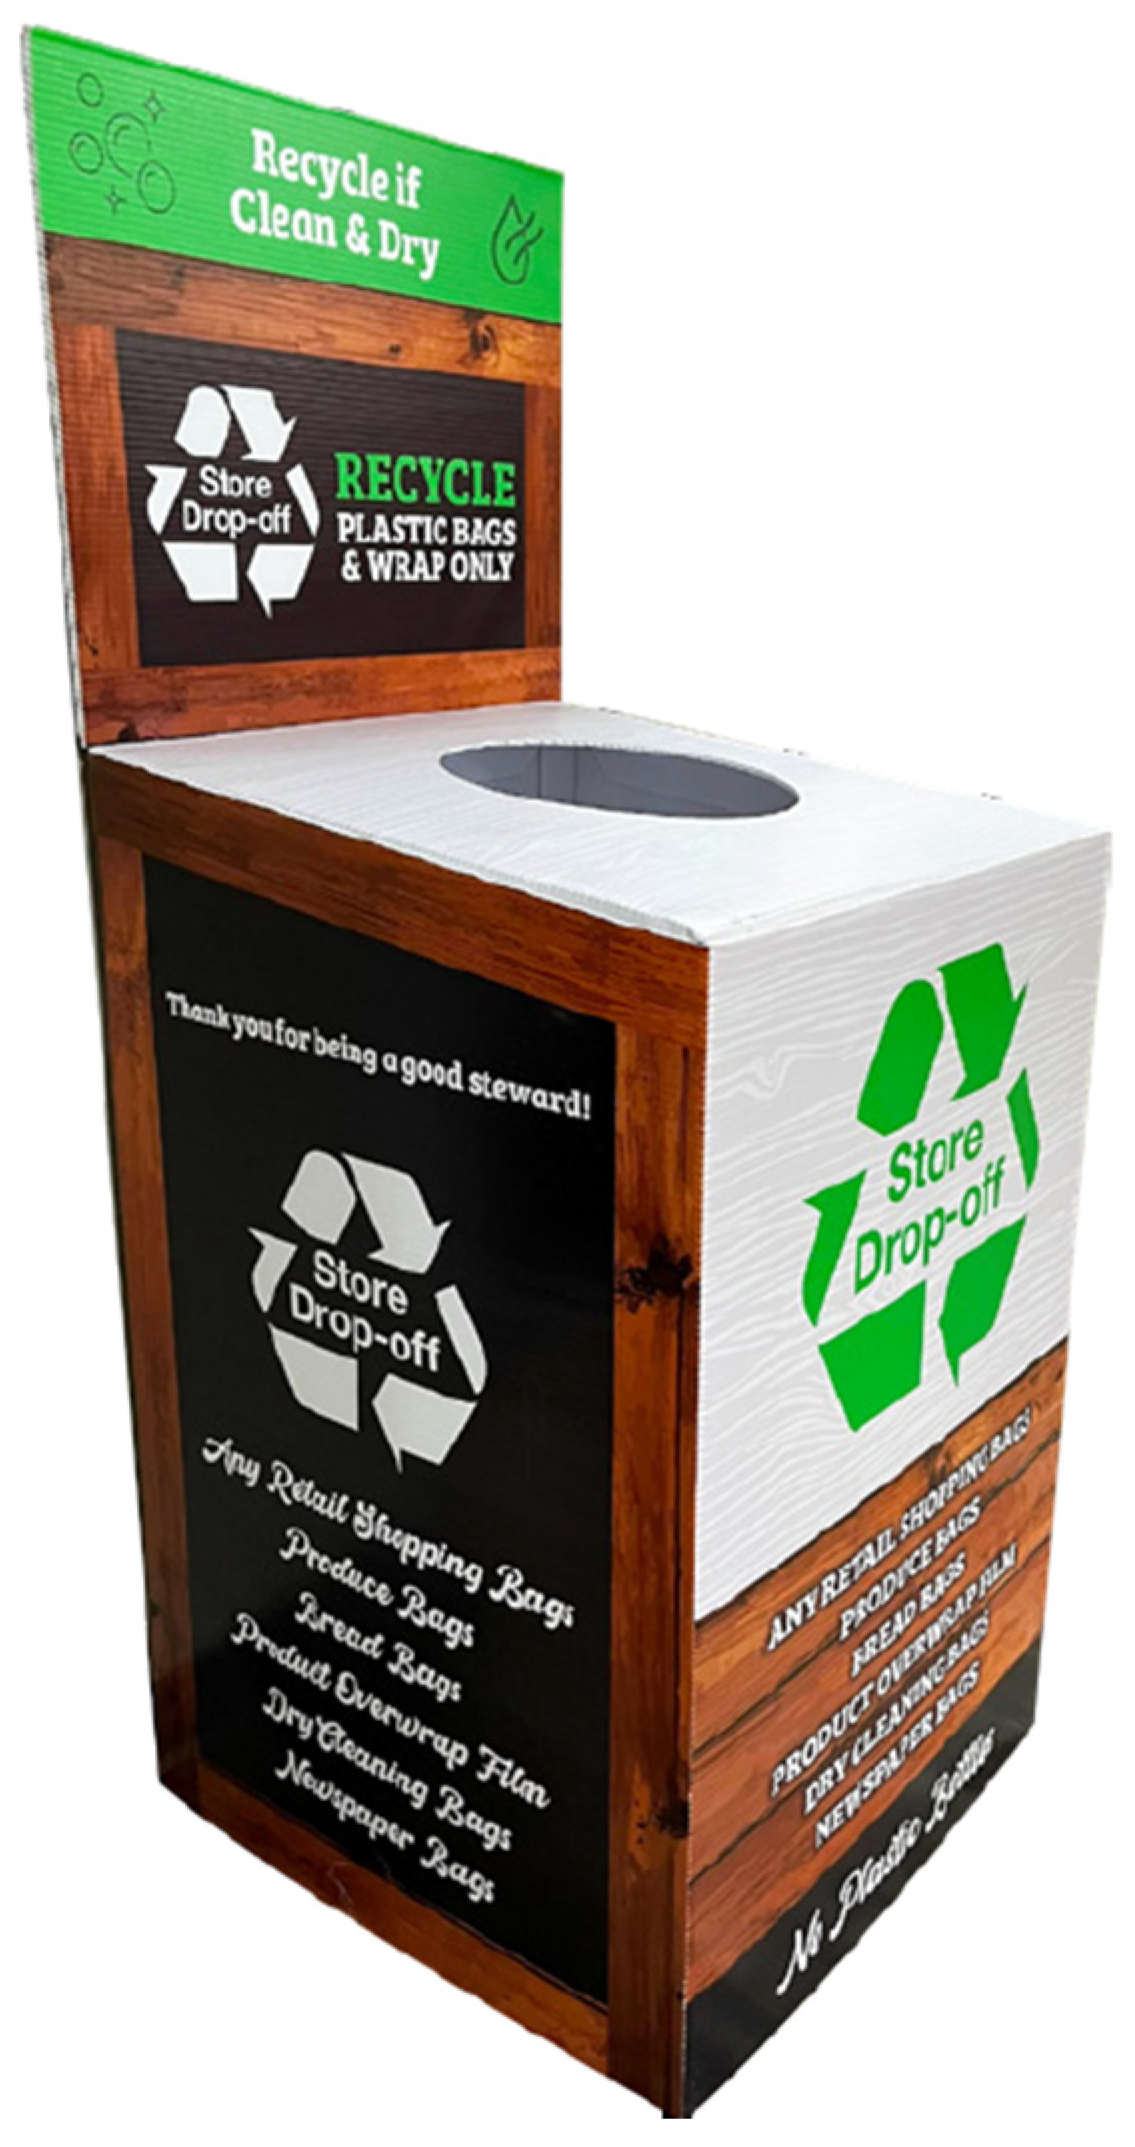
A granola planogram (Figure 1) was designed as the target shopping category and was set up in the retail laboratory along with other categories of planograms to provide a realistic shopping experience. Two types of on-shelf signage were utilized on the tested planogram. The first type was a shelf strip (Figure 2), which is horizontal directional signage that could be attached to the horizontal frame of each level of a product shelf. There were four shelf strips utilized in this study. The second type was the aisle invader (Figure 3), a vertical directional signage that can be attached to the side of the product shelf vertically. This allowed people passing by the aisle, even if they had not entered it, to see the aisle invader display from a side view of the aisle. A total of two aisle invaders were employed in this study. An entrance-facing store drop-off bin with signage printed on its panels (Figure 4) was strategically positioned within the retail laboratory’s vicinity and was accessible to both groups of participants.
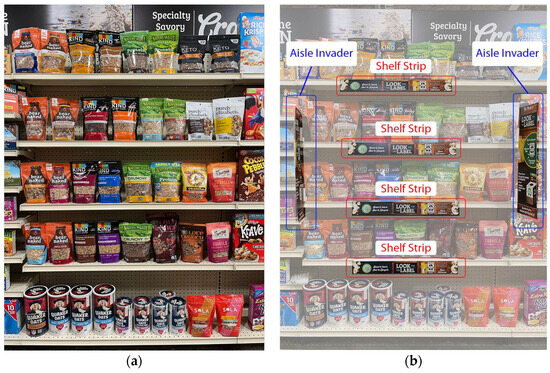
Figure 1.
Planograms (a) Group A without signage; (b) Group B with signage.

Figure 2.
Shelf strip.
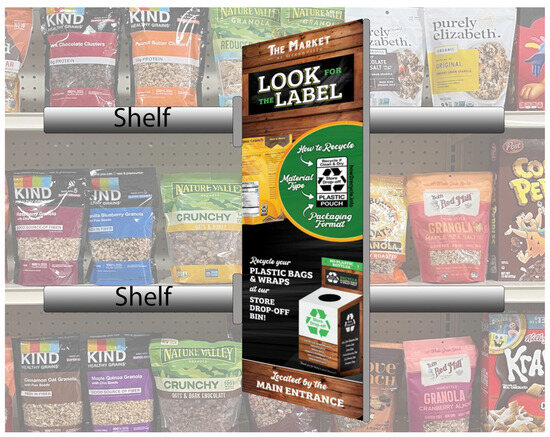
Figure 3.
Aisle invader.

Figure 4.
Store drop-off bin with printed panels.
The shelf strips measured approximately 3 inches in width and 24 inches in length, printing on one side only. The aisle invaders measured approximately 6 inches in width and 24 inches in length, with printing on both sides. Their graphic design consisted of four main elements, including: (a) a QR code that could be scanned to access recycling information for the plastic store drop-off pouches; (b) a message urging people to check for the label, an image of the backside of the product pouch along with recycling instructions; (c) a call to action encouraging individuals to recycle plastic bags and wraps at the store’s drop-off bin near the main entrance; (d) visuals of breakfast granola in order to blend in the overall theme of the tested granola planogram.
The store drop-off bin measured approximately 24 inches in width and depth, 51 inches in height. Its graphic design consisted of five main elements, including: (a) recycling instructions for the store drop-off bin: “Recycle plastic bags and wraps only”; (b) the contents placed in the bin were required to be “clean and dry”; (c) store drop-off icons; (d) a list of recyclable items; (e) additional text expressing appreciation for people’s efforts to recycle.
In the granola aisle, Group A conducted their shopping experience devoid of any in-store signage (Figure 1a), while Group B navigated the aisle in the presence of designated in-store signage (Figure 1b), including shelf strips and aisle invaders. Each participant received an identical shopping list and was instructed to proceed with their shopping in their customary manner. A store drop-off bin was placed at the entrance of the retail laboratory for both groups during the entire experiment.
2.4. Test Procedure
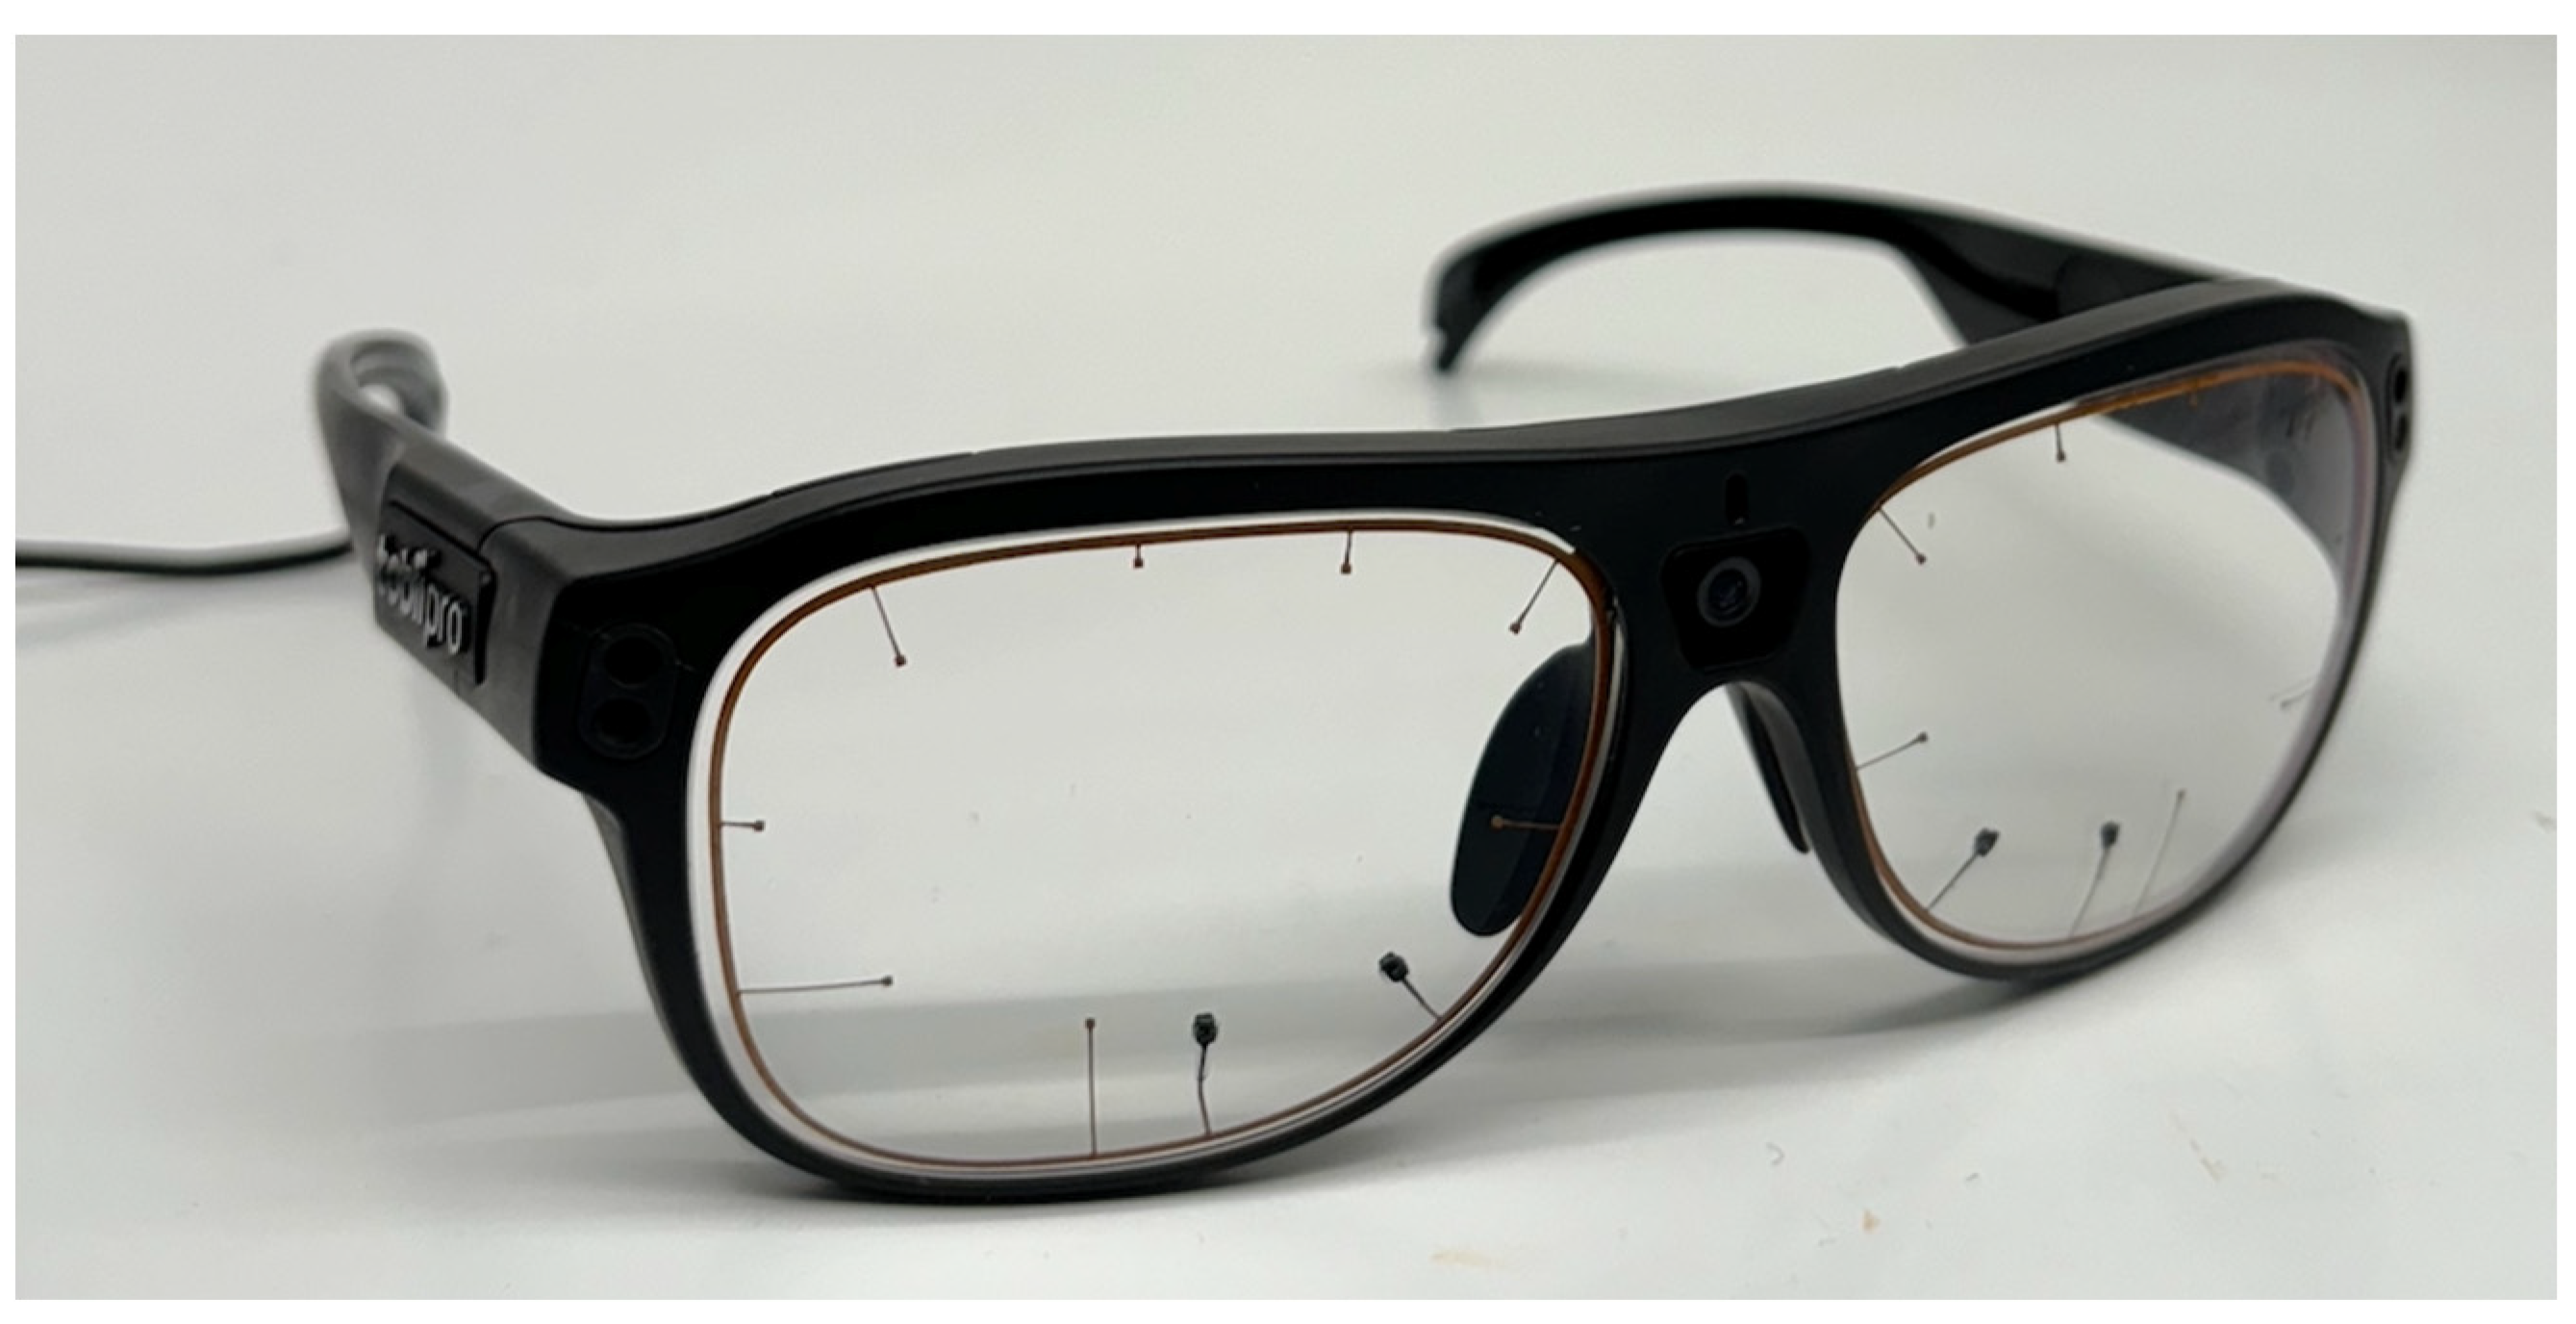
On the day of testing, participants were scheduled to visit the site of the retail lab located at Greenville, SC. Participants were given an explanation with the test instructions, along with a data collection consent form for them to review and provide their signature. Upon providing their consent for data collection, participants were then provided with a pre-survey to collect their demographic information. Once this was completed, participants were provided with a pair of eye-tracking glasses (Figure 5), and device calibration was performed by having participants wear the glasses while looking at a target at eye level on a wall from 20 to 40 inches away. Throughout this process, clear and detailed instructions were provided to participants to ensure their understanding and compliance. Additionally, any questions or concerns raised by participants were addressed promptly to maintain a comfortable and conducive testing environment.
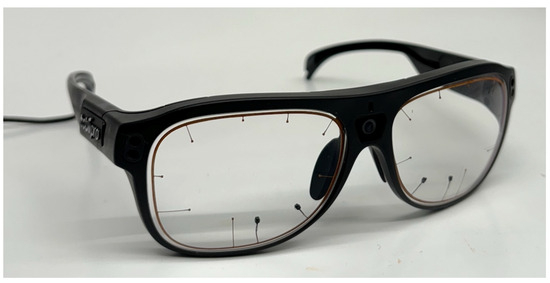
Figure 5.
Tobii Pro Glasses 3.
After the device calibration, participants received a shopping list to guide them on which product category they were assigned to shop for in the simulated grocery store. To provide a realistic shopping experience, there were four categories on the shopping list that participants needed to shop for, including macaroni and cheese, granola, tea bags, and chips. Although only the granola category served as the variable of interest for the study, participants were unaware of this fact, thus ensuring a naturalistic shopping experience devoid of bias. Participants were instructed to shop as they normally would in a retail store and record the product number of the products they wanted to purchase in each category on the shopping list. At the bottom of the shopping list, the participant numbers were recorded for later data processing purposes to track their purchasing decisions. The videos of all participants’ shopping experiences were recorded using the eye-tracking glasses and stored in the controller connected to the glasses for further analysis. These recordings covered the entire shopping journeys of all participants, ensuring that no aspect of the participants’ shopping experiences was overlooked, providing researchers with a rich and detailed dataset to inform subsequent analyses and conclusions.
2.5. Data Processing
The raw videos were captured from the shopping trip of each participant. These videos were stored in the SD cards in the controller of the glasses and were imported to Tobii Pro Lab for further analysis. The photos of the planogram shown to Groups A and B, as well as the photo of the store drop-off bin, were uploaded into the analysis software as snapshots for the videos to be coded from. The areas of interest (AOIs) could then be drawn in the snapshots to define where the data were generated from. An automatic video mapping process was used in combination with manual checking to ensure that the eye tracking data were correctly coded within the snapshots. Once the coding process was completed, the Excel files were exported from the analysis software.
Key metrics were used to examine the consumer’s attention: (a) Total Fixation Duration (TFD)—the average time, in seconds, spent by participants fixating on this item. The higher the number, the better the package performed; (b) Fixation Count (FC)—the total number of times a participant’s scan of the planogram crossed into a particular area. The higher the number, the better the package performed; (c) Time to First Fixation (TTFF)—the average time, in seconds, from when a product first enters a participant’s field of view until they fixate on it. The lower the number, the better the package performed. A fixation was counted when it lasted between 50–600 milliseconds. A short saccade between 20–40 milliseconds was not counted as a fixation.
2.6. Statistical Analysis
The raw eye tracking data collected using the Tobii Pro Lab were processed in RStudioTM to run the statistical analysis. The hypothesis regarding the relationship between the exposure to the sustainability information on signage and the consumers’ attention on the store drop-off bin was formulated as follows.
- Null hypothesis (H0): There is no significant difference in consumer attention and awareness of the store drop-off program and bin between groups exposed and not exposed to strategically placed signs in the shopping environment.
- Alternative hypothesis (Ha): Consumers exposed to strategically placed signs in the shopping environment exhibit greater attention and awareness of the store drop-off program and bin compared to those not exposed.
A Welch’s two-sample t-test was performed to compare the two group means to decide whether there were significant differences at a 95% confidence level.
3. Results
3.1. Eye-Tracking Results
The areas of interest (AOIs) of the store drop-off bin were defined as the areas of the entire drop-off bin as well as the recycling instructions on the drop-off bin using the Tobii Pro Lab. These claims included “Recycle if clean and dry” and “Recycle plastic bags and wraps”, etc. After defining each claim on the drop-off bin as an AOI in the Tobii Pro Lab, the key eye-tracking metrics of TTFF, TFD, and FC were generated and exported for each AOI. The key eye-tracking metrics of these AOIs of the store drop-off bin were averaged for the participants in Groups A and B.
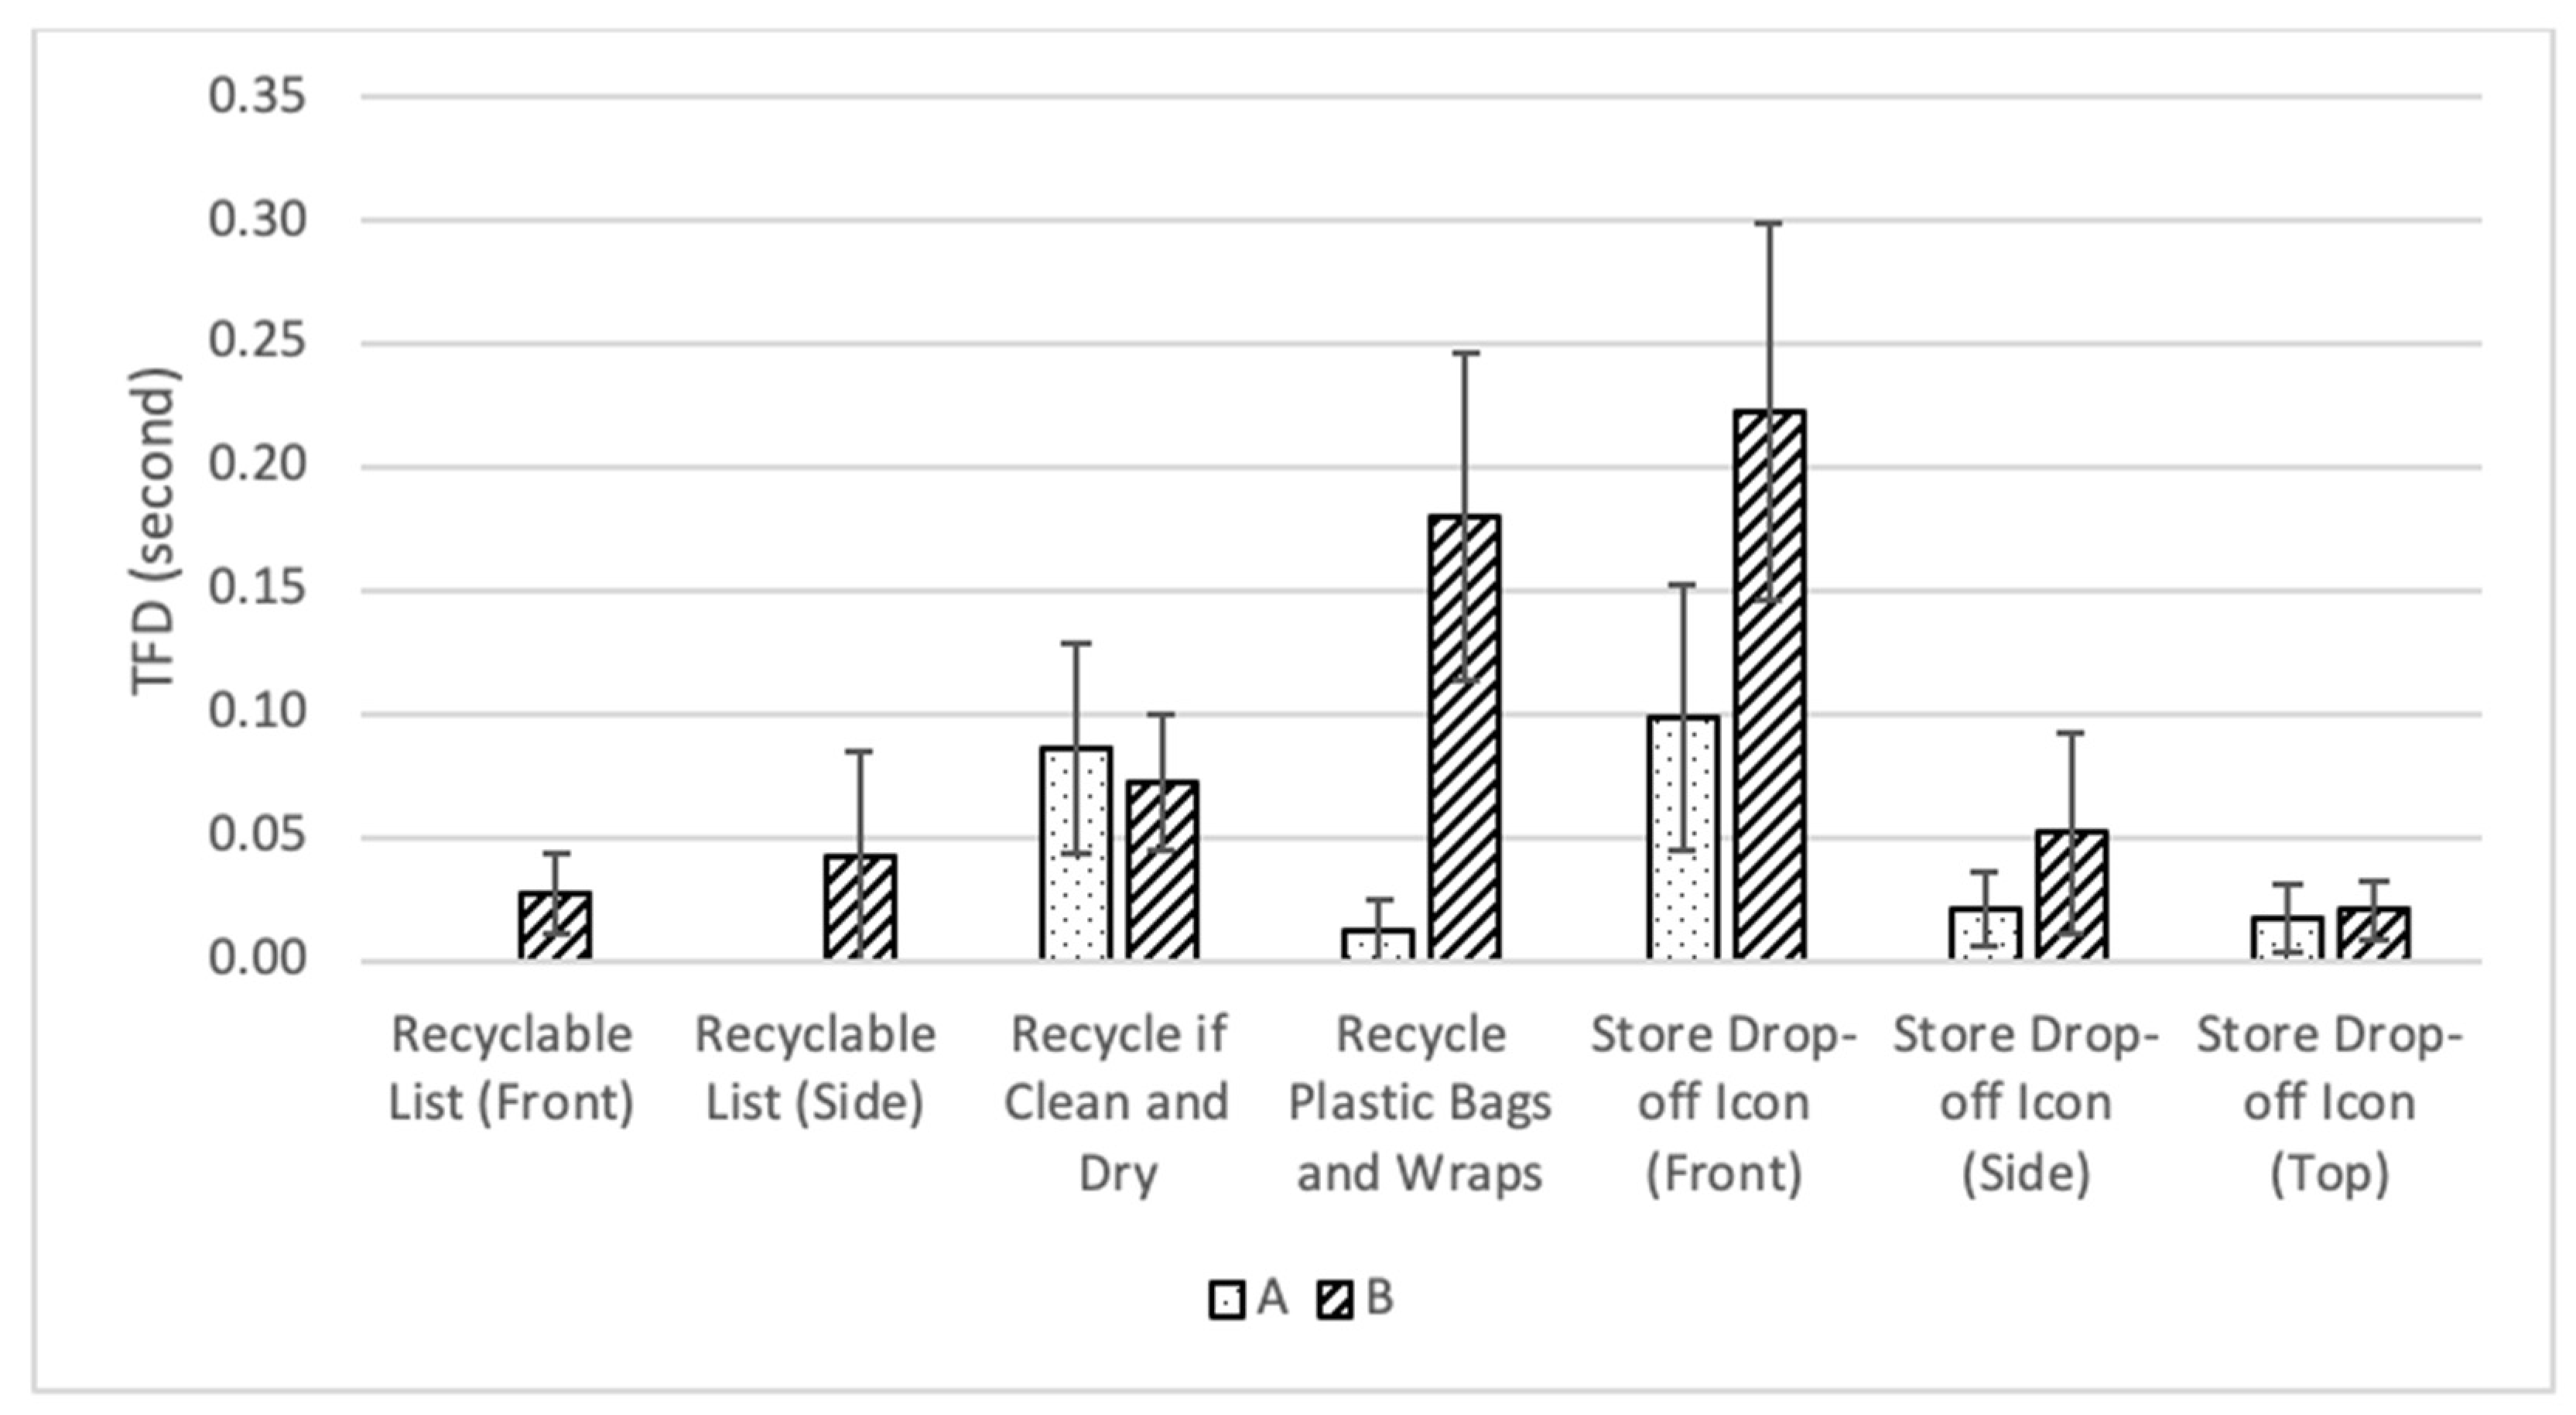
In the TFD results (Figure 6), the recycling instructions of “Recycle plastic bags and wraps” saw a significant increase in attention, rising from an average of 0.01 s in Group A to an average of 0.18 s in Group B. It was also observed that among all three locations of the store drop-off icons, the one on the front panel drew the highest attention from both Group A and Group B. These findings indicated that the total fixation duration from participants in Group B was notably heightened, particularly toward the recycling instructions and the store drop-off program icon. A high total fixation duration, indicating spending a longer time looking at an area, can represent increased cognitive processing or engagement with the elements within that area. It may suggest that participants are carefully examining details, processing information, or evaluating the significance of the features present.

Figure 6.
TFD for Recycle Bin Elements in Group A and Group B.
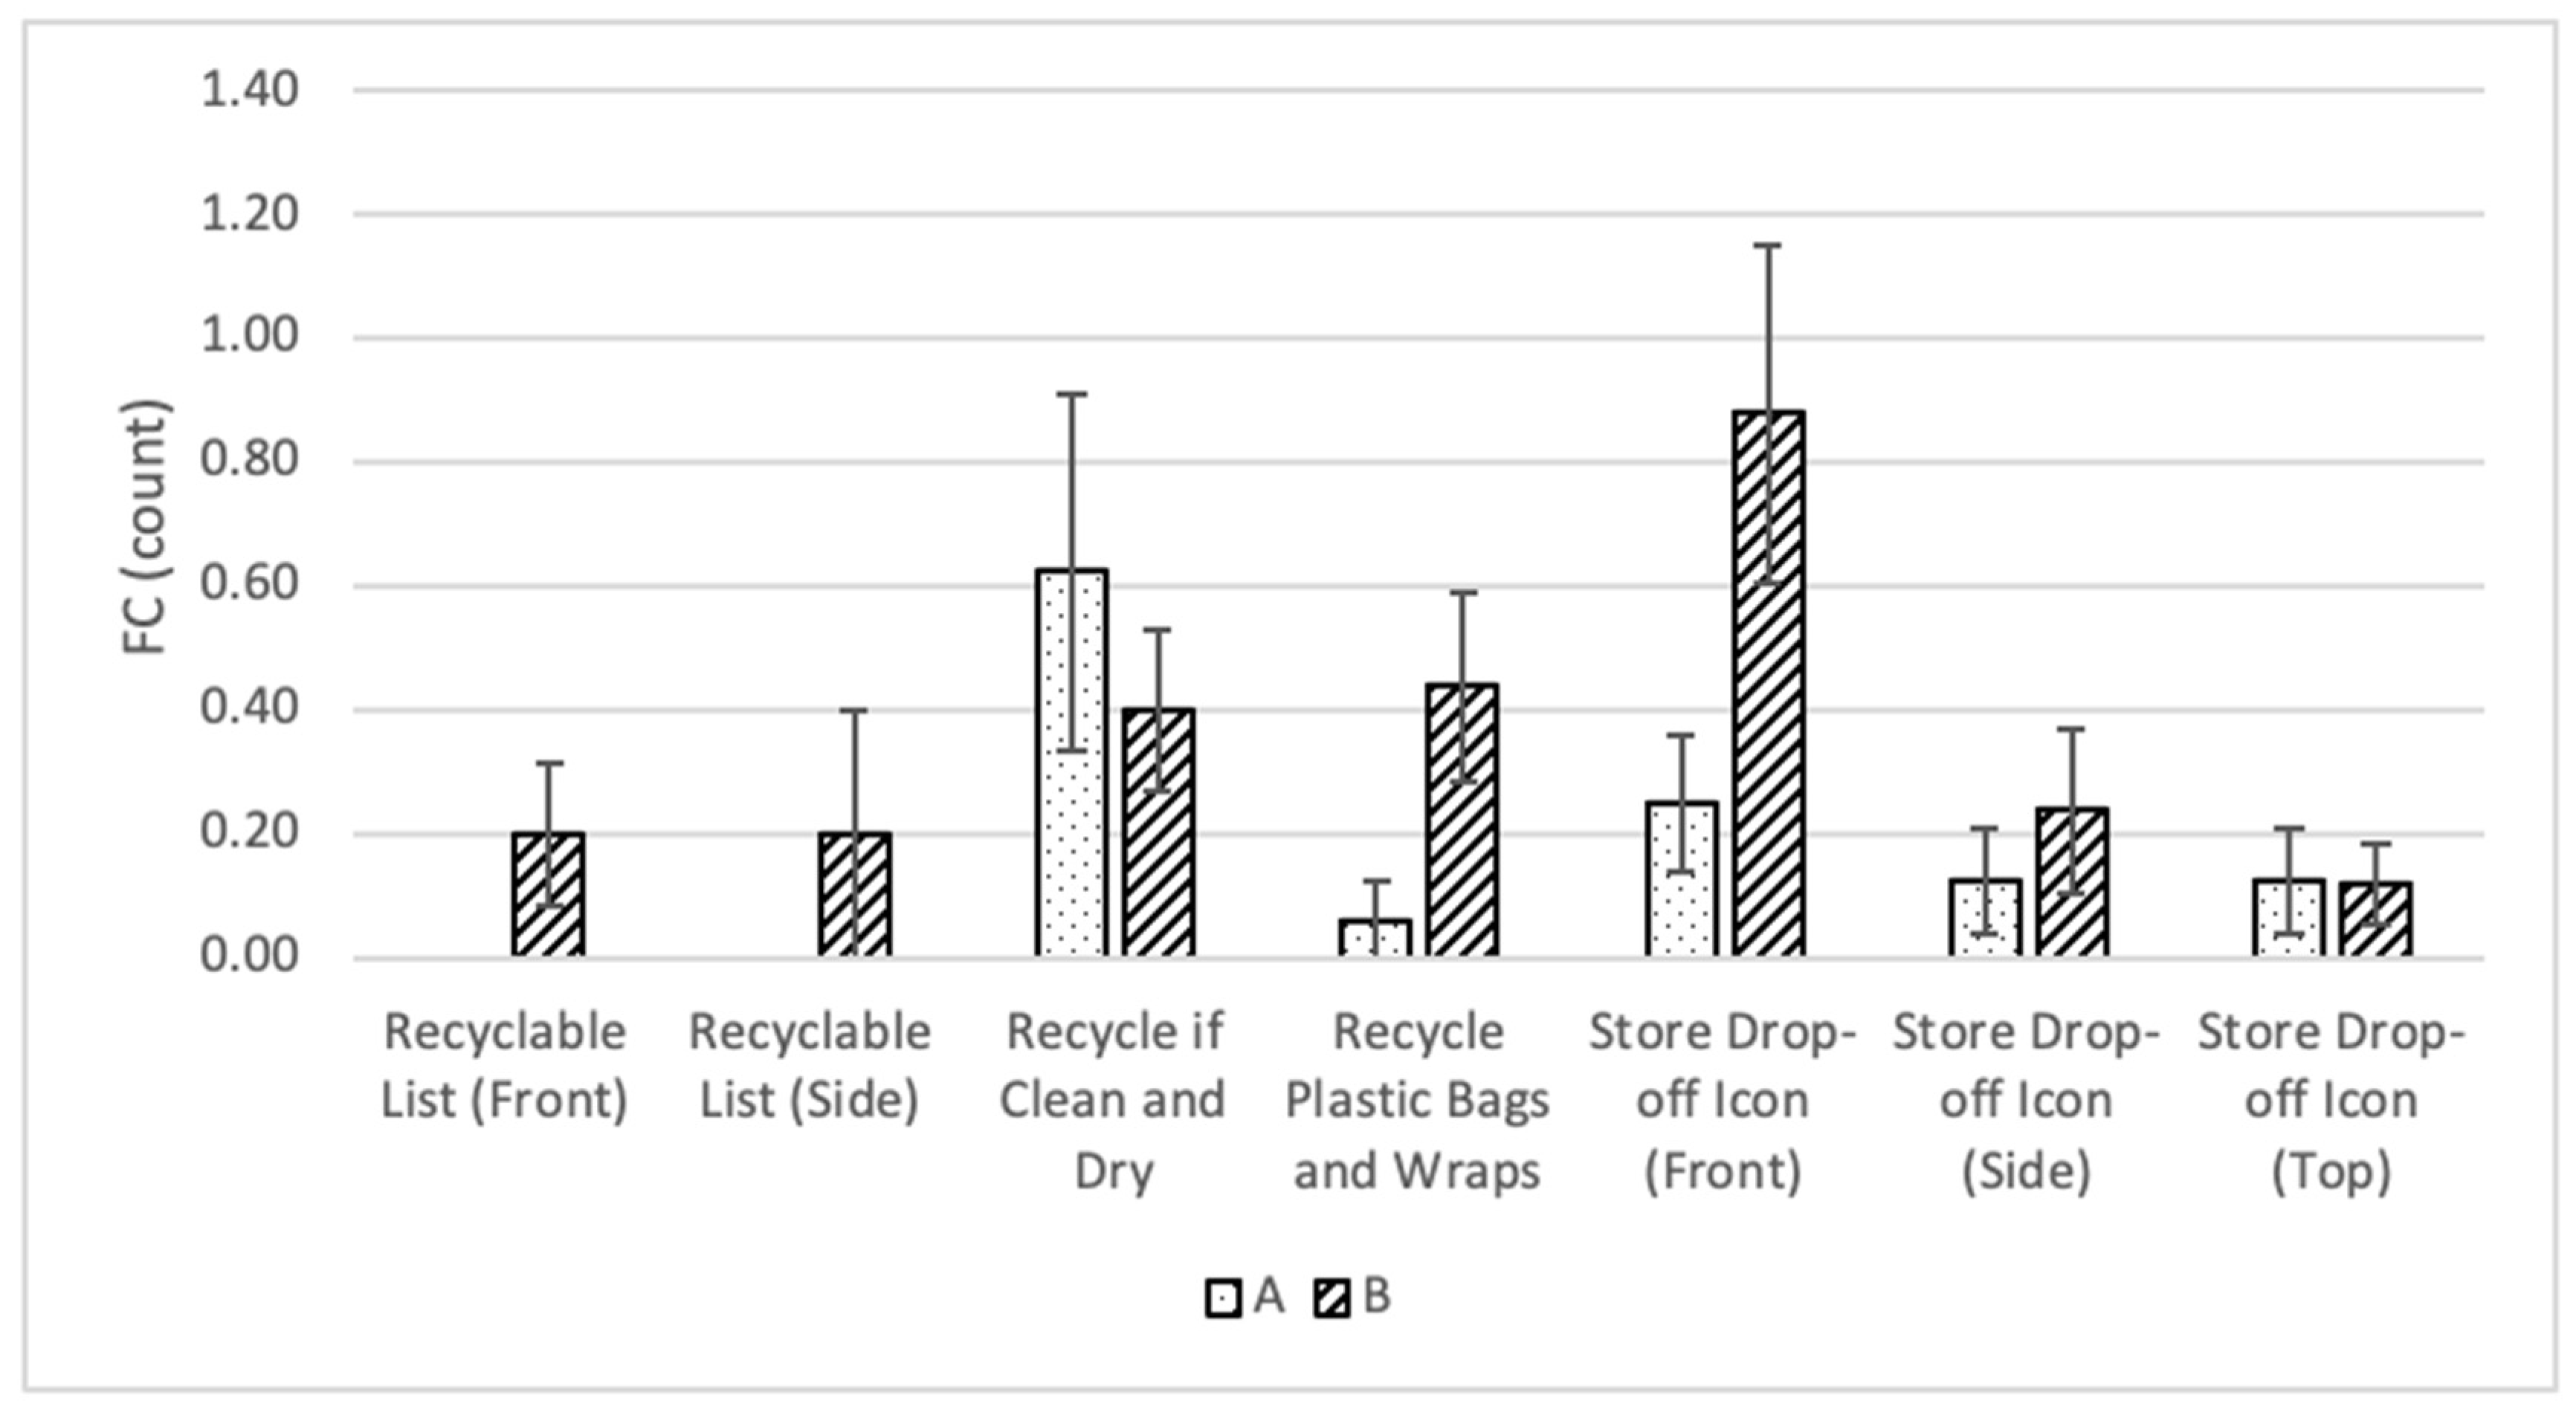
In the FC results (Figure 7), the recycling instruction of “Recycle plastic bags and wraps” had a significant increase in fixation count, rising from an average of 0.06 counts in Group A to an average of 0.44 counts in Group B. This indicates that participants in Group B paid more attention to this instruction and scanned the area more frequently along their visual path. A high fixation count, indicating frequent visual scanning of an area, can suggest increased attention or interest in the elements present within that area. It may imply that participants are actively processing information or focusing on specific features, potentially indicating relevance or importance. It was also observed that among all three locations of the store drop-off icons, the one on the front panel had the highest fixation count from both Group A and Group B.

Figure 7.
FC for Recycle Bin Elements in Group A and Group B.
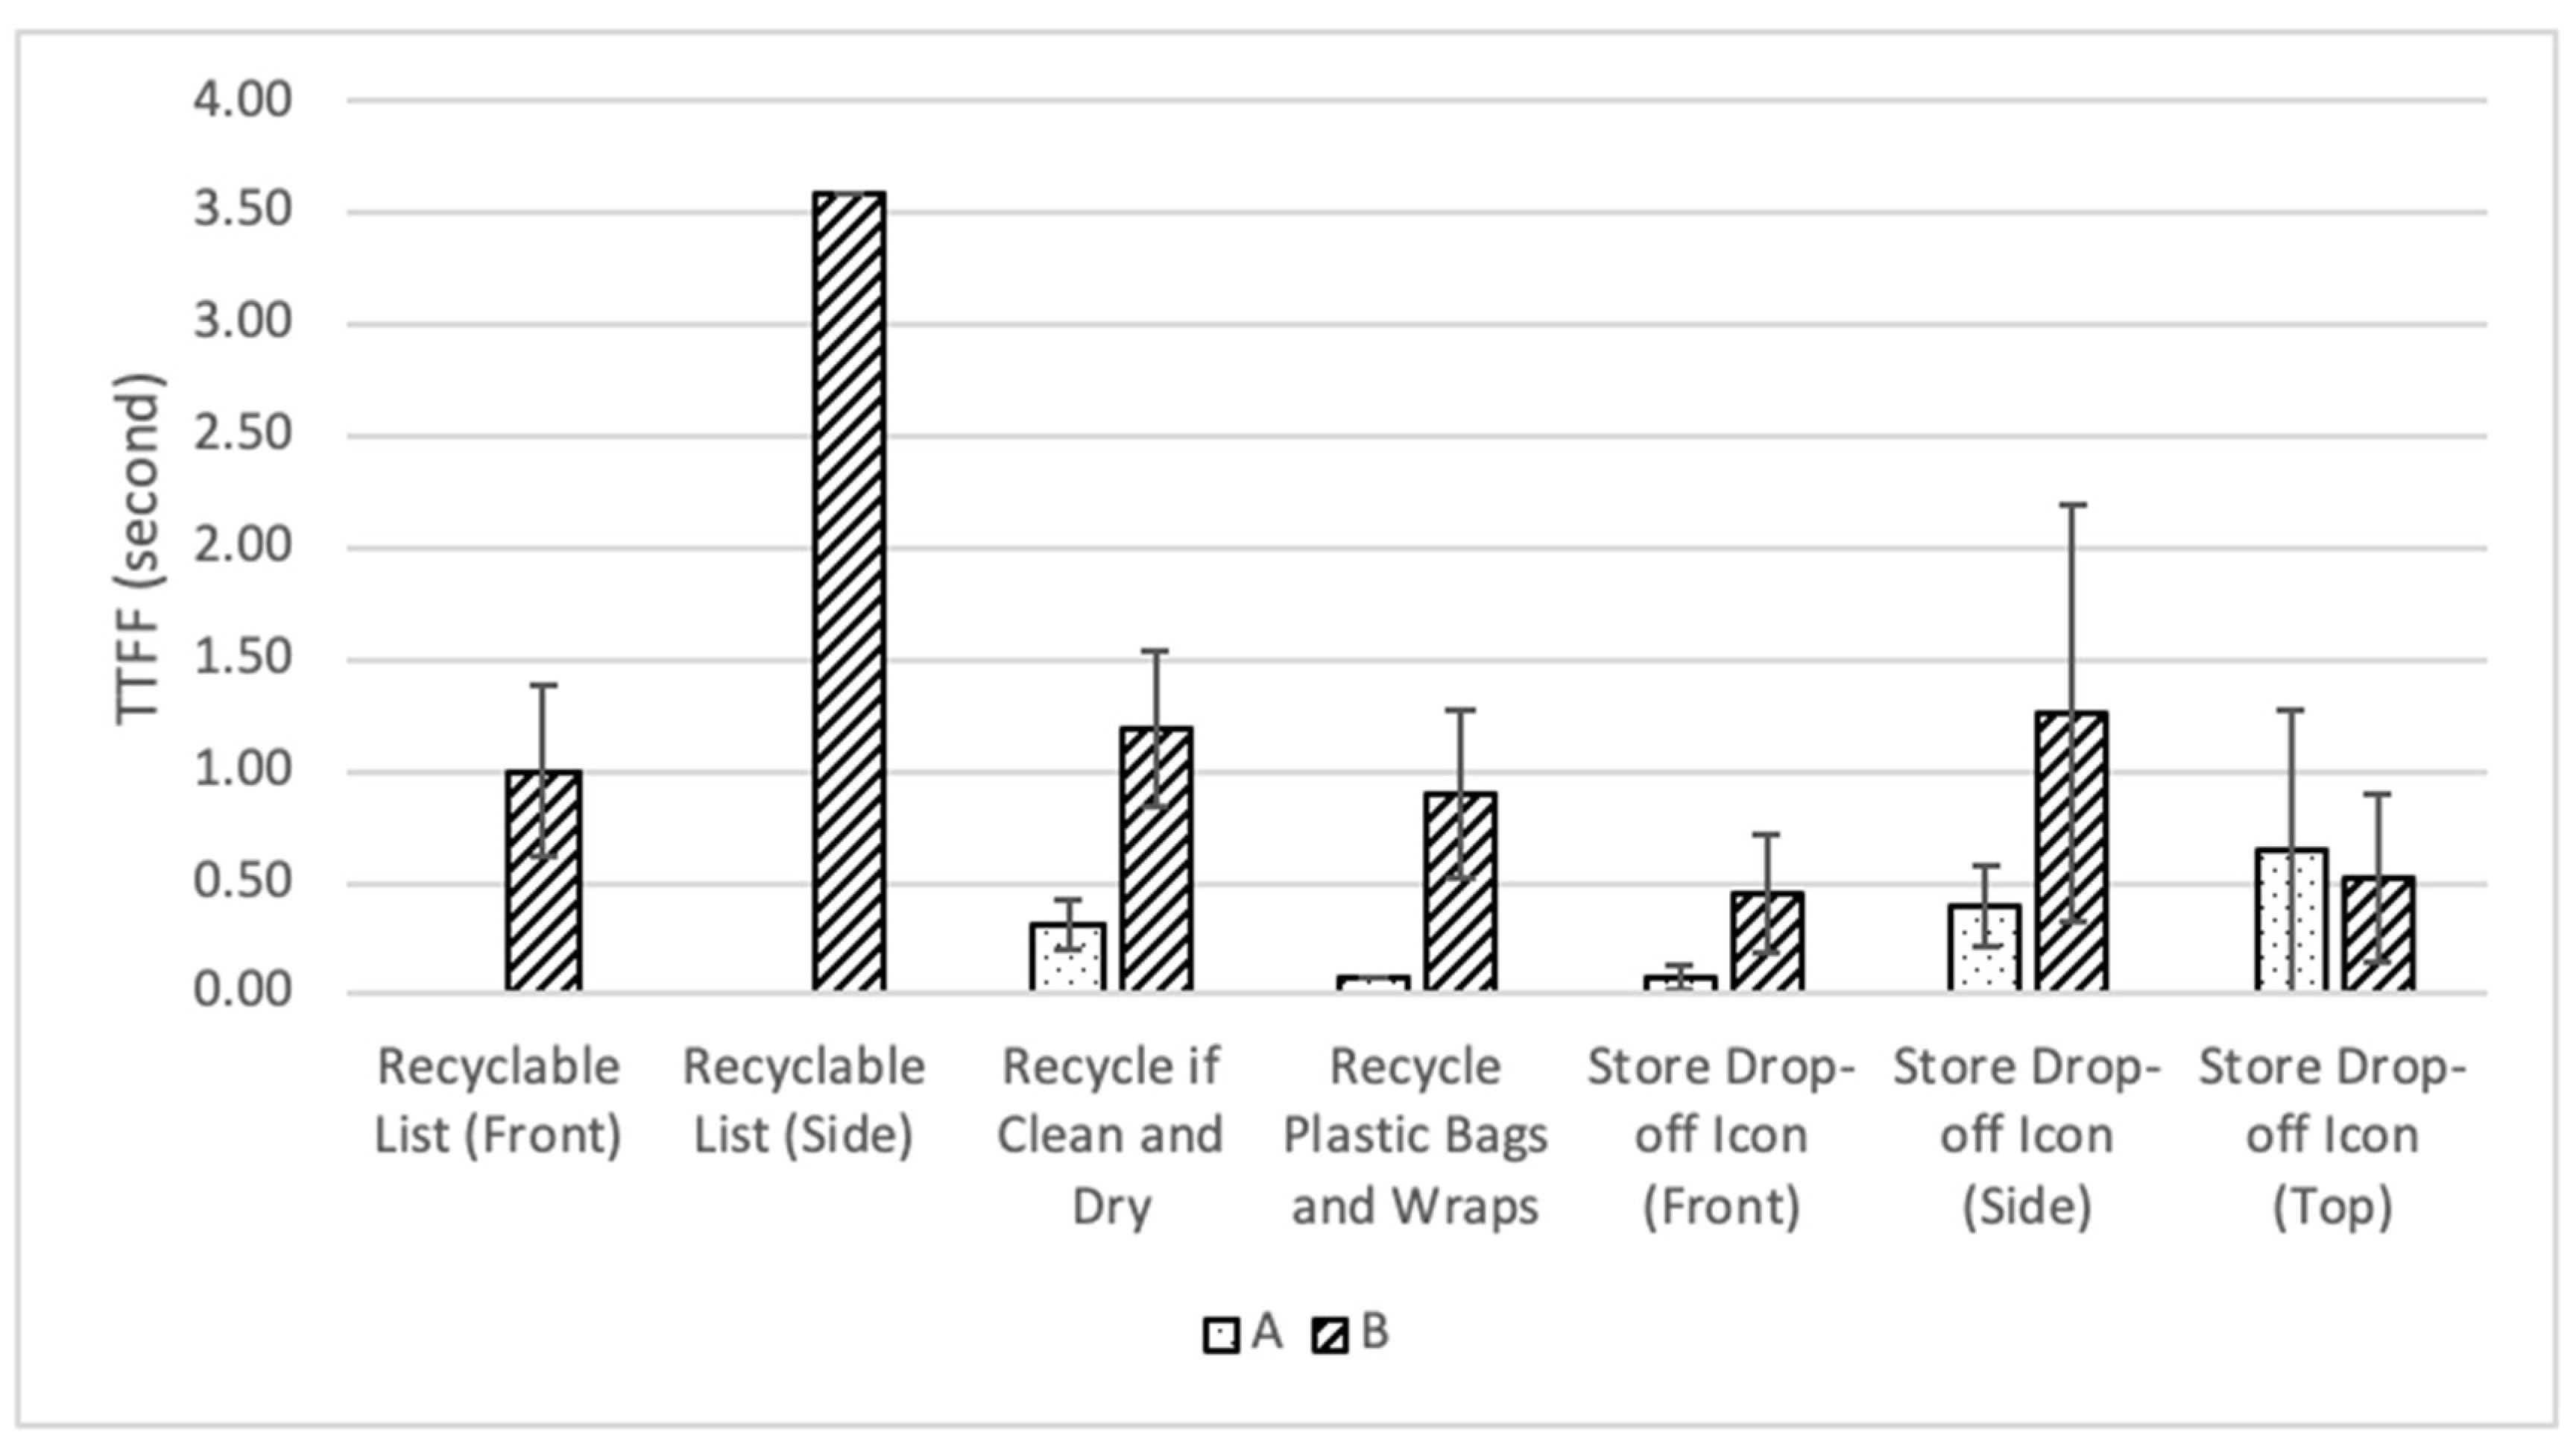
In the TTFF results (Figure 8), it is noteworthy that no data were available for the “recyclable list” element in Group A, neither on the front nor side panels, as none of the participants had viewed them. Conversely, a larger number of individuals observed these elements in Group B. This lack of engagement with the recyclable list indicates a potential gap in awareness or interest among participants in Group A regarding items that can be recycled. In contrast, in Group B, a greater number of individuals observed these elements, indicating a higher level of attention or awareness toward the store drop-off program.

Figure 8.
TTFF for Recycle Bin Elements in Group A and Group B.
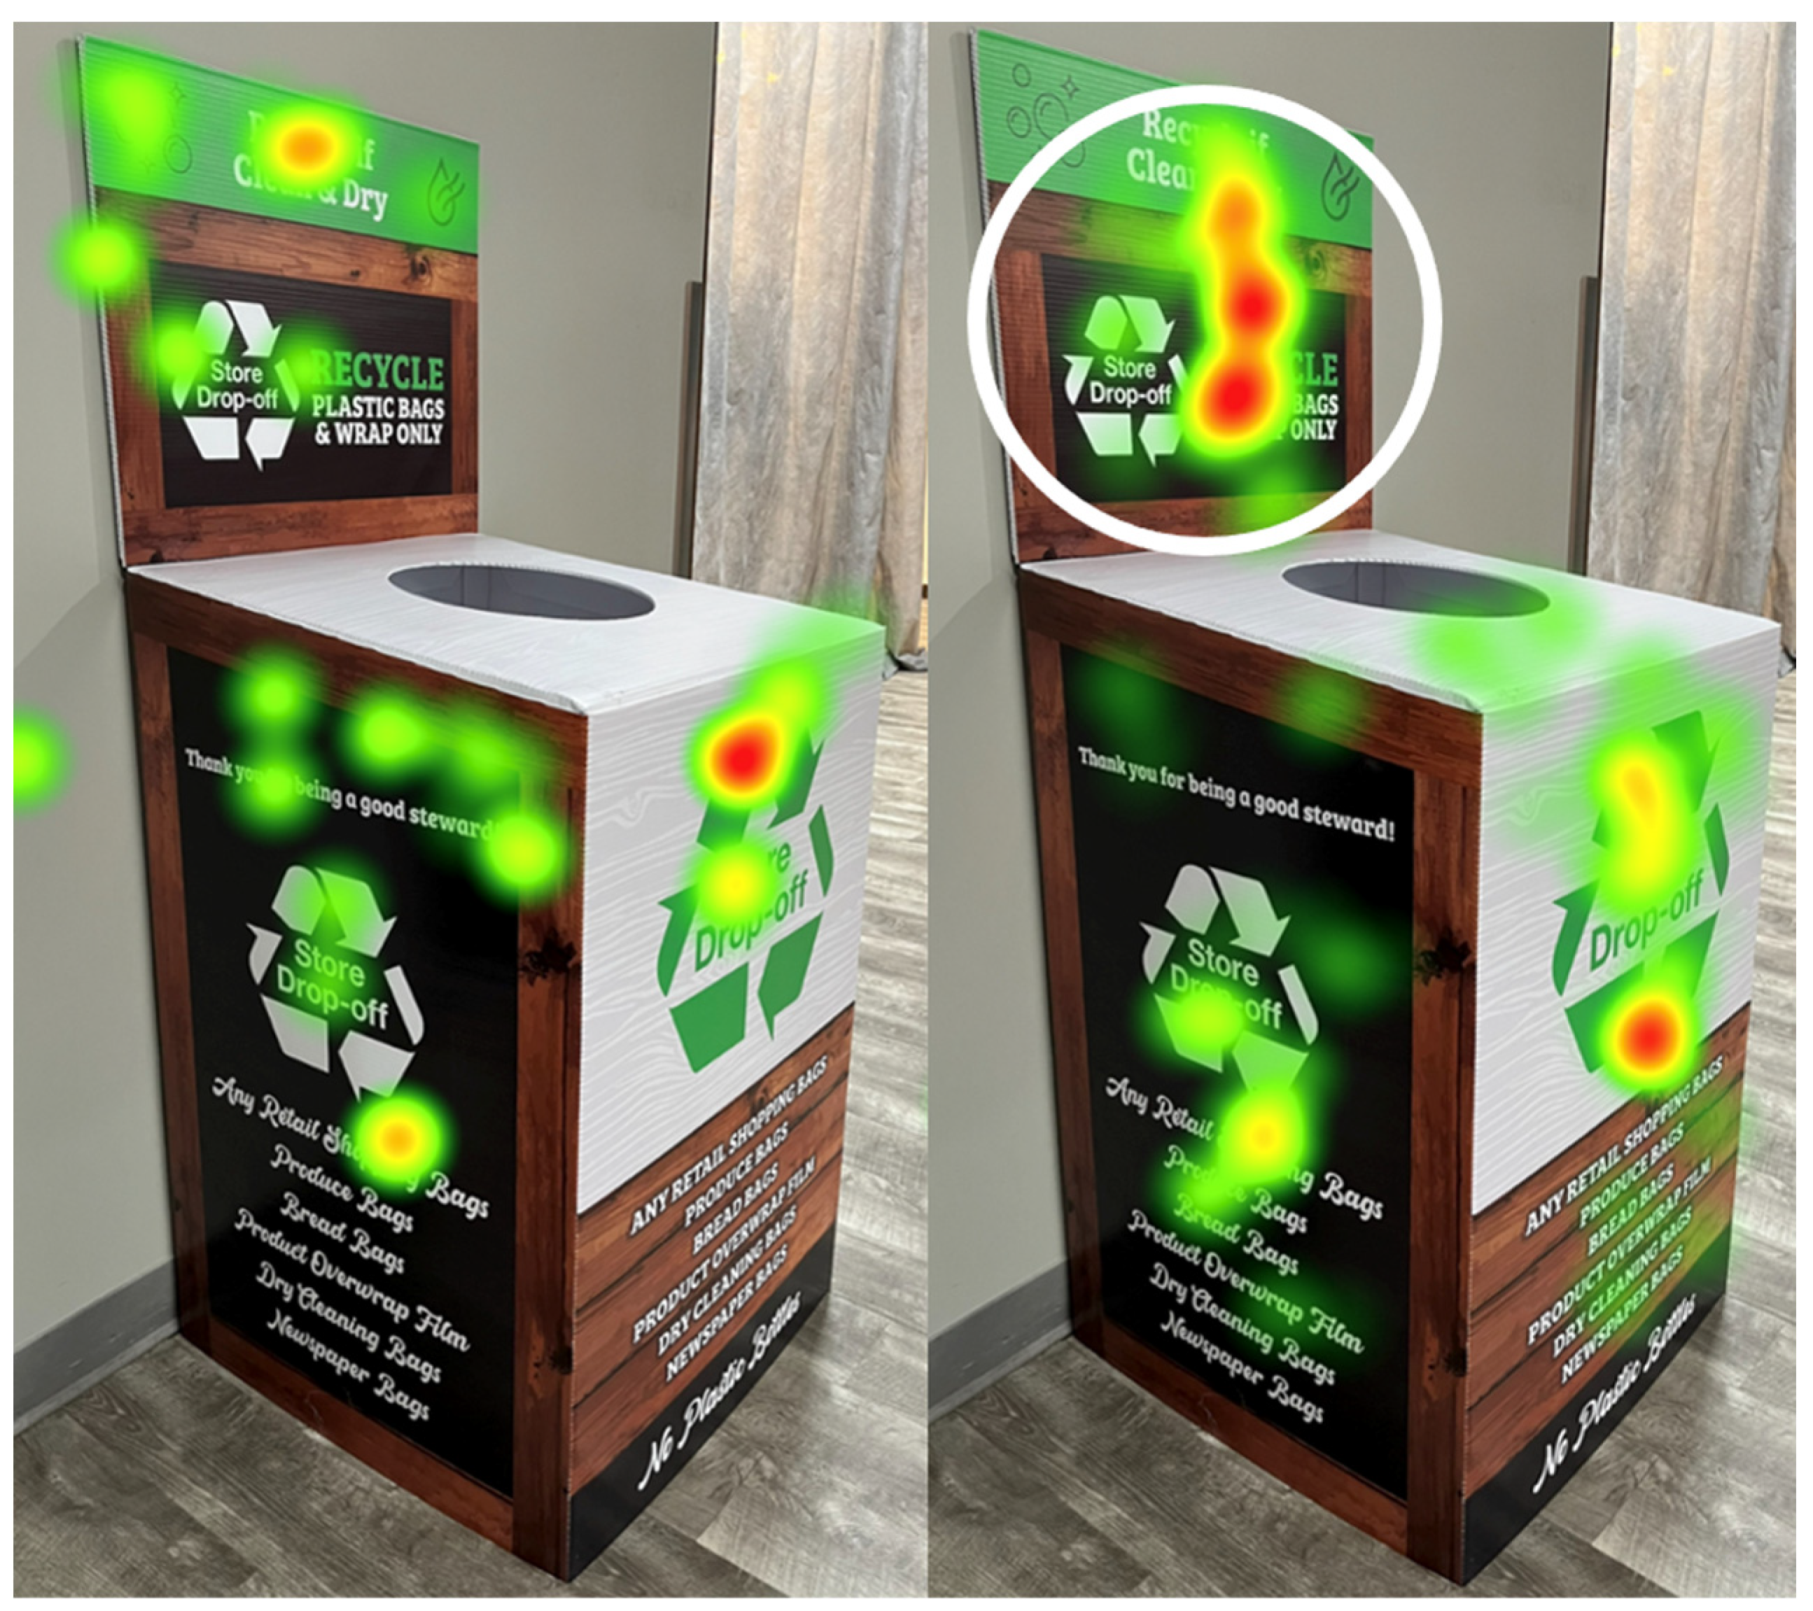
The findings in eye tracking metrics were also supported by the heatmap (Figure 9), which showed that there was increased attention and fixation shifting toward the recycling instruction of “Recycle plastic bags and wraps” in Group B compared to Group A. This result proves the effectiveness of the on-shelf signage because the information on the signage enhances consumers’ awareness of the store drop-off method available for recycling plastic bags and wraps. The participants in Group B appeared to be more guided toward looking at the specific claim of recycling instructions (circled in Figure 9), which provides strong evidence of the effectiveness of the on-shelf signage.

Figure 9.
Store Drop-off bin heatmap (group A on left, group B on right). Colors indicate attention levels, with red representing longer durations and green indicating shorter durations.
The key eye-tracking metrics for the signages and the entire drop-off bin in Groups A and B were also analyzed (Table 1 and Table 2). In Group B, Table 1 shows that the shelf signage attracted increased attention and caught attention quicker (TFD = 1.72 s, TTFF = 4.92 s) than the aisle invaders (TFD = 0.08 s, TTFF = 17.51 s). A total of 30.3% of the participants saw the aisle invaders, and 90.9% of the participants saw the shelf strips. The results in Table 2 show that in Group A, 43% of the participants saw the store drop-off bin as they were exiting the store. Overall, 72% of the participants in Group B saw the store drop-off bin as they were exiting the store.

Table 1.
Group B Key Metrics for On-shelf Signage.
Table 2.
Key Metrics on Recycle Bin for Groups A and B.
3.2. Statistical Analysis
Welch’s two-sample t-tests were conducted to compare the group means of attention metrics (TFD and FC) for the design elements on the store drop-off bin in order to determine significant differences at a 95% confidence level. The results indicated a significant increase in consumer attention toward the recycling instruction “Recycle plastic bags and wraps” and the “Store drop-off” program icon on the bin after exposure to strategically placed signs in Group B (Table 3 and Table 4).
Table 3.
Results of Welch’s Two-Sample t-Test for Consumer Attention Metrics on Recycling Instruction “Recycle Plastic Bags and Wraps” at Store Drop-off Bin: Comparison between Group A (N = 33) and Group B (N = 34).
Table 4.
Results of Welch’s Two-Sample t-Test for Consumer Attention Metrics of the Front “Store Drop-Off” Program Icon on Store Drop-Off Bin: Comparison between Group A (N = 33) and Group B (N = 34).
In the TFD results, when comparing the group means for the recycling instructions “Recycle plastic bags and wraps” at the store drop-off bin in the statistical analysis (Table 3), Group B was significantly higher than Group A (p = 0.02) at a 95% confidence level. Notably, the store drop-off icon on the front panel captured the longest attention from participants in both groups. Its total fixation duration increased from 0.10 s in Group A to 0.22 s in Group B (Figure 6), with a p-value of 0.20 when comparing group means (Table 4), although the increase was not significant at the 95% confidence level.
In the FC results, when comparing the group means for this claim in the statistical analysis (Table 3), Group B was significantly higher than Group A (p = 0.03 < 0.05) at a 95% confidence level. Additionally, the fixation counts of the store drop-off program icon on the front panel increased from 0.25 in Group A to 0.88 in Group B with a p-value of 0.04 when comparing the group means (Table 4), showing a significant increase at the 95% confidence level.
Based on the statistical analysis conducted, which revealed a significant increase in consumer attention metrics within Group B toward the visual area of the store drop-off bin, including the recycling instructions and the store drop-off program information (p < 0.05), the null hypothesis was rejected. Consequently, the alternative hypothesis was accepted, which showed that consumers exposed to strategically placed signs in the shopping environment demonstrate greater attention and awareness of the store drop-off program and bin compared to those not exposed. This suggested that strategic signage placement effectively influences consumer behavior and awareness in the context of recycling initiatives within retail environments.
3.3. Survey Findings
After completing the shopping test with the eye-tracking portion, the participants were provided with a post-survey consisting of a series of questions regarding their experience with store drop-off programs in order to offer a deeper exploration into participant responses.
The findings revealed that approximately 19% and 32% of participants in Group A and Group B, respectively, expressed confusion regarding what materials could and could not be recycled within their community. Many participants stated that this was because the recycling system in their community was complicated and inconvenient. The main confusion was regarding recycling plastics. More than half of the participants did not understand what types of packaging were accepted by store drop-off bins. Furthermore, the majority of participants had not previously utilized store drop-off bins for recycling plastic packaging, indicating a potential gap in awareness or accessibility to recycling infrastructure for certain materials. Overall, these findings underscore the need for clearer communication and education initiatives to improve understanding and participation in recycling programs within communities.
When they were asked what types of materials they had recycled at store drop-off bins, 100% of the participants in both groups answered “retail bags,” and more participants in Group B selected each of the other material types compared to Group A. The findings indicated that participants in Group B, who were exposed to the educational information regarding the use of store drop-off bins for recycling plastic bags and wraps through shelf signage, exhibited a higher likelihood of recycling other types of materials besides retail bags compared to those in Group A. This discrepancy between the groups suggests a potential difference in recycling behaviors or awareness levels, with participants in Group B demonstrating a more diverse engagement with recycling materials beyond solely retail bags.
In Group B, more than half of the participants (53%) stated that seeing the signage on the shelf increased their awareness of the store drop-off bin and the How2Recycle program, as well as their knowledge of the recyclability of plastic pouches. Most participants (68%) only scanned it without reading the whole signage. This suggested that while the signage may have been effective in raising awareness among some participants, there was limited engagement with the full content of the signage.
4. Discussion and Conclusions
This study concluded that consumer awareness of How2Recycle labels and the usage of store drop-off bins could be elevated through strategically positioned in-store signage, especially via messaging on shelf strips. There was strong evidence that consumer education plays a critical role in raising consumer awareness of the recyclability of plastic bags and wraps, as does the existence of store drop-off bins. In this research, consumer awareness of the store drop-off program and its recycled content claim showed a significant increase (p < 0.05) after exposure to in-store signage showing information about the How2Recycle program. These findings suggested the effectiveness of strategically placed signage in enhancing consumer engagement with recycling initiatives within retail settings.
When comparing eye tracking key metrics for the three methods of in-store signage—shelf strips, aisle invaders, and the store drop-off bin panels—the shelf strips attracted attention for the longest amount of time (TFD = 1.72 s) as well as the highest fixation count (FC = 5.91). The store drop-off bin panels had the best performance with regard to time to first fixation (0.12 s). The aisle invaders demonstrated the lowest performance in all three eye-tracking key metrics. In the results for the number of people who had noticed each type of signage, the shelf strips were noticed by most participants, demonstrating a 60.6% fixation compared to the aisle invaders. With the addition of the shelf strips and aisle invaders near the tested planogram in Group B, the store drop-off bin also experienced an increase in how many people noticed it, increasing from 43.3% to 72.7%. These results showed that consumers were able to locate the information on the drop-off bin and understand its usage more efficiently by providing clear and strategic guidance using in-store on-shelf signage (shelf strips and aisle invaders).
Additionally, among all three locations of the store drop-off icons, the one prominently displayed on the front panel garnered the highest level of attention from participants in both Group A and Group B. This finding suggested the effectiveness of positioning key messaging in easily accessible areas within the retail environment. Strategic placement and design elements on the front panel of the store drop-off bin played a crucial role in directing consumers’ attention and influencing their behavioral responses.
In summary, this study suggested the significance of strategic in-store signage in promoting sustainability and enhancing consumer engagement with recycling initiatives. By placing clear and informative signage, such as shelf strips and aisle invaders, retailers can effectively communicate the benefits of recycling programs, educate consumers about recyclable products like plastic bags, and increase awareness of store drop-off bins. Overall, these findings highlight the essential role of signage in retail settings for driving a positive environmental impact and improving the overall customer experience.
5. Limitations
The controlled test environment employed in this study, with the planogram set up as a granola shelf and granola selected as the shopping target, may restrict the generalizability of the findings. Additionally, positioning the store drop-off bin near the store exit could influence participants’ shopping behaviors and eye-tracking patterns.
6. Future Research
With the observed increased attention to in-store recycling programs, future research should continue testing and optimizing in-store communication. Future studies should explore a broader range of shopping categories and store setups to assess the robustness of our findings. Investigating whether shoppers’ focus significantly varies across different product categories or store layouts could provide valuable insights into consumer behavior and inform retail strategies.
As this study used signage with claims concerning recycling plastic pouches and wraps, it is important to explore other claims in order to optimize the information provided to consumers to be as effective as possible. For example, there is confusion concerning the destination of recycled packaging and how the materials will be recycled [17,18]. Therefore, researchers should investigate whether printing the address of the company that will use the recycled material and/or the products they will convert the recycled material into increases confidence in the recycling program. Additionally, researchers could also test in-store signage claims to determine the percentage of recycled content utilized.
Ultimately, transparency in the recycling program and process can inspire consumers and further increase feedstocks of recycled materials, further improving the sustainability of packaged consumer goods. Retailers and brands should remain proactive in updating their messaging based on direct insights collected from consumers, to effectively engage consumers and drive positive environmental change. By incorporating feedback from consumers and staying attuned to emerging sustainability best practices, retailers can ensure that their communication efforts resonate with target audiences and inspire meaningful action. By continuously refining communication strategies and providing clear and accessible information, retailers, brands, and consumers can collaboratively contribute to building a more sustainable future.
Author Contributions
Conceptualization, S.A. (Shannon Anderson), R.A.H., and P.N.; Formal analysis, M.Z.; Investigation, S.A. (Shannon Anderson); Methodology, M.Z., R.A.H., and S.A. (Sheila Anzures); Project administration, S.A. (Shannon Anderson) and S.A. (Sheila Anzures); Software, M.Z. and S.A. (Shannon Anderson); Supervision, S.A. (Shannon Anderson) and R.A.H.; Validation, R.A.H., P.N., and K.B.; Visualization, M.Z.; Writing—original draft, M.Z.; Writing—review and editing, R.A.H., P.N., and K.B. All authors have read and agreed to the published version of the manuscript.
Funding
This research received no external funding.
Informed Consent Statement
Informed consent was obtained from all subjects involved in the study.
Data Availability Statement
The raw data supporting the conclusions of this article will be made available by the authors on request.
Conflicts of Interest
Authors Mengmeng Zhao and Shannon Anderson are employed by the company Quad Packaging, Inc. Author Kelly Burt is employed by the company Quad/Graphics, Inc. Author Sheila Anzures and Paul Nowak are employed by the GreenBlue Organization. All authors declare no conflicts of interest.
References
- van Bussel, L.; Kuijsten, A.; Mars, M.; Van‘t Veer, P. Consumers’ perceptions on food-related sustainability: A systematic review. J. Clean. Prod. 2022, 341, 130904. [Google Scholar] [CrossRef]
- Sesini, G.; Castiglioni, C.; Lozza, E. New trends and patterns in sustainable consumption: A systematic review and research agenda. Sustainability 2020, 12, 5935. [Google Scholar] [CrossRef]
- Kronthal-Sacco, R.; Whelan, T.; Van Holt, T.; Atz, U. Sustainable purchasing patterns and consumer responsiveness to sustainability marketing. J. Sustain. Res. 2020, 2, 2. [Google Scholar] [CrossRef]
- Harris, F.; Roby, H.; Dibb, S. Sustainable clothing: Challenges, barriers and interventions for encouraging more sustainable consumer behaviour. Int. J. Consum. Stud. 2015, 40, 309–318. [Google Scholar] [CrossRef]
- Grebmer, C.; Diefenbach, S. The challenges of green marketing communication: Effective communication to environmentally conscious but skeptical consumers. Designs 2020, 4, 25. [Google Scholar] [CrossRef]
- Acharya, S.; Bali, S.; Bhatia, B.S. Exploring consumer behavior towards sustainability of green cosmetics. In Proceedings of the 2021 International Conference on Advances in Electrical, Computing, Communication and Sustainable Technologies (ICAECT), Bhilai, India, 19–20 February 2021; IEEE: Piscataway, NJ, USA, 2021. [Google Scholar]
- Buerke, A.; Straatmann, T.; Lin-Hi, N.; Müller, K. Consumer awareness and sustainability-focused value orientation as motivating factors of responsible consumer behavior. Rev. Manag. Sci. 2016, 11, 959–991. [Google Scholar] [CrossRef]
- Ibrahim, I.D.; Hamam, Y.; Sadiku, E.R.; Ndambuki, J.M.; Kupolati, W.K.; Jamiru, T.; Eze, A.A.; Snyman, J. Need for Sustainable Packaging: An Overview. Polymers 2022, 14, 4430. [Google Scholar] [CrossRef] [PubMed]
- Siddiqui, J.; Pandey, G. A review of plastic waste management strategies. Int. Res. J. Environ. Sci. 2013, 2, 84. [Google Scholar]
- Bano, N.; Younas, T.; Shoaib, F.; Rashid, D.; Jaffri, N. Plastic: Reduce, recycle, and environment. In Environmentally-Benign Energy Solutions; Springer International Publishing: Berlin/Heidelberg, Germany, 2020. [Google Scholar]
- Kiran, V.; Majumdar, M.; Kishore, K. Innovation in in-store promotions: Effects on consumer purchase decision. Eur. J. Bus. Manag. 2012, 4, 9. [Google Scholar]
- Sulaiman, M.A.; Ahmed, M.N. The essential elements of organized retail stores in influencing customers to stores. Int. J. Appl. Bus. Econ. Res. 2017, 15, 6. [Google Scholar]
- Dennis, C.; Newman, A.; Michon, R.; Brakus, J.J.; Wright, L.T. The mediating effects of perception and emotion: Digital signage in mall atmospherics. J. Retail. Consum. Serv. 2010, 17, 205–215. [Google Scholar] [CrossRef]
- Chandon, P.; Hutchinson, J.W.; Bradlow, E.T.; Young, S.H. Does in-store marketing work? Effects of the number and position of shelf facings on brand attention and evaluation at the point of purchase. J. Mark. 2009, 73, 1–17. [Google Scholar] [CrossRef]
- Han, Y.; Chandukala, S.R.; Li, S. Impact of different types of in-store displays on consumer purchase behavior. J. Retail. 2022, 98, 432–452. [Google Scholar] [CrossRef]
- Nordfält, J.; Grewal, D.; Roggeveen, A.L.; Hill, K.M. Insights from in-store marketing experiments. In Shopper Marketing and the Role of in-Store Marketing; Emerald Group Publishing Limited: Bingley, UK, 2014; Volume 11, pp. 127–146. [Google Scholar]
- Aasebø, M.R.; Adejoh, S.; Beattie, N. Where Does Your Trash Really Go? 2022. Available online: https://bioceed.uib.no/dropfolder/bioPOSTERS/Papers/V22/SDG215/215_2_paper.pdf (accessed on 5 January 2024).
- Matt, G.; Simon, E.; Park, C.; Simpson, T.; Kofsky, J.; Schlosberg, J.; Brooksbank, T.; Yamashita, S.; Kim, S.R. We put dozens of trackers in plastic bags for recycling. Many were trashed. ABC News, 23 May 2023. [Google Scholar]


Disclaimer/Publisher’s Note: The statements, opinions and data contained in all publications are solely those of the individual author(s) and contributor(s) and not of MDPI and/or the editor(s). MDPI and/or the editor(s) disclaim responsibility for any injury to people or property resulting from any ideas, methods, instructions or products referred to in the content. |
© 2024 by the authors. Licensee MDPI, Basel, Switzerland. This article is an open access article distributed under the terms and conditions of the Creative Commons Attribution (CC BY) license (https://creativecommons.org/licenses/by/4.0/).