Abstract
The present study aimed to explore the textile dyeing capability using dyes derived from grape pomace. Extractions were conducted with water at different pH levels and with a water/ethanol solution. Cotton (natural and cationized) and wool were employed in the dyeing process for varying durations (100 and 200 min). The colorimetric and fastness properties, in terms of washing (with hot and cold water) and exposure to natural light, were evaluated. The final color evaluation was performed using ΔE*, a parameter quantifying the magnitude of a color difference by comparing the L*a*b* color coordinates of the CIELAB system of the dyed samples with those of the control. The hues obtained on the fabrics resulted in uniform and earthy colors. However, the cationized cotton substrate showed the highest ΔE* values for all conditions used in obtaining grape pomace extracts, in the range of 33.91 to 37.98. This suggests that the surface treatment enhanced dye uptake, while organic cotton achieved a lighter earthy color. Natural dyeing using grape pomace presents a sustainable, ecological, and non-toxic alternative for textile dyeing, resulting in unique and earthy tones with commercial potential while promoting the sustainable use of natural resources and environmental preservation. The key to achieving sustainable development lies in waste reduction and valorization, along with the adoption of conscious consumption.
1. Introduction
The dyeing and finishing stages are prominent focal points in the textile supply chain, given that the wet processing phases have a substantial water demand, energy, and chemicals. Fabrics are commonly dyed using soluble colored chemical substances known as dyes, which establish a robust physical/chemical bond with the fibers. About 800,000 tons of synthetic dyes are estimated to be produced globally annually. The textile industry accounts for 5% of this amount [1].
Dyes are synthetic organic compounds that are hydro- or oil-soluble and can be classified considering their chemical structure with the following functional groups: anthraquinone, azo, phthalocyanine, sulfur, indigo, nitro, nitroso, etc. [2,3]. Synthetic dyes have been favored over natural dyes since their introduction to the market due to their ease of use, the elimination of the need for mordants, and the ability to achieve vibrant, fast, and consistent colors. Despite the benefits, the extensive use of chemical dyes also poses significant environmental challenges. Many dyes contain insoluble impurities or generate polluting residues that negatively impact aquatic ecosystems and the surrounding environment, necessitating their disposal. The textile industry is recognized as a significant contributor to environmental pollution, with approximately 20% of the total water pollution attributed to textile treatments, especially the coloration processes [2]. The pollution of up to 200 tons of water can result from producing one ton of fabric. Wastewater from textile processes is characterized by intense coloration due to great concentrations of chemicals, such as salts, dyes, detergents, peroxides, and heavy metals. In addition to water pollution, other environmental concerns arise from burning fossil fuels, leading to atmospheric emissions, climate change, and greenhouse gas production [4].
In turn, natural plant fibers such as cotton, flax, hemp, jute, sisal, coir, and bamboo, among others, have various benefits concerning synthetic fibers, such as abundance and low cost, renewability, eco-friendliness, low-density and high-specific properties, non-abrasiveness, and biodegradability. Additionally, natural dyes are considered skin-friendly and can provide health benefits to the wearer [5]. The search for sustainable alternatives to chemical dyes in the textile industry has become increasingly necessary due to the environmental and health impacts associated with the production and application of these dyes. Opting for natural dyes presents a range of significant benefits for the environment and human health. However, natural dyes face challenges related to their limited color retention, especially when exposed to washing and light. Mordants, primarily heavy metal salts, address this issue to facilitate dye uptake and ensure color durability [6]. Pizzicato et al., in their study, stated that the use of natural dyes may offer several different properties allied to the color, such as antifungal, antibacterial, and UV protection properties, and can also be used as an insect repellent or add aromatic properties to the textile [7].
Natural dyes can have multiple impacts, including social, economic, sustainable, and environmental dimensions [8].
Regarding the social impact, it can generate employment opportunities, as harvesting and processing natural dyes can create job opportunities, particularly in rural or marginalized communities where the source materials are abundant. It also allows the preservation of traditional knowledge: many natural dye extraction methods are deeply rooted in traditional knowledge passed down through generations. By promoting the use of natural dyes, there is an opportunity to preserve and celebrate cultural practices.
In the economic sector, for communities relying on agriculture or forest exploration, extracting natural dyes from by-products diversifies their income sources, reducing dependence on a single industry. Likewise, the demand for eco-friendly and sustainable products is growing. Businesses that incorporate natural dyes in their products can tap into this market, potentially leading to increased sales and revenue, leading to market opportunities.
As a sustainability impact, utilizing by-products of agriculture or forest exploration aligns with the circular economy concept. It minimizes waste, using materials that might otherwise be discarded, promoting a more sustainable and regenerative approach. Along with reducing the environmental footprint, natural dyes often have a lower environmental impact than synthetic dyes. They are biodegradable and do not contribute to harmful chemical runoff during dyeing.
The environmental impact is in the context of biodiversity conservation, as the extraction of natural dyes from plants or other organic sources promotes the conservation of biodiversity and the preservation of ecosystems that support these dye-producing organisms. It also reduces environmental pollution, as the production and disposal of synthetic dyes can contribute to water and soil pollution. The use of natural dyes reduces the release of harmful chemicals into the environment, promoting cleaner ecosystems [8].
Natural dyes can be categorized into two main types: substantive dyes, which chemically adhere to the fiber independently, and adjective dyes, which require the presence of a metal salt to prevent color fading; these include most natural dyes [9]. The use of plant-based dyes is historical, as they were used to color textiles, leather, and paper. Turmeric, indigo, madder, woad, and logwood were valuable dyes used in the past [10]. The waste from the food industry and invasive plants have been the subject of research as potential sources of biodyes for the textile industry, constituting excellent examples of case studies in the context of waste valorization. In recent years, successful coloring of cotton and wool fabrics has been achieved, resulting in a diverse range of earthy colors, utilizing waste materials from strawberry tree (Arbutus unedo L.) fruits [11], wine production [12], as well as by-products from the cork industry, including cork-cooking wastewater and expanded black cork condensate [13]. The use of plant waste as a coloring agent has also gained importance in recent years. The use of nutshell as a dye source was evaluated by Dulo et al., who reported the use of the shells of peanuts (Arachis hypogaea L.), cashew nuts (Anacardium occidentale L.), coconuts (Cocos nucifera L.) and macadamia nuts (Macadamia integrifolia L.) to color wool fabrics. The effect of pH, time, temperature, and mordant during the dying process was also evaluated. The authors concluded that acidic conditions were preferable to dye the wool, with or without the employment of mordants, resulting in good UV protection even in the absence of mordants [14]. Chickpea husk was also used as a cotton, silk, and wool textile dye. Authors reported that the dye securely adheres to the fabric, achieving a robust uptake without requiring any metallic mordant. It shows a pronounced preference for protein fibers over cellulosic fibers, with the color yield significantly improving at higher temperatures. This method is totally eco-friendly and there is no use of chemicals or auxiliaries throughout the dyeing process [15].
The present study highlights the importance of valorizing grape pomace, a by-product of wine production, as a potential source of biodye for the textile industry. The approach aims to promote sustainability and circularity in textile production by addressing the challenges associated with fabric dyeing. This approach is in line with the principles of the circular economy, contributing to waste minimization and the promotion of more sustainable practices. The research stresses the ongoing need to improve dyeing processes to make the use of biodyes derived from grape pomace more effective and economically viable. However, it is crucial to recognize that the transition to more sustainable practices in the textile industry requires continued efforts and collaboration across different sectors.
Portugal stands out as a country with an unparalleled diversity of grape types, boasting an impressive array of over 300 varieties [16]. Throughout the winemaking process, diverse by-products emerge, comprising approximately 30% of the total grape utilization. These byproducts encompass vine pruning, grape stalks, pomace, and lees. Grape pomace, a composite of skins, seeds, and stem left over from grape pressing, can range from 25% to 45% of the total grape weight [17].
In recent years, there has been a growing interest in waste valorization driven by the principles of the circular economy [18]. This approach seeks to derive value-added products from materials that were previously considered waste. The findings indicate the feasibility of obtaining valuable outputs such as platform chemicals, biofuels, heat, energy, and antioxidants through this waste valorization process [19,20].
The use of grape pomace (GP) has been studied for various purposes, including as a source of bioactive molecules or natural dyes. The chemical composition of GP is promising due to its abundance in compounds known for their potent antioxidant activity. These include polyphenols such as anthocyanins, flavonols, flavan-3-ols, procyanidins, phenolic acids, and resveratrol. Grape pomace is frequently used to produce distillates and extract substances such as tartaric acid and coloring agents like enocyanin [21,22,23].
Some studies mention the use of GP as an eco-friendly dye. Baaka et al. reported using GP (Vitis vinifera L) to dye cationized cotton [23]. Their study evaluated the dyeing conditions, temperature, pH, and time, its quality, and the environmental impact of the residual dye bath. The authors concluded that the optimal dyeing conditions were a dyeing bath at 100 °C for 55 min at pH = 8. In another study, Baaka et al. developed and optimized a method to extract dye from GP to color wool fabrics [22]. An alkaline extraction produced a higher color yield using the same grape specimen (Vitis vinifera L). The authors determined that optimal results for wool dyeing were achieved by utilizing a dyeing bath with a temperature of 80 °C for 70 min.
Contributing to the transition to a circular economy, this manuscript, an extension of a preliminary study [12], aims to support the application of grape pomace extracts as a natural source of dyes for the textile industry, serving as a valorization process for winery waste.
2. Materials and Methods
2.1. Materials
This section presents the materials used for carrying out this activity, including the by-product used to extract biodyes and the textile substrates used for dyeing.
2.1.1. Raw Material
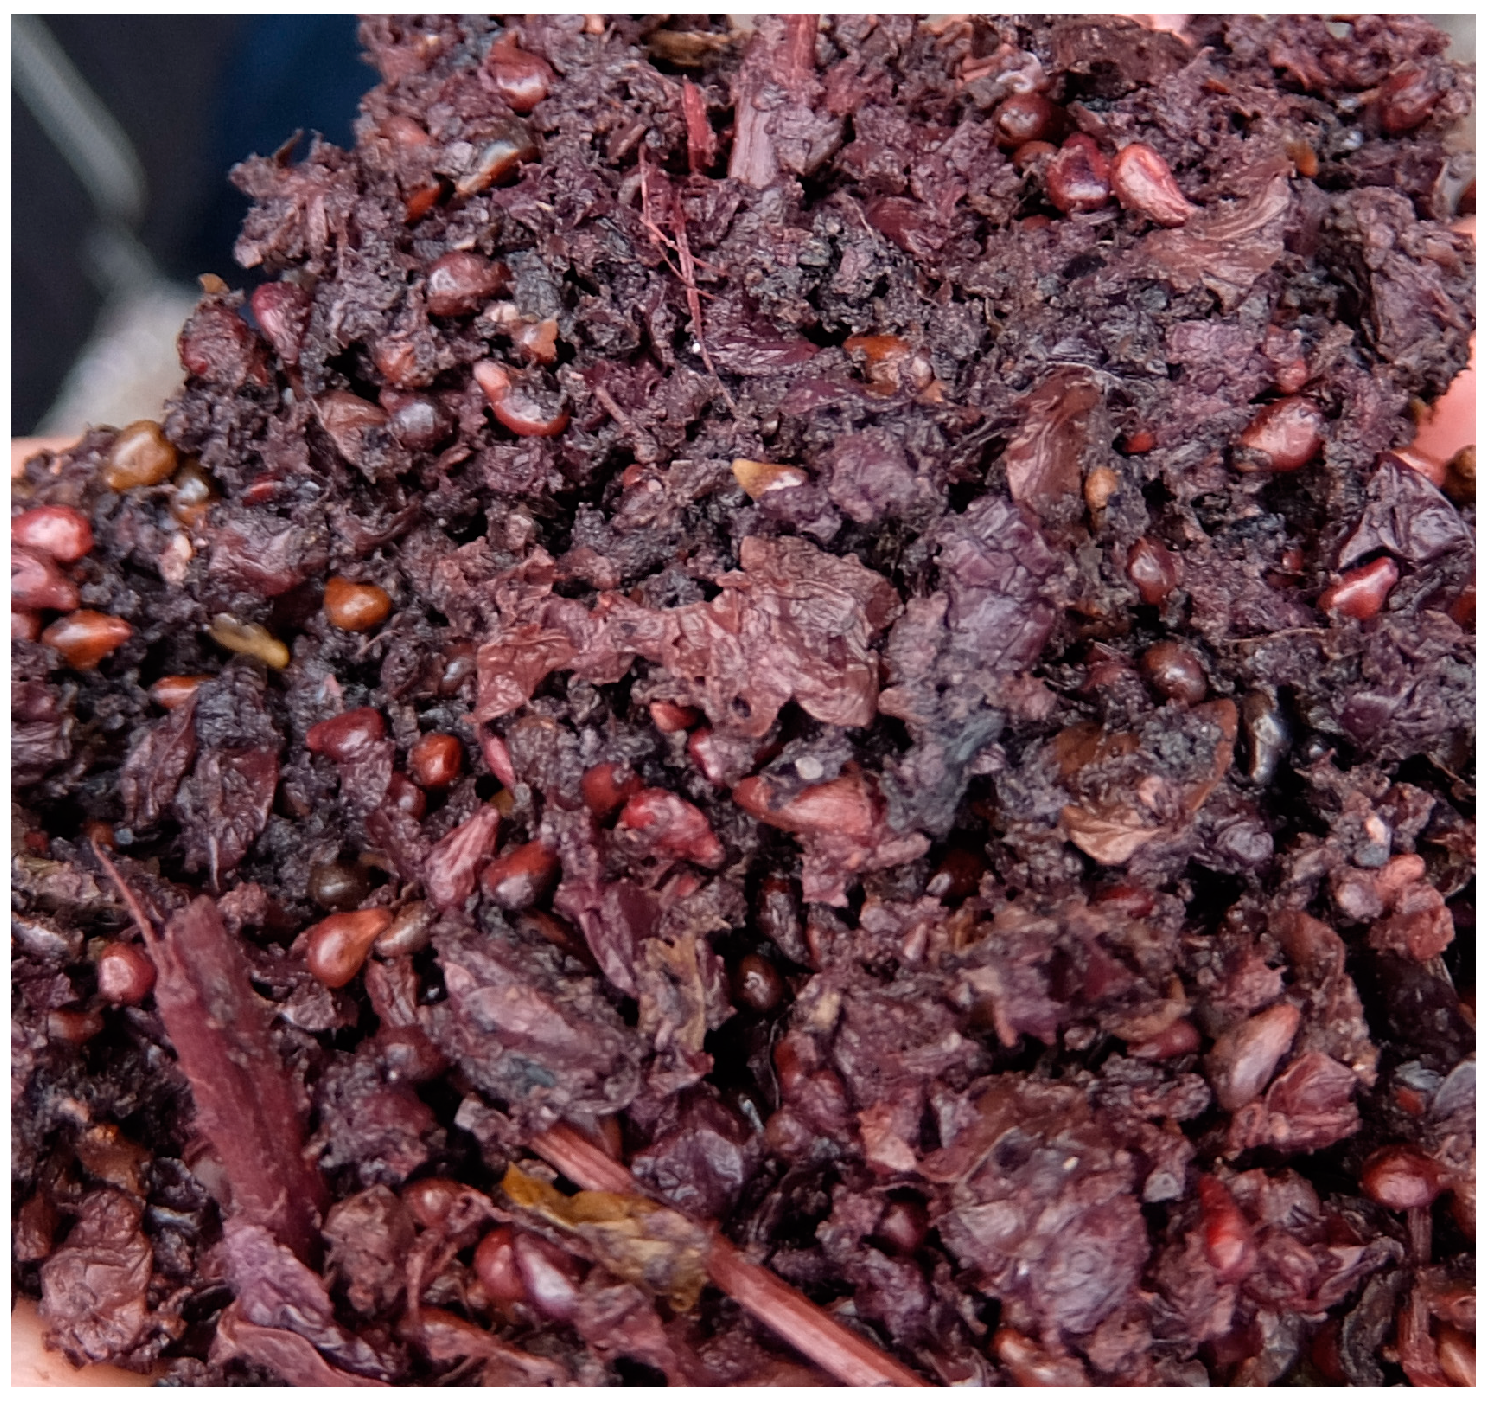
The grape pomace, used as the raw material, was supplied by a wine local producer from the Leiria region in the center of Portugal. The grapes used were a mixture of several varieties: Castelão, Tamarez, and Baga for red grapes, and Fernão Pires for white grapes. The GP was obtained by pressing the final residues after the grape fermentation process and was a mixture of pressed grape skins, seeds, pulp residues, and stalks (Figure 1). This residue was stored in a freezer for about one week before being submitted to the extraction processes.
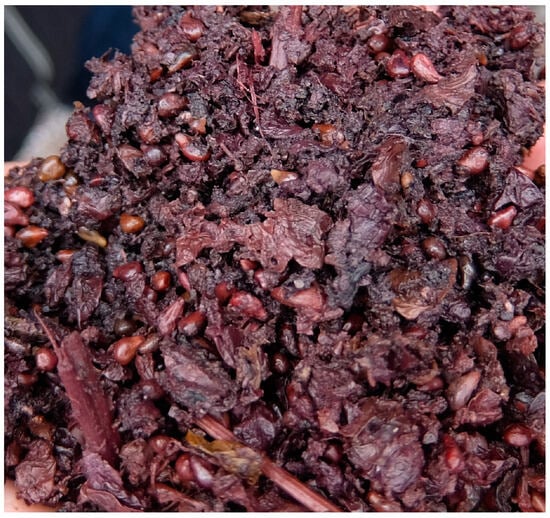
Figure 1.
Grape pomace obtained by pressing the final residues after the grape fermentation process (a mixture of grape skins, seeds, pulp residues, and stalks).
2.1.2. Textile Substrates
In the dyeing experiments, three distinct textile substrates were used—organic cotton, cationized cotton, and wool—to evaluate the colorant potential of the extracts obtained from GP. The cationized cotton underwent a chemical process in which cationic agents are introduced into the cellulose fibers, resulting in positively charged fibers that enhance the electrostatic attraction between the fibers and the dyes.
The textile substrates, generously provided by Tintex S.A. (Vila Nova de Cerveira, Portugal), were knitted fabrics composed of 100% cotton and 100% wool. The cotton fabric weighed 145 g/m2, whereas the wool fabric weighed 195 g/m2. Due to confidentiality agreements with the company, specific details regarding the pretreatment of cationized cotton cannot be disclosed.
2.2. Methods
This section describes the methodologies in the extraction process of biocoloring agents from GP and in the dyeing assays. The color fastness tests, and the procedure used to measure and to present the final color obtained in the textile substrates, are also mentioned.
2.2.1. Extraction Process
After being defrosted, the GP underwent a solid–liquid extraction process to extract the biodyes present for use in subsequent dyeing experiments. In the extraction procedure, 30 g of GP were used with 500 mL of solvent in a flask immersed in a thermoregulated bath (±1 °C). Water was chosen as the solvent and utilized with different pH values (pH = 2.4, pH = 8.0, and pH = 12.2) at a temperature of 80 °C over a period of 3 h. In addition to extraction with water, dye was also extracted using a water/ethanol solution (50% v/v) under the same temperature and time conditions. Periodically, a small sample of the solution was withdrawn from the extraction flasks.
After extraction, the solid residue remaining in the flask was separated by filtration. The filtrated solution was centrifuged (at 4000 rpm for 10 min) and finally vacuum-filtered through a filtration system with a membrane of 47 mm diameter and 0.2 µm porosity. Finally, the extract solution was concentrated using a Heidolph® VV2000 (Schwabach, Germany) rotary evaporator, and when approximately 40 mL of extract remained, this volume was transferred to pre-weighed and labeled vials, and frozen for later lyophilization. This process allowed the determination of the extraction yield.
2.2.2. Dyeing Procedure
The lyophilized extract was dissolved in 25 mL of distilled water, and a portion of the solution obtained was diluted 10 times before being used as dyeing solution. In the dyeing process, samples of textile substrates (4.6 cm circles) were immersed in 20 mL of dyeing solution (biocoloring solution) contained in closed vials. Two dyeing experiments were conducted: one for 100 min at 50 °C and 320 rpm, and another for 200 min under the same conditions. A control assay was conducted, containing only the textile sample and water for each dyeing time. After this period, the vials were removed from the oven, and the textile samples were removed and placed on absorbent paper to remove excess solution.
2.2.3. Fastness Tests
After dyeing, various tests were conducted to assess color fastness in the textile samples. These tests included procedures such as cold-water washing, hot-water washing, and exposure to natural light, preceding the evaluation of color in the textile samples. In the cold-water washing test, textile samples were immersed in flasks containing distilled water at 20 °C and subjected to agitation at 320 rpm for 10 min. After this period, the textile samples were removed from the water and placed on absorbent paper to remove any excess water. In the hot-water washing test, textile samples were immersed in distilled water at 45 °C in closed flasks and subjected to agitation at 320 rpm for 10 min. Finally, the textile samples were taken out of the washing water and wiped with absorbent paper.
After the washing tests, the textile samples were placed in a tray with half of each circular sample covered with dark paper, allowing one half to dry in natural light and the other half to dry in darkness. The tray was left exposed to natural light for one week to assess whether the samples were resistant to color fading caused by natural light and to compare the color between the two halves of the fabric surface (half dry in the light and half dry in the dark).
2.2.4. Color Measurement
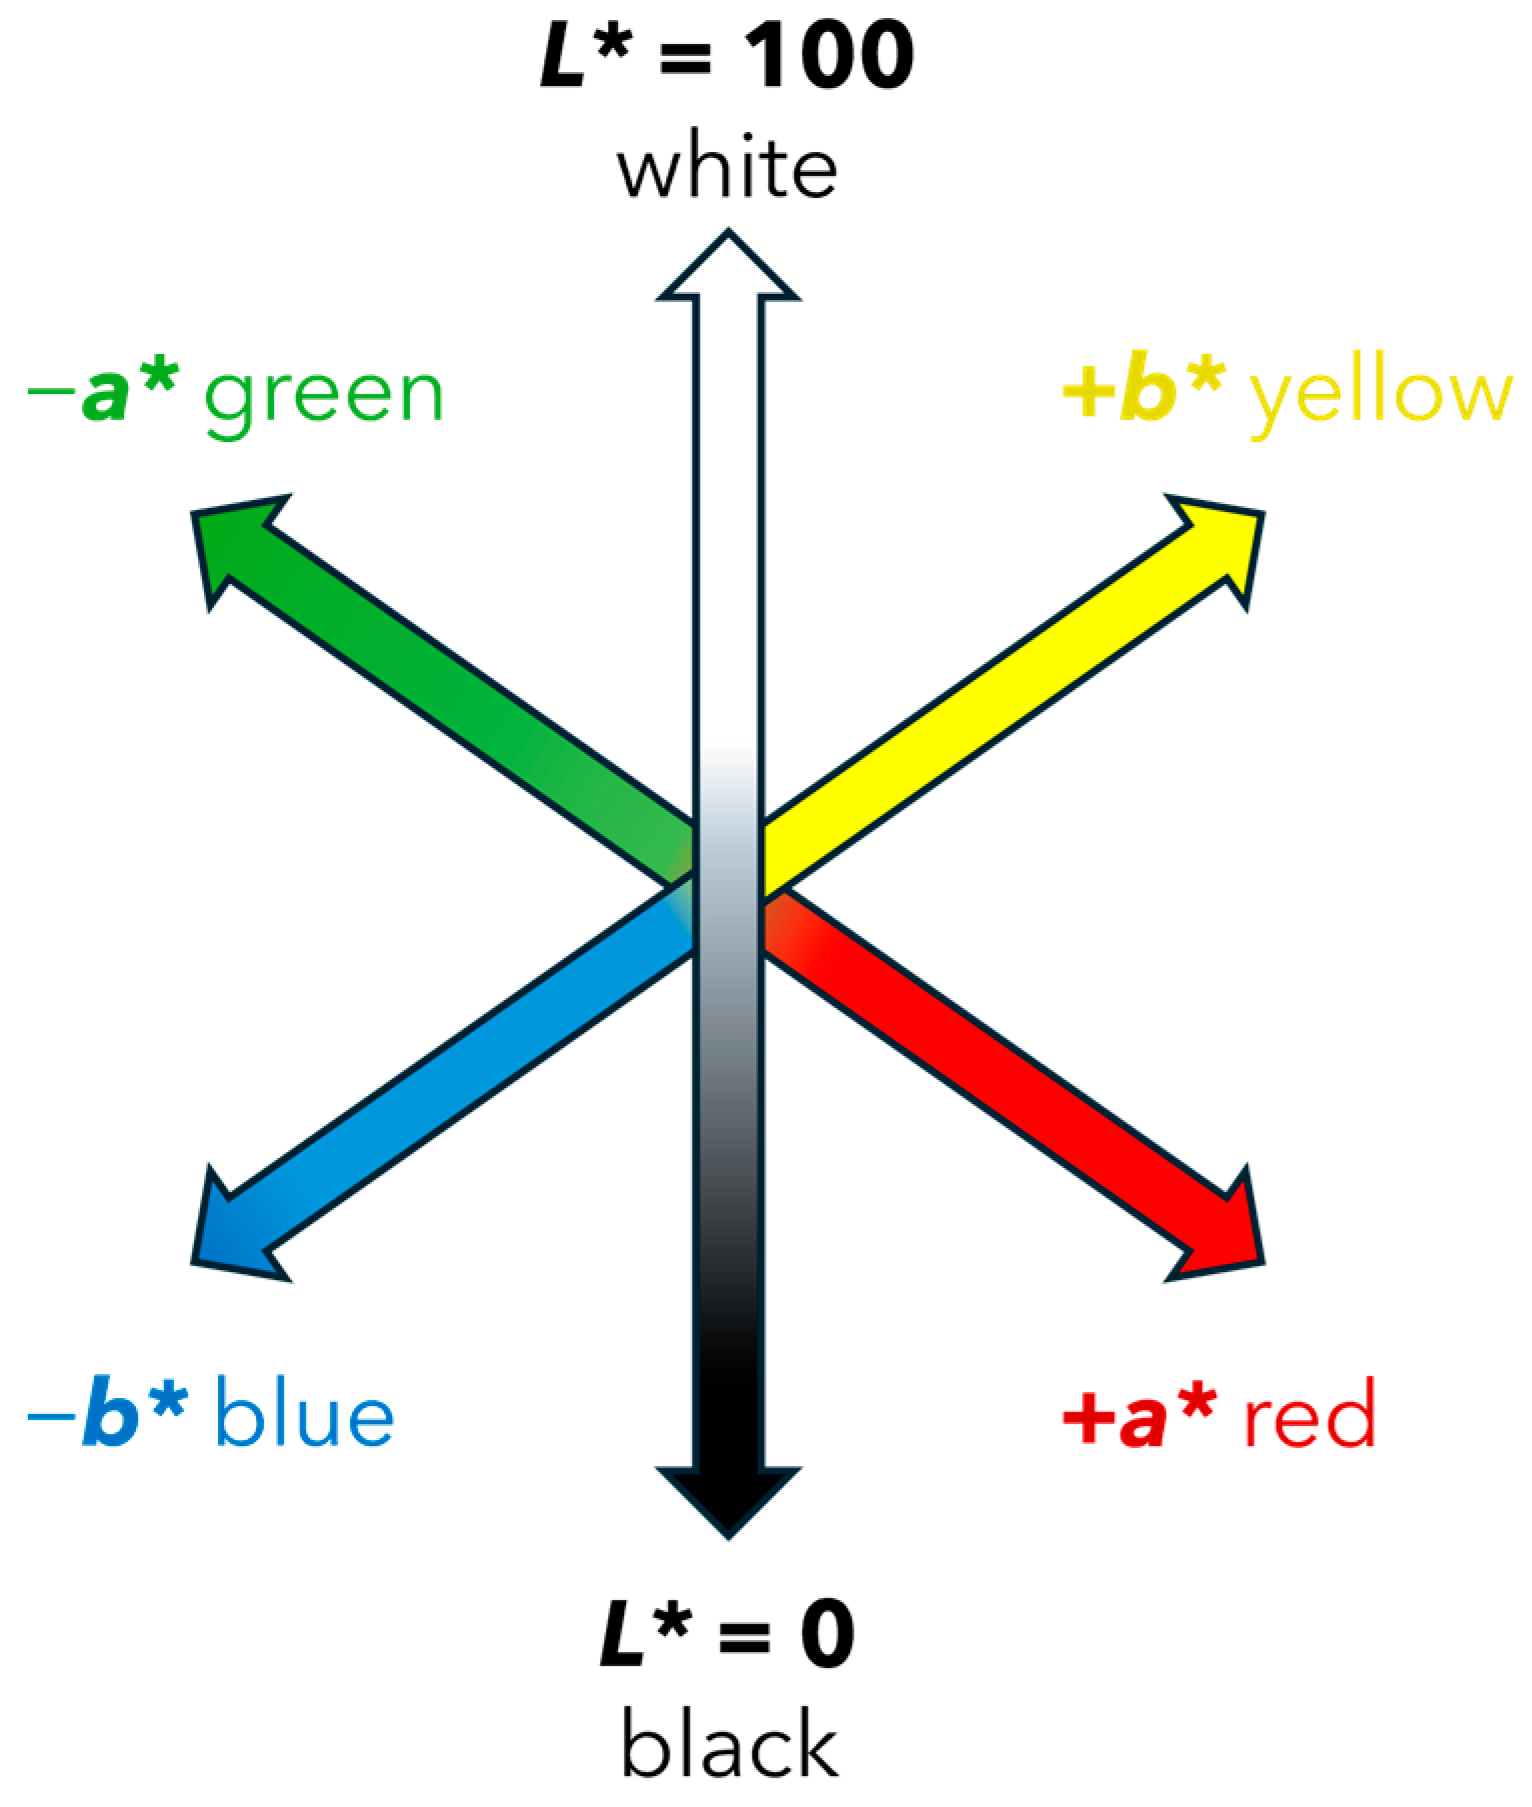
The Commission Internationale de L’Eclairage (CIE) developed a widely used color measurement system that defines color based on three coordinates: L*a*b* (CIELAB). The L* coordinate represents the brightness of the color, where 0 is completely black, and 100 is completely white. The a* coordinate measures the position between green and red, where negative values represent green and positive values represent red. The b* coordinate measures the position between blue (negative values) and yellow (positive values) [24]. Given that the L*a*b* model is three-dimensional, it can only be accurately represented in a three-dimensional space, Figure 2.

Figure 2.
Three-dimensional representation of the L*, a*, b* coordinates in the CIELAB system.
To measure the L*, a*, and b* coordinates of the dyed samples, providing quantitative values for the color characteristics obtained in the samples, a colorimeter (Konica Minolta, CR-200, Chiyoda, Tokyo, Japan) was employed. Twelve measurements were taken on each sample (three on the half of the sample exposed to light and three on the half of the sample exposed to darkness, on both sides of the textiles).
This color space model is widely used for comparing colors between two objects. The discrepancy in color coordinates between two samples can be expressed with a single parameter, ΔE*, calculated as the square root of the sum of the squares of the differences between L*, a*, and b*, as presented in Equation (1) [25].
This study used the ΔE* values to assess the color difference between the surface exposed to natural light and the surface protected from light exposure in the same sample; between dyed textile samples and their respective control samples; and among dyed samples under different conditions. The parameter ΔE* magnitude provided a perception of the color difference between the textile samples, using the classification proposed by Mokrzycki et al. [26], as indicated in Table 1.

Table 1.
ΔE* classification according with Mokrzycki et al. [26].
As stated before, the colors were measured with the L*a*b* system, but, in order to reproduce the textile sample colors before and after dyeing, the L*a*b* coordinates were converted to RGB coordinates. Matlab® software (R2023b) was used for the conversion.
2.2.5. UV-Vis Absorption Spectra
The absorption spectra were obtained using a spectrophotometer (Thermo Scientific Evolution 201, Waltham, MA, USA) in a wavelength range from 250 nm to 950 nm for the samples collected during the extraction process. The absorption spectra were recorded also for coloring solutions before and after the dyeing stage, as well as for water obtained from cold and hot washing.
2.2.6. Qualitative Phytochemical Tests
A qualitative phytochemical screening was conducted with the aim of identifying the presence of various classes of compounds in the coloring solutions used in this study. This assessment was based on the methods described by Vesoul and Cock (2011) [27].
Specific assays were conducted to identify the presence of saponins, phenolic compounds, flavonoids, polyterpenes, triterpenoids, cardiac glycosides, anthraquinones, tannins, and alkaloids in the obtained extracts. These tests are based on specific reactions that indicate the presence or absence of certain groups of phytochemicals.
To determine the presence of saponins, a foam formation test was conducted [27]. To detect the presence of phenolic compounds, a modified version of the Folin–Ciocalteu method was employed [28]. A test with an alkaline reagent was used to determine the presence of flavonoids [27]. A test was conducted using acetic anhydride and sulfuric acid to detect the presence of polyterpenes [29]. To determine the presence of triterpenoids, a test with chloroform and sulfuric acid was conducted [30]. Another test, using glacial acetic acid, iron chloride, and sulfuric acid, was performed to ascertain the presence of cardiac glycosides [28]. To identify the presence of free and combined anthraquinones, modified versions of the tests proposed by Kumar and Ajaiyeoba, respectively, were used [28,29]. The presence of tannin compounds was assessed through a modified version of the ferric chloride test [29]. Finally, the presence of alkaloids in the dyeing solution was evaluated using the Mayer test [31]. In Table 2, the procedures of the qualitative tests conducted with the dyeing solutions are presented.
Table 2.
Standard qualitative tests used to detect the presence of phytochemicals in the obtained extracts.
2.2.7. Antimicrobial Tests
Antimicrobial tests were conducted to assess the antimicrobial activity of the dyeing solutions using two bacteria, Escherichia coli (ATCC 10536) and Staphylococcus aureus (ATCC 29213). The modified Kirby–Bauer disk diffusion method [32,33] was used. The bacteria were cultured in NB medium at 37 °C for 24 h, followed by inoculating 100 μL of this microbial suspension into Mueller–Hinton agar plates (in triplicate). Standard penicillin G and kanamycin disks (6 ϕ), known for their antimicrobial activity, were used as positive controls. Filter paper disks (6 mm ϕ) soaked with 200 μL of distilled water served as negative controls. Sterilized filter paper disks measuring 6 mm in diameter were saturated with 200 μL of dyeing solutions, and served for testing. Following soaking and drying, the filter paper disks were positioned on the inoculated plates and then incubated at 37 °C for 18 h. The diameters of the inhibition zones were subsequently measured using a ruler to assess the bacteria’s sensitivity to the dyeing solution.
2.3. A Step-by-Step Guide to the Experimental Procedures Employed
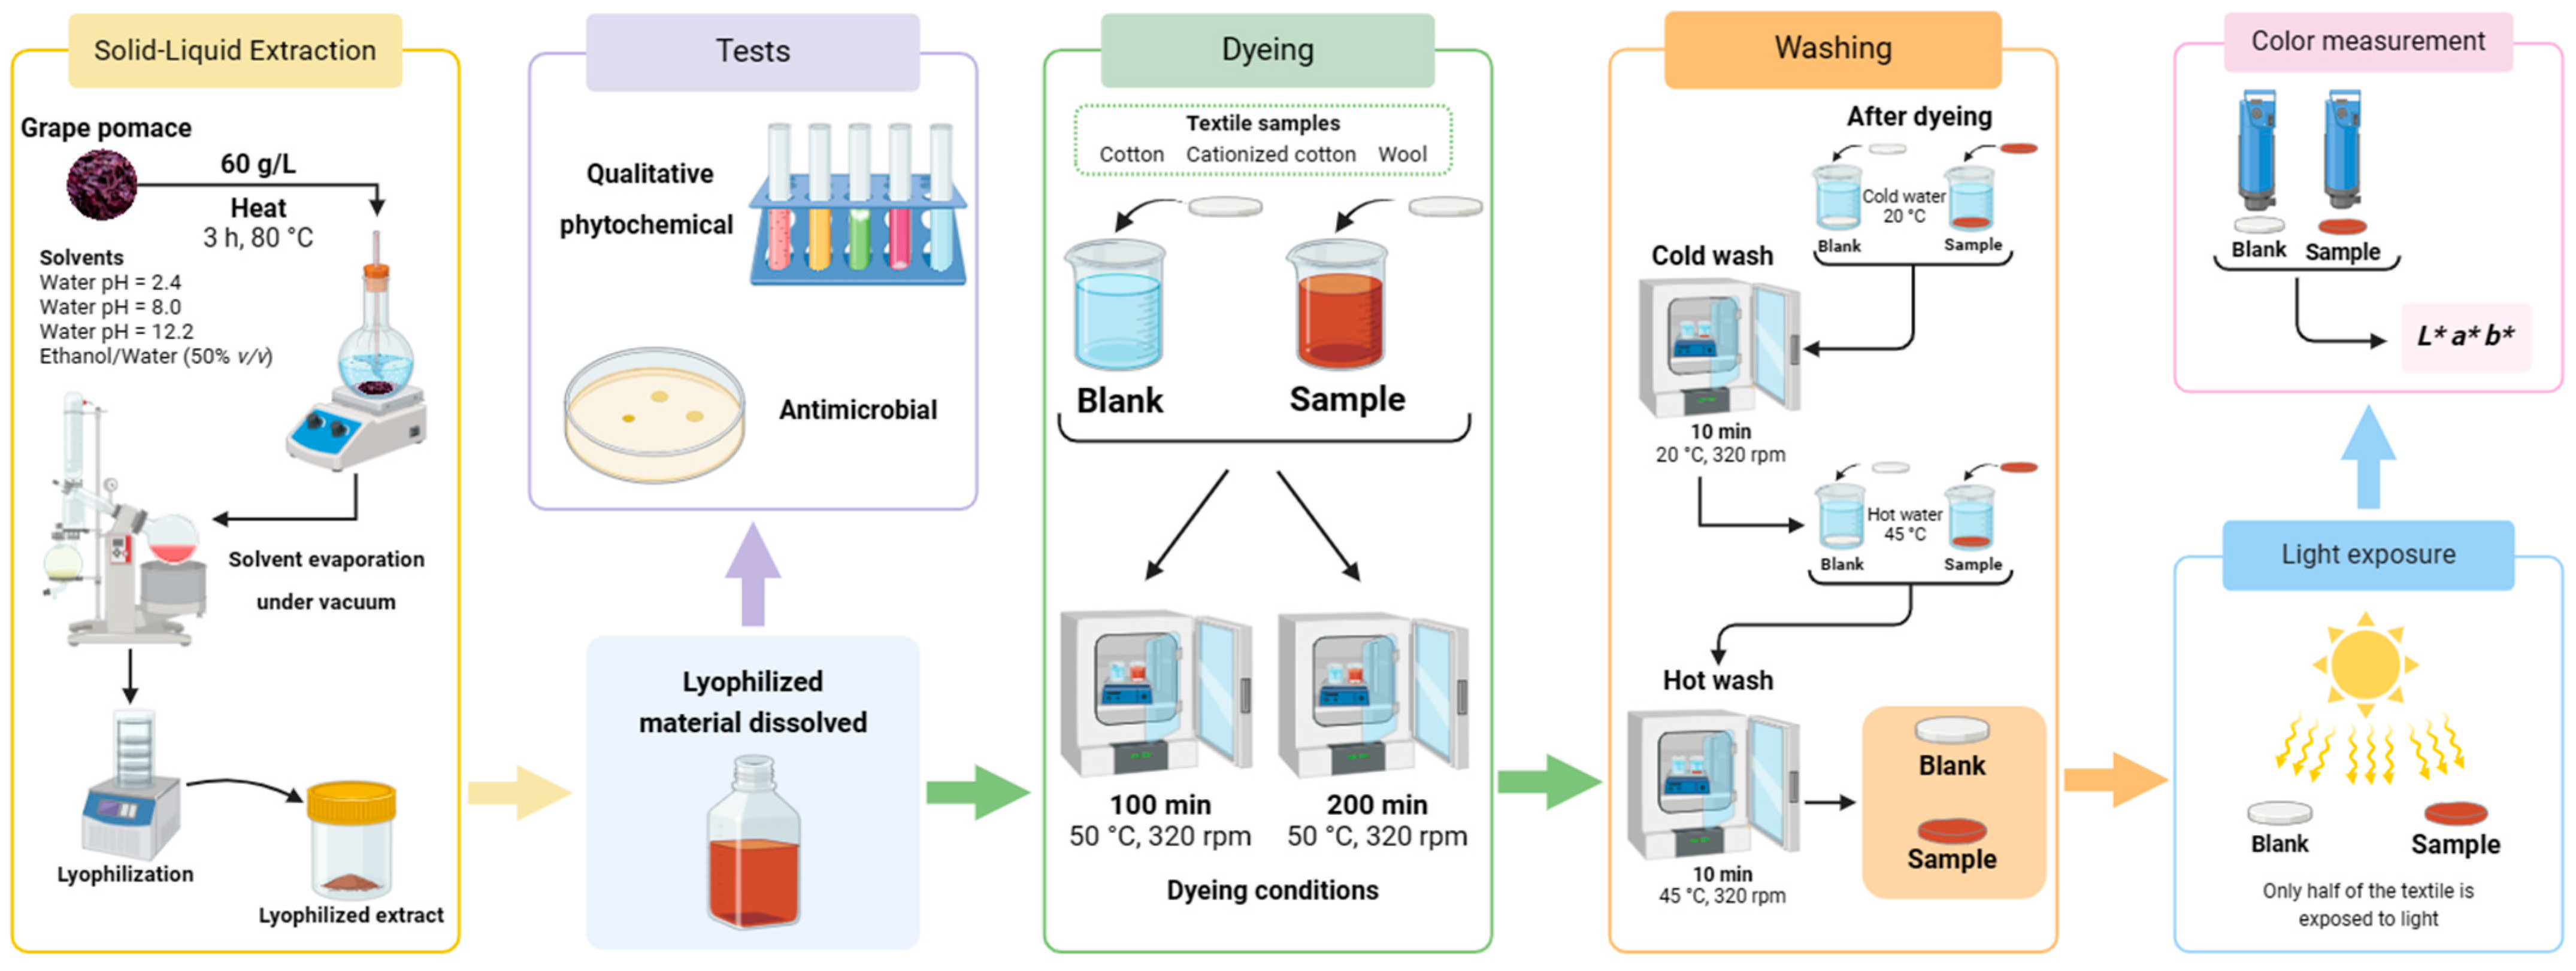
The purpose of this section is to provide a graphical summary (Figure 3) of the step-by-step experimental procedures employed in this study. This includes not only the extraction of biodyes, their use to dye the textile samples, and the assessment of color fastness, but also the screening of the main components in the dyeing solution and the evaluation of their antibacterial activity.

Figure 3.
Visual overview of the sequential experimental procedures employed in this study: solid–liquid extraction; qualitative phytochemical and antimicrobial tests; dyeing; washing (with cold and hot water); light exposure and color measurement (Created with BioRender.com).
The first step was to extract the coloring agents from the grape pomace using various environmentally friendly solvents. The obtained solutions were concentrated and lyophilized, as described in Section 2.2.1. After rehydration of the lyophilized extracts, the solutions were divided. The majority of the solution was allocated for dyeing assays (detailed in Section 2.2.2), and the remaining solution was used for qualitative screening tests (described in Section 2.2.6) and microbial tests (outlined in Section 2.2.7). The dyeing step was followed by the color fastness evaluation by washing (with hot and cold water) and light exposure tests, as described in Section 2.2.3. The final step was the measurement of the resultant color in the samples, the procedure and presentation details of which were discussed in Section 2.2.4.
3. Results and Discussion
In this section, the results obtained from dyeing experiments conducted with GP extracts will be presented and discussed, aiming to evaluate its potential for coloring fabrics. Before this, a discussion regarding the extraction performance of biodyes from GP and the results of the phytochemical screening of the obtained coloring solutions will be presented.
3.1. Extraction Performance
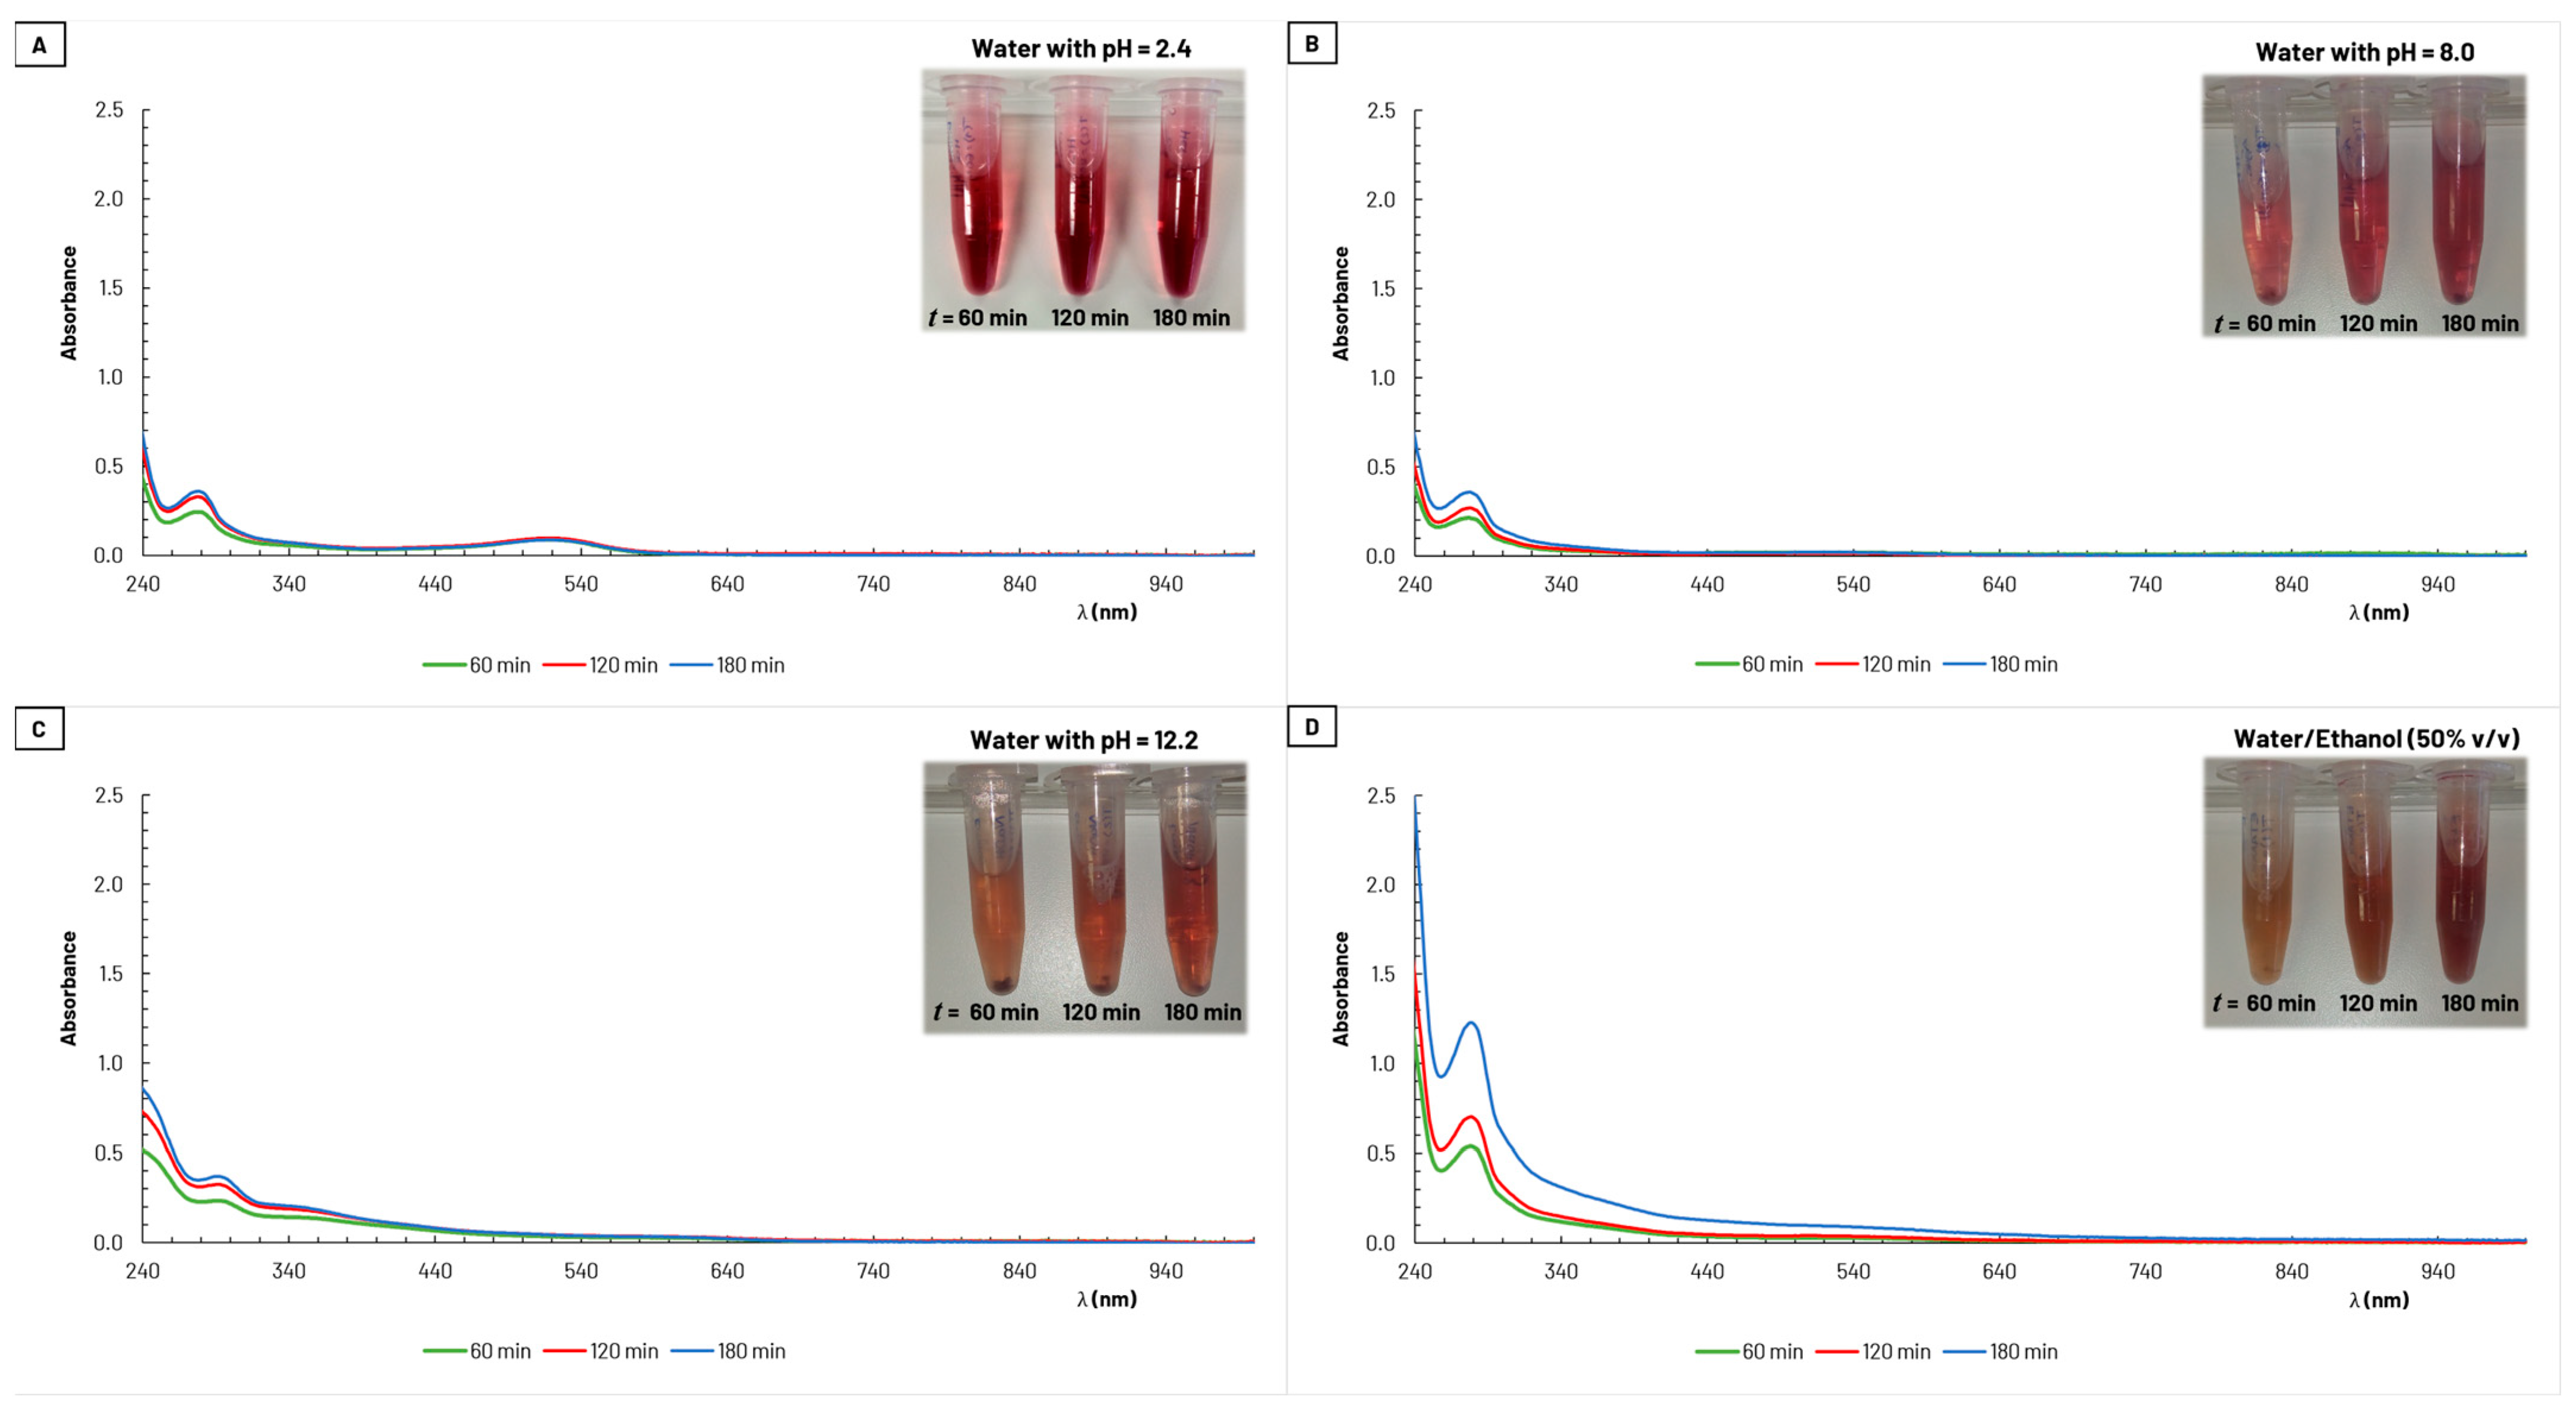
GP is a rich source of bioactive compounds, with phenolic compounds, primarily found in grape seeds and skins, standing out. Among the most prevalent groups of polyphenols are flavonoids, including the anthocyanin family [34,35]. Anthocyanins are pigments responsible for the color of grape pomace, and extracts containing these compounds are an attractive source of natural dyes for textiles [22,23]. These natural pigments exhibit antioxidant properties, with distinct absorption peaks in the UV (260–280 nm) and visible (490–550 nm) wavelength regions [36].
Figure 4 presents the UV–vis absorption spectra obtained for the samples collected during the extraction processes with water and with the alcoholic mixture as solvents. All four graphs (A, B, C, and D), reveal an absorption peak in the UV range, between 260–300 nm, for the different extract conditions used. In graph A, there is also noticeable a smaller and broader absorption peak in the visible region, between 500–560 nm. Both peaks are associated with anthocyanins [36]. An increase in absorbance is observed over the extraction period, indicating an increase of the amount of extracted colorants. However, it is evident that the water/ethanol solution (50% v/v) was the solvent that extracted the highest amount of pigments from the GP.
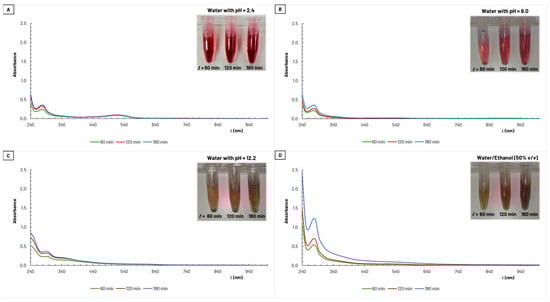
Figure 4.
Absorption spectra for samples (diluted 25×) collected during grape pomace extraction with (A) water with pH = 2.4, (B) water with pH = 8.0, (C) water with pH = 12.2, and (D) water/ethanol (50% v/v).
The extraction yield was calculated after the lyophilization of the obtained extract solutions and ranged from 11% to 19% (on a dry basis of the amount of GP used, with a moisture content of 66%). The lowest value corresponds to extraction carried out with water at pH = 8 as the solvent, while the highest percentage was obtained with a water/ethanol solution (50% v/v), which is in accordance with the magnitude of the absorption peaks in Figure 4.
3.2. Qualitative Phytochemical Tests
The dyeing solutions obtained with the solvents used (water with pH = 2.4, pH = 8.0, and pH = 12.2, as well as the mixture of water/ethanol 50% (v/v)) were qualitatively analyzed for phytochemical composition. Qualitative tests, relying on color or precipitation reactions, were conducted to indicate the presence of specific chemical compounds. The results of these tests are presented in Table 3.
Table 3.
Results of the phytochemical qualitative tests conducted on the dyeing solutions obtained in the extractions of grape pomace with water (pH = 2.4, pH = 8.0, pH = 12.2) and with water/ethanol 50% (v/v).
Saponins were present in noticeable amounts in the dyeing solutions with acid water (pH = 2.4) and water/ethanol 50% (v/v). Moderate amounts were also observed in the dyeing solutions with neutral solvent (pH = 8.0) and basic solvent (pH = 12.2). Saponins are characterized by providing antifungal, antioxidant, and anti-inflammatory properties. These features make saponins versatile, allowing them to be used both in textile printing and as mordants in natural dyeing. Mordants play a crucial role in facilitating the fixation of dyes on textile fibers during the dyeing process. Thanks to their interactive properties with fibers, saponins prove to be an interesting option as mordants in natural dyeing techniques [37,38].
Phenolic compounds are evidently present in all dyeing solutions (Table 3). The majority of these compounds are water-insoluble, with traces of water-soluble phenolic compounds also detected. A significant prevalence of flavonoids was detected, highlighting the importance of this group of polyphenols in the extracts. This justifies the peaks observed in the absorption spectra depicted in Figure 4, attributed to anthocyanins.
In the textile dyeing process, the presence of phenolic compounds can significantly influence the properties and characteristics of the entire process. Water-soluble phenolic compounds play an important role in color transfer during dyeing, as their solubility facilitates interaction with textile fibers. On the contrary, water-insoluble phenolic compounds exhibit more complex characteristics, and their insolubility in water can affect adhesion to textile fibers during the dyeing process, influencing the final properties of fabrics. Phenolic compounds, when binding to textiles, form complexes that disrupt enzyme production, leading to cell death in microorganisms. This inhibition of the growth of bacteria and fungi, which can cause degradation or color staining, can result in increased color fastness and durability on the textile substrate [39].
The presence of flavonoids is usually associated with beneficial activities, encompassing anti-allergic, anti-inflammatory, antimicrobial, and anticancer properties [37,38].
The results of the phytochemical screening shown in Table 3 also indicate the presence of traces of triterpenoids, cardiac glycosides, and combined anthraquinones in all dyeing solutions.
3.3. Dyeing Performance and Final Color
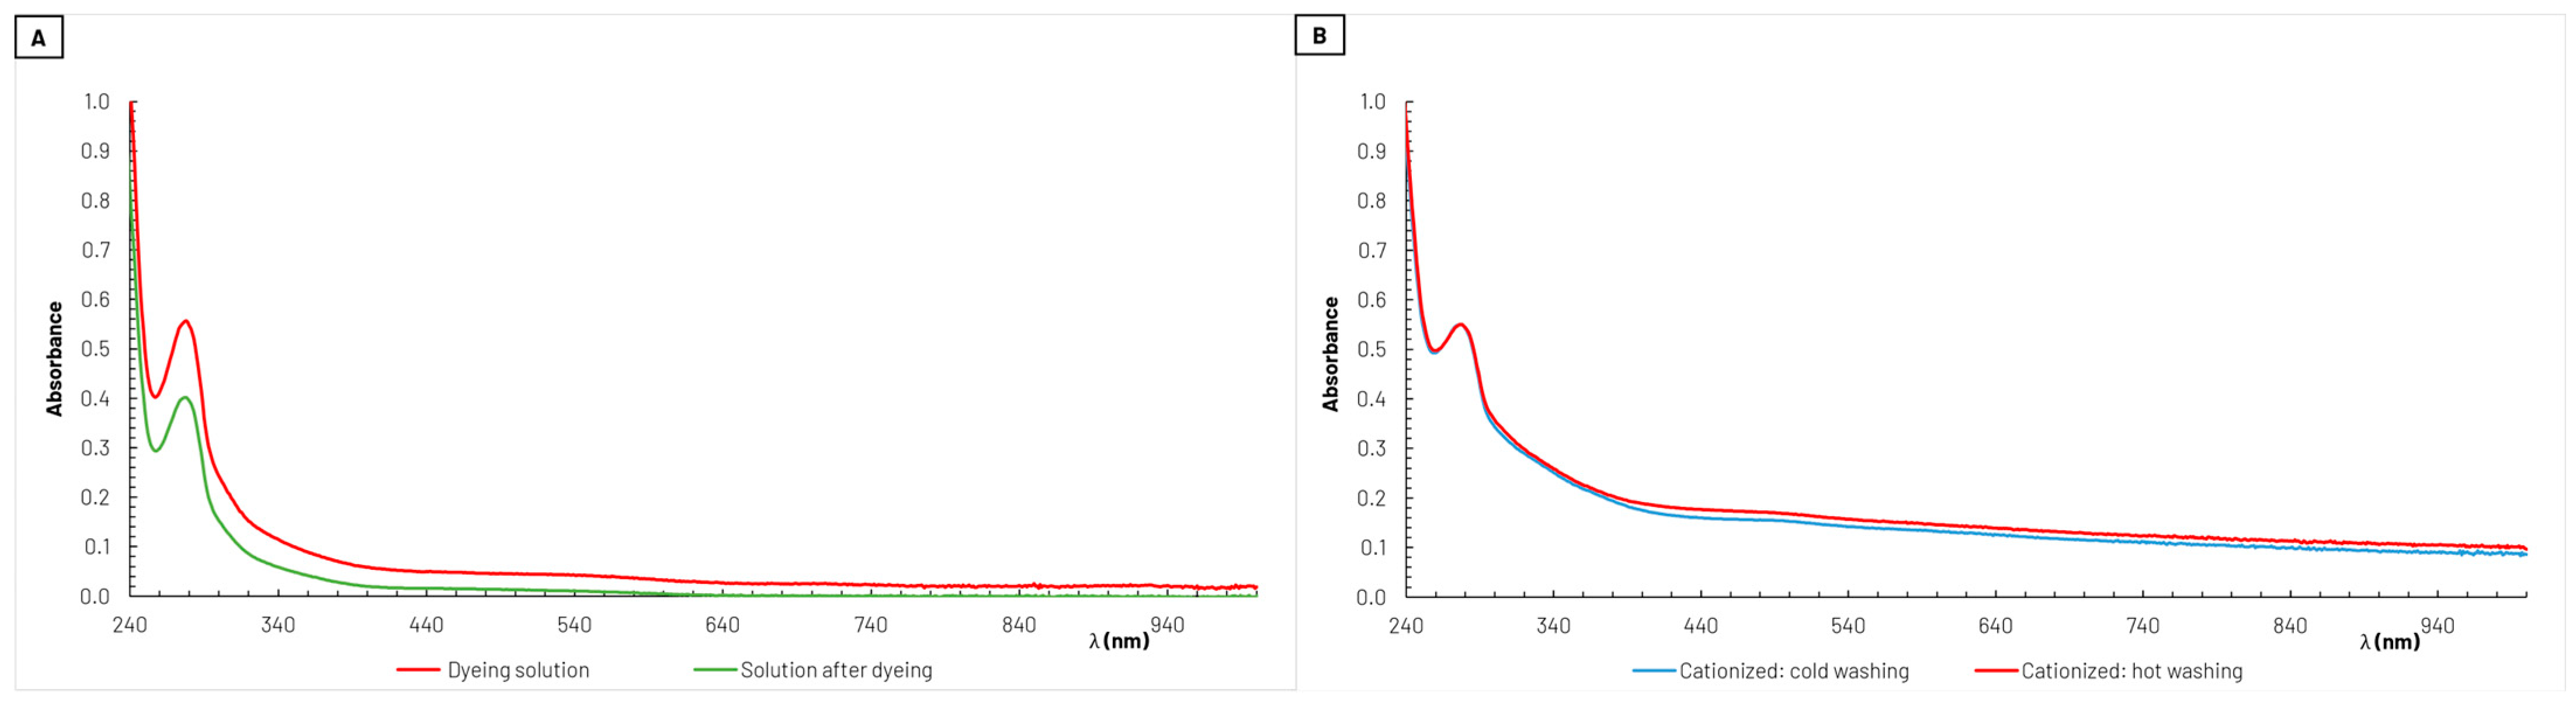
As described in Section 2.2.5, absorption spectra in the UV–vis wavelength range were recorded with coloring solutions before and after the dyeing stage. One example of these spectra obtained during the dyeing process of cationized cotton samples is shown in Figure 5. It is noticeable from this figure (Figure 5A) that the specific absorbance exhibited by the dyeing solution, reflecting the intensity of the color present, decreased after dyeing the textile. This indicates that part of the coloring agents in the dyeing solution was retained in the fabric, as intended.
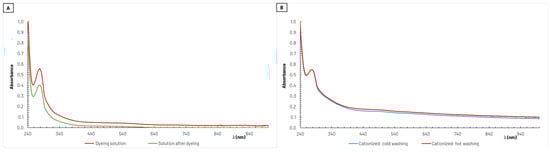
Figure 5.
Example of absorption spectra obtained from the solutions (diluted 50×) before and after the dyeing process of cationized cotton samples during 100 min (A). The dyeing solution used was obtained from grape pomace extraction with water/ethanol 50% (v/v) as solvent, and from the respective solutions (no dilution) after washing the dyed cationized cotton samples, both with cold and hot water (B).
After the dyeing process, the textiles samples underwent both a cold wash and a hot wash. In these stages, some of the dye initially retained in the textiles fibers was released into the washing solutions, as illustrated in Figure 5B for the example shown in Figure 5A. It is important to note that the absorption spectra presented in Figure 5B were obtained directly from the solutions at the end of the washing stages, and no dilution took place. Apparently, in this case, there was no significant difference in the amount of coloring agents released during cold- and hot-water washing. This resilience is crucial for the durability of the dyeing and the ability of fabrics to maintain their vibrant colors over time.
After the washing stages of the dyed samples, they were dried with half of the surface exposed to natural light and the other half in darkness for almost one week. At the end, the final color was assessed in the samples as described in Section 2.2.4. The color discrepancy between the two sides of the same sample, based on the respective values of ΔE*, suggests the absence of perceptible color differences. Only an experienced observer would be able to notice any distinction, as the parameter ΔE* was within the range (0–1) or (1–2) for all cases. The same conclusion was reached when analyzing the ΔE* values for the same sample, on the surfaces both exposed to, and protected from, natural light. These results indicate solid performance in terms of color change resistance due to light exposure in the dyed samples. Based on this, the twelve measurements of color in each sample were used to calculate a representative ΔE* parameter to present the final color obtained in the textile substrates.
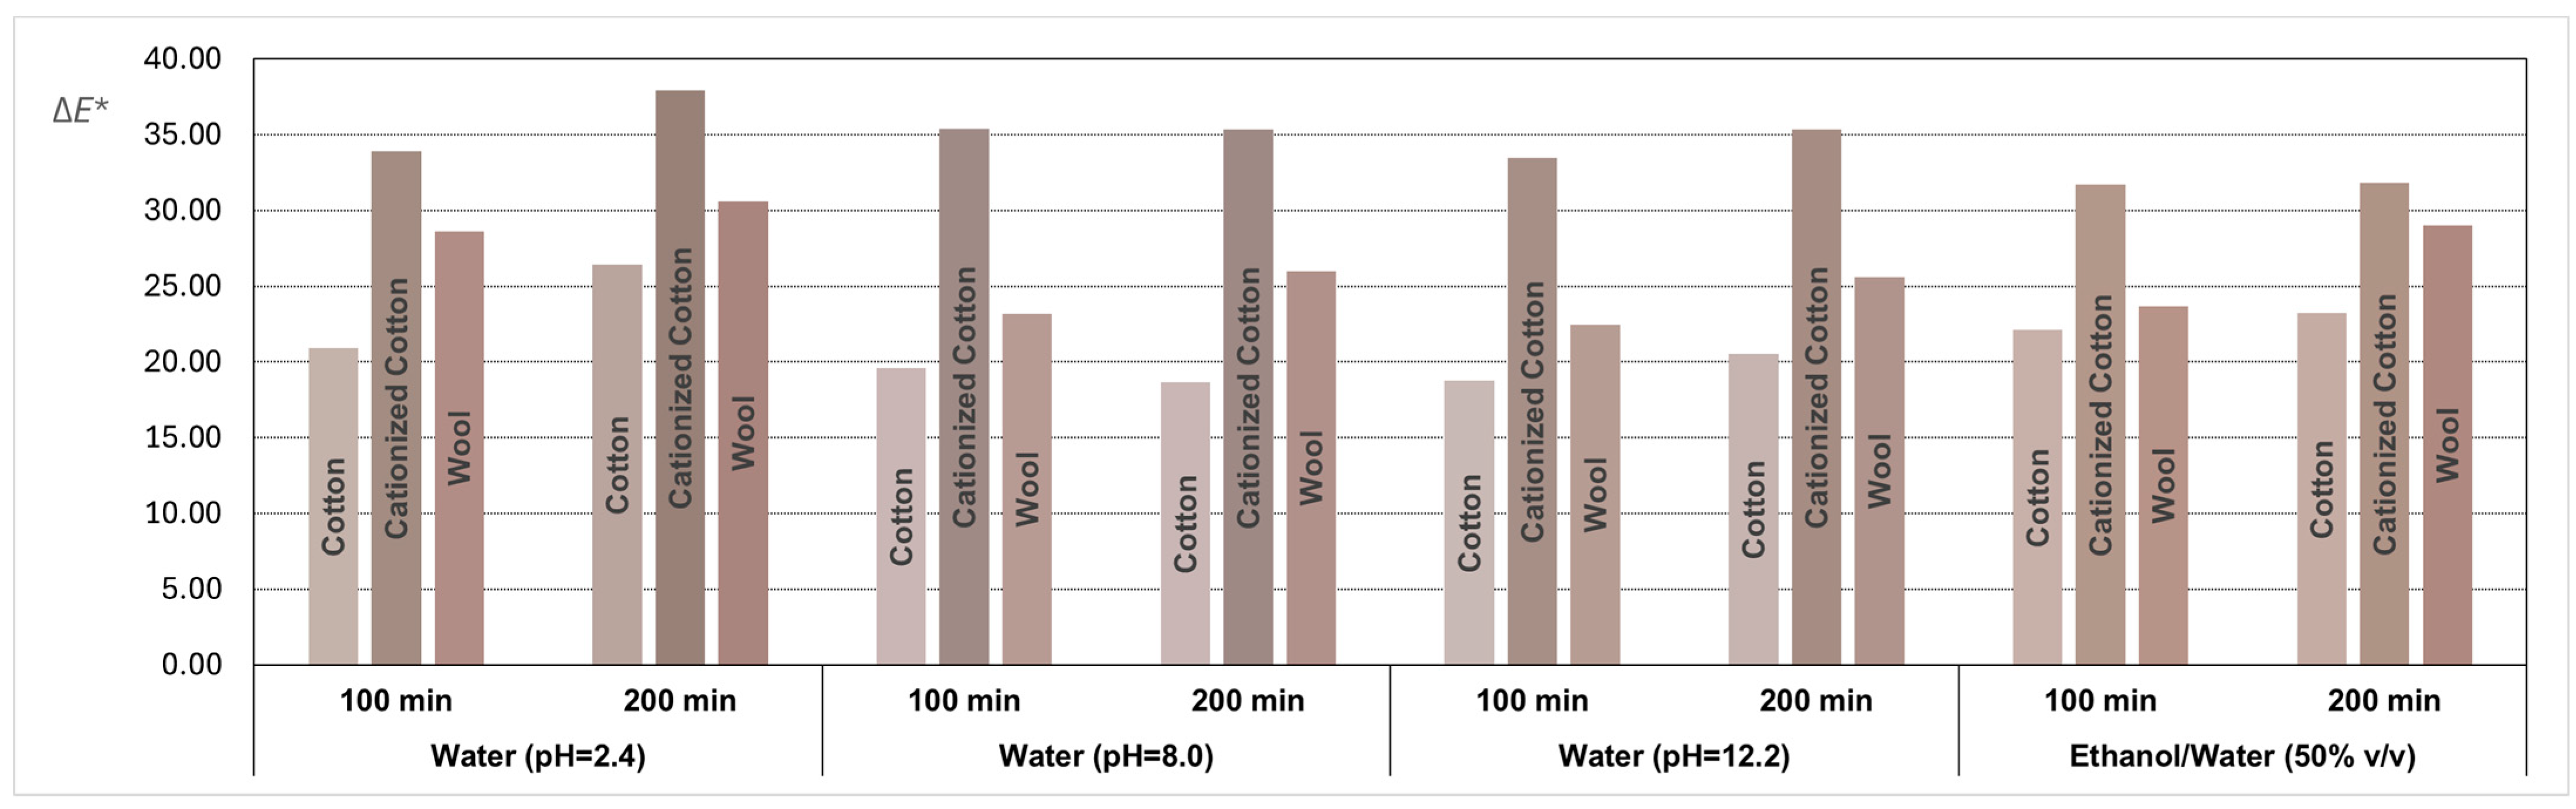
The average coordinates obtained through the CIELAB system were transformed into RGB coordinates to illustrate the final color achieved in all fabric samples dyed with the GP extracts. The results, along with the ΔE* values quantifying the color difference between the dyed fabric samples and their respective control samples, are depicted in the bar graph shown in Figure 6, where the colors of the bars are the true colors obtained in the dyed samples.
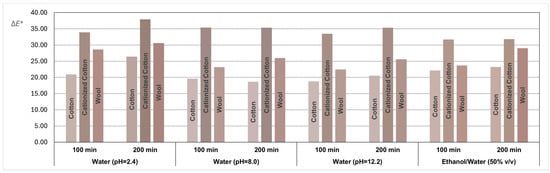
Figure 6.
Bar graph representing the ΔE* values with the colors reproduced through RGB coordinates for all textile samples dyed with dyeing solutions obtained from grape pomace extracts with different solvents.
A visual examination of Figure 6 suggests that the immersion time of textile samples in baths prepared with GP extracts, either for 100 or 200 min, generally does not influence the final color. However, the comparison of colors obtained in the dyed fabric samples and their respective control samples reveals two distinct colors for all conditions and textile substrates (ΔE* >> 5, indicating clear differentiation when visually comparing fabric samples with their respective controls, regardless of the textile substrate used). The earth tones achieved in the dyed textiles samples, reproduced in Figure 6, are aesthetically appealing and possibly have potential for commercial viability.
The cationized cotton samples exhibited a more intense color compared to cotton and wool, as confirmed by the higher ΔE* values. Cotton fibers have a high density of negative charge on the surface due to the presence of hydroxyl groups and ether linkages. This intrinsic characteristic poses a challenge for dyeing processes involving negatively charged polyphenolic dyes commonly found in natural dyes, affecting color performance and fastness properties. The cationization pre-treatment of the cotton surface enhances the uptake of dye substances to cotton fibers. In fact, when comparing the color results between natural cotton samples and cationized cotton samples, the parameter ΔE* is consistently at least 12 units higher. The introduction of cationic groups into the cellulose fibers of cotton through cationization can effectively reduce or neutralize the negative charge effect, thereby increasing the affinity and dyeing performance of natural dyes (mostly anionic) with cotton fibers [40].
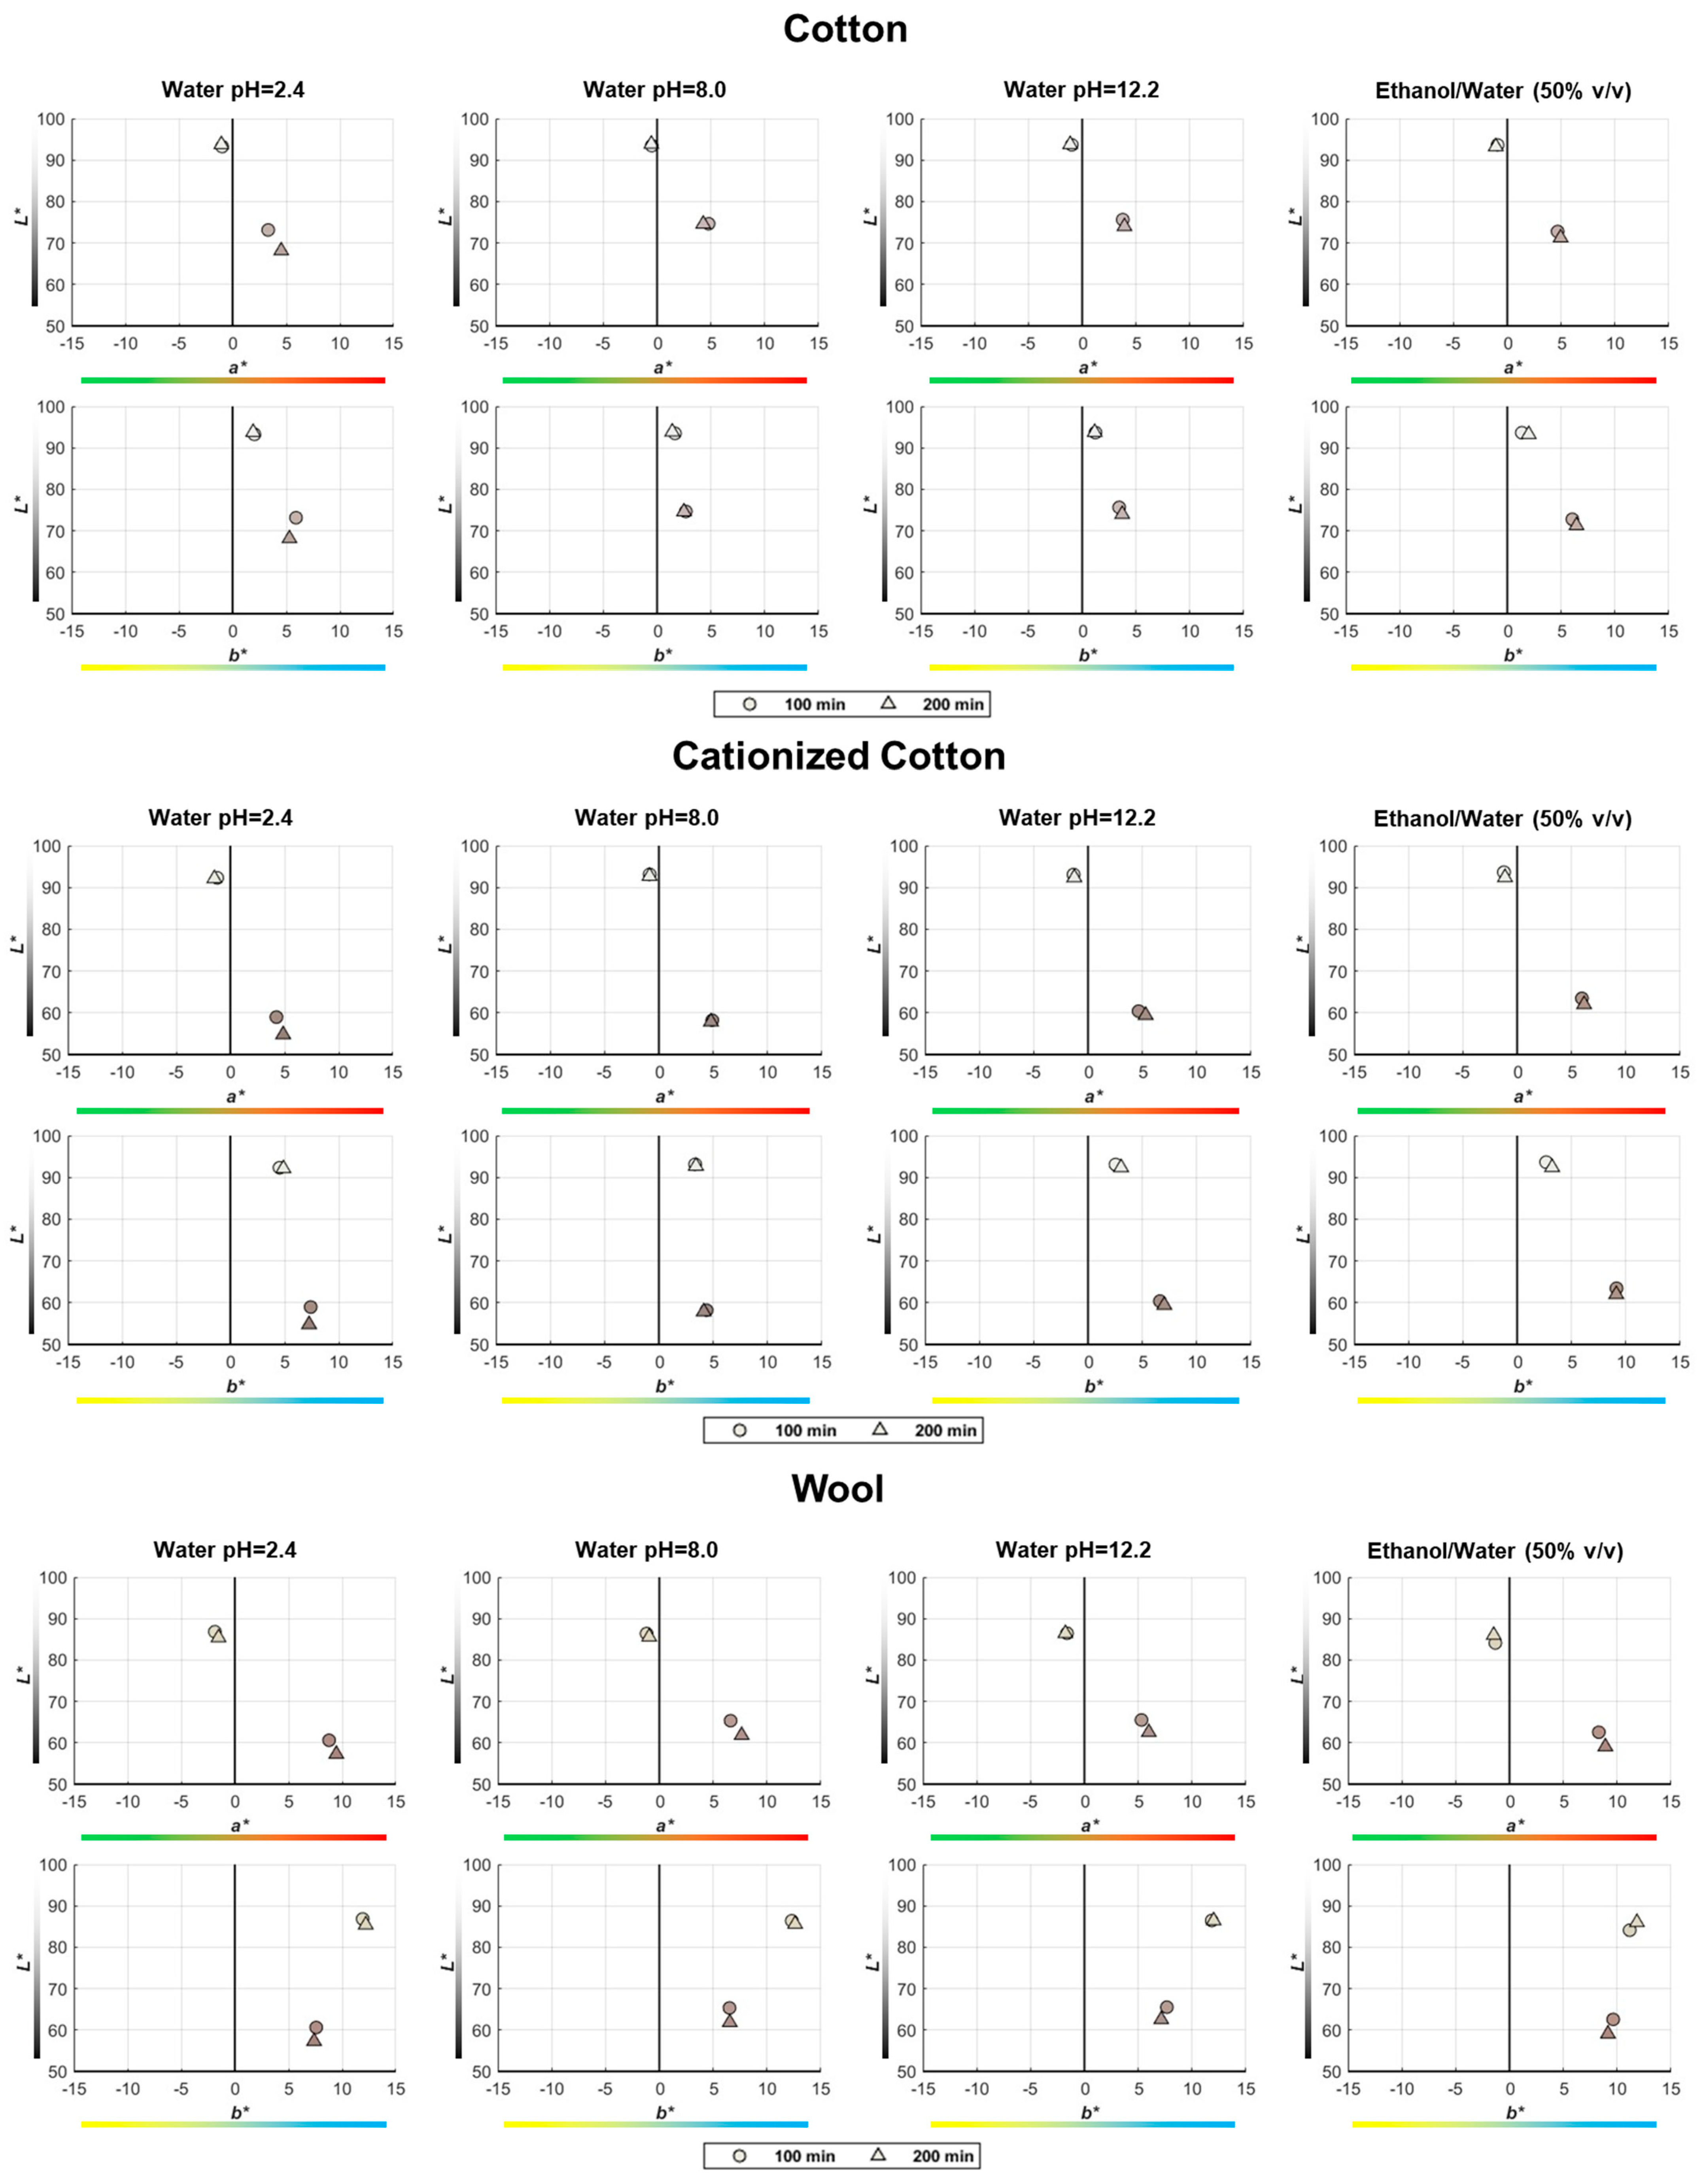
In the CIELAB color space, a point with the coordinates L*, a*, and b* represents any color perceptible by the human eye. The average values of these three coordinates, measured in all textile samples (including controls and dyed samples), are illustrated in Figure 7 using 2D plots showing the data points in two subplots (L* versus a* and L* versus b*). The scale along the L* axis ranges from L* = 0 (black) to L* = 100 (white), with a gradual progression of achromatic grays in between (see Figure 2 and Figure 7). The a* axis corresponds to the opponent colors green and red, while the b* axis corresponds to the opponent colors blue and yellow (see Figure 2 and Figure 7). Symbolic color gradations near the a* and b* axes are indicated in Figure 7. The color symbols used in Figure 7 depict the real color of each sample, as reproduced in Figure 6.
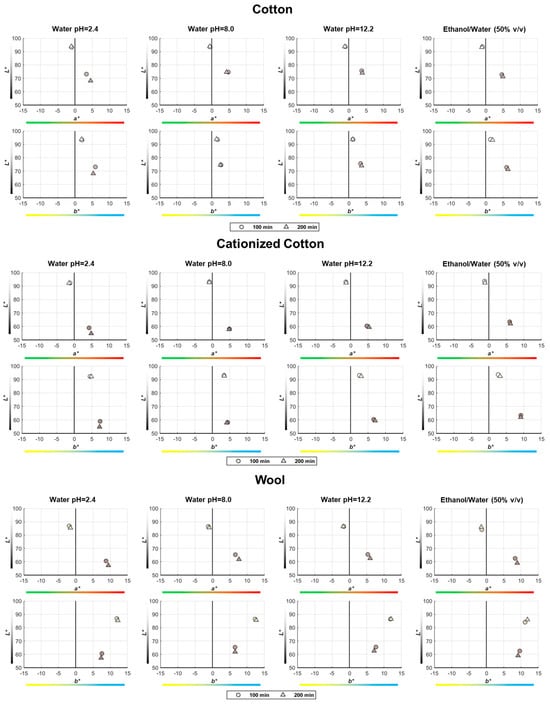
Figure 7.
Position of the true-color points in the CIELAB space corresponding to all control and dyed samples, using 2D subplots (L* versus a* and L* versus b*) to facilitate the observation of the main findings regarding the variation of the a* and b* coordinates during the dyeing process.
As already concluded from the visual inspection of Figure 6, it is now also clear from the representation of the points in the color space that the immersion time (100 or 200 min) of the textile samples in the baths prepared with the pomace grape extracts during dyeing does not significantly influence the final color. However, Figure 7 provides interesting insights into the effect of dyeing on the evolution of the three color coordinates measured in the samples:
- -
- The control samples always have higher L* coordinate values than the dyed samples, with the greatest difference observed for the cationized cotton samples (−30 < ΔL* < −37);
- -
- Although a* < 0 for control samples and a* > 0 for dyed samples, the Δa* coordinate difference is positive in all cases, indicating that the samples became redder after dyeing, regardless of the nature of the textile substrate (Figure 7);
- -
- When comparing the b* coordinate between control and dyed samples (always a positive value), it is higher for cotton samples (Δb* > 0) and lower for wool samples (Δb* < 0) after dyeing, which means that cotton samples become yellower, while wool samples become bluer with dyeing (Figure 7).
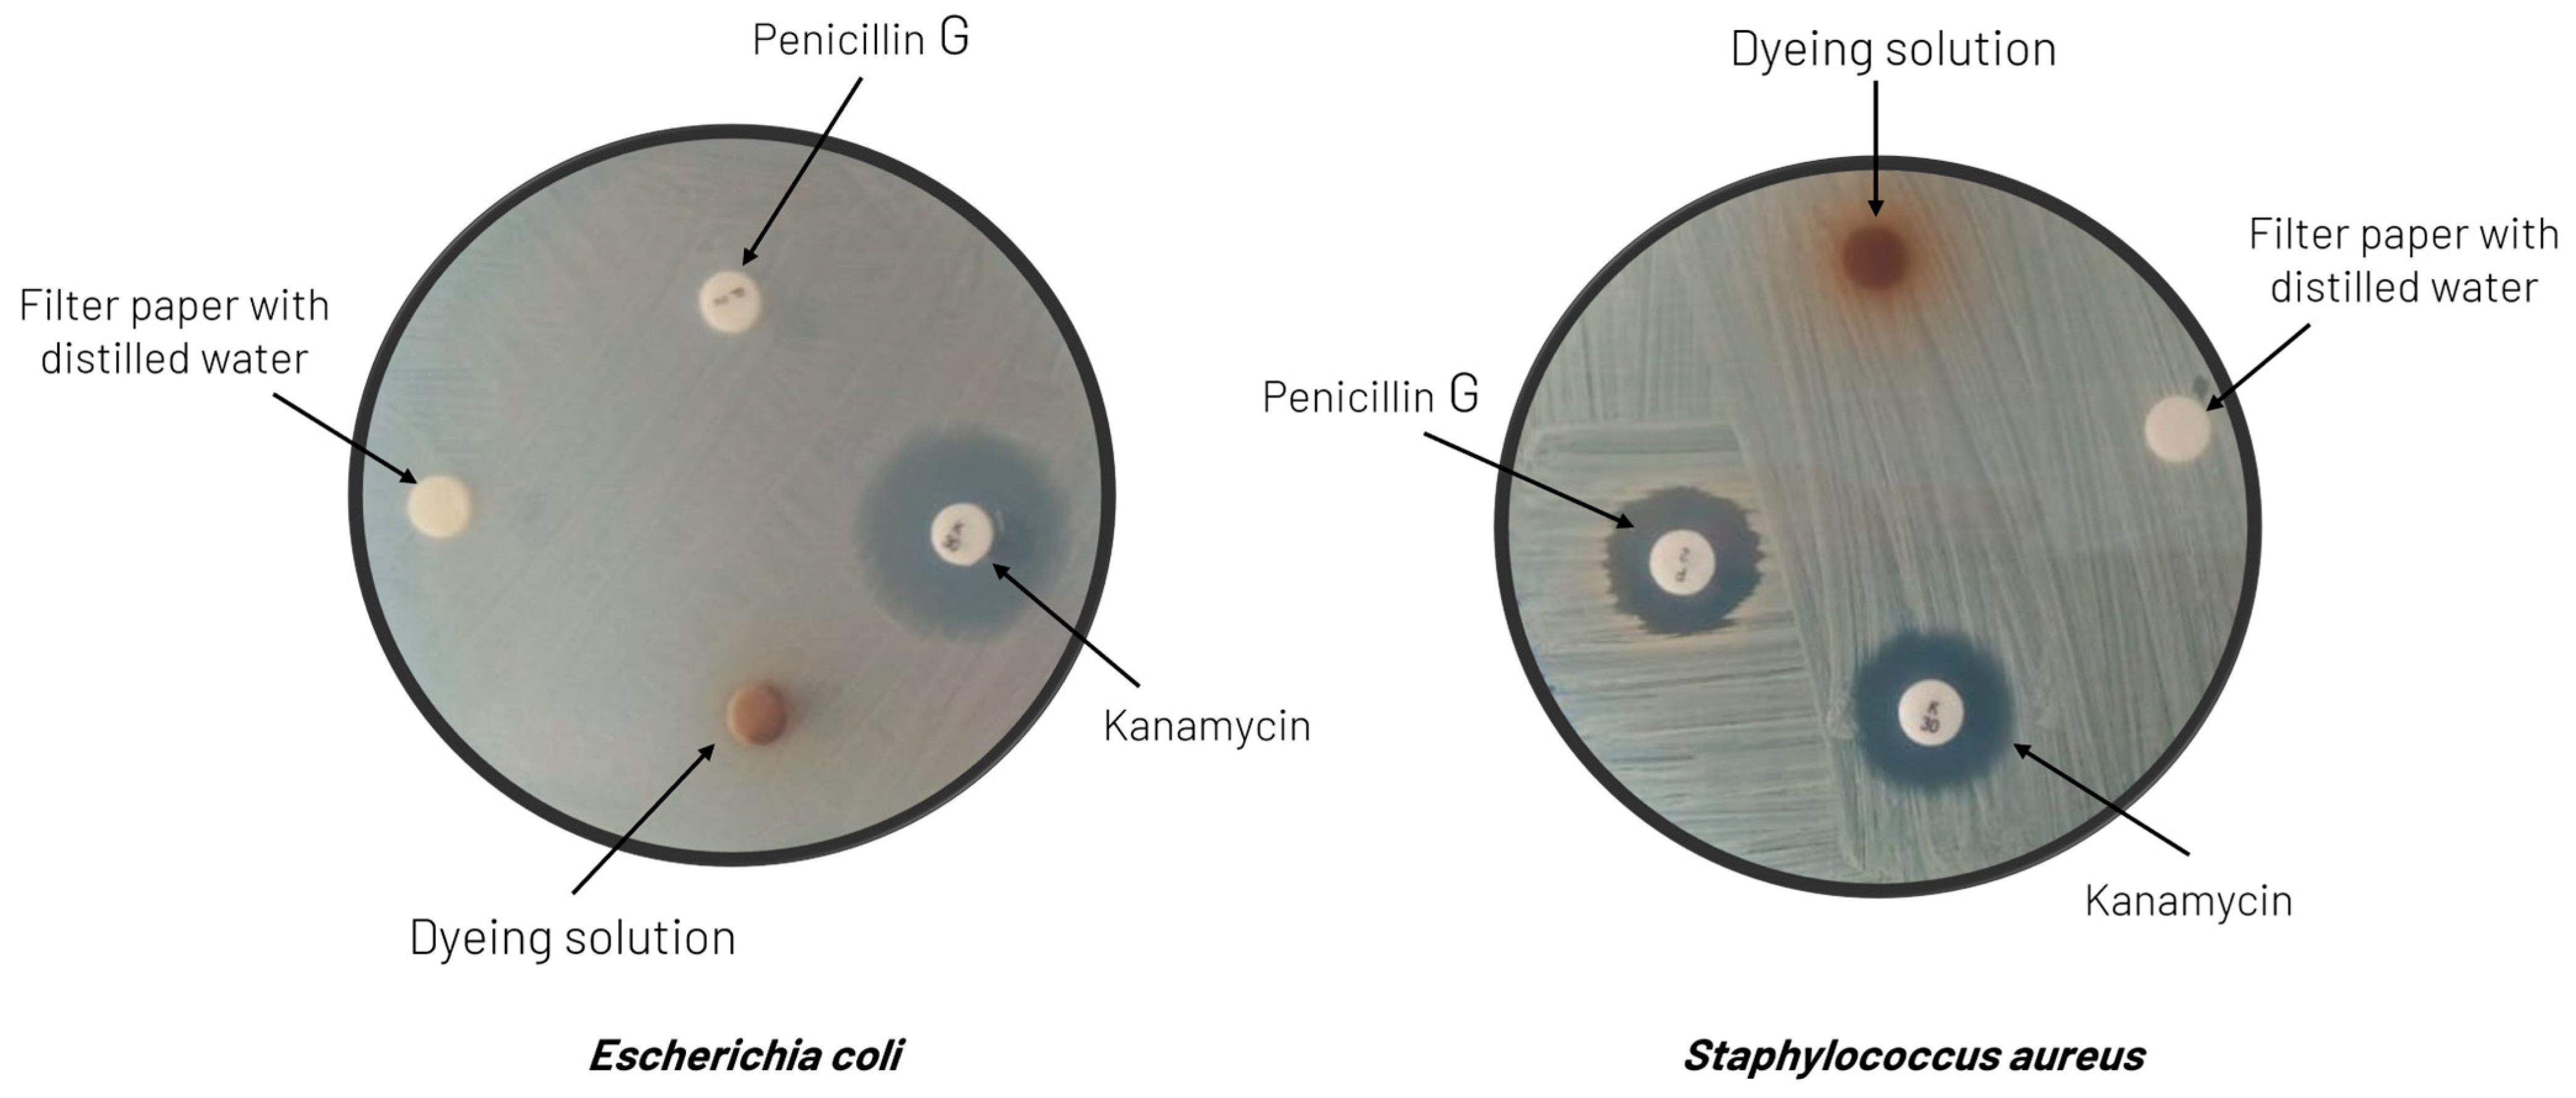
In terms of the potential antimicrobial activity imparted to the textile substrates, the tests described in Section 2.2.7 were conducted with Escherichia coli (Gram-negative bacteria) and Staphylococcus aureus (Gram-positive bacteria). Both bacteria were resistant to all the dyeing solutions, the same behavior as with water (the negative control), presenting no zone of inhibition around the respective disks, which indicates that they did not exhibit any antimicrobial activity. The antibiotics chosen for positive control (kanamycin and penicillin G) confirmed these experimental data. Escherichia coli and Staphylococcus aureus were sensitive to kanamycin, and a zone of inhibition was observed around the disks with this antibiotic. However, in the case of penicillin G, the Escherichia coli strain showed 100% resistance.
Figure 8 displays an example of these results, where it is evident that no zone of inhibition was formed around the disc impregnated with the dyeing solution: only dispersion of color was observed throughout the medium. However, this issue deserves a more comprehensive study using the dyed tissues in the tests rather than the dyeing solutions and also incorporating different microorganisms to perform the tests.
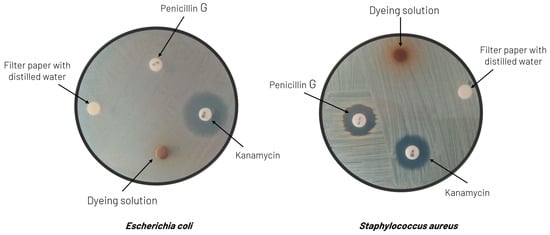
Figure 8.
Results of the antimicrobial activity tests against Escherichia coli (left) and Staphylococcus aureus (right) conducted on the dyeing solution prepared from extracts of grape pomace obtained with water at pH = 2.4 and a mixture of water/ethanol (50%, v/v) as a solvent, respectively.
4. Conclusions
The use of natural dyes derived from waste presents an environmentally sustainable and healthy approach to replace chemical dyes in the textile industry. Dyes obtained from vinicultural waste, using eco-friendly solvents, were used in the present study and demonstrated effectiveness in dyeing samples of cotton (both natural and with a cationization pretreatment) and wool. Maintaining color intensity even with different dyeing times concludes that a 100 min period is sufficient, facilitating the integration of this process into textile production. The earthy tones achieved in the dyed fabrics appear to be commercially interesting and the results seem to indicate that they are resistant to washing and exposure to natural light. The industrial potential of these biodyes extracted from vinicultural waste deserves attention, highlighting the importance of further studies to enhance color properties and durability.
The implementation of standardized methods to assess color fastness and tactile characteristics is essential for the industry to reliably evaluate the performance of dyed textiles. Furthermore, a deep understanding of the dyeing mechanism and antimicrobial properties of the dyed samples will provide valuable information for future applications. Expanding antimicrobial tests to include a wider variety of microorganisms will contribute to a comprehensive understanding of the effectiveness of these biodyes in inhibiting bacterial growth, thus consolidating the significant contributions of this innovative approach to the textile industry.
Author Contributions
Conceptualization, M.N.C.P.; methodology, L.S. and M.N.C.P.; validation, M.N.C.P.; formal analysis, L.S.; investigation, F.D.F. and M.N.C.P.; resources, M.N.C.P.; data curation, F.D.F.; writing—original draft preparation, F.D.F.; writing—review and editing, L.S. and M.N.C.P.; visualization, L.S. and M.N.C.P.; supervision, M.N.C.P.; project administration, M.N.C.P. All authors have read and agreed to the published version of the manuscript.
Funding
This research received no external funding.
Institutional Review Board Statement
Not applicable.
Informed Consent Statement
Not applicable.
Data Availability Statement
The original contributions presented in the study are included in the article; further inquiries can be directed to the corresponding author.
Acknowledgments
The authors would like to thank Tintex Textiles S.A. for providing the textile substrates used in this study and for their invaluable technical support. Special thanks to Brigitte Lagoa and Tânia Silva for their collaboration in the development of the conducted tests.
Conflicts of Interest
The authors declare no conflicts of interest.
References
- Hassaan, M.A.; El Nemr, A.; Hassaan, A. Health and Environmental Impacts of Dyes: Mini Review. Am. J. Environ. Sci. Eng. 2017, 1, 64–67. [Google Scholar]
- Nayak, R.; Panwar, T.; Van Thang Nguyen, L. Sustainability in Fashion and Textiles: A Survey from Developing Country. In Sustainable Technologies for Fashion and Textiles; Elsevier: Amsterdam, The Netherlands, 2019; pp. 3–30. ISBN 9780081028674. [Google Scholar]
- Benkhaya, S.; M’rabet, S.; El Harfi, A. A Review on Classifications, Recent Synthesis and Applications of Textile Dyes. Inorg. Chem. Commun. 2020, 115, 107891. [Google Scholar] [CrossRef]
- Rosen, M.A.; Chi, T.; Cao, H.; Lara, L.; Cabral, I.; Cunha, J. Ecological Approaches to Textile Dyeing: A Review. Sustainability 2022, 14, 8353. [Google Scholar] [CrossRef]
- Rana, S.; Pichandi, S.; Parveen, S.; Fangueiro, R. Natural Plant Fibers: Production, Processing, Properties and Their Sustainability Parameters. In Roadmap to Sustainable Textiles and Clothing; Springer: Berlin/Heidelberg, Germany, 2014; pp. 1–35. [Google Scholar]
- Plakantonaki, S.; Kiskira, K.; Zacharopoulos, N.; Chronis, I.; Coelho, F.; Togiani, A.; Kalkanis, K.; Priniotakis, G. A Review of Sustainability Standards and Ecolabeling in the Textile Industry. Sustainability 2023, 15, 11589. [Google Scholar] [CrossRef]
- Pizzicato, B.; Pacifico, S.; Cayuela, D.; Mijas, G.; Riba-Moliner, M. Advancements in Sustainable Natural Dyes for Textile Applications: A Review. Molecules 2023, 28, 5954. [Google Scholar] [CrossRef] [PubMed]
- Elsahida, K.; Fauzi, A.M.; Sailah, I.; Siregar, I.Z. Sustainability of the Use of Natural Dyes in the Textile Industry. IOP Conf. Ser. Earth Environ. Sci. 2019, 399, 012065. [Google Scholar] [CrossRef]
- Che, J.; Yang, X. A Recent (2009–2021) Perspective on Sustainable Color and Textile Coloration Using Natural Plant Resources. Heliyon 2022, 8, e10979. [Google Scholar] [CrossRef] [PubMed]
- Brudzyńska, P.; Sionkowska, A.; Grisel, M. Plant-Derived Colorants for Food, Cosmetic and Textile Industries: A Review. Materials 2021, 14, 3484. [Google Scholar] [CrossRef] [PubMed]
- Pinheiro, M.N.C.; Lagoa, B.; Campos, L.; Silva, T.; Castro, L.M. Valorization of Arbutus Fruits Wastes as Bio-Dyes for Textiles Industry. In Proceedings of the Book of Poster Abstracts [P2.32]; International Symposium on Dyes & Pigments-Modern Colorants, Seville, Spain, 8–11 September 2019; p. 96. [Google Scholar]
- Lagoa, B.; Campos, L.; Silva, T.; Moreira, M.J.; Castro, L.M.; Veloso, A.C.A.; Pinheiro, M.N.C. Winery wastes: A potential source of natural dyes for textiles. In Wastes: Solutions, Treatments and Opportunities III (Selected Papers from the 5th International Conference Wastes 2019, 4–6 September 2019, Lisbon, Portugal); Vilarinho, C., Castro, F., Gonçalves, M., Fernando, A.L., Eds.; Taylor & Francis Group: Leiden, The Netherlands, 2020; pp. 69–74. ISBN 978-0367-25777-4. [Google Scholar] [CrossRef]
- Pinheiro, M.N.C.; Symochko, L.; Castro, L.M. Valorization of Cork Industry By-Products as Sustainable Natural Dyes for Textiles. ACS Sustain. Chem. Eng. 2023, 11, 10555–10565. [Google Scholar] [CrossRef]
- Dulo, B.; De Somer, T.; Phan, K.; Roosen, M.; Githaiga, J.; Raes, K.; De Meester, S. Evaluating the Potential of Natural Dyes from Nutshell Wastes: Sustainable Colouration and Functional Finishing of Wool Fabric. Sustain. Mater. Technol. 2022, 34, e00518. [Google Scholar] [CrossRef]
- Jose, S.; Pandit, P.; Pandey, R. Chickpea Husk–A Potential Agro Waste for Coloration and Functional Finishing of Textiles. Ind. Crops Prod. 2019, 142, 111833. [Google Scholar] [CrossRef]
- Olgierd, S. The Wine Sector Management in Portugal: An Overview on Its Three-Dimensional Sustainability. Manag. Sustain. Dev. Sibiu 2021, 13, 39–48. [Google Scholar]
- Genisheva, Z.; Soares, M.; Oliveira, J.M.; Carvalho, J. Wine Production Wastes, Valorization, and Perspectives. In Advances and Challenges in Hazardous Waste Management; IntechOpen: London, UK, 2023. [Google Scholar]
- European Commission. A New Circular Economy Action Plan for a Cleaner and More Competitive Europe; European Comission: Brussels, Belgium, 2020. [Google Scholar]
- Santos, J.R.F.; Rodrigues, R.P.; Quina, M.J.; Gando-Ferreira, L.M. Recovery of Value-Added Compounds from Winery Wastewater: A Review and Bibliometric Analysis. Water 2023, 15, 1110. [Google Scholar] [CrossRef]
- Cañadas, R.; Díaz, I.; Rodríguez, M.; González, E.J.; González-Miquel, M. An Integrated Approach for Sustainable Valorization of Winery Wastewater Using Bio-Based Solvents for Recovery of Natural Antioxidants. J. Clean. Prod. 2022, 334, 130181. [Google Scholar] [CrossRef]
- Caponio, G.R.; Minervini, F.; Tamma, G.; Gambacorta, G.; De Angelis, M. Promising Application of Grape Pomace and Its Agri-Food Valorization: Source of Bioactive Molecules with Beneficial Effects. Sustainability 2023, 15, 9075. [Google Scholar] [CrossRef]
- Baaka, N.; Ben, T.M.; Haddar, W.; Hammami, S.; Mhenni, M.F. Extraction of Natural Dye from Waste Wine Industry: Optimization Survey Based on a Central Composite Design Method. Fibers Polym. 2015, 16, 38–45. [Google Scholar] [CrossRef]
- Baaka, N.; Haddar, W.; Ben Ticha, M.; Mhenni, M.F. Eco-Friendly Dyeing of Modified Cotton Fabrics with Grape Pomace Colorant: Optimization Using Full Factorial Design Approach. J. Nat. Fibers 2019, 16, 652–661. [Google Scholar] [CrossRef]
- Walbridge-Jones, S. Microspectrophotometry for Textile Fiber Color Measurement. Identif. Text. Fibers 2009, 165–180. [Google Scholar] [CrossRef]
- Defining and Communicating Color: The CIELAB System 2013. Sappi Fine Paper North America. Available online: https://www.sappi.com (accessed on 15 February 2024).
- Mokrzycki, W.; Tatol, M. Color Difference Delta E-A Survey Colour Difference ∆E-A Survey. Mach. Graph. Vis. 2011, 20, 383–411. [Google Scholar]
- Vesoul, J.; Cock, I. An Examination of the Medicinal Potential of Pittosporum Phylliraeoides: Toxicity, Antibacterial and Antifungal Activities. Pharmacogn. Commun. 2011, 1, 8–17. [Google Scholar] [CrossRef]
- Oyedapo, O.O.; Sab, F.C.; Olagunju, J.A. Bioactivity of Fresh Leaves of Lantana Camara. Biomed. Lett 1999, 59, 175–183. [Google Scholar]
- Duraipandiyan, V.; Ayyanar, M.; Ignacimuthu, S. Antimicrobial Activity of Some Ethnomedicinal Plants Used by Paliyar Tribe from Tamil Nadu, India. BMC Complement. Altern. Med. 2006, 6, 35. [Google Scholar] [CrossRef] [PubMed]
- Djipa, C.D.; Delmée, M.; Quetin-Leclercq, J. Antimicrobial Activity of Bark Extracts of Syzygium jambos (L.) Alston (Myrtaceae). J. Ethnopharmacol. 2000, 71, 307–313. [Google Scholar] [CrossRef] [PubMed]
- Nortjie, E.; Basitere, M.; Moyo, D.; Nyamukamba, P. Extraction Methods, Quantitative and Qualitative Phytochemical Screening of Medicinal Plants for Antimicrobial Textiles: A Review. Plants 2022, 11, 2011. [Google Scholar] [CrossRef]
- Bauer, A.W.; Kirby, W.M.; Sherris, J.C.; Turck, M. Antibiotic Susceptibility Testing by a Standardized Single Disk Method. Am. J. Clin. Pathol. 1966, 45, 493–496. [Google Scholar] [CrossRef] [PubMed]
- Khan, Z.A.; Siddiqui, M.F.; Park, S. Current and Emerging Methods of Antibiotic Susceptibility Testing. Diagnostics 2019, 9, 49. [Google Scholar] [CrossRef] [PubMed]
- Drosou, C.; Kyriakopoulou, K.; Bimpilas, A.; Tsimogiannis, D.; Krokida, M. A Comparative Study on Different Extraction Techniques to Recover Red Grape Pomace Polyphenols from Vinification Byproducts. Ind. Crops Prod. 2015, 75, 141–149. [Google Scholar] [CrossRef]
- Tournour, H.H.; Segundo, M.A.; Magalhães, L.M.; Barreiros, L.; Queiroz, J.; Cunha, L.M. Valorization of Grape Pomace: Extraction of Bioactive Phenolics with Antioxidant Properties. Ind. Crops Prod. 2015, 74, 397–406. [Google Scholar] [CrossRef]
- Lombard, K.A.; Geoffriau, E.; Peffley, E. Flavonoid Quantification in Onion by Spectrophotometric and High Performance Liquid Chromatography Analysis. HortScience 2002, 37, 682–685. [Google Scholar] [CrossRef]
- Byadgi, S.; Kulloli, S.; Venugopal, C. Phytochemical Screening and Antimicrobial Activity of Plant Extracts for Textile Applications. Int. J. Biochem. Res. Rev. 2018, 20, 1–10. [Google Scholar] [CrossRef]
- Alapati, P.; Shaik, S.K. Phytochemical Screening of 20 Plant Sources for Textiles Finishing. Int. J. Adv. Res. 2015, 3, 1391–1398. [Google Scholar]
- Afonso, T.B.; Bonifácio-Lopes, T.; Costa, E.M.; Pintado, M.E. Phenolic Compounds from By-Products for Functional Textiles. Materials 2023, 16, 7248. [Google Scholar] [CrossRef] [PubMed]
- Zhang, Y.; Shahid-ul-Islam; Rather, L.J.; Li, Q. Recent Advances in the Surface Modification Strategies to Improve Functional Finishing of Cotton with Natural Colourants-A Review. J. Clean. Prod. 2022, 335, 130313. [Google Scholar] [CrossRef]
Disclaimer/Publisher’s Note: The statements, opinions and data contained in all publications are solely those of the individual author(s) and contributor(s) and not of MDPI and/or the editor(s). MDPI and/or the editor(s) disclaim responsibility for any injury to people or property resulting from any ideas, methods, instructions or products referred to in the content. |
© 2024 by the authors. Licensee MDPI, Basel, Switzerland. This article is an open access article distributed under the terms and conditions of the Creative Commons Attribution (CC BY) license (https://creativecommons.org/licenses/by/4.0/).