Article

A Multi-Objective Scenario Study of County Land Use in Loess Hilly Areas: Taking Lintao County as an Example

School of Geography and Environmental Sciences, Northwest Normal University, Lanzhou 730070, China
*
Author to whom correspondence should be addressed.
Sustainability 2024, 16(8), 3178; https://doi.org/10.3390/su16083178
Submission received: 1 March 2024 / Revised: 1 April 2024 / Accepted: 3 April 2024 / Published: 10 April 2024

Abstract

:
Land use serves as a connecting link between human activities and the natural ecology of the surface; under the multi-objective background of national policies and dual-carbon tasks, land use transformation is studied and simulated in multiple scenarios, and carbon stock changes are analyzed based on future land use to explore the path for a region to achieve multi-objective coordination. Drawing upon land use data from 2000 to 2020 in Lintao County, Gansu Province, we conducted an in-depth analysis of the dynamics governing land use transformation. Subsequently, employing the FLUS (Future Land Use Simulation) model, we simulated the projected land use for Lintao County in 2035 under various scenarios. Furthermore, we utilized the InVEST (Integrated Valuation of Ecosystem Services and Trade-offs) model to assess the change in carbon stock within the study area under each scenario. These analyses aim to furnish a robust scientific foundation for future land use planning endeavors in Lintao County. The conclusions are as follows: (1) The land use transition in Lintao County from 2000 to 2020 showed the strongest motivation for construction land growth, with continued rapid growth in the scale of urban land and other construction land and relatively slow growth in the land for rural settlement areas, while cropland and water areas continued to decrease, forest land grew slowly, the magnitude of land use change exhibited a higher intensity in river townships compared with mountainous townships. (2) The simulation results of cropland protection scenario (CPS), ecological protection scenario (EPS), economic development scenario (EDS), and comprehensive development scenario (CDS) in 2035 are better. Among them, the CDS, which considers various types of higher-level strategic requirements and can compensate for the single-goal nature of the single-demand scenario, demonstrates a higher level of rationality in the land use pattern. (3) The total carbon stock in descending order is the EPS, CDS, EDS, and CPS. Among these, the CDS is at a higher level of total carbon stock, and the changes in carbon stock in each land use site are more balanced, which is an ideal carbon stock state and a scenario more in line with multi-objective coordination.

1. Introduction

Since the initiation of reform and opening up policies, China’s socio-economy and urbanization have been rapidly developed, and land-use problems of rapid growth of construction land and decreasing cropland, forest land, and grassland have become increasingly prominent [1,2]. Although China’s urbanization rate has reached 65.22% by 2022, the rural settlement areas of urban and rural construction land will continue to increase [3], the problems of non-grain conversion and abandonment of cropland and ecological problems such as the occupation of forest, grassland, and water areas are more prominent [4], China’s land use during the transition period will present a complex and contradictory structural adjustment problem, making it difficult to adapt to and support multiple national strategic demands, rural revitalization, food security, and ecological security. Especially at the county level, where all types of policies are implemented, the problem of multi-objective conflicts in land use structure adjustment is more acute, which is mainly manifested as different demand dynamics for towns and villages, rural settlement areas, and other construction land, the different ways to protect and utilize the prime cropland, general cropland, and sloping cropland, as well as different management of the ecological space such as forest land, grassland, and river wetlands. The research on land use structure relying on the traditional six types of land use (construction land, cropland, forest land, grassland, water area, and unused land) makes it difficult to understand the multiple demand drivers of land use change and the land use conflicts between demands in the county during the transition period, and there is an immediate requirement to refine types of land use and distinguish between various land use categories in order to explore a scientific approach to resolving conflicts arising from multiple land use objectives. In addition, land use changes in carbon stock changes have an important ecological impact [5], but also directly related to the national “carbon peak” “carbon neutral” task, land use structural adjustment is bound to reflect the development requirements of the dual-carbon goals. “The Fourteenth Five-Year Plan” proposes to establish a new pattern for the development and protection of territorial space and gradually form the urbanized areas, the main production areas of agricultural products, the ecological functional areas of the three major spatial patterns, the formation of the main function of the obvious, complementary advantages, the high quality of the development of the territorial spatial development and protection of the new pattern. The twentieth Party Congress report pointed out that it is necessary to “Promote the construction of urbanization with counties as an important carrier”; county-level land space planning should clearly delineate and implement the three control lines of ecological conservation red line, permanent prime cropland, and urban development boundary. Therefore, there is an urgent need to strengthen the multi-industry and multi-objective coordination of the land use of a multi-scenario simulation study to explore the land use adjustment path suitable for the sustainable development of the county. This is not only one of the basic requirements of the scientific implementation of the “three control lines”, but also to promote new urbanization and rural revitalization strategies, which are important changes. It is also an important measure to strengthen food security, ecological security, and carbon neutral strategy.
Land use scenario simulation can explore the process, pattern, and mechanism of land use change under different development goals, which serves as a pivotal component in scientific planning and classification of land use, and has experienced single-type land use multi-scenario simulation research, mainly focusing on urban spatial growth, cropland and ecological protection, and dual-type land use multi-scenario simulation research (city-cropland, city-ecology, cropland-ecology) and integrated land use multi-scenario simulation research process. In the world, model exploration [6,7,8], simulation framework [9], simulation type [10], and simulation application [11,12,13] have been carried out earlier to simulate urban spatial growth during rapid urbanization, providing a scientific groundwork for choosing reasonable urban spatial scale, development direction, and morphology, and also providing assistance in establishing urban growth boundaries under the role of cropland and ecological protection [14]. The multi-scenario study of cropland protection has been carried out at the levels of spatial distribution and scale change in China [15,16], water area [17], municipalities [18], and different geomorphological units [19,20], as well as the simulation study of cropland under the impacts of urbanization and ecology [21,22,23]. Ecological protection multi-scenario study mainly focuses on the large-scale level, such as water area [24] and provinces [25], and the distribution change and simulation of different types of ecological space [26]. Integrated land use simulation studies mainly carry out a multi-scenario simulation study of land use with different development speeds, development goals and development focuses at different levels of the six major land use types, such as the whole country [27], water area [28,29], urban agglomerations [30], cities [31], as well as a three-life spatial multi-situational simulation study for large regions [32], provinces [33], and municipalities [34] that serves homeland spatial planning. In recent years, land use simulation research has attracted much attention. There are studies on water resources [35], ecosystem services [36], disasters [37], wetlands [38], etc. The research areas involve Africa, North America, and Southeast Asia, and it can be found that most of the studies mention “sustainable development”.
The research into changes in land use and carbon stock has continuously deepened, and paths for optimizing the land use structure to improve regional carbon stock capacity have been explored. Research on land use and carbon stock has gradually focused on ecological land use to cropland and construction land use and has experienced an understanding process from protecting ecological land use [39] to protecting cropland [40] to restrict the expansion of construction land use [41] to improve regional carbon stock capacity and slow down the decrease in carbon stock.
The model method is an important tool for land-use simulation research and has undergone the process of improvement from a single model to an integrated model for land-use change simulation, the process of integrating land-use change and land-use carbon stock simulation to meet increasingly complex research needs. For example, from the single model SD (System dynamic) [27], CLUE-S (Conversion of Land Use and its Effects at Small Region Extent), CA (Celluar Automata) [23], etc., to the CA-Markov model [42], Markov-CLUE-S model [26], and the integrated use of the FLUS model, Liu et al. proposed the FLUS model based on CA, which possesses higher simulation accuracy than other traditional models [43]. Among numerous carbon stock calculation models, the InVEST model is widely used due to its high precision, ease of operation, data visualization capabilities, and other features [44].
In general, land use scenario simulation research has experienced a multi-scenario simulation research process from single-type land use, dual-type land use to comprehensive land use, and multi-objective comprehensive research is still insufficient; scenario simulation based on the six categories of land use types and the three living spaces is difficult to understand the direction and driving differences of different land use types, especially for the different development demand-driven urban land and rural settlement area, the different protection and use of prime cropland and general cropland and sloping cropland, the different management levels of ecological red line, forest land, grassland and river wetlands, etc., which need to be differentiated, especially for the different subdivided land use with significant differences in carbon stock; from the perspective of research scale, the large and large scales dominate the study, and there is insufficient research on county scales; from the perspective of research methods, the research on carbon stock based on multi-scenario simulation and InVEST model is helpful to improve the scientific and rational multi-objective selection. Therefore, we divide cropland into general cropland and sloping cropland and divide construction land into urban land, rural settlement area, and other construction land. Under the guidance of multi-objective coordination, diversified and comprehensive simulation scenarios are set up. We hypothesized that through the above work, more complex and subtle changes in land use could be recognized, and the combination of land use scenario modeling and carbon stock studies can provide scientific reference for Lintao County to explore the land use adjustment path for sustainable development and to achieve multi-objective coordination.
This paper takes Lintao County, Dingxi City, Gansu Province, as the study area and refines the land types of the study area into nine categories: general cropland, sloping cropland with a slope of more than 25 degrees, forest land, grassland, water area, urban land, rural settlement area, other construction land, and unused land, and sets up four scenarios of cropland protection, ecological protection, economic development, and comprehensive development, based on the FLUS model and InVEST model, the study area is predicted to analyze the future land use pattern and carbon stock changes under the four scenarios in 2035.

2. Study Area and Materials

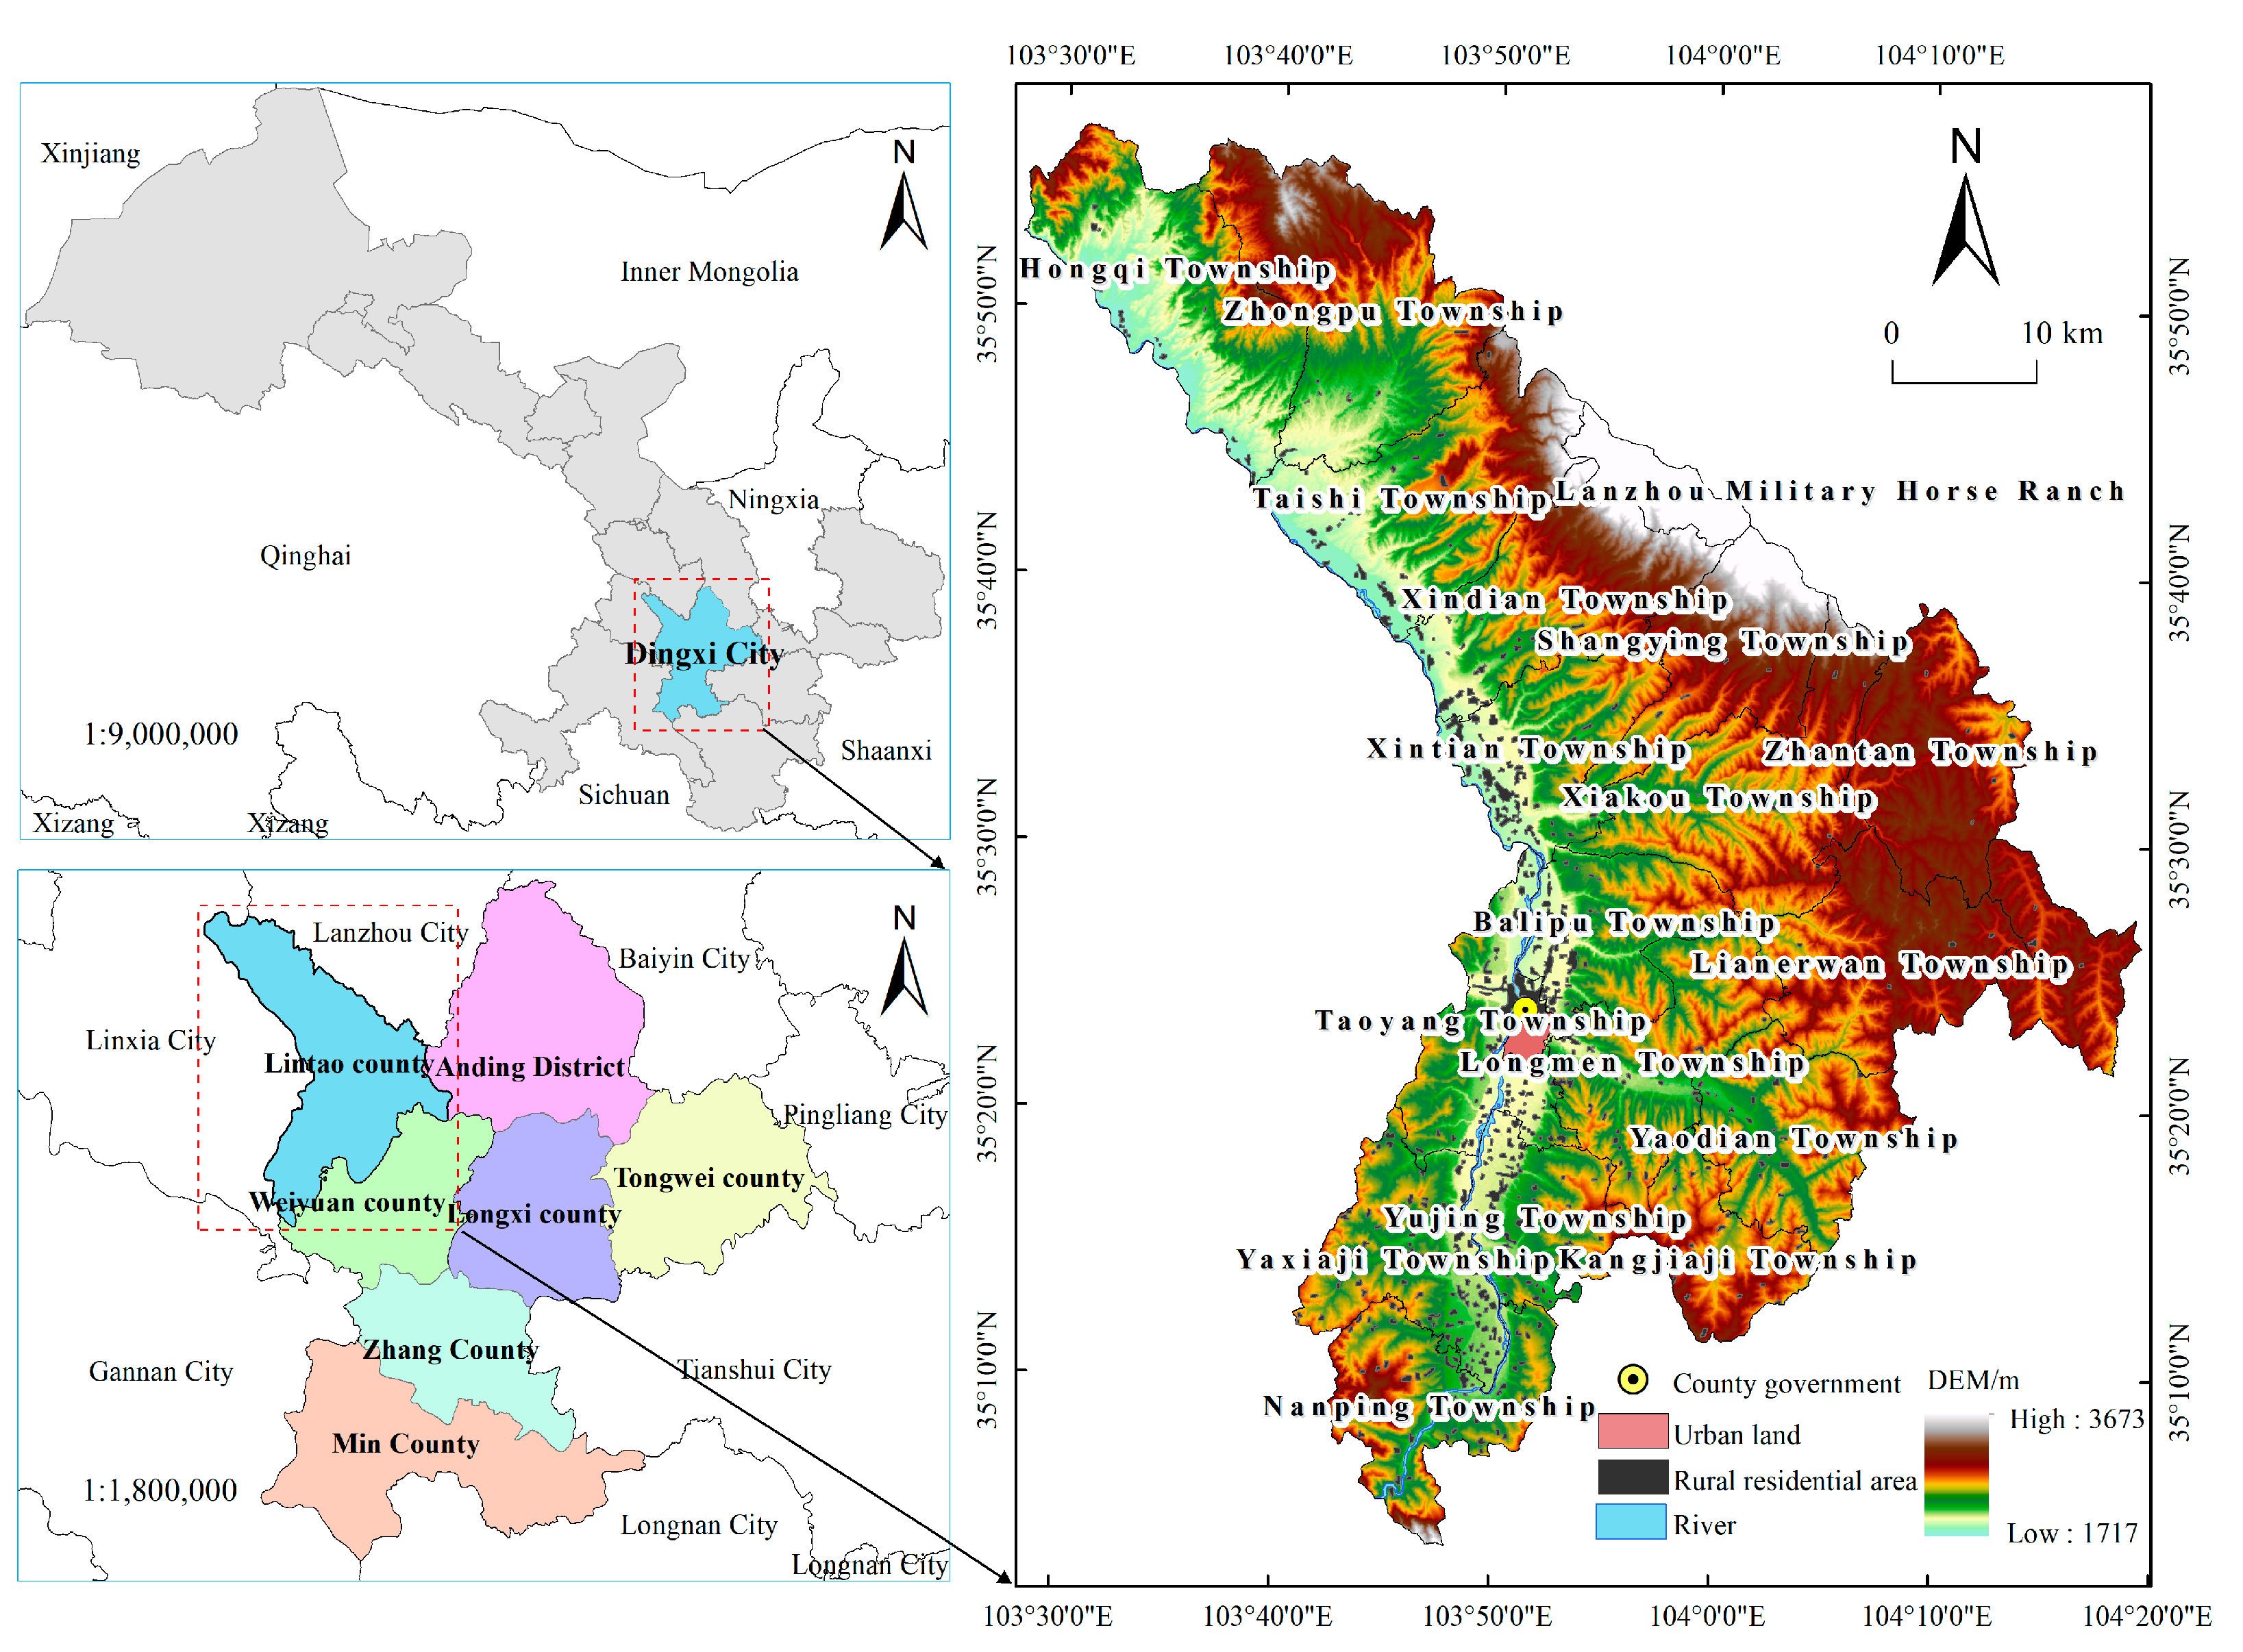
2.1. Overview of the Study Area

Lintao County (103°29′08′′–104°19′34′′ E, 35°03′4′′–35°56′46′′ N) belongs to Dingxi City, Gansu Province. It is positioned in the heart of Gansu Province, west of Dingxi City, south of Lanzhou City. The county is 80 km away from the capital city of Lanzhou (Figure 1). Lintao County, with a total of 2851 km2, belongs to the loess hills and gullies area of the fourth sub-district; the terrain is complex, formed of both high mountains, hills, gullies, river valleys, flat river longitudinal, and so on, many geomorphological forms of the north–south narrow basin, the terrain is tilted from the south–east to the north–west; the territory of the Tao River flows through. The annual transit water volume is 4.6 billion cubic meters, and the two sides of the Taohe River form a narrow river valley terrace plain.
At the end of 2021, with a Lintao County resident population of 478,300 people under the jurisdiction of 18 townships as well as the Lanzhou military horse ranch. Compared with 2020, the county’s gross regional product was 9.052 billion yuan, an increase of 8.1%. Three national highways, including 212 and 309, through the territory, Lan Lin and Lin Wei high-speed, built and opened to traffic, are concentrated in the river valley plain area on both sides of the Taohe River. Lintao County serves as the south gate of the provincial capital, Lanzhou, and is an important node city on the southward economic belt. With economic development, there have been substantial shifts in land use patterns.

2.2. Data Sources and Pre-Processing

Based on the actual situation in Lintao County, 10 land-use change influencing factors in the three aspects of nature, socio-economics, and policy were selected. The natural influencing factors are elevation and slope, and the slope is obtained by Arcgis based on elevation calculation; the socio-economic influencing factors include population density, total industrial output value, distance to the county town, distance to established towns, distance to rivers, and distance to highways; the population density and total industrial output value are imported into township vector data; and the various types of distances are obtained by Arcgis based on Euclidean Distance calculation; the policy influencing factors are permanent basic cropland and ecological conservation red line. All data were rasterized with a spatial resolution of 30 × 30 m.
Land use data included six primary classifications of cropland, forest land, grassland, water area, Urban, rural, and industrial land, and unused land, and 25 secondary classifications, according to which the land use classification in this study was adjusted. In ArcMap, slope data are used to overlay the analysis, and croplands with slopes above 25° are extracted, while the rest of the cropland is general cropland. The secondary classification of urban, rural, industrial, mining, and residential land includes urban land, rural settlement areas, and other construction land. Finally, reclassification was carried out in ArcMap, and the land in the study area was classified into 9 categories general cropland (GC), cropland with slopes of more than 25° (hereafter referred to as sloping cropland) (SC), forest land (FL), grassland (GL), water area (WA), urban land (UL), rural settlement area (RS), other construction land (OC), and unused land (UN). The data sources are shown in Table 1.

3. Research Methodology

This study utilizes the land-use dynamics degree to analyze the land use changes in Lintao County from 2000 to 2020. It selects influential factors and employs 2015 land use data to simulate land use in 2020, which is validated against actual land use. Following validation, four scenarios are established: cropland protection, ecological protection, economic development, and comprehensive development. Using the FLUS model and InVEST model, the study then analyzes the future land use patterns and carbon stock changes in the study area under these scenarios for 2035. The comprehensive development scenario (CDS) obtained in the end is in line with the coordination of multiple objectives (Figure 2).

3.1. Land Use Dynamic Degree

The land use dynamic degree refers to the number of land-use types in a certain period of time, mainly reflecting the intensity of land-use change and the rate of change in regional differences. In this paper, land use dynamic degree is chosen to measure the intensity of change and rate of change in each land use type in Lintao County, and Equation (1) is as follows:
K = U b U a U a × 1 T × 100 %
In Equation (1), K represents the dynamic degree of land use, where Ua and Ub denote the areas of a certain land use type at the beginning and end of the study period, respectively, and T represents the duration of the study period [45].

3.2. FLUS Model

In the FLUS model, the initial step involves employing the artificial neural network (ANN) algorithm to amalgamate input land use data and influencing factors. This process computes the suitability probability of each land use type within each pixel. Subsequently, this suitability probability is amalgamated with the adaptive inertia coefficient, neighborhood weighting factors, and conversion costs to determine the overall conversion probability. Finally, the simulation results are derived using the roulette selection method.

3.2.1. ANN-Based Suitability Probability Estimation

Using Phase I land use data and the influence of various factors (topographic, economic, social, policy, etc.), such as natural conditions and anthropogenic activities, the suitability probability of each land use type within the study area was obtained by arithmetic.

3.2.2. Self-Adaptive Inertia and Competition Mechanism CA

The FLUS model significantly improves traditional CA and introduces self-adaptive inertia and competition mechanisms. Grounded on roulette selection, this mechanism adeptly navigates the uncertainties and intricacies associated with the transformation of each land use type amidst the concurrent influences of various factors during land change simulation. It aims to uphold the FLUS model’s simulation accuracy, ensuring a high level of credibility and yielding simulation outcomes that closely align with real-world scenarios. The mathematical Equation (2) for the inertia coefficient is as follows:
I n e r t i a k t = I n e r t i a k t 1 D k t 1 D k t 2 I n e r t i a k t 1 × D k t 2 D k t 1 D k t 1 < D k t 2 < 0 I n e r t i a k t 1 × D k t 1 D k t 2 0 < D k t 2 < D k t 1
In Equation (2): I n e r t i a k t represents the inertia coefficient of land use k in the t iteration; D k t 1 represents the difference between the true demand and the allocation for land use k at iteration (t − 1) [46].
With the aforementioned calculations, the combination probability of all land uses in each image element can be estimated using Equation (3):
T P p , k t = P p , k t × Ω p , k t × 1 s c c k × I n e r t i a k t
In Equation (3): T P p , k t represents the combination probability of converting the original land use on pixel p to the target land class k at the t iteration; P p , k t represents the suitability probability of land use k on pixel p, which is computed by ANN; Ω p , k t represents the domain role of land use k on pixel p at the t iteration, and s c c k represents the conversion cost of converting the original land use c to the target land class k [47].
In this study, due to the large amount of data processing, adjustments were made based on the default values of the model. We chose a uniform sampling mode to obtain the training samples. The sampling parameter was 15, and the hidden layers were 12. CA iterations were 200, 3 × 3 molar domains were used, and the acceleration factor was 0.5.

3.2.3. Precision Validation

Kappa coefficient is the traditional method of pixel-level accuracy validation. A confusion matrix was constructed to calculate the Kappa coefficient and the overall accuracy to validate the scenario simulation results, which was calculated using Equation (4):
K a p p a = p 0 p e 1 p e
In Equation (4): P0 is the overall classification accuracy, denotes the probability that for each random sample, the classification result is consistent with the type of ground survey data, Pe represents the probability that the classification result agrees with the ground survey data type by chance [48]. Kappa is usually between 0 and 1, with values closer to 1 indicating higher accuracy of the simulation results. Kappa coefficient of 0.92 is obtained through calculation, and the overall accuracy was 0.96, demonstrating the model’s excellent applicability to this study.

3.3. The InVEST Model

In this study, carbon stocks were assessed using the Carbon Storage and Sequestration module of the InVEST model 3.13.0, which consists of aboveground biogenic, belowground biogenic, soil organic, and dead organic carbon pools. Total carbon stock was calculated using Equation (5):
C i = C i a b o v e + C i b e l o w + C i s o i l + C i d e a d C t o t a l = i = 1 n C i × S i
In Equation (5): Ci is the total carbon density of land type i (t/hm2), C i a b o v e is the aboveground biogenic carbon density of land type i (t/hm2), C i b e l o w is the belowground biogenic carbon density of land type i (t/hm2), C i s o i l is the soil carbon density of land type i (t/hm2), and C i d e a d is the dead organic carbon density of land type i (t/hm2); C t o t a l is the total carbon stock (t), Si is the total area of site type i (hm2), and n is the number of site types [44].
The carbon density of non-built-up land (Table 2) was mainly obtained from the research result of Xu Li. [49] at the Institute of Geography, Chinese Academy of Sciences. Data within or close to the study area were selected as much as possible according to latitude and longitude; 28 sample points were selected and averaged, and previous studies were referred to for some missing data and the density of dead organic carbon [50,51].
The calculation of carbon density of construction land mainly refers to Wang Huimin [52], Zeng Yongnian [53], and Zhao Rongqin [54]; the carbon pool of construction land, including the building carbon pool, furniture and book carbon pool, and human and animal carbon pool. The building carbon pool was calculated by multiplying the population in Lintao by the urban and rural per capita housing area in Lintao multiplied by the wood consumption per unit of building area in Gansu, the urban and rural population and urban and rural per capita housing area in Lintao County were obtained from the Dingxi Yearbook 2021, and the wood consumption per unit of building area was obtained by calculating the amount of wood consumed by building area and construction in the Gansu Development Yearbook 2021; the national average per capita furniture and book The national per capita carbon content of furniture and books [50] (34.54 kg/person and 46.31 kg/person) was multiplied by the urban and rural population of Lintao County to obtain the urban and rural furniture and book carbon pools; the average weight of human body (60 kg) and the average weight of animals [50] was multiplied by the total number of people and animals in Lintao to obtain the total human and animal carbon pools, and the number of animals was obtained from the “Statistical Bulletin of the National Economy and Social Development of Lintao County in 2020”. RESDC defines other construction land as land for factories, mines, large industrial zones, oilfields, salt fields, quarries, and other land, as well as traffic roads, airports, and special land, combined with land use data of Lintao County, and the area of construction of Lintao County’s industrial, logistics and warehousing, public utilities, and road traffic facilities was selected from “Dingxi Almanac 2021”, and was multiplied by the Gansu unit construction area wood consumption to obtain the carbon pool of other construction land buildings. Finally, the total carbon pool of each construction land type was divided by the area of the corresponding application land to obtain the carbon density of each land type (Table 3).

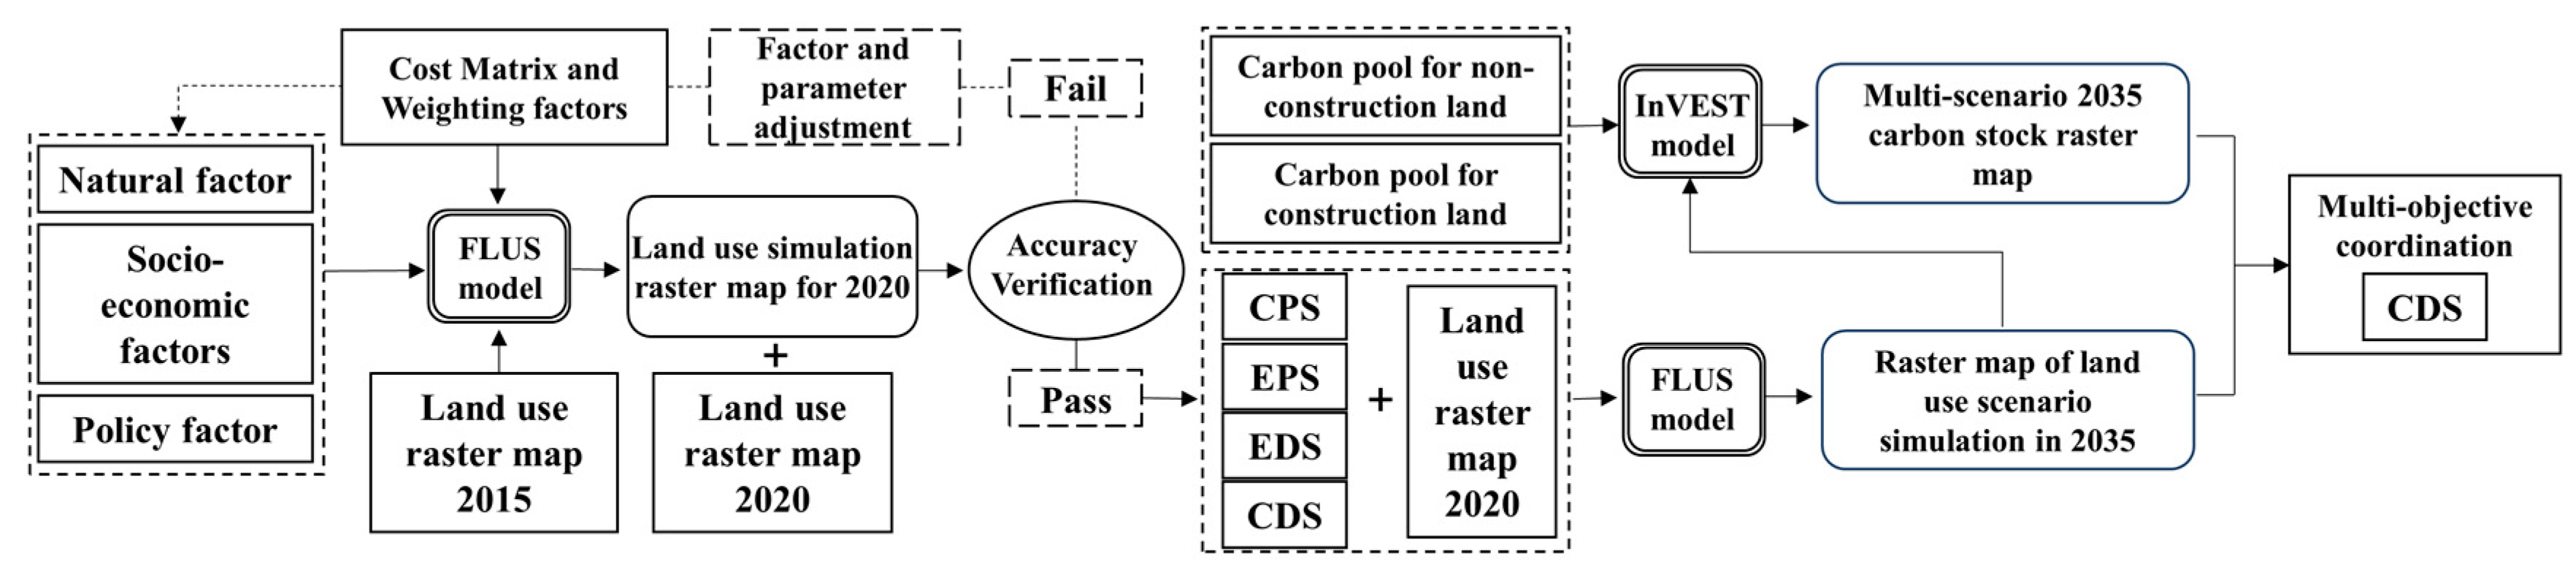
3.4. Scenarios and Parameter Settings

3.4.1. Modeling Scenario Settings

Based on the relevant program for returning sloping cropland to forest and grassland, sloping cropland was converted to forestland and grassland except in the EDS, and the remaining land types were not converted to sloping cropland. To further improve the simulation accuracy, the Tao Yang River was considered as the restricted conversion area in all four scenarios. The scenarios were set as follows:
  • Cropland protection scenario (CPS). China, as a populous country, attaches great importance to the protection of food and cropland, has formulated strict cropland protection measures and put forward the slogan of “Strictly abide by the red line of 1.8 billion mu of cropland”. Under this scenario, permanent prime cropland in Lintao County is used as a restricted conversion area, strictly limiting the conversion of cropland within the study area, allowing only general cropland to be converted to urban land and other construction land, and permitting sloping cropland to be “returned to forests and grasses”.
  • Ecological protection scenario (EPS). “Green mountains are golden mountains”. China attaches great importance to the construction of ecological civilization and strengthening the protection of the ecological environment. In recent years, Lintao County vigorously implemented the “ecological county” strategy and successively implemented a number of key ecological protection projects. In the EPS, the ecological protection red line in Lintao County was added as a restricted conversion zone, strictly controlling the conversion of ecological land (forest land, grassland, water area) outside the red line into other land types; it allows other land types to be converted to ecological land.
  • Economic development scenario (EDS). Lintao County is included in the Lanzhou-Xining City Cluster Development Plan, and its economic development is bound to enter a fast lane. Regional economic development is inevitably accompanied by urbanization, which leads to the outward expansion of construction land. In this scenario, the expansion of urban land, rural settlement area, and other construction land will be prioritized, regardless of the constraints of land use planning and government policies in Lintao County. At the same time, regional economic development cannot be achieved without the support of primary industries, thus raising the priority of croplands.
  • Comprehensive development scenario (CDS). The above three scenarios are ideal and only consider a single demand. Therefore, a comprehensive development scenario is set to consider the demands of the above three scenarios and simulate a more realistic development situation. In this scenario, prime cropland is protected, the ecological red line is strictly abided by permanent prime cropland, and the ecological protection red line is used as the restricted conversion area. The priority of ecological protection is set higher than that of cropland protection according to the research of Guo [55]. Considering the needs of regional development, the conversion of cropland, forest land, grassland, and water area to construction land is controlled according to the actual situation.

3.4.2. Neighborhood Weighting Factors

The neighborhood weighting factors range from 0 to 1, with values approaching 1 indicating a stronger expansion capability for a certain land use type. This parameter was set with reference to the relevant literature [25,56], as shown in Table 4.

3.4.3. Cost Matrix

The cost matrix is used to set the conversion relationship of each land-use type in the simulation conversion; when land-use types are prohibited from conversion, they are assigned a value of 0, while a value of 1 is assigned when conversion is permitted. According to the actual situation in the study area and the simulation scenario set above, the parameters of the cost matrix were set as listed in Table 5.

4. Results and Analyses

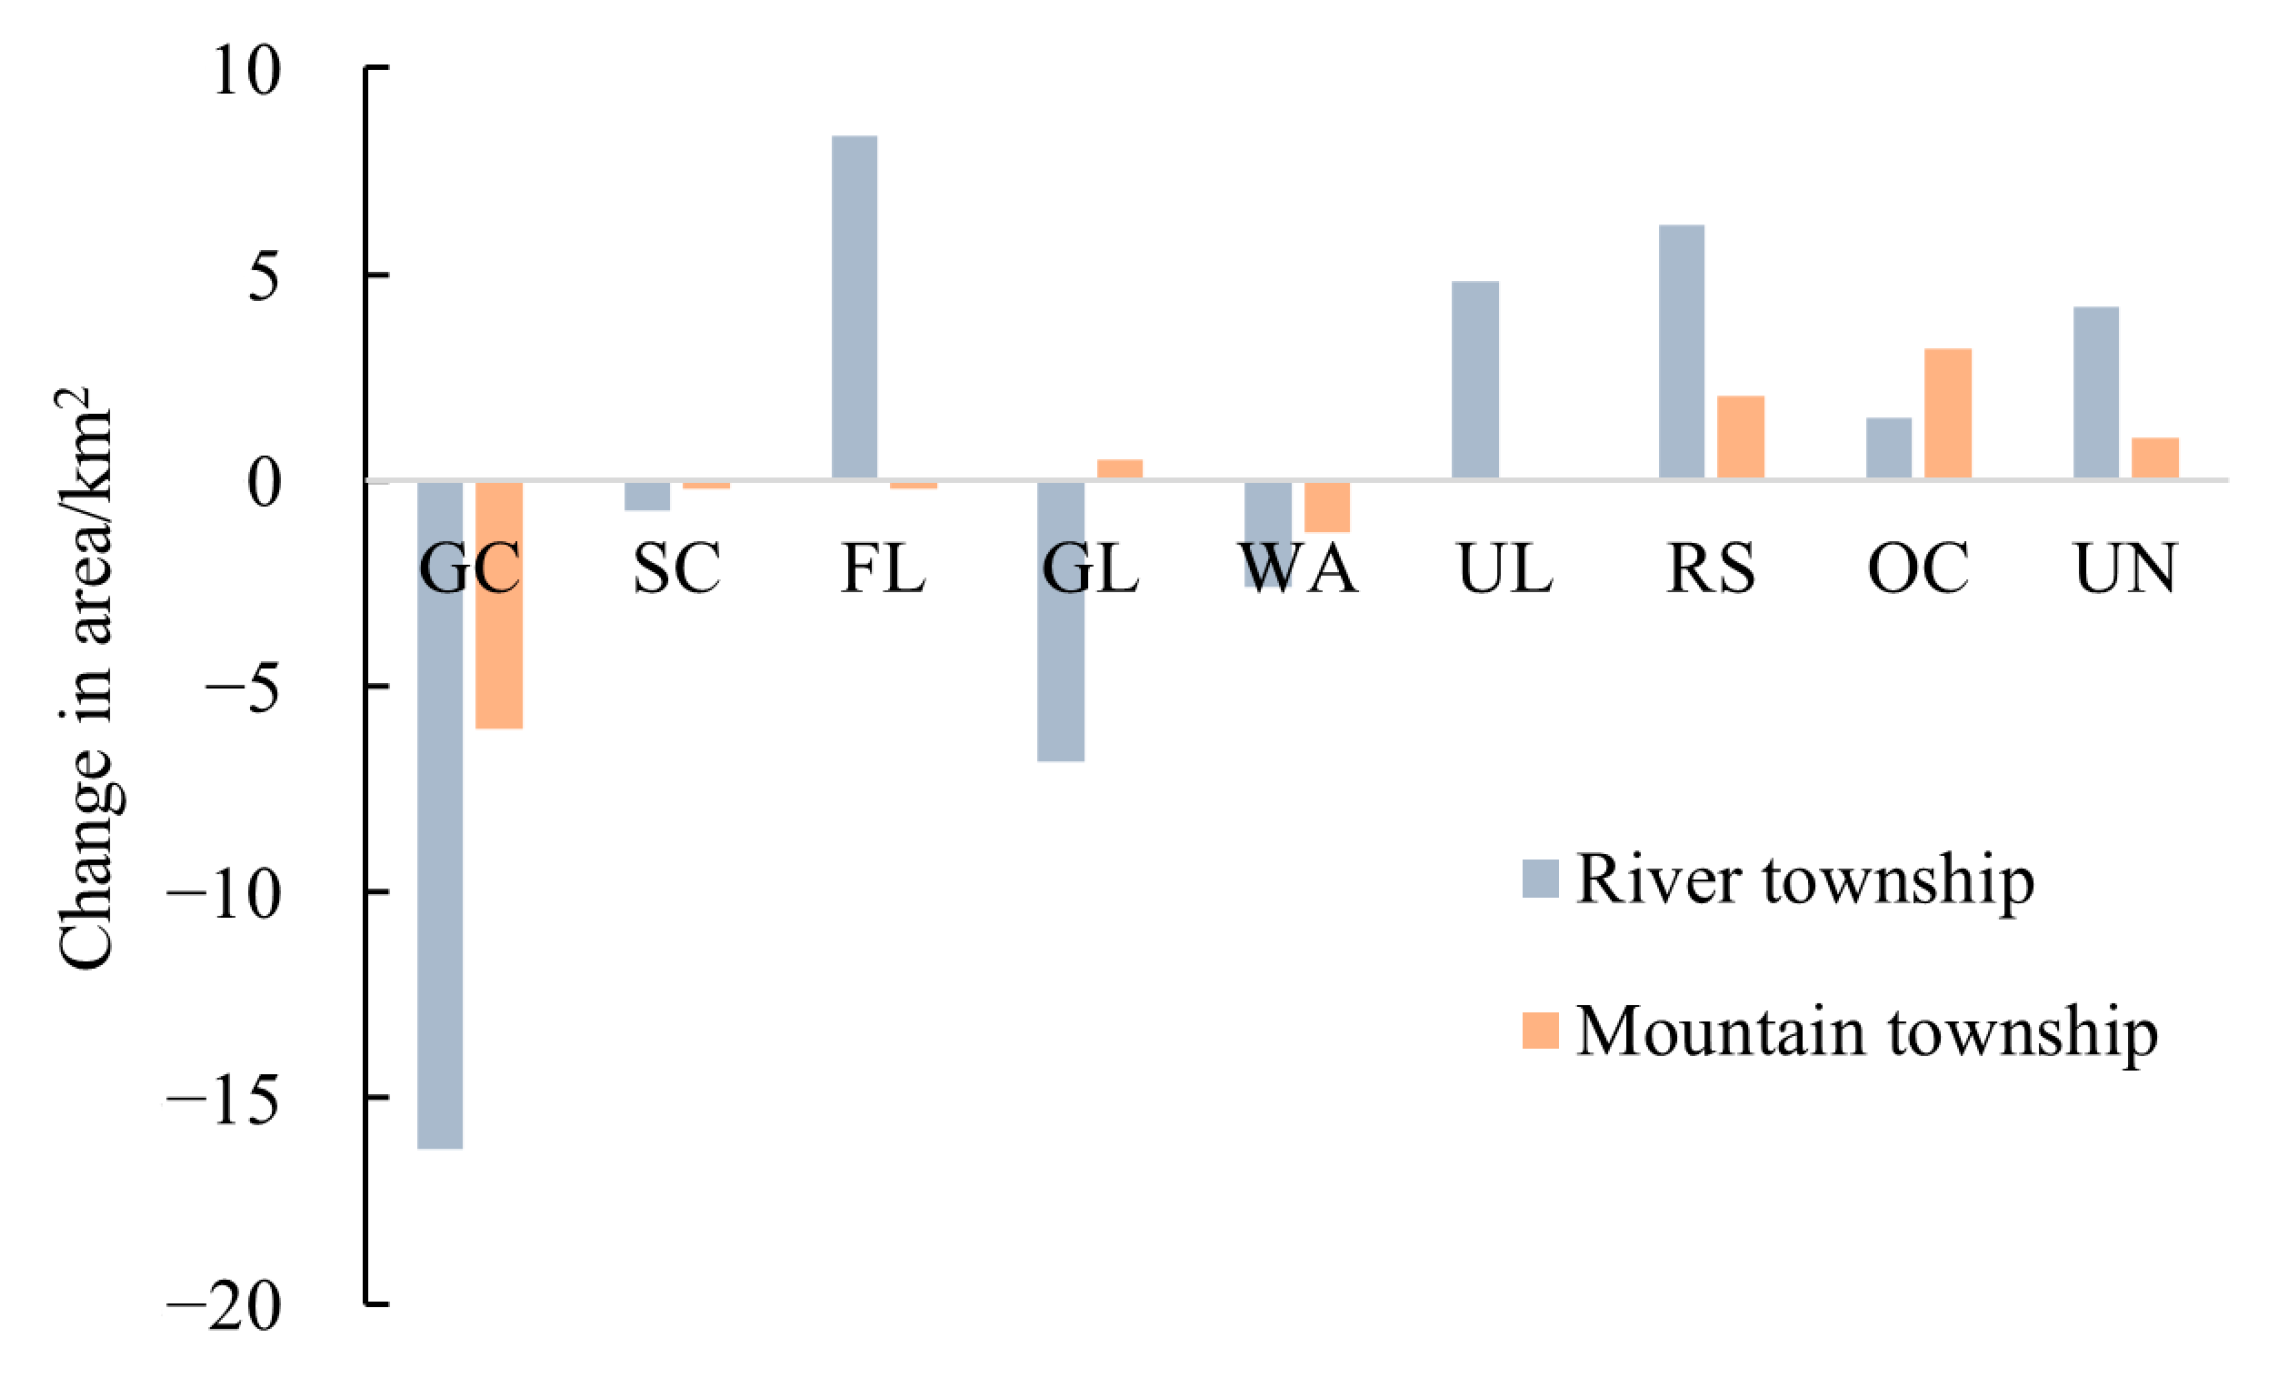
4.1. Analysis of Land Use Change 2000–2020

The primary trend in the study area involves a decrease in general cropland coupled with an increase in construction and forest land (Table 6). In the study area, a general decline was observed in cropland, sloping cropland, grassland, and water areas, totaling a decrease of 31.38 km2. Notably, the decrease was primarily in general cropland, with an area reduction of 21.99 km2. Forest land, urban land, rural settlement area land, other construction land, and unused land showed an overall increasing trend, with construction land and forest land increasing the most, with increases of 17.81 km2 and 8.34 km2, respectively. With economic development, construction land as a strong land maintained a positive expansion trend (Table 6). increased by 8.34 km2. With economic development, construction land, as a strong land, maintains a trend of outward expansion. After the Lintao County Land Use Master Plan (2010–2020), Lintao County determined the development direction of the county town and the construction of Zhongpu Industrial Park, and the area of urban land and other construction land also maintained rapid growth after 2010. At the same time, the expansion of construction land is accompanied by a reduction in cropland, and the ecological protection policy of Lintao County and the strategy of “ecological county” also provide forest land with effective protection.
Over the past 20 years, there have been no significant changes in the land-use structure of the study area, which remains dominated by grassland, general cropland, and forest land, with the area share of the three types of land decreasing from 94.4% to 93.75% (Table 6). The proportion of urban land, rural settlement areas, other construction land, and other construction land increased from 2.35% to 2.98% over the past 20 years, with rural settlement areas accounting for the largest proportion. In 2020, the proportions of sloping croplands, water, and unused land were 1.98%, 0.94%, and 0.35%, respectively. General cropland, grassland, and forest land are the primary land-use types in Lintao County, and this land-use structure makes agricultural production and ecological land protection important for planning in Lintao County.
On the premise of keeping the township boundaries intact, based on the Tao Yang River flowing through as the dividing condition, the townships on both sides of the Tao River are divided into river townships, while the rest of the townships and the Lanzhou Military Horse Ranch are classified as mountain townships. The area of each site and its increase or decrease in 2020 were obtained using an area tabulation tool.
The difference in land-use change between river and mountain townships from 2000 to 2020 was obvious (Figure 3 and Figure 4). The total area of change in river townships is 51.46 km2, and the area of change in mountain townships is 11.32 km2. The overall change in land use in river townships is more drastic, and the intensity of change in the rest of the land use types is greater in river townships than in mountain townships, except for other construction land.
In Figure 3, we observe that land use changes are notably concentrated near the Tao River. The riverbank economic belt of Lintao County runs along the Tao River, passing through river townships where the population is concentrated, the economy is developed, and human activities are more intense and frequent, resulting in significant changes in land use intensity. Mountain townships are mostly located in eastern hilly and mountainous areas, are relatively backward in development, and the intensity of land-use change is weaker.
In river townships, forest land, urban land, rural settlement areas, other construction land, and unused land exhibited an upward trend, whereas the remaining land types experienced a decline, with general cropland and grassland predominantly decreasing. In mountainous townships, grassland, rural settlement areas, other construction land, and unused land exhibited an upward trend, whereas the remaining land types experienced a decline, with general cropland decreasing predominantly. The establishment of the construction of Zhongpu Industrial Park is the main factor driving the expansion of other construction land (Figure 4).
As presented in Table 7, there were notable disparities in the dynamics of different land use types within the study area, marked by significant transitions between them. The dynamic attitudes toward the three types of land use, namely urban land, other construction land, and unused land, were all positive and at a high level, showing a trend of rapid expansion. Lintao urban land mainly expands rapidly to the north and south, and as a strong land use in the construction land, it mainly encroaches on general cropland and a small amount of the surrounding rural settlement area. The expansion of other construction land, such as stronger land, encroaches on general croplands, rural settlement areas, and grasslands. Changes in the area of unused land fluctuated greatly, growing rapidly in 2010 and 2020, mostly in Taoyang Town, Taishi Town, and Zhongpu Town. The construction of a large number of projects leaves a large amount of land unused. This conversion is temporary, and it will still be exploited and converted into other land. The rest of the land-use dynamic attitude was less than 1%, and land-use change was not significant. General cropland, sloping cropland, and grassland had a low level of motivation, and all were negative, showing a slow decreasing trend. However, general cropland and grassland were the main land types transferred out of the study area because of their large base areas. General croplands were mainly transferred to urban land, rural settlement areas, other construction land, grassland, and forest land, whereas grassland was mainly transferred to forest land and general croplands. Sloping croplands have mainly shifted to grassland, indicating that the policy of converting cropland back to forests and grasslands has yielded some outcomes. At the same time, it should also be noted that rural settlement areas are mainly transferred to general cropland, with a total area of 10.14 km2. After the promulgation of the policies of new rural construction and house site improvement, measures such as focusing on the construction of new rural residential land, resuming unused house sites, improving the over-standard house sites, and reclaiming cropland are the important reasons for the mutual transformation of general cropland, grassland, and rural settlement area.
In summary, the land-use transition in Lintao County has mainly manifested in terms of quantity as a decrease in general cropland and an increase in construction land and forest land, such as urban land, rural settlement areas, and other construction land. The land-use structure of the study area is dominated by general cropland, grassland, and forestland; however, the proportion of construction land is increasing. Spatially, land use transformation mainly occurred in the western river townships, except for other construction land types, and the remaining land use types in the river townships changed more than those in the mountain townships. From the land-use transfer matrix, it was found that general cropland was mainly transformed into construction land and that there was also reciprocal conversion among general cropland, forest land, and grassland.

4.2. Analyses of Land-Use Scenario Modeling

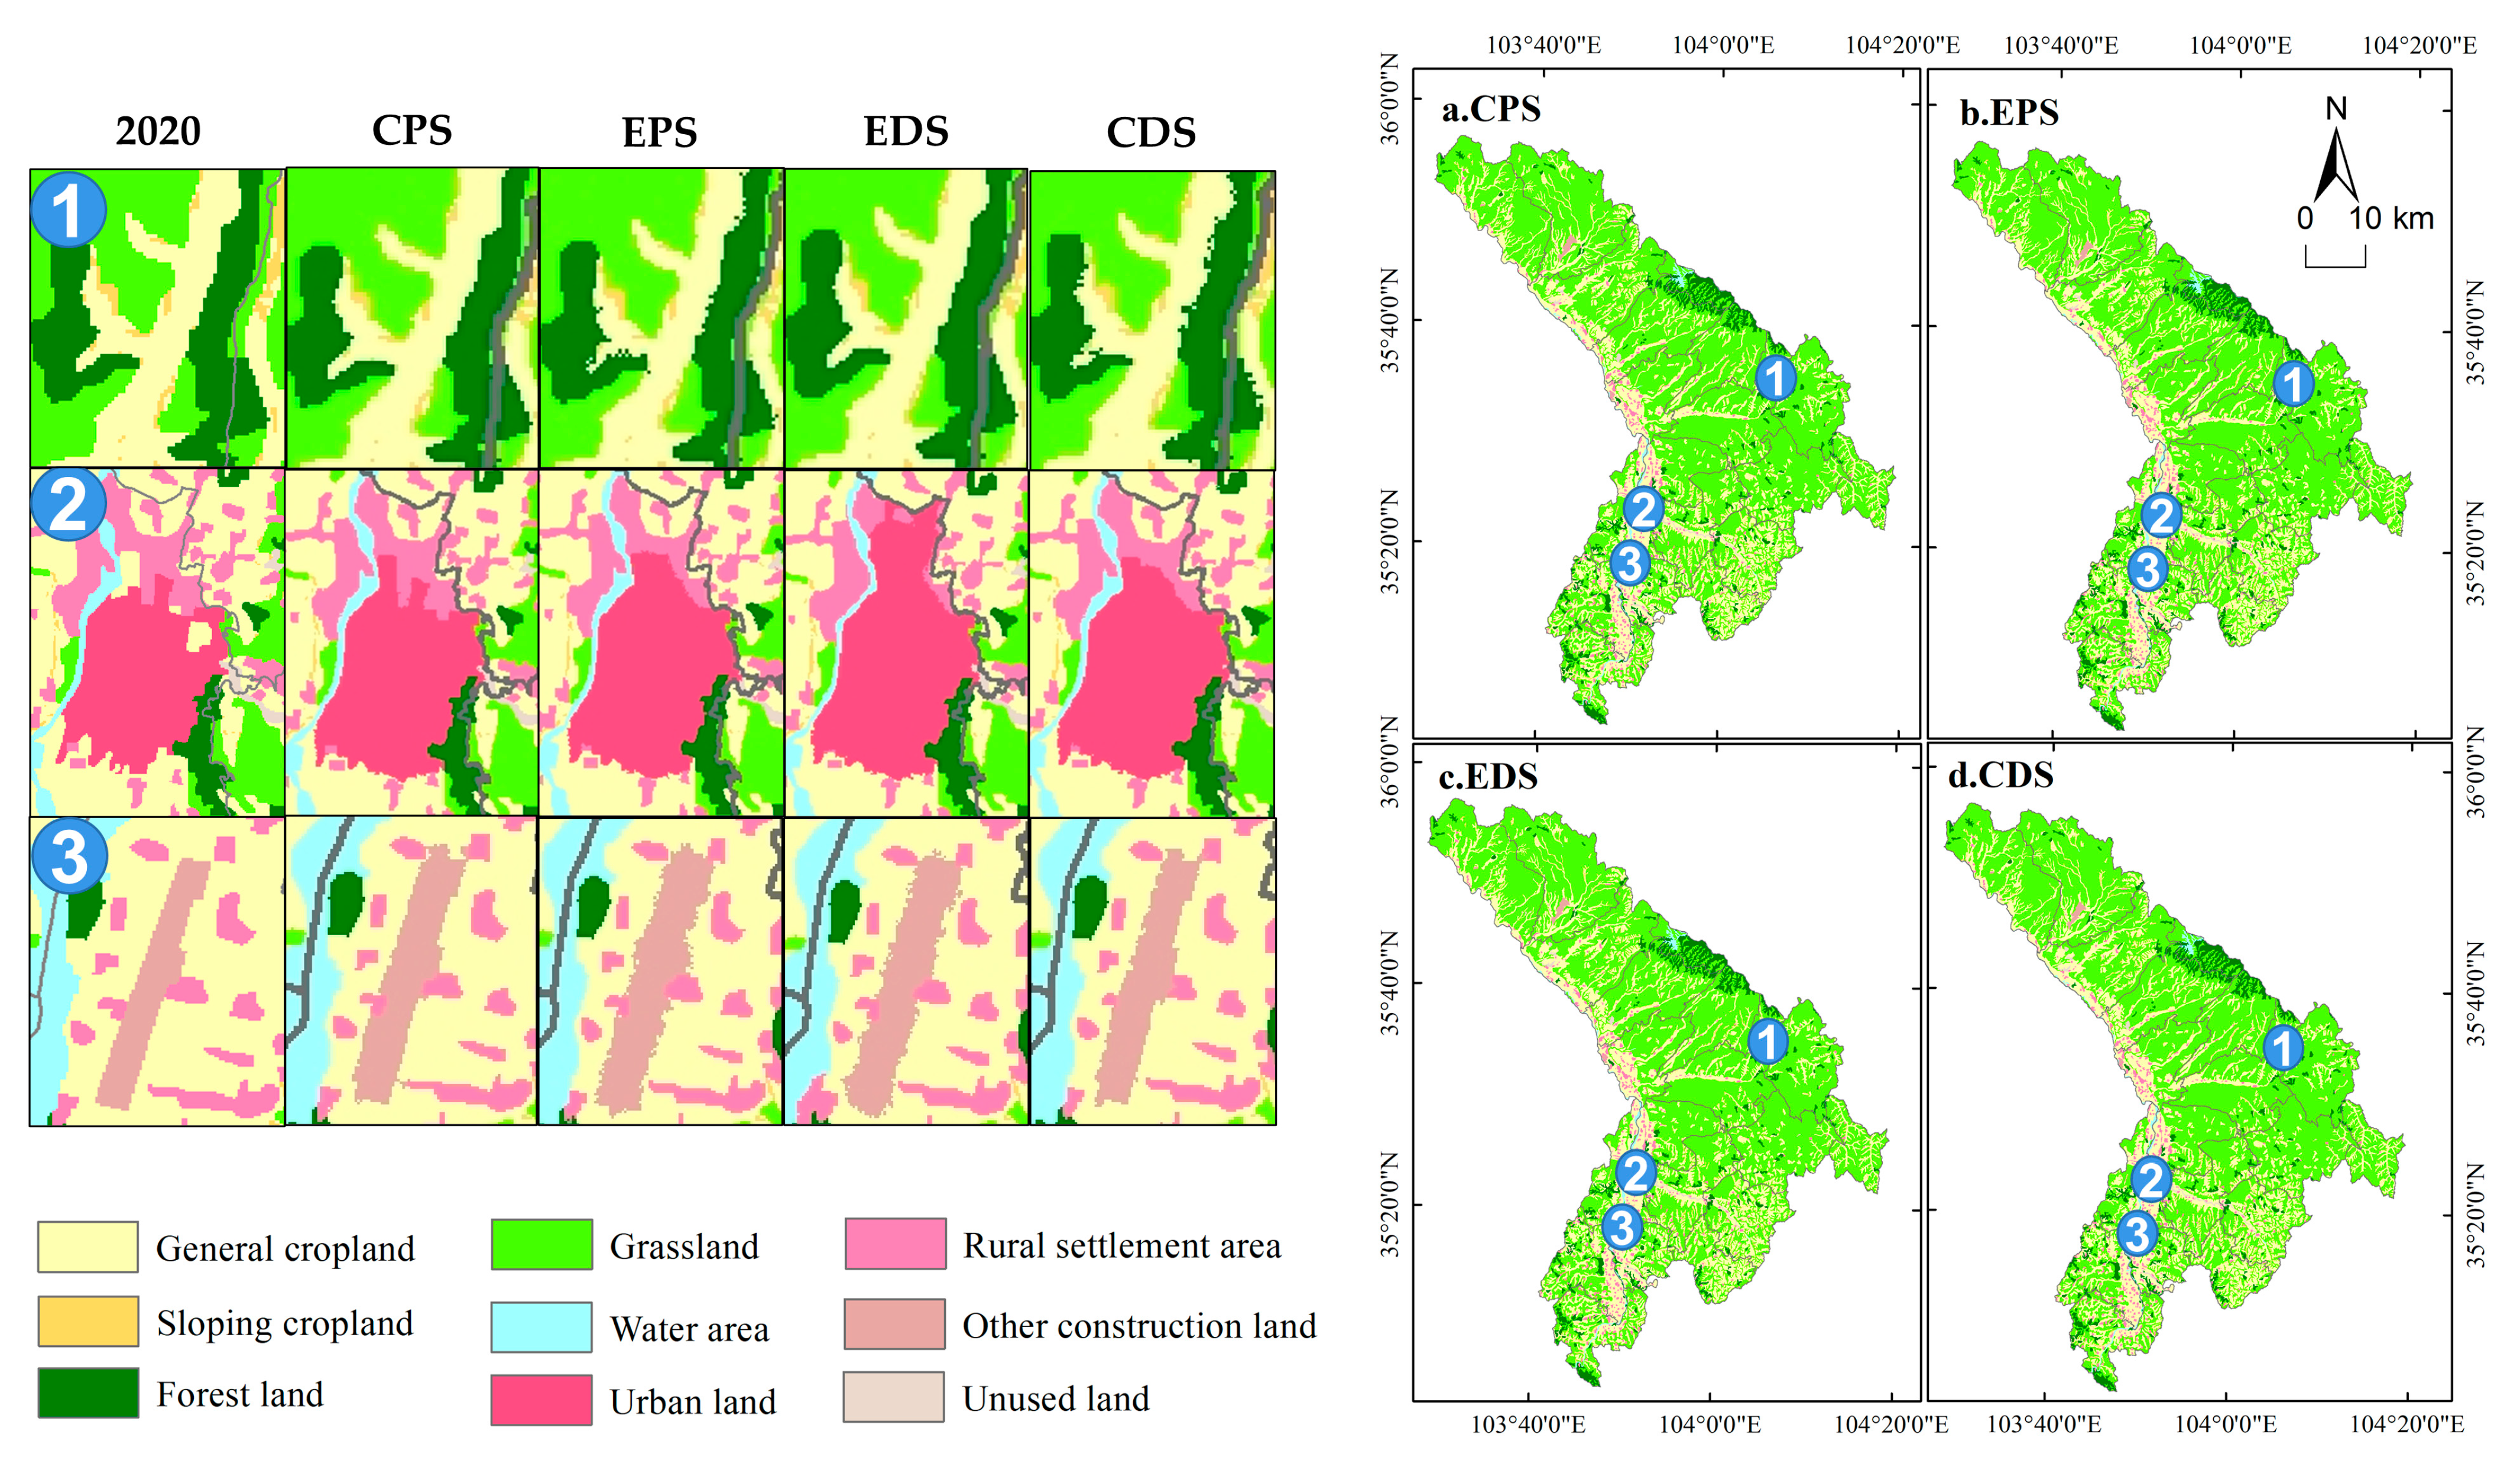
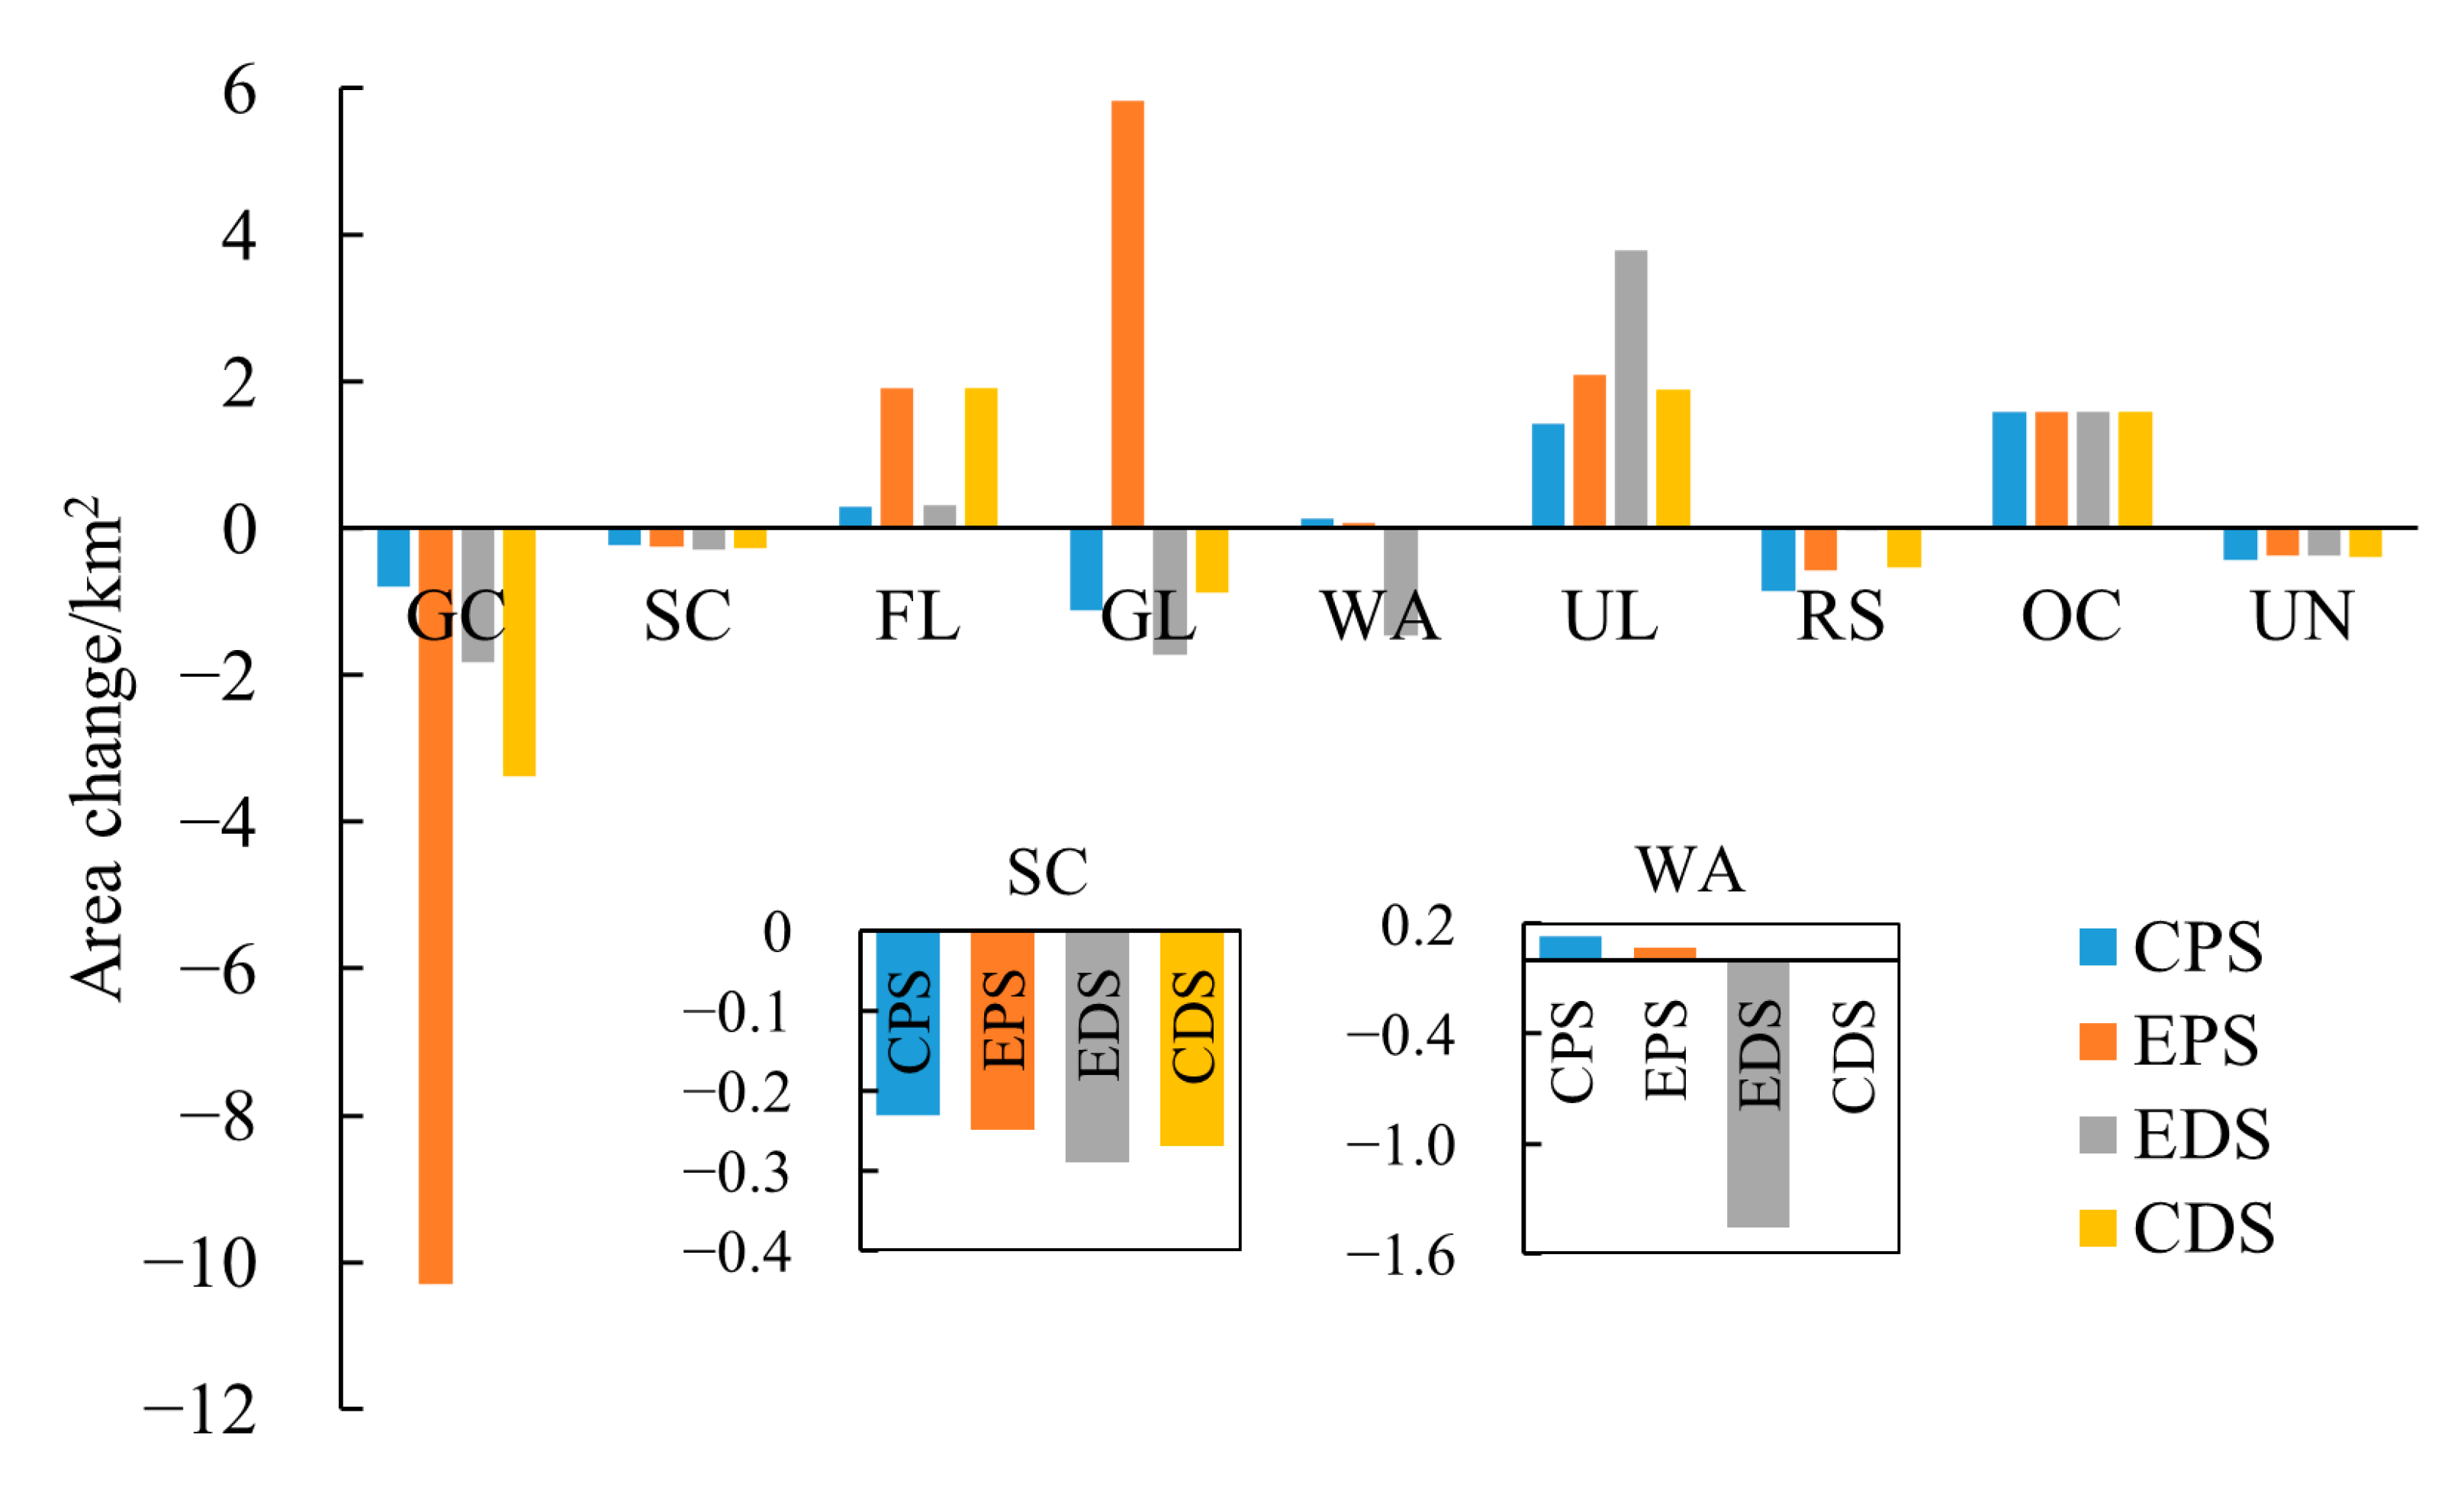
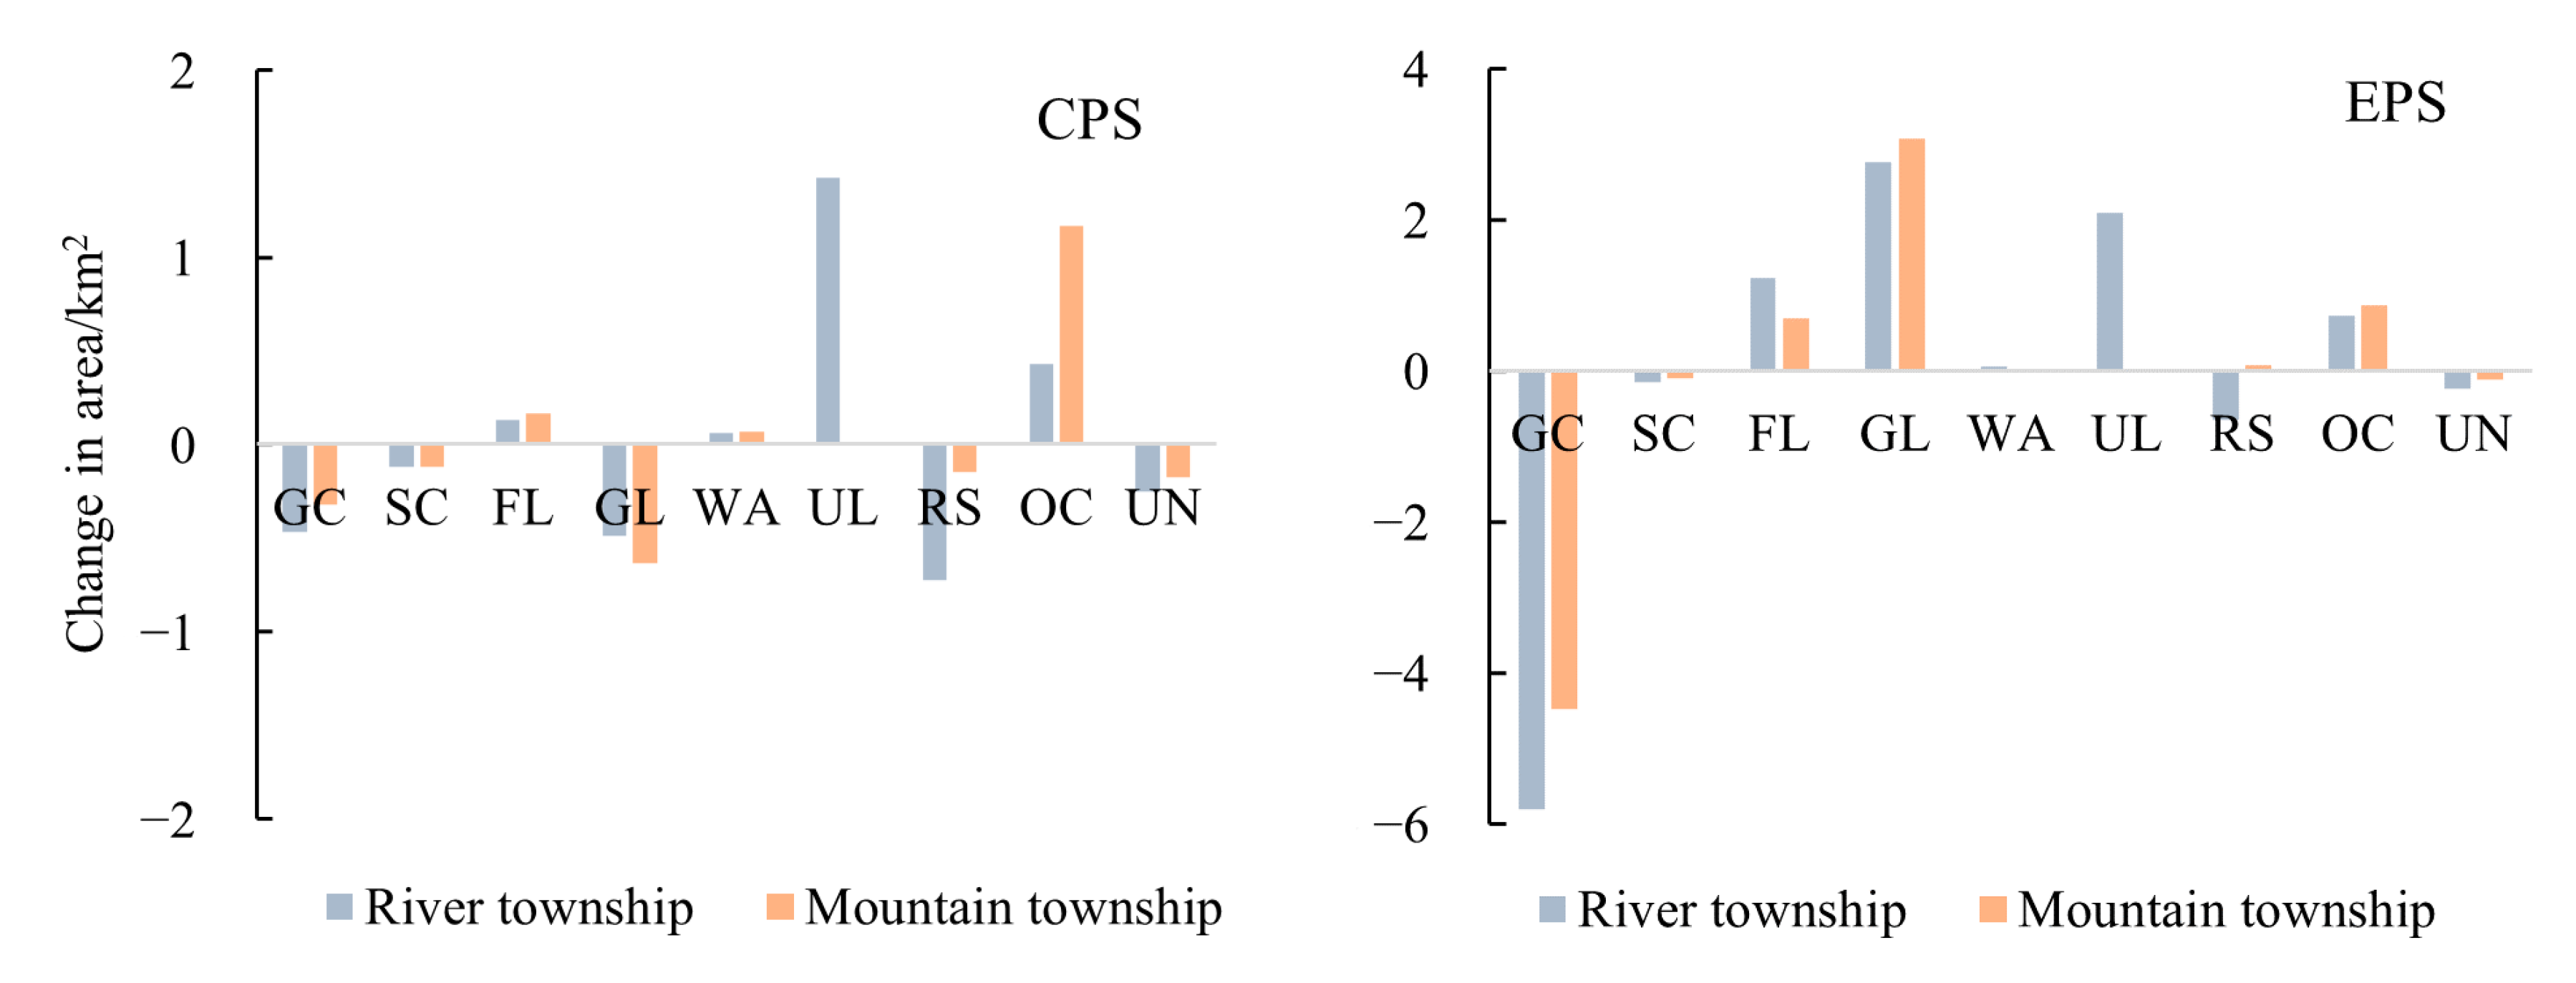
4.2.1. Multi-Scenario Modeling Results

  • Multi-scenario land use time change
Based on the results of the multi-scenario simulation (Figure 5), the modeled area for each scenario in 2035 was calculated and compared with that in 2020 to calculate the rate of change in the land-use area for each scenario (Table 8). Figure 6 depicts the changes in land use under different scenarios. Combining Figure 5 and Figure 6, the trend and subtle differences in land use change under different scenarios can be visually observed.
Under the CPS, general cropland decreased by only 0.11%, which was the lowest compared with other scenarios, and the conversion of general cropland was under control. The reduction in the conversion of general cropland can effectively inhibit the expansion of urban land, and urban land only increases by 15.57% year-on-year, a slower growth rate. Grassland, rural settlement areas, and unused land all showed a decreasing trend, and the increase in the area of forest land was the smallest in all scenarios. This shows that under the CPS, cropland will be effectively protected, but it will inhibit the development of regional urbanization and is unfavorable for preserving the ecological environment.
Under the EPS, the conversion of ecological land, such as forest land, grassland, and water areas, is strictly controlled, and all show an increasing trend. The conversion of general cropland, rural settlement area, and unused land shows a decreasing trend, among which the area of general cropland decreases the most in all scenarios, with a year-on-year decrease of 1.45%, while urban land shows a faster expansion rate. It can be seen that the ecological environment has been effectively protected after the restrictions on the conversion of general cropland have been lifted, and urban land has also expanded at a faster rate. However, general croplands have been converted out in large quantities for the expansion of other land uses, making it difficult to guarantee the safety of cropland.
Under the EDS, urban land use increases sharply by 41.5% year-on-year, with urban land use growing faster than in the other scenarios. Rural settlement area use decreases slightly, and other construction land use tends to increase. Cropland, grassland, and water areas all exhibited a downward trend, with grassland and water areas decreasing the most compared with other scenarios and forestland areas increasing only slightly, indicating that the regional economic development in this scenario leads to a certain degree of ecological damage.
Under the CDS, forest land, urban land, and other construction land exhibited an upward trend compared with 2020, whereas the water area remained unchanged, and the rest of the land use exhibited a downward trend. Compared with the other scenarios, land-use changes were more moderate, considering the changing needs of various types of land use. The rapid growth of forest land, the relatively slow reduction in general cropland, grassland, and land for rural settlement areas, and the relatively slow expansion of urban land indicate that cropland and ecological land have been protected to some extent and that the rapid and disorderly expansion of construction land has also been limited. Regional development policies have never been implemented individually, and this scenario is closer to the reality of Lintao County’s simultaneous promotion of new urbanization, cropland protection, and ecological protection, which is conducive to the county’s goal of achieving sustainable development that combines new urbanization, food security, and ecological civilization construction.
Generally, in each scenario, the land use structure remains dominated by general cropland, grassland, and forest land, and the development demands and constraints of different scenarios significantly affect changes in land use. In the CPS, general cropland is effectively protected, but the restriction on cropland conversion restricts the rapid expansion of urban land use, and it is difficult to protect ecological land use. In the EPS, ecological land use with high ecological value is effectively protected, cropland is greatly reduced, and urban land use is expanding at a faster rate. In the EDS, the unrestricted and rapid expansion of construction land leaves both cropland and ecological land unprotected, while in the CDS, which considers the needs for cropland protection, ecological protection, and urbanization, forest land grows, the reduction in general cropland and grassland is protected, and urban land expands at a reasonable rate.
2.
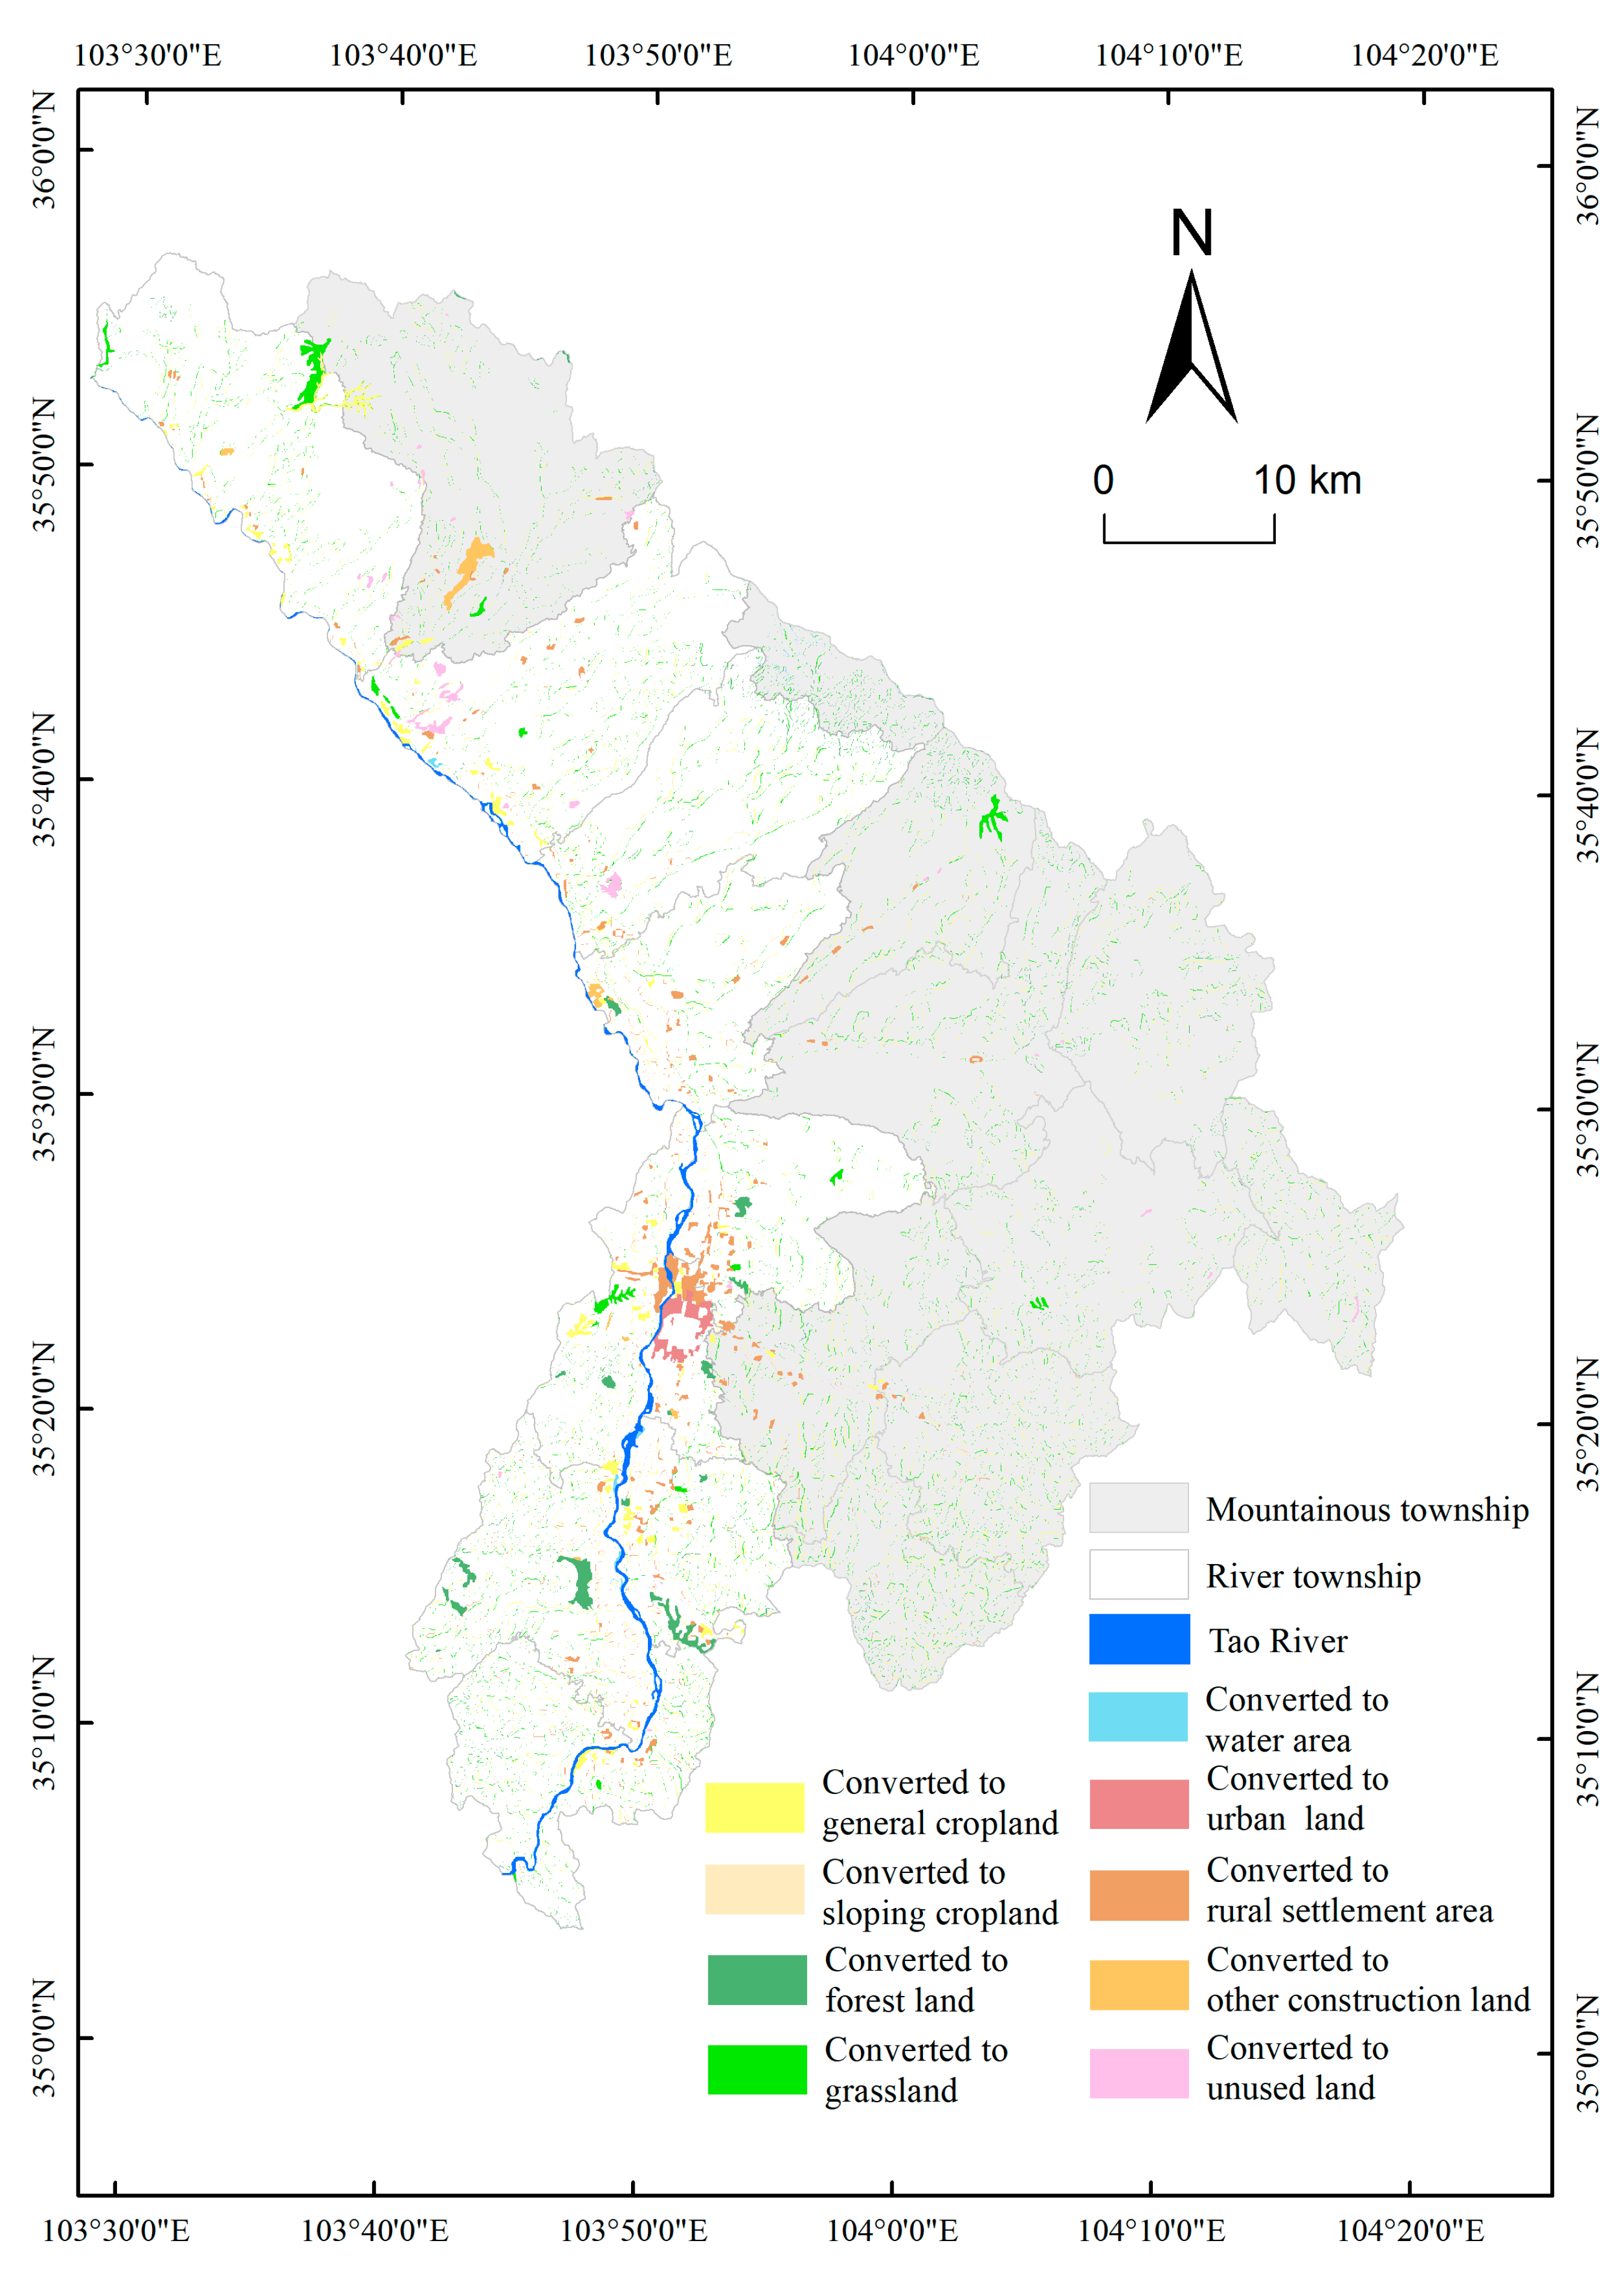
Multi-scenario land use spatial change
Using the area tabulation tool, the area of each land use type in the river and mountain townships and their increase or decrease in 2035 in the four scenarios were obtained to explore the spatial change characteristics and influence mechanisms of land.
From Figure 7, there was a significant difference in land-use change between river and mountain townships, and the extent of land-use change in river townships surpassed that in mountain townships. In most scenarios, urban land and other construction land in river townships increased significantly, while general cropland, grassland, rural settlement areas, and unused land exhibited a downward trend, among which general cropland decreased most significantly, followed by grassland and rural settlement areas. The changes in general cropland, urban land, rural settlement area, and unused land in river townships are larger than those in mountain townships because river townships are located in the north–south development axis of Lintao County, which has a faster development speed, and the urban land and other construction land have a stronger expansion capacity, such as Taoyang Township and Yujing Township, which, as the location of Lintao County Township and Lintao Airport, will encroach on a large amount of general cropland in the vicinity of its rapid expansion in rural settlement areas. The changes in general cropland, grassland, and other construction land in mountainous townships were remarkable: general cropland and grassland exhibited a downward trend, shifting to other construction land, and other construction land exhibited an upward trend. The changes in grassland and other construction land in mountain townships were greater than those in river townships. This is because mountain townships have large areas of grassland, and Zhongpu Industrial Park is expanding outward as a strong site.
Regardless of river townships and mountainous townships, urban land and other construction land are strong land, with stronger expansion capacity, while general cropland and rural settlement areas are weak land, sacrificing the expansion of strong land; general cropland has more significant changes than sloping cropland, which indicates that general croplands are more susceptible to changes in the external environment.

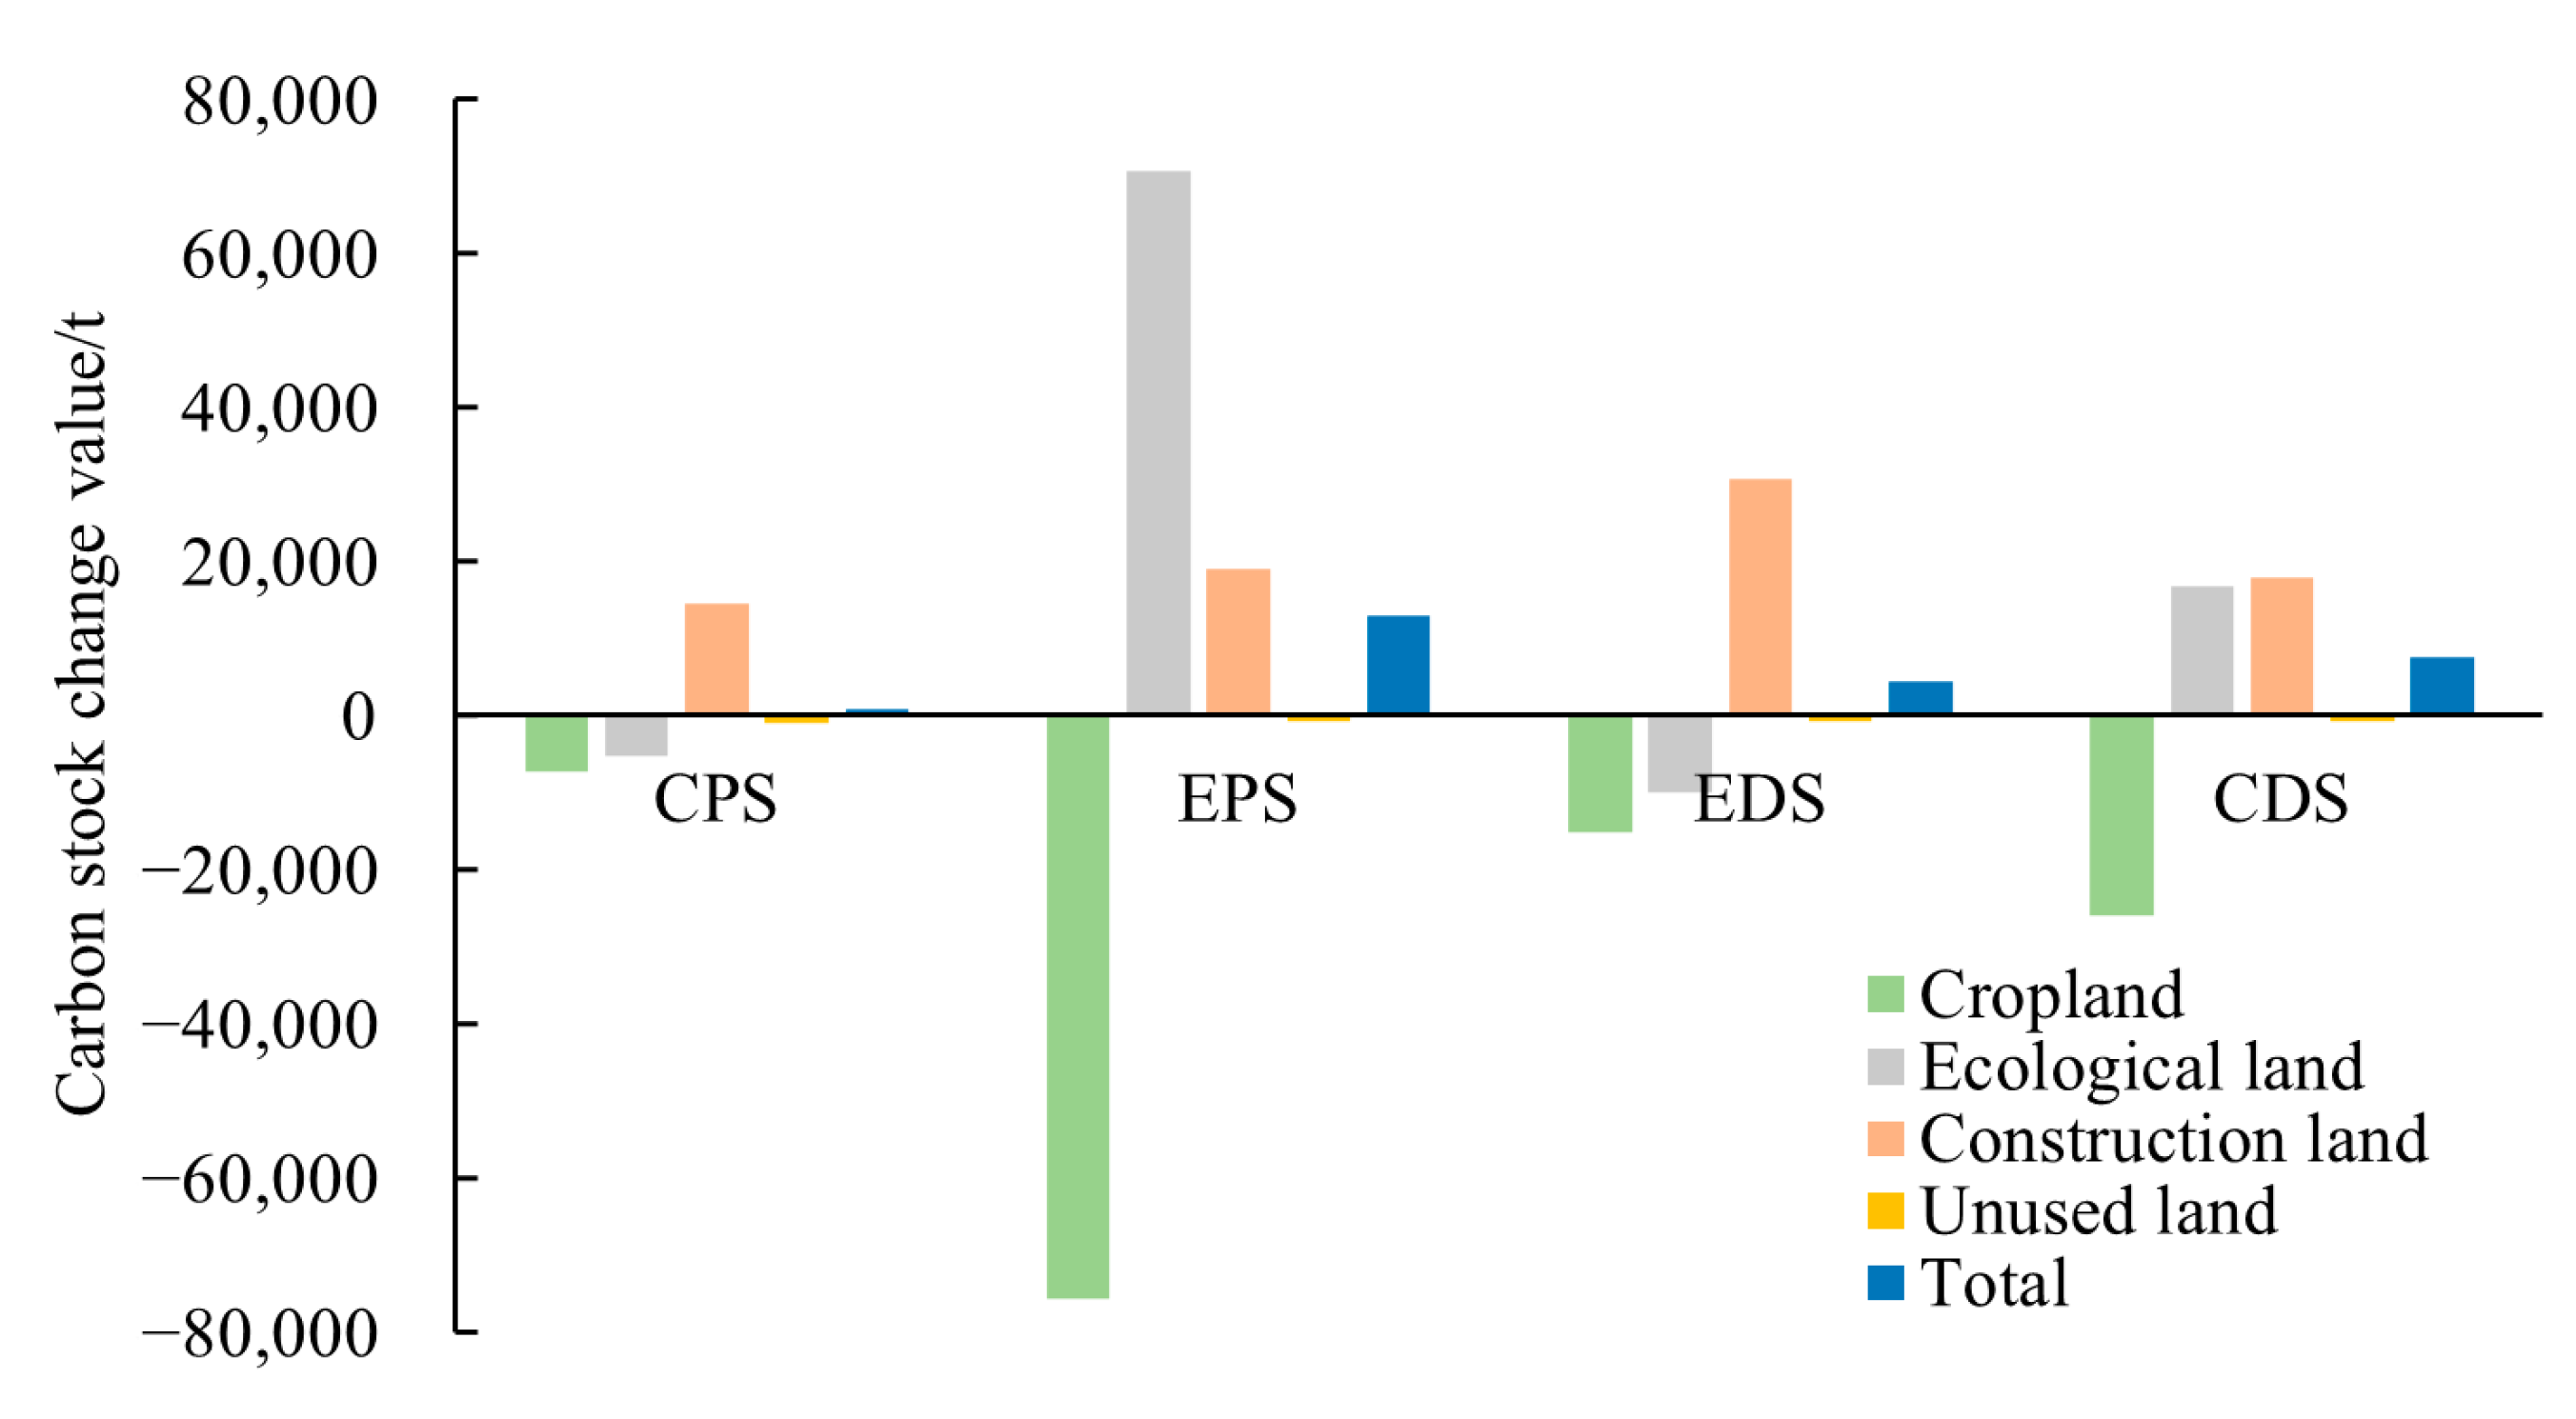
4.2.2. Analysis of Carbon Stock Changes under Multiple Scenarios

Using the InVEST model, carbon stocks and changes in each scenario were obtained by calculating the 2035 land use raster data for the four scenarios in the study area.
In 2035, the carbon stock in Lintao County under all four scenarios shows an increasing trend, and the carbon stock under the CPS, EPS, EDS, and CDS will increase by 755.64 t, 12,904.16 t, 4404.94 t, and 7424.15 t. The carbon stock in Lintao County under the EPS will increase the most, and the carbon stock under the CPS will increase the least (Figure 8). Among them, the land per capita carbon stock under the EPS was the largest at 77.44 t/hm2, followed by the per capita carbon stock in descending order of 77.42 t/hm2 under the CDS, 77.41 t/hm2 under the EDS, and 77.39 t/hm2 under the CPS.
Figure 9 shows the spatial distribution of carbon storage in Lintao County under different scenarios. High-value carbon stock areas were mainly concentrated in the northeastern and southern mountainous areas (inside the red dotted box), which have a high topography, steep terrain, little interference from human activities, and are protected forest areas with better ecological land development, with a significantly higher carbon stock capacity than other areas. The area along the Taohe River and the mountainous gully area are low-carbon stock areas (inside the blue dotted box), which are mainly urban land, rural settlement areas, other construction land, and unused land. The flat terrain and sufficient water provide good conditions for human settlement but also make the density of construction land in this area much higher than that in other areas, and the carbon stock capacity is relatively weak.
Among the four scenarios, the CPS effectively reduces the reduction in carbon stock in cropland, but the total carbon stock increases the least. The ecological land carbon stock increases significantly under the EPS, but it is also accompanied by a significant reduction in carbon stock in cropland. The EDS causes a large increase in carbon stock in construction land at the expense of cropland and ecological land carbon stock. Compared with the other scenarios, the CDS is similar to the EPS; considering the needs of other scenarios, the carbon stock changes in each land use are relatively gentle, and the increase in carbon stock is maintained at a high level, which meets the requirements of regional sustainable development.

5. Discussion

  • Exploring Land Use and Multi-Objective Coordination Pathways in Lintao County under Multi-Scenario Simulation
In the context of the current national considerations of food security, ecological security, and new urbanization, this study sets up scenarios for CPS, EPS, EDS, and CDS that consider multiple needs. This paper introduces the permanent basic farmland and ecological protection red line as policy constraints, subdivides cropland into general cropland and sloping cropland in land use classification, and subdivides construction land into urban land, rural settlement areas, and other construction land to explore the changing law of multiple land use types under the influence of multiple scenarios and policies. Achieving the “dual-carbon” goal is an important task for China, and this paper also introduces the InVEST model to calculate the carbon stock changes in 2035 based on the land use simulation results, which provides a reference for choosing the best development path for the study area. Through a comparison of the results of multi-scenario simulation and the analysis of carbon stock changes, it was found that the CDS is most conducive to promoting the achievement of combining the new urbanization, food security, and ecological civilization construction of Lintao County. In previous studies, it has been acknowledged that pursuing a singular development approach is not feasible. Various perspectives have been put forward, including advocating for the balanced development of water resources and agriculture [57], balancing development with environmental preservation [58,59], promoting sustainable urban growth [60], and endorsing the concept of a self-sustaining economy [61]. Nonetheless, few studies have integrated multiple objectives comprehensively and conducted simulation research accordingly. Adding policy constraints in the land use simulation can effectively limit the expansion of construction land in the region, especially protecting cropland and ecological land in and near the river area, thereby enhancing the credibility of the study. A study in Owyhee County, Idaho, USA, also found that conservation policies improved ecosystem services [62]. Additionally, compared with other studies [57,58,63], through finer land use classifications, this study can identify the multi-objective conflict problem of land use restructuring at the county scale. In the land use status quo change and scenario simulation, a conflict between urban land and rural settlement areas in the county is found, and the reduction in construction land is still dominated by rural settlement areas. Other construction land, such as infrastructure to fill the shortcomings, may have to continue to grow, and the change in general cropland is more significant than that in sloping cropland. In the study of Diyarbakır [64], different expansion relationships between urban, rural, and agricultural land are proposed, which also demonstrates the necessity of finer land classification. Spatially, it can also be found that, compared with mountain townships, river townships have a greater intensity of land use change.
2.
Land sustainable development strategy in Lintao County under multi-objective coordination
In Lintao County, the proportion of construction land is increasing, and the western counties are developing under the new urbanization policy, with moderate control of urban construction land and a reduction in land mainly for rural settlement areas. General cropland and grassland are reduced in large quantities, but the land use structure of Lintao County is still dominated by general cropland and grassland, indicating that cropland and ecological land still occupy an important position in Lintao County, and the protection of basic farmland under food security has to be further strengthened, especially in the valley area where the cropland is of better quality and the sloping cropland can be moderately retired to forest and grassland. Previous studies have also shown differences in the carbon sequestration capacities of various land types, suggesting the need to optimize land use and that special attention should be paid to the protection of ecological land dominated by forests [65,66]. In Lintao County, the higher carbon density of forest land and grassland also makes the ecological land dominated by grassland and forest land. The higher carbon density of woodland and grassland also makes the ecological land, mainly grassland, and forest land, become the largest carbon pool in Lintao County, and the carbon stock in cropland is the second largest, so preserving cropland and ecological areas is crucial for the future accumulation of carbon stock in Lintao County. Therefore, it is necessary to reasonably lay out the construction land, adhere to the long-term thinking of cropland protection and ecological protection, establish the development concept of equal importance of quantity and quality, and gradually form a scientific and reasonable spatial pattern for the national territory.
3.
Deficiency and prospect
Although this study considers the natural, humanistic, and policy constraints, the factors of climate change and the geological environment have not been sufficiently considered and will be further incorporated into the model in future research. Meanwhile, I also note that previous studies have employed more advanced models and methods to enhance simulation accuracy [67], which is also worth considering for future research. Secondly, we employ previous methods and data to calculate carbon stock. Although carbon density values close to the study area were chosen as much as possible, there is still a difference with the actual value. In future research, we will strive to use field measurement data as much as possible.

6. Conclusions

Land use in Lintao County was simulated under four scenarios for 2035 based on the FLUS model, and differences in scenario simulation and spatial change were analyzed.
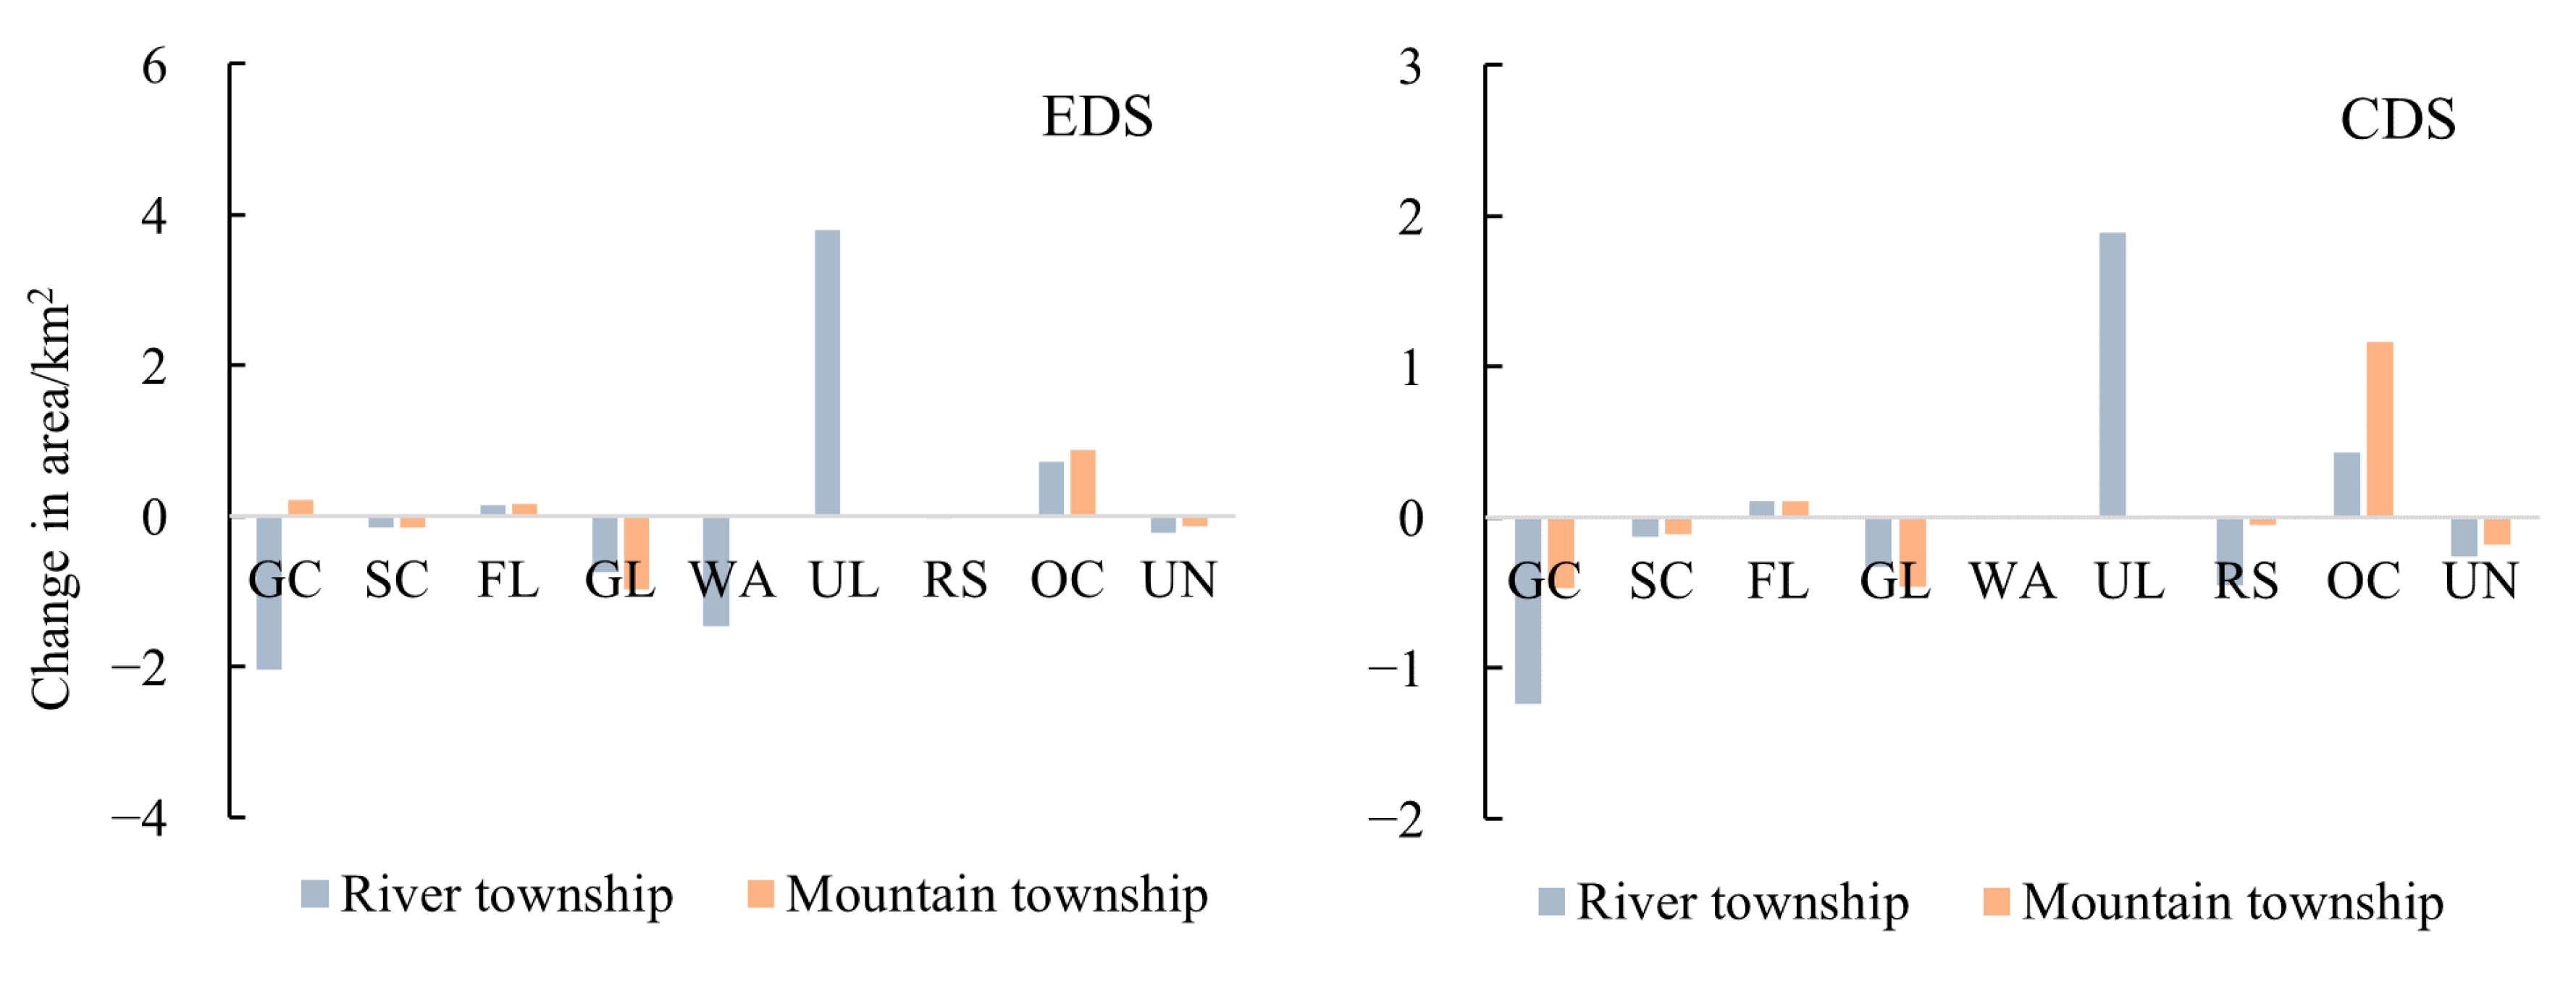
  • From 2000 to 2020, the transformation of land use in Lintao County will show the strongest motivation for the growth of construction land, with the scale of urban land and other construction land continuing to grow rapidly. The growth of land for rural settlement areas is relatively slow, while cropland and water areas continue to decrease, and forest land grows slowly. The increase in construction land is dominated by an increase in urban land and other construction land, whereas the increase in rural settlement area is slow and is also shifting to urban land and other construction land. The primary encroachment of construction land expansion is on cropland; among them, encroachment on general cropland is the main one, and the change in general cropland is more significant than that in sloping cropland. Spatially, except for other construction land, the intensity of change in other land-use types was greater in river townships than in mountain townships. River townships are dominated by an increase in forest land, urban land, rural settlement area, and unused land and a decrease in general cropland and grassland, while mountain townships are dominated by an increase in rural settlement area and other construction land and a decrease in general cropland. The intensity of land use change was greater in river townships than in mountain townships.
  • This study sets four different development scenarios, namely, CPS, EPS, EDS, and CDS, which can comprehensively simulate the land-use pattern under the multi-objective development needs of Lintao County. Among them, the CDS is more in line with the coordination of multiple objectives. Under the CDS, forest land, urban land, and other construction land show an increasing trend. The decrease in general cropland, grassland, and rural settlement areas slows, which can make up for the single-objective nature of the single-demand scenario and meet the multi-objective coordination needs of new urbanization, food security, and ecological civilization construction. Regarding temporal and spatial variations, the overall intensity of land use changes in river townships was greater than that in mountain townships under each scenario. The magnitudes of changes in general cropland, urban land, rural settlement areas, and unused land in river townships were greater than those in mountain townships, and the magnitudes of changes in grassland and other construction land in mountain townships were greater than those in river townships. By 2035, urban land and other construction land will still be strong land, with stronger expansion capacity, while general cropland and rural settlement areas will be weak land, sacrificing the expansion of strong land. General cropland is more susceptible to external environmental impacts, and its changes will be more pronounced than those of sloping cropland.
  • From the viewpoint of carbon stock change, the carbon stock of Lintao County under all four scenarios in 2035 shows an increasing trend, among which the carbon stock change under the CDS is more reasonable. The CDS takes into account the needs of CPS, EPS, and CDS, and the increase in carbon stock is maintained at a high level, with the increase in carbon stock in construction land and ecological land as the major part and the decrease in carbon stock in cropland slows down compared with other scenarios. The change in carbon stock in various land uses is more moderate, and the development of construction land has been taken into account, while the protection of cropland and ecological land has been taken into account.

Author Contributions

Conceptualization, Z.L.; methodology, W.Z.; software, W.Z.; validation, Z.L., W.Z. and J.L.; formal analysis, Z.L.; resources, Z.L.; data curation, Z.L.; writing—original draft preparation, W.Z.; writing—review and editing, Z.L. and W.Z.; visualization, W.Z., J.W. and X.B.; supervision, Z.L.; project administration, Z.L.; funding acquisition, Z.L. All authors have read and agreed to the published version of the manuscript.

Funding

This research was funded by the National Natural Science Foundation of China (grant number 42061034; sponsor: Zhanfu Luo).

Institutional Review Board Statement

Not applicable.

Informed Consent Statement

Not applicable.

Data Availability Statement

The data presented in this study are available upon request from the corresponding author.

Conflicts of Interest

The authors declare no conflict of interest.

References

  1. Liu, J.; Kuang, W.; Zhang, Z.; Xu, X.; Qin, Y.; Ning, J.; Zhou, W.; Zhang, S.; Li, R.; Yan, C. Spatiotemporal characteristics, patterns, and causes of land-use changes in China since the late 1980s. J. Geogr. Sci. 2014, 24, 195–210. [Google Scholar] [CrossRef]
  2. Kuang, W.; Zhang, S.; Du, G.; Yan, C.; Wu, S.; Li, R.; Lu, D.; Pan, T.; Ning, J.; Guo, C. Remotely sensed mapping and analysis of spatio-temporal patterns of land use change across China in 2015–2020. Acta Geogr. Sin. 2022, 77, 1056–1071. [Google Scholar]
  3. Liu, S.; Xiao, W.; Ye, Y.; He, T.; Luo, H. Rural residential land expansion and its impacts on cultivated land in China between 1990 and 2020. Land Use Policy 2023, 132, 106816. [Google Scholar] [CrossRef]
  4. Dong, S.; Xin, L.; Li, S.; Xie, H.; Zhao, Y.; Wang, X.; Li, X.; Song, H.; Lu, Y. Extent and spatial distribution of terrace abandonment in China. J. Geogr. Sci. 2023, 33, 1361–1376. [Google Scholar] [CrossRef]
  5. Wang, C.; Guo, X.; Guo, L.; Bai, L.; Xia, L.; Wang, C.; Li, T. Land Use Change and Its Impact on Carbon Storage in Northwest China Based on FLUS-Invest: A Case Study of Hu-Bao-Er-Yu Urban Agglomeration. Ecol. Environ. 2022, 31, 1667. [Google Scholar]
  6. Sun, Z. Spatial Complexity Analysis and a Geographical Model Based on Cellular Automata. J. Geo-Inf. Sci. 1999, 2, 32–37. [Google Scholar]
  7. Liu, M.; Chen, P. A spatial sprawl and growth model of the city and simulation. Hum. Geogr. 2004, 2, 6–11. [Google Scholar]
  8. Clarke, K.C. Mapping and modelling land use change: An application of the SLEUTH model. In Landscape Analysis and Visualisation; Springer: Berlin/Heidelberg, Germany, 2008; pp. 353–366. [Google Scholar]
  9. Shen, T. China urban future simulation: An integrated framework of CGE and GIS. Adv. Earth Sci. 2006, 21, 1153. [Google Scholar]
  10. Chen, R.; Lv, B. Urban spatial models: New trends, types and methods. Econ. Geogr. 2007, 27, 240–244. [Google Scholar]
  11. Long, Y.; Han, H.; Mao, Q. Establishing urban growth boundaries using constrained CA. Acta Geogr. Sin. 2009, 64, 999–1008. [Google Scholar]
  12. Wu, W.; Zhou, S.; Wei, Y.; Liu, K.; Chen, J.; Guan, W. Scenario simulation and changes of urban growth patterns in central cities: A case study of Quanzhou, China. Geog. Res. 2013, 32, 2041–2054. [Google Scholar]
  13. Jawarneh, R.N. Modeling past, present, and future urban growth impacts on primary agricultural land in Greater Irbid Municipality, Jordan using SLEUTH (1972–2050). ISPRS Int. J. Geo-Inf. 2021, 10, 212. [Google Scholar] [CrossRef]
  14. Yang, W.; Du, J.; He, H.; Yang, W.; Chen, L. Urban growth boundary delimitation in Guangzhou city based on PLUS-UGB multi-scenarios simulation. Geospat. Inf. 2022, 20, 38–42. [Google Scholar]
  15. Cao, Y.; Yao, L.; Tao, J. Cultivated land change and simulation in China based on GIS and BP neural network. Arid Land Geogr. 2008, 31, 765–771. [Google Scholar]
  16. Yu, H.; Zeng, S.; Wang, Q.; Dai, J.; Bian, Z.; Chen, F. Forecast on China’s cultivated land protection baseline in the new era by multi-scenario simulations. Resour. Sci. 2021, 43, 1222–1233. [Google Scholar]
  17. Wang, X.; Huang, Q.; Cai, Y. Simulation of Farmland Spatial Pattern in Maotiao River Basin, Guizhou Province. Sci. Geogr. Sin. 2007, 27, 188. [Google Scholar]
  18. Fu, Q.; Mao, F.; Zhu, J.; Wang, T.J. Study of Arable Land Cha nge and Simulation in Qingdao City. China Popul. Resour. Environ. 2012, 22, 201–204. [Google Scholar]
  19. Zeng, L.; Wang, J.; Wang, H. Analysis and simulation of cultivated land conversion and distribution in Beijing mountainous areas based on GIS and Logistic regression model. Acta Sci. Nat. Univ. Pekin. 2009, 45, 165. [Google Scholar]
  20. Kiziridis, D.A.; Mastrogianni, A.; Pleniou, M.; Tsiftsis, S.; Xystrakis, F.; Tsiripidis, I. Simulating future land use and cover of a Mediterranean mountainous area: The effect of socioeconomic demands and climatic changes. Land 2023, 12, 253. [Google Scholar] [CrossRef]
  21. Xiao, L.; Tian, G.; Qiao, Z. An agent-based approach for urban encroachment on cropland dynamic model and simulation. J. Nat. Resour. 2014, 29, 516–527. [Google Scholar]
  22. Song, L.; Cao, Y.; Zhou, W.; Kuang, X.; Luo, G. Simulation study on cultivated land utilization in rapid urbanization area of Three Gorges Reservoir area based on SD model. Resour. Environ. Yangtze Basin 2018, 27, 818–827. [Google Scholar]
  23. Jiang, Q.; Tan, B.; Xue, X.; Qi, Y.; Deng, X. Quantitive modeling changes in area of reclamation and returning cultivated land to forest or pastures under representative concentration pathways (RCPs) climate scenarios. Trans. Chin. Soc. Agric. Eng. 2015, 31, 271–280. [Google Scholar]
  24. Li, Q.; Shi, X.; Zhao, Z.; Wu, Q. Multi-Scenario Simulation of Ecosystems Based on Adaptive Restoration to Promote Human–Nature Harmony: A Case Study of Loess Hills Micro-Watershed. Land 2024, 13, 233. [Google Scholar] [CrossRef]
  25. Wang, X.; Ma, B.; Li, D.; Chen, K.; Yao, H. Multi-scenario simulation and prediction of ecological space in Hubei province based on FLUS model. J. Nat. Resour. 2020, 35, 230–242. [Google Scholar]
  26. Liu, J.; Hu, T.; Pan, X.; Zhang, D.; Zhang, L.; Li, Y. Simulating coastal wetland changes in Hangzhou Bay using Markov-ClUES coupling model. Ecol. Environ. Sci. 2018, 27, 1359–1368. [Google Scholar]
  27. Tian, H.; Liang, X.; Li, X.; Liu, X.; Ou, J.; Hong, Y.; He, Z. Simulating Multiple Land Use Scenarios in China during 2010–2050 Based on System Dynamic Model. Trop. Geogr. 2017, 37, 547–561. [Google Scholar]
  28. Chen, L.; Cai, H.; Zhang, T.; Zhang, X.; Zeng, H. Land use multi-scenario simulation analysis of Rao River Basin based on Markov-FLUS model. Acta Ecol. Sin. 2022, 42, 3947–3958. [Google Scholar]
  29. Gasirabo, A.; Xi, C.; Hamad, B.R.; Edovia, U.D. A CA–Markov-Based Simulation and Prediction of LULC Changes over the Nyabarongo River Basin, Rwanda. Land 2023, 12, 1788. [Google Scholar] [CrossRef]
  30. Wang, J.; Wang, R.; Feng, Y.; Lei, Z.; Gao, C.; Chen, S.; Jin, Y.; Zhai, S. Simulating land use patterns of the Mid-Zhejiang urban agglomeration considering the effects of urban rail transit. J. Geo-Inf. Sci. 2020, 22, 605–615. [Google Scholar]
  31. Liu, Y.; Shi, J.; Zheng, Y.; Huang, X. The Evolution Pattern and Simulation of Land Use in the Beijing Municipal Administrative Center (Tongzhou District). J. Resour. Ecol. 2022, 13, 270–284. [Google Scholar]
  32. Yuan, X.; Zhou, J.; Hu, B.; Gao, Q. Multi-scenario simulation and prediction of ecological-productive-living spaces in Guangdong-Hong Kong-Macao Greater Bay Area based on FLUS model. Sci. Geogr. Sin. 2023, 43, 564–574. [Google Scholar]
  33. Lin, Z.; Li, S.H.; Yi, B.J.; Fu, T.; Gao, Q.S.; Sun, X.Y.; Qiu, L.D. Multiple Scenario Perspective of Production-Living-Ecological Space Change Simulation and Effect Evaluation in Yunnan Province. J. Soil Water Conserv. 2023, 38, 220–230. [Google Scholar]
  34. Ke, X.; Xiao, B.; Zheng, W.; Ma, Y.; Li, H. Urban-agricultural-ecological space zoning based on scenario simulation. J. Geo Inf. Sci. 2020, 22, 580–591. [Google Scholar]
  35. Ebodé, V.B.; Onana, J.Y.N.; Boyomo, T.M.S. Water resources availability in the Mefou basin, Cameroon: Under current and future climate, and land use and land cover. Sustain. Water Resour. Manag. 2024, 10, 78. [Google Scholar] [CrossRef]
  36. Asante-Yeboah, E.; Koo, H.; Ros-Tonen, M.A.; Sieber, S.; Fürst, C. Participatory and Spatially Explicit Assessment to Envision the Future of Land-Use/Land-Cover Change Scenarios on Selected Ecosystem Services in Southwestern Ghana. Environ. Manag. 2024, 1–20. [Google Scholar] [CrossRef] [PubMed]
  37. Bachri, S.; Shrestha, R.P.; Irawan, L.Y.; Masruroh, H.; Prastiwi, M.R.H.; Billah, E.N.; Putri, N.R.C.; Hakiki, A.R.R.; Hidiyah, T.M. Land Use Change Simulation Model Using a Land Change Modeler in Anticipation of the Impact of the Semeru Volcano Eruption Disaster in Indonesia. Environ. Chall. 2024, 14, 100862. [Google Scholar] [CrossRef]
  38. Penfound, E.; Vaz, E. Modelling future wetland loss with land use landcover change simulation in the Greater Toronto and Hamilton Area: The importance of continued greenbelt development restrictions. Habitat Int. 2024, 143, 102974. [Google Scholar] [CrossRef]
  39. Wang, R.; Zhao, J.; Lin, Y.; Chen, G.; Cao, Q.; Feng, Y. Land Change Simulation and Forest Carbon Storage of Central Yunnan Urban Agglomeration, China Based on SSP-RCP Scenarios. Forests 2022, 13, 2030. [Google Scholar] [CrossRef]
  40. Xie, T.; Li, L.; Chen, X.; Bai, L.; Xia, L.; Wang, C.; Li, T. Estimation and prediction of carbon storage based on land use in the Huaihai Economic Zone. J. China Agric. Univ. 2021, 26, 131–142. [Google Scholar]
  41. Sun, X.; Xue, J.; Dong, L. Spatiotemporal Change and Prediction of Carbon Storage in Nanjing Ecosystem Based on PLUS Model and InVEST Model. J. Ecol. Rural Environ. 2023, 39, 41–51. [Google Scholar]
  42. Xu, X.; Liu, H.; Lin, Z.; Liu, J.; Li, L. Scenario analysis of land use change in Jiangsu coast based on CA-Markov model. Res. Soil Water Conserv. 2017, 24, 213–218. [Google Scholar]
  43. Liang, X.; Liu, X.; Li, X.; Chen, Y.; Tian, H.; Yao, Y. Delineating multi-scenario urban growth boundaries with a CA-based FLUS model and morphological method. Landsc. Urban Plan. 2018, 177, 47–63. [Google Scholar] [CrossRef]
  44. Hou, J.; Chen, J.; Zhang, K.; Zhou, G.; You, H.; Han, X. Temporal and spatial variation characteristics of carbon storage in the source region of the Yellow River based on InVEST and GeoSoS-FLUS models and its response to different future scenarios. Huan Jing Ke Xue Huanjing Kexue 2022, 43, 5253–5262. [Google Scholar] [PubMed]
  45. Wang, X.; Bao, Y. Study on the methods of land use dynamic change research. Prog. Geogr. 1999, 18, 81–87. [Google Scholar]
  46. Wang, M. Research on Simulation and Prediction Method for Land Use Change Based on FLUS Model. Geomat. Spat. Inf. Technol. 2022, 45, 161–166. [Google Scholar]
  47. Wang, X.; Yao, Y.; Ren, S.; Shi, X. A Coupled FLUS and Markov approach to simulate the spatial pattern of land use in rapidly developing cities. J. Geo-Inf. Sci. 2022, 24, 100–113. [Google Scholar]
  48. Xu, W.; Wang, P.; Han, P.; Yan, T.; Zhang, S. Application of Kappa coefficient to accuracy assessments of drought forecasting model: A case study of Guanzhong Plain. J. Nat. Disasters 2011, 20, 81–86. [Google Scholar]
  49. Xu, L.; He, N.; Yu, G. A dataset of carbon density in Chinese terrestrial ecosystems (2010s). China Sci. Data 2019, 4, 90–96. [Google Scholar]
  50. Ren, X.; Pei, T.; Chen, Y.; Xie, B.; Cheng, D. Impact of land ues change on carbon storage in Gansu Province based on carbon density correction. Ecol. Sci. 2021, 40, 66–74. [Google Scholar]
  51. Chen, N.; Xin, C.-L.; Tang, D.-B.; Zhang, L.; Xin, S.-J. Multi-scenario land use optimization and carbon storage assessment in Northwest China. Huan Jing Ke Xue Huanjing Kexue 2023, 44, 4655–4665. [Google Scholar]
  52. Wang, H.; Zeng, Y. Land use optimization simulation based on low-carbon emissions in eastern part of Qinghai Plateau. Geogr. Res. 2015, 34, 1270–1284. [Google Scholar]
  53. Zeng, Y.; WANG, H. Optimization of land use structure for low-carbon targets in Haidong city, Qinghai Plateau. Resour. Sci. 2015, 37, 2010–2017. [Google Scholar]
  54. Zhao, R.; Huang, X.; Zhong, T. Carbon storage and flux of different land use types in Nanjing. Chin. J. Soil Water Conserv. 2012, 26, 164–170. [Google Scholar]
  55. Guo, X.; Zhang, Y.; Guo, D.; Lu, W.; Xu, H. How does ecological protection redline policy affect regional land use and ecosystem services? Environ. Impact Assess. Rev. 2023, 100, 107062. [Google Scholar] [CrossRef]
  56. Gao, Z.; Wang, X.; Sui, X.; Wang, X.; Fan, Y.; Zhu, Q.; Lv, L. Multi-scenario prediction of habitat quality in Nanjing based on FLUS and InVEST models. J. Agric. Resour. Environ. 2022, 39, 1001. [Google Scholar]
  57. Beroho, M.; Briak, H.; Cherif, E.K.; Boulahfa, I.; Ouallali, A.; Mrabet, R.; Kebede, F.; Bernardino, A.; Aboumaria, K. Future scenarios of land use/land cover (LULC) based on a CA-markov simulation model: Case of a mediterranean watershed in Morocco. Remote Sens. 2023, 15, 1162. [Google Scholar] [CrossRef]
  58. Souza, J.M.d.; Morgado, P.; Costa, E.M.D.; Vianna, L.F.d.N. Predictive Scenarios of LULC Changes Supporting Public Policies: The Case of Chapecó River Ecological Corridor, Santa Catarina/Brazil. Land 2023, 12, 181. [Google Scholar] [CrossRef]
  59. Sfa, F.E.; Nemiche, M.; Rayd, H. A generic macroscopic cellular automata model for land use change: The case of the Drâa valley. Ecol. Complex. 2020, 43, 100851. [Google Scholar] [CrossRef]
  60. Domingo, D.; Palka, G.; Hersperger, A.M. Effect of zoning plans on urban land-use change: A multi-scenario simulation for supporting sustainable urban growth. Sustain. Cities Soc. 2021, 69, 102833. [Google Scholar] [CrossRef]
  61. Waiyasusri, K.; Chotpantarat, S. Spatial evolution of coastal tourist city using the Dyna-CLUE model in Koh Chang of Thailand during 1990–2050. ISPRS Int. J. Geo-Inf. 2022, 11, 49. [Google Scholar] [CrossRef]
  62. Huang, L.; Cronan, D.; Kliskey, A. Stakeholder-Driven Policies and Scenarios of Land System Change and Environmental Impacts: A Case Study of Owyhee County, Idaho, United States. Sustainability 2024, 16, 467. [Google Scholar] [CrossRef]
  63. Zhu, K.; Cheng, Y.; Zang, W.; Zhou, Q.; El Archi, Y.; Mousazadeh, H.; Kabil, M.; Csobán, K.; Dávid, L.D. Multiscenario simulation of land-use change in Hubei Province, China based on the Markov-FLUS Model. Land 2023, 12, 744. [Google Scholar] [CrossRef]
  64. Çağlıyan, A.; Dağlı, D. Monitoring land use land cover changes and modelling of urban growth using a future land use simulation model (FLUS) in Diyarbakır, Turkey. Sustainability 2022, 14, 9180. [Google Scholar] [CrossRef]
  65. Cantarello, E.; Newton, A.C.; Hill, R.A. Potential effects of future land-use change on regional carbon stocks in the UK. Environ. Sci. Policy 2011, 14, 40–52. [Google Scholar] [CrossRef]
  66. Michel, O.O.; Yu, Y.; Fan, W.; Lubalega, T.; Chen, C.; Sudi Kaiko, C.K. Impact of land use change on tree diversity and aboveground carbon storage in the Mayombe tropical Forest of the Democratic Republic of Congo. Land 2022, 11, 787. [Google Scholar] [CrossRef]
  67. Molinero-Parejo, R.; Aguilera-Benavente, F.; Gómez-Delgado, M.; Shurupov, N. Combining a land parcel cellular automata (LP-CA) model with participatory approaches in the simulation of disruptive future scenarios of urban land use change. Comput. Environ. Urban Syst. 2023, 99, 101895. [Google Scholar] [CrossRef]
Figure 1. Geographic location of Lintao County.
Sustainability 16 03178 g001
Figure 2. Scenario simulation study flowchart.
Sustainability 16 03178 g002
Figure 3. Map illustrating the transfer of land use from 2000 to 2020.
Sustainability 16 03178 g003
Figure 4. Land use change in river and mountain townships.
Sustainability 16 03178 g004
Figure 5. Results of multi-scenario simulation in 2035. (Number 1 is the forest land in the eastern mountainous area, number 2 is the urban area of Lintao County, and number 3 is Yujing Town near the urban area of the Lintao county).
Sustainability 16 03178 g005
Figure 6. Land use change under scenario simulation.
Sustainability 16 03178 g006
Figure 7. Land use changes in rivers and mountain towns in multiple scenarios.
Sustainability 16 03178 g007aSustainability 16 03178 g007b
Figure 8. Changes in carbon stock in multiple scenarios.
Sustainability 16 03178 g008
Figure 9. Spatial distribution of multi-scenario carbon stocks.
Sustainability 16 03178 g009
Table 1. Data sources.
Data TypeData SourcesData Description
Administrative boundariesRESDC (http://www.resdc.cn (accessed on 6 March 2023)) County and township administrative boundary data for 2020
Land use data2000–2020 data, 30 × 30 m
Elevation/mGeospatial data cloud
(http://www.gscloud.cn/ (accessed on 10 March 2023))
30 × 30 m
population densityChina County Statistical Yearbook (Township Volume)Persons/km2
Gross industrial outputTen thousand yuan
County governmentLintao County Department of Natural Resources2020 data
Formed town halls2020 data
River vector dataRESDC (http://www.resdc.cn (accessed on 10 March 2023))Data on the spatial distribution of tertiary river basins in China in 2020
Road dataNational Centre for Basic Geographic Information
(http://www.ngcc.cn/ (accessed on 10 March 2023))
2020 data
Permanent basic farmlandLintao County Department of Natural ResourcesVector data
Ecological conservation red line
Table 2. Carbon density of non-construction land (t/hm2).
TypologyAbove-Ground Carbon DensitySubsurface Carbon DensitySoil Carbon DensityDead Organic Carbon Density
General cropland1.1015.3053.511.90
Sloping cropland1.1015.3053.511.90
Forest land24.565.8892.360.84
Grassland0.590.8279.000.04
Water area0.600.000.000.00
unused land0.440.5421.600.00
Note: Soil carbon density was selected as the average carbon density at 0–100 cm soil depth.
Table 3. Carbon density of construction land (t/hm2).
TypologyCarbon Pool CompositionCarbon Density
Urban landBuilding carbon pool, Furniture and book carbon pool, Human carbon pool66.67
Rural settlement areaBuildings carbon pool, Furniture and books carbon pool, Human and animals carbon pool13.21
Other construction landBuilding carbon pool40.10
Table 4. Neighborhood weighting factors.
Land TypeGCSCFLGLWAULRSOCUN
Ratio0.20.010.10.30.410.510.5
Table 5. Cost matrix.
GCSCFLGLWAULRSOCUN
GC100001010
SC011100000
FL001000000
GL101111110
CPSWA000010000
UL000001000
RS100001100
OC000001010
UN101101111
GC101101010
SC011100000
FL001000000
GL001110000
EPSWA000010000
UL000001000
RS001001100
OC000001010
UN001111111
GC100001010
SC011101010
FL001000000
EDSGL111101110
WA100011110
UL000001000
RS000001100
OC000001010
UN111111111
GC101001010
SC011100000
FL001000000
GL101101110
CDSWA000010000
UL000001000
RS000001110
OC000001010
UN001101111
Table 6. Land area and Percentage from 2000 to 2020.
20002005201020152020
Area/
km2
Percentage/%Area/
km2
Percentage/%Area/
km2
Percentage/%Area/
km2
Percentage/%Area/
km2
Percentage/%
GC732.5125.65726.6625.45726.1425.43722.2825.29710.5224.88
SC57.572.0256.391.9755.991.9656.091.9656.591.98
FL116.094.07115.684.05123.714.33123.594.33124.444.36
GL1846.9164.681850.8064.811839.4664.421839.3564.411841.9164.51
WA30.421.0730.481.0730.201.0630.261.0626.850.94
UL4.330.154.830.175.830.206.490.239.140.32
RS61.602.1664.592.2665.452.2966.182.3269.842.45
OC1.220.041.220.041.760.065.120.185.920.21
UN4.900.174.890.177.000.246.190.2210.110.35
Table 7. Land use transfer matrix from 2000 to 2020.
2020/km2
GCSCFLGLWAULRSOCUNTotal
2000/km2GC669.100.143.7931.571.513.7117.263.651.77732.51
SC0.1352.070.234.850.040.000.140.050.0657.57
FL1.320.11109.444.080.130.330.680.000.00116.09
GL25.983.9710.071799.350.600.002.570.613.751846.91
WA3.500.220.300.6224.520.270.830.010.0030.42
UL0.010.000.010.000.004.310.000.000.004.33
RS10.140.080.581.430.050.5248.320.430.0161.60
OC0.050.000.000.000.000.000.001.170.001.22
UN0.290.000.020.020.000.000.040.004.514.90
Total/km2710.5256.59124.441841.9126.859.1469.845.9210.112855.32
Land use dynamic degree/%−0.15−0.090.36−0.01−0.595.550.6719.265.32
Table 8. Scenario simulation area and rate of change.
GCSCFLGLWAULRSOCUN
2020Area/km2710.5256.59124.441841.9126.859.1469.845.9210.11
CPS709.7356.36124.741840.7926.9810.5768.987.519.68
EPS700.2256.34126.361847.7326.9211.2369.267.519.75
EDS708.6956.30124.751840.1925.3912.9469.837.519.74
CDS707.1556.32126.361841.0326.8511.0469.327.519.72
CPSRate of change/% (2020 to 2035)−0.11−0.420.24−0.060.4915.57−1.2426.88−4.23
EPS−1.45−0.431.540.320.2422.86−0.8326.88−3.61
EDS−0.26−0.520.25−0.09−5.4641.50−0.0226.88−3.69
CDS−0.47−0.481.54−0.050.0020.79−0.7426.88−3.86
Disclaimer/Publisher’s Note: The statements, opinions and data contained in all publications are solely those of the individual author(s) and contributor(s) and not of MDPI and/or the editor(s). MDPI and/or the editor(s) disclaim responsibility for any injury to people or property resulting from any ideas, methods, instructions or products referred to in the content.

