Article

An Innovative Passive Noise Control Technique for Environmental Protection: An Experimental Study in Explosion Noise Attenuation

Centre for Innovative Energy Technologies (CINET), Discipline of Chemical Engineering, School of Engineering, Faculty of Engineering & Built Environment, The University of Newcastle, Callaghan, NSW 2308, Australia
*
Author to whom correspondence should be addressed.
Sustainability 2024, 16(8), 3201; https://doi.org/10.3390/su16083201
Submission received: 5 February 2024 / Revised: 3 April 2024 / Accepted: 10 April 2024 / Published: 11 April 2024

Abstract

:
Passive noise control techniques are an effective way of mitigating environmental noise pollution caused by industrial activities, assisting with long-term sustainability in workplace health and safety. Excessive noise from various sources such as mining, construction, manufacturing, air blasting and large-scale gas and dust explosion investigations is challenging as it produces a high level of noise. Excessive explosion noise can have a significant impact on the surrounding environment and people. To suppress the noise to satisfactory levels for nearby occupants, several layers of acoustic barriers are employed. The effectiveness of each level of acoustic barrier is presented. A bottom ash granule base layer with a 300 mm thickness reduced the peak noise levels (136 dBA) by approximately 33 dBA. In the next stage, an autoclaved aerated concrete (AAC)-based 200 mm acoustic barrier was introduced, which suppressed 24 dBA of noise. The inside of the AAC acoustic barrier was finally covered with a 50 mm thick noise attenuation composite material layer constituted of a sound barrier and a sound absorber, and this composite material attenuated the noise level by 6 dBA. The entire noise suppression mechanism was found to be an effective way to suppress gas and dust explosion noise and satisfy the requirement of the occupant and sound level.

1. Introduction

Explosion noise is a nuisance in the investigations of gas and dust explosions. Regardless of the adverse impact of these noises on human health, understanding accidental gas and dust explosions is critical. Accidental fires and explosions in underground coal mines is an example of devastating gas and dust explosions as they occur and spread within a very short span of time. Explosions in underground coal mines have occurred several hundred times in human history [1,2,3,4,5,6]. In order to understand the nature of explosions in a real mine scenario, researchers conducted explosion studies with methane–air and methane–coal dust–air mixtures employing mainly small-sized apparatus [7,8,9,10,11,12,13,14,15,16] and, to some extent, with large-scale apparatus [17,18]. The turbulent combustion process generates noise in these studies [19]. While explosion noise remains manageable for small-scale setups, it poses challenges in larger experiments, potentially impacting surrounding living beings. Oran et al. reported instances of black bears and other animals being disturbed during explosion studies with methane–air mixtures [17]. Integrating acoustic barriers into explosion test facilities is crucial, especially for large-scale setups, to ensure noise levels remain within acceptable limits for nearby listeners.
Sound waves with an approximate frequency range of 20 Hz to 20 kHz are usually considered as audible sound for human hearing [20]. Above 20 kHz, sounds are not perceivable to human hearing and are termed as ultrasound. Similarly, sounds are also not recognisable below 20 Hz and are known as infrasound. Leventhall et al., however, showed that sound waves of 1.5 Hz were within the hearing threshold of human beings and suggested that non-audible sound in the lower range of frequency distribution should count from 1 Hz [21].
Human ears are less sensitive to the lower and upper ends of the audible range of sound waves. The non-linearity of human hearing is resolved by employing a few standardisations [22,23]. The most commonly employed technique is A-weighted sound level measurement. The hearing perception pattern of human beings with the frequency of sound waves is reflected in this measurement (Figure 1). The full audible range of 20 Hz to 20 kHz is applied in an A-weighting filter, and the weighting results in a shape that is similar to the perception of human ears with various frequencies [22,24]. Research on road traffic has shown that the lower sensitivity of human hearing is overcompensated in A-weighted sound level measurement when there is a significant amount of the low-frequency component in the sound. A significant content of the low-frequency component has been shown to increase annoyance to an audience [22,23].
A different weighting method, C-weighting sound level measurement, is employed when the sound pressure levels are high. A and C curves follow approximately the equal loudness of 40 and 100 phon curves, respectively [23]. The loudness of an entire 40 phon curve is equivalent to the loudness of a 1 kHz sound at 40 dB and a similar definition is applicable for a 100 phon curve [22,24]. At low and high frequencies, the weightings are more gradually reduced in C-weighting measurement than in A-weighting measurement as can be seen in Figure 1 [23].
When no frequency weighting is applied, the measurement provides a Z-weighting (Zero-weighting) sound level. A, C and Z-weighted measurements are usually presented by dBA, dBC and dBZ, or dB(A), dB(C) and dB(Z) [22,23,25]
In order to obtain a detailed understanding, octave bands of various fractions (e.g., half and one-third octave bands) are often employed in the analysis of sound data. A one-third octave band, for instance, varies with a factor of 21/3 from one centre frequency to the next. If the starting centre frequency is 1000 Hz, the earlier centre frequency is 800 Hz, while the later centre frequency is 1250 Hz. A factor of 21/6 determines the lower and upper end of each octave bandwidth. For instance, the one-third octave band of a centre frequency of 1000 Hz has a bandwidth of 891–1122 Hz and the end values can be obtained from 1000/21/6 to 1000 × 21/6. According to ISO 266:1997, Acoustics preferred frequencies, standardisation, 31 one-third octave bands with starting and end centre frequencies of 20 Hz and 20 kHz, respectively, are used in one-third octave band analysis. The octave bands thus provide a broader understanding, dividing the audible range sound frequency into several portions [22].
Sound pressure decreases inversely with distance from the source, resulting in a reduction of 6 dB per doubling of distance [26]. For example, if the noise level is 100 dB at 1 m from the source, it will decrease to 94 dB at 2 m. However, this reduction may not always meet listener requirements, especially in scenarios like explosion tests.
Various noise reduction techniques are employed in practice. Ideally, modifying the noise source is preferred [27], but altering the source in gas and dust explosion tests can compromise test conditions and data integrity. Hence, passive noise reduction methods such as sound absorption and blockage are favoured in such applications.
Silencers, noise attenuation curtains and enclosures are common noise absorber and barrier technologies. Silencers are frequently employed in automotive applications and they can be designed in a way to be integrated with explosion ducts [28]. Noise attenuation curtains have been found to be effective in many applications and they are very cost-effective [29]. They are expected to assist in explosion noise suppression. Enclosures, used for the purpose of noise attenuation, can be constructed with a diverse range of materials and their effectiveness largely depends on the geometry of the enclosure and the material employed. Bottom ash, autoclaved aerated concrete and some composite materials can be employed when constructing noise attenuation enclosures.
Bottom ash, as a porous material, is a great selection for reducing noises of both low and high frequencies. Sound with a frequency range of 20–200 Hz is described as low-frequency sound [30]. In terms of sound dampening, higher frequencies are easily absorbed by most materials including air [31]. In contrast, the absorption of low-frequency sounds is challenging as they are structure-borne sounds [32,33,34,35]. The poroelasticity characteristic of porous materials such as bottom ash-based structures are effective in absorbing low-frequency sounds [36]. The poroelasticity of a porous medium is defined as the interactions between the porous material and the flow of the pore fluid, and hence, their simultaneous deformation [24,37,38]. In porous mediums, low-frequency sounds have enough time to exchange heat between the solid materials and the sound wave travelling in the pore’s fluid and this isothermal process results in loss of energy for low-frequency sounds [36,39]. Arenas et al. investigated the acoustic behaviour of multiple-sized bottom ash particles from the co-combustion of coal and pet coke (70/30) [40]. They found that the sound absorption coefficient of the bottom ash particles increases with porosity. The sound absorption coefficient increased approximately three times when the void ratios of the bottom ash particles increased from 11% to 37% (equivalent porosities were 10% and 27%, respectively). The suppression of high-frequency sounds in porous medium occurs by a different mechanism. As the high-frequency sound wave travels in a zigzag path in the porous medium, it loses heat due to friction in an adiabatic process [36]. Thus a bottom ash-based structure functions as an efficient noise attenuation system for both low- and high-frequency sounds.
Autoclaved aerated concrete is a lightweight concrete due to its porous structure [41]. These concretes are manufactured mainly from cement, silica or quartz sand, lime and aluminium powder. When the ingredients are mixed with water, hydrogen is formed from the reaction of the aluminium powder, calcium hydroxide and water. When hydrogen leaves, it creates micropores in the concrete structure [42]. These micropores help in the suppression of noise level. Because of the porous structure of these materials, they are efficient in attenuating both low- and high-frequency sounds.
A noise attenuation composite material, constructed with an absorber and barrier, is capable of reducing noise level and is available commercially [43,44]. While the absorber components of these materials dissipate sound energy, the barrier component reflects that energy. The performance of the absorber is measured by the absorption coefficient. In contrast, transmission loss is estimated to evaluate the performance of the barrier [45]. The combination of the absorber and the barrier in these composite materials establishes them as a potential solution for noise suppression.
While noise reduction studies have extensively tackled stationary sources like fans and engines, research on impulse noise from explosions remains scarce. This study is unique in its focus on variable peak noise levels linked to the quantity of explosive fuel injected, particularly emphasising low-frequency noise components. Its novelty lies in investigating passive methods to attenuate low-frequency impulse noise arising from gas and dust explosions, filling a notable gap in the current literature.
A 30 m long explosion test tube, described as a detonation tube, has been deployed at the University of Newcastle with the intention of exploring the explosion characteristics of methane–air and methane–coal dust–air mixtures. While conducting explosion tests, the explosion noise became a nuisance for the University’s occupants. The magnitude of pressure escalation and the subsequent noise resulting from explosions is dependent upon the concentration of methane present within methane–air explosive mixtures. With the aim of attenuating the noise generated from the explosion study of methane–air and methane–coal dust–air mixtures, three levels of acoustic barriers were employed. The first level was constructed with a bottom ash-based enclosure. This enclosure was encapsulated by another enclosure, constructed by autoclaved aerated concrete, and the inside of this enclosure was covered by a noise attenuation composite material layer. The approach of this noise suppression mechanism in the gas and dust explosion investigations using sequential levels of acoustic barrier, carried out at the University of Newcastle, Australia, has been detailed in this article.

2. Methodology and Technique

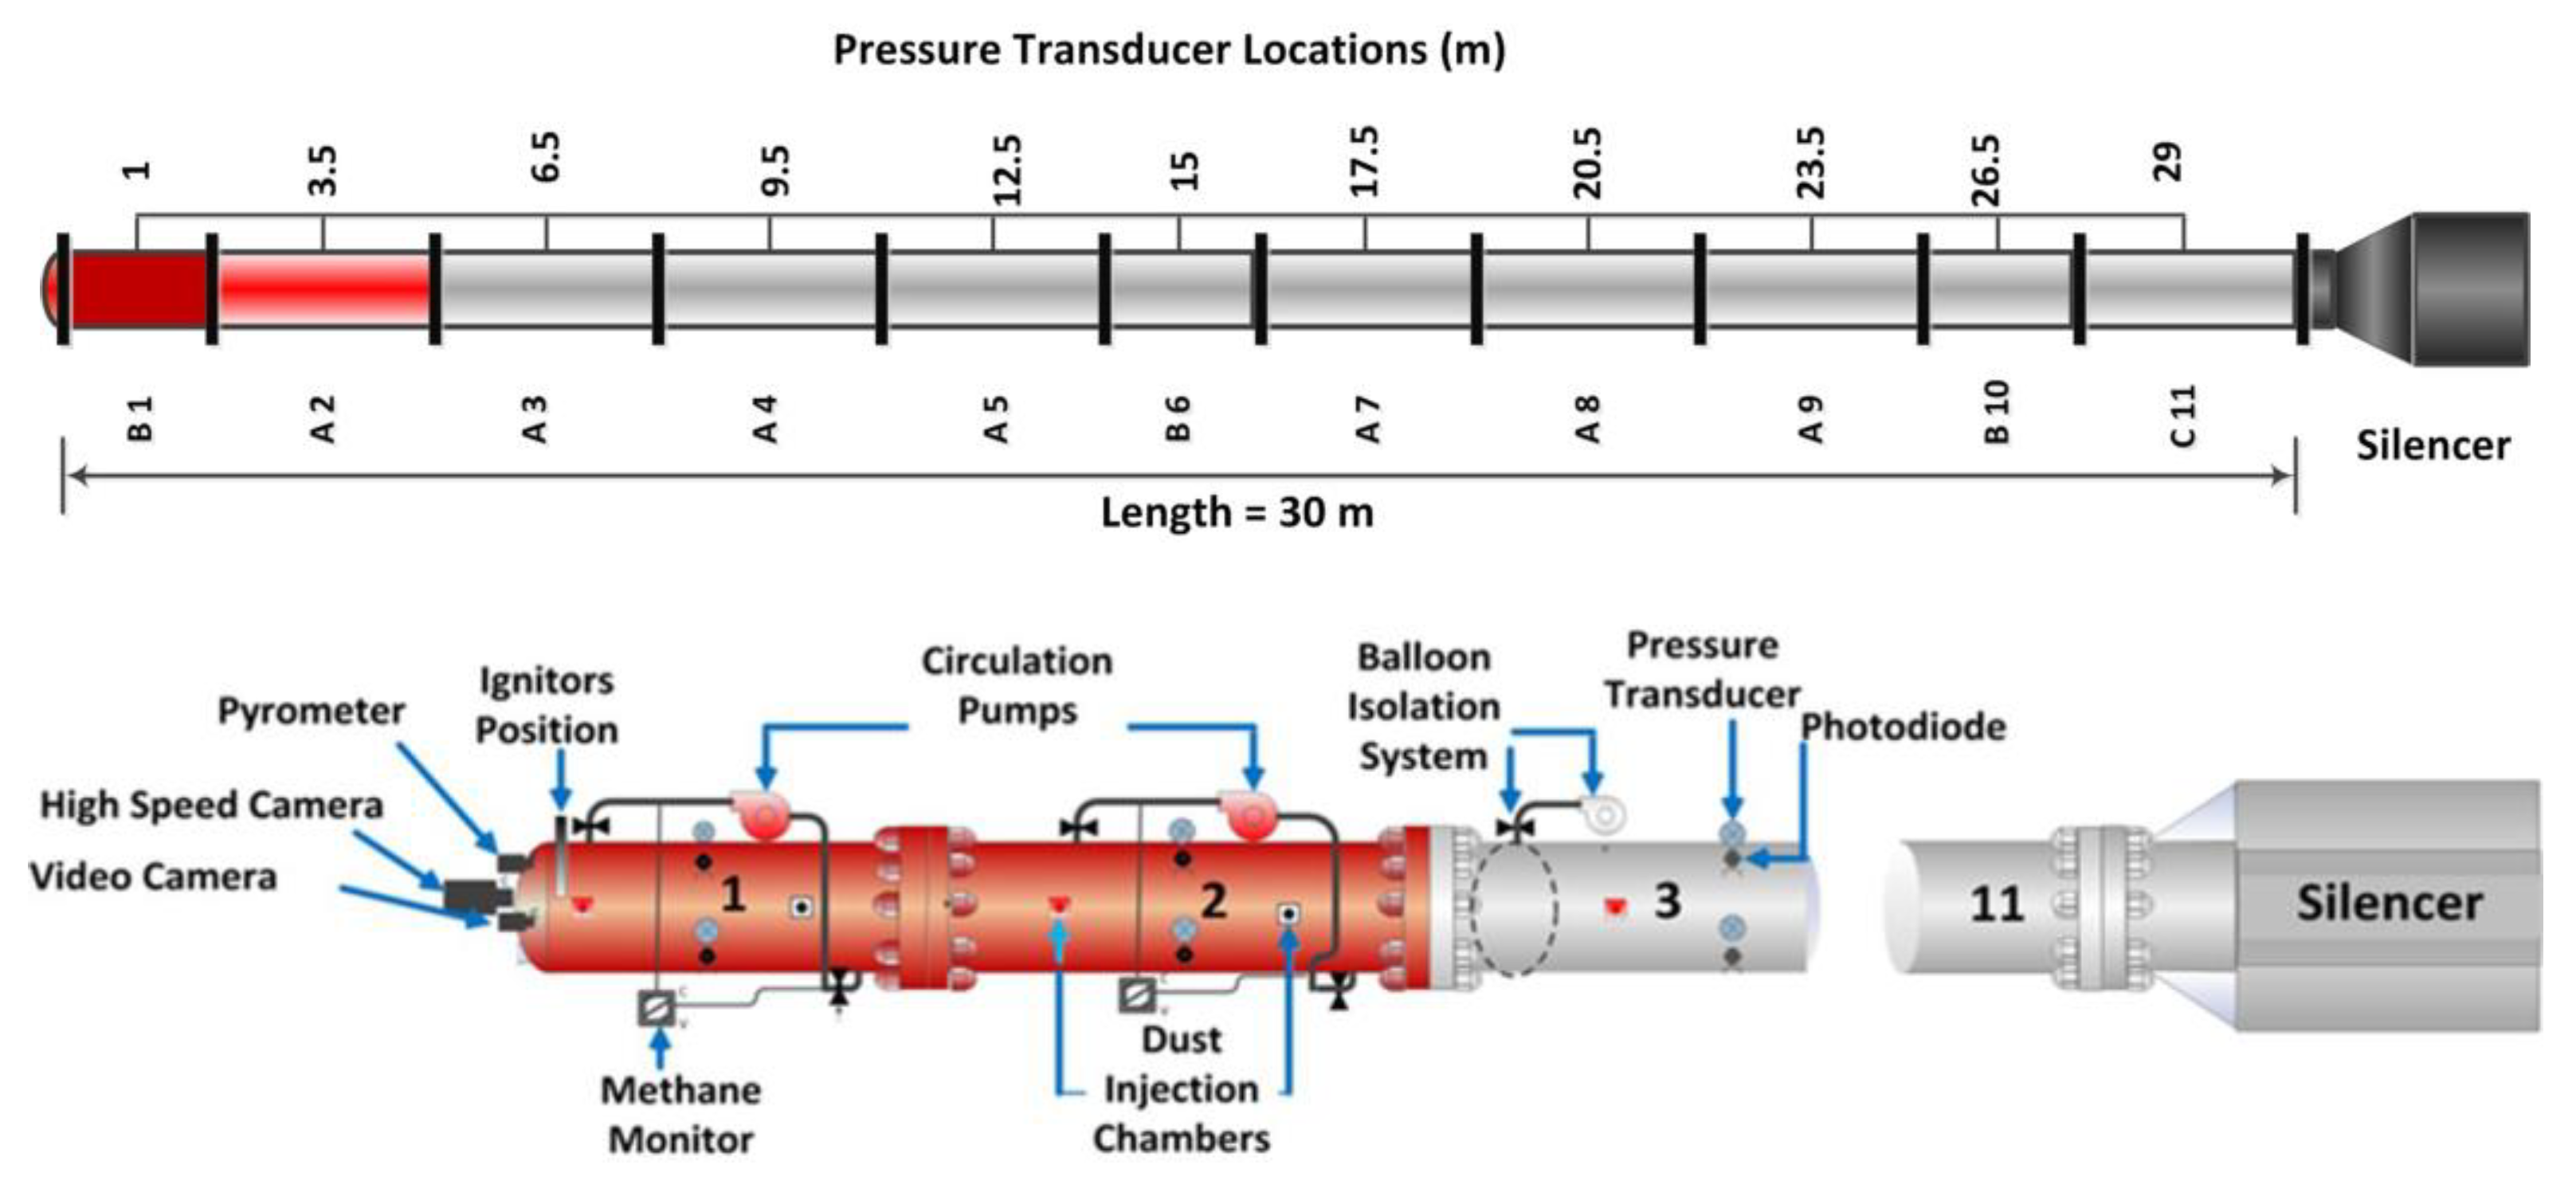
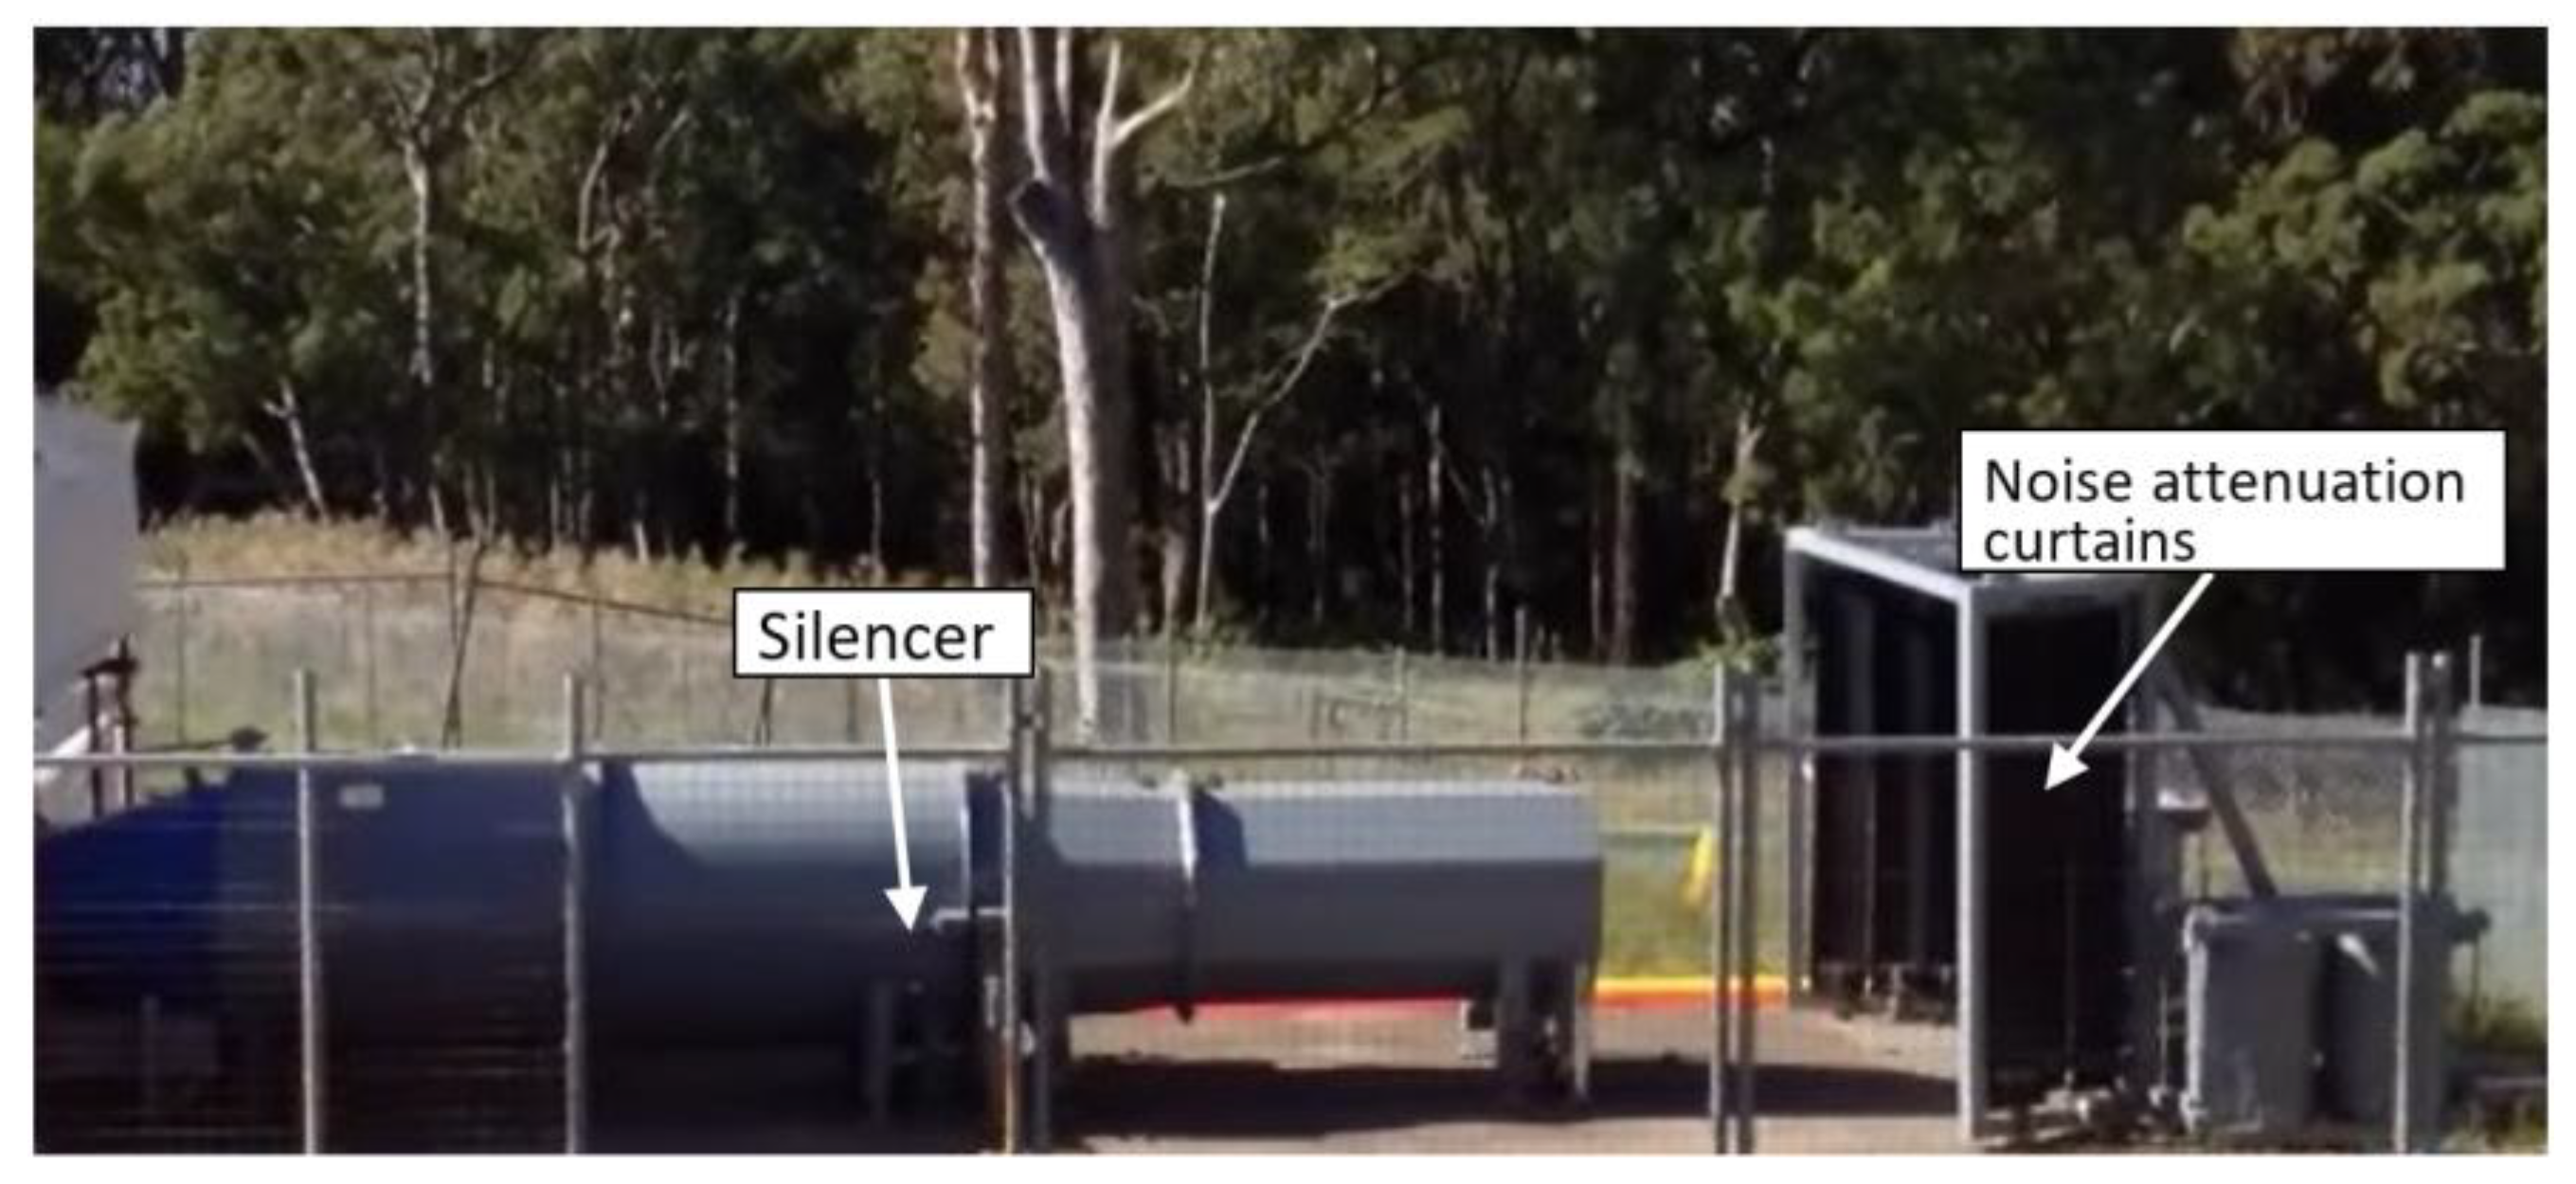
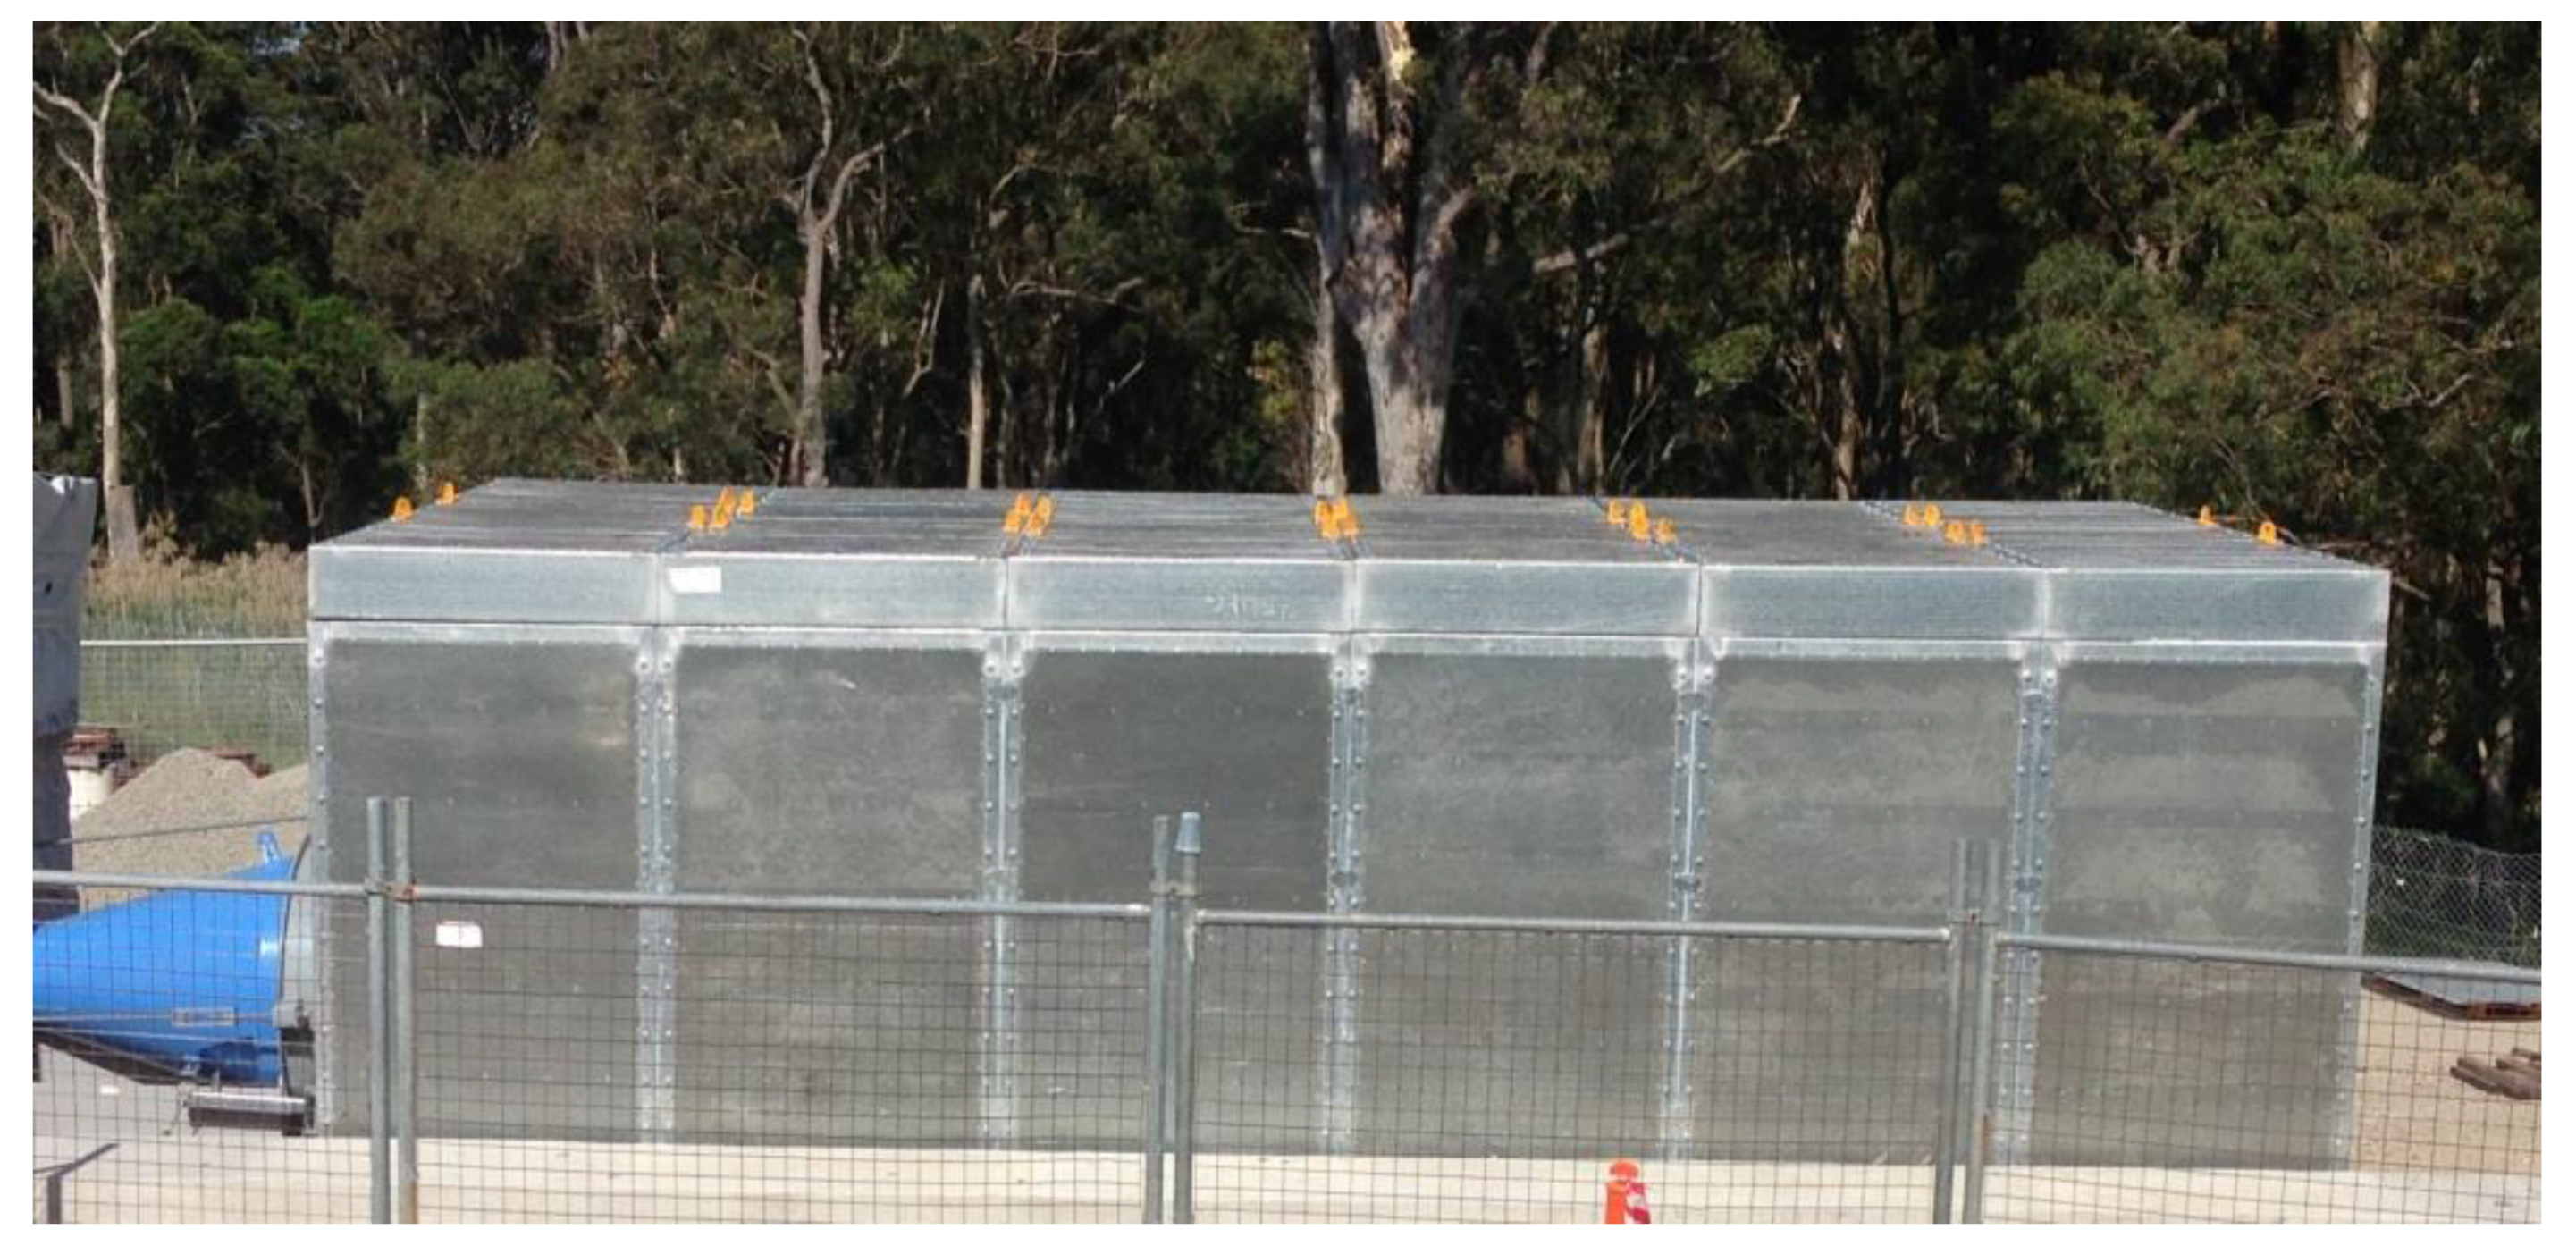
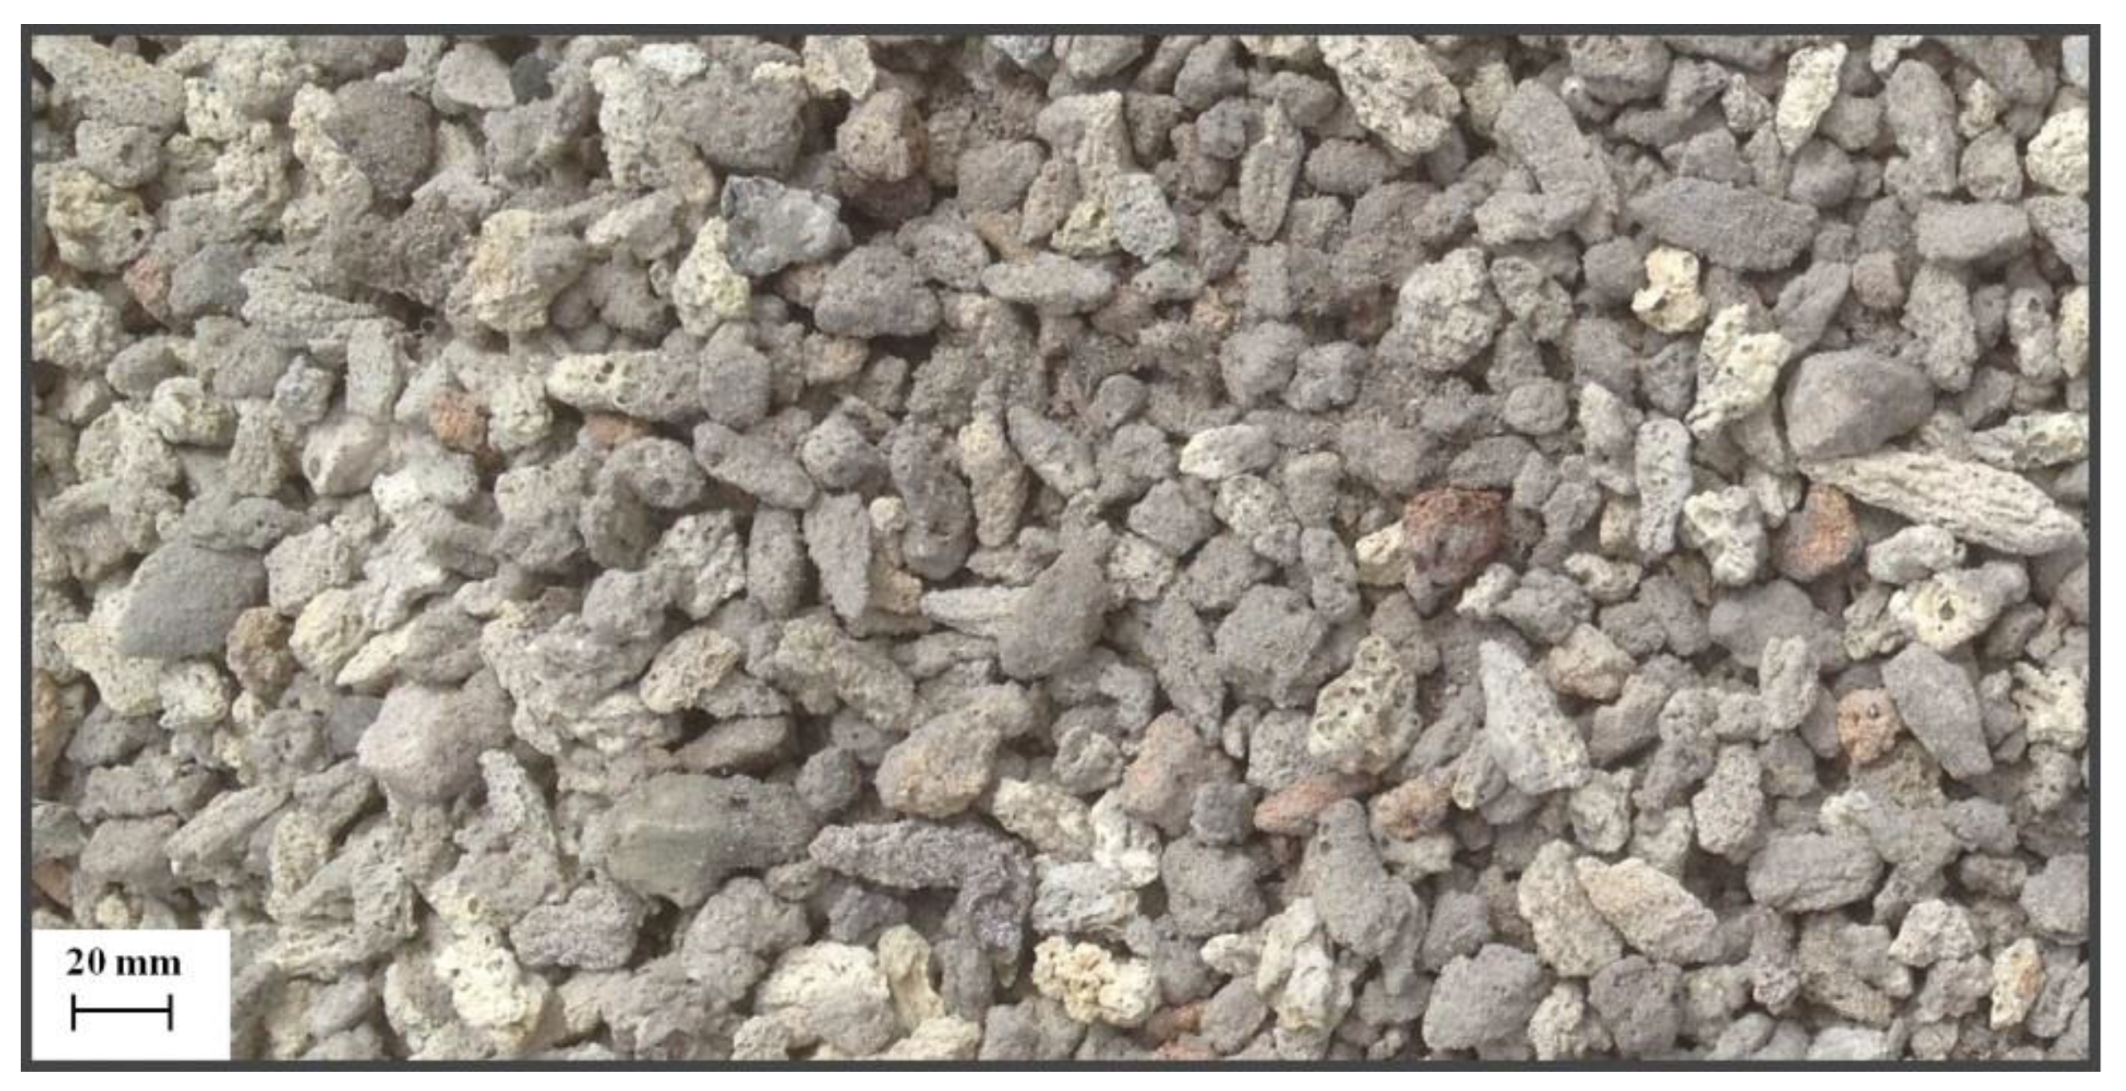
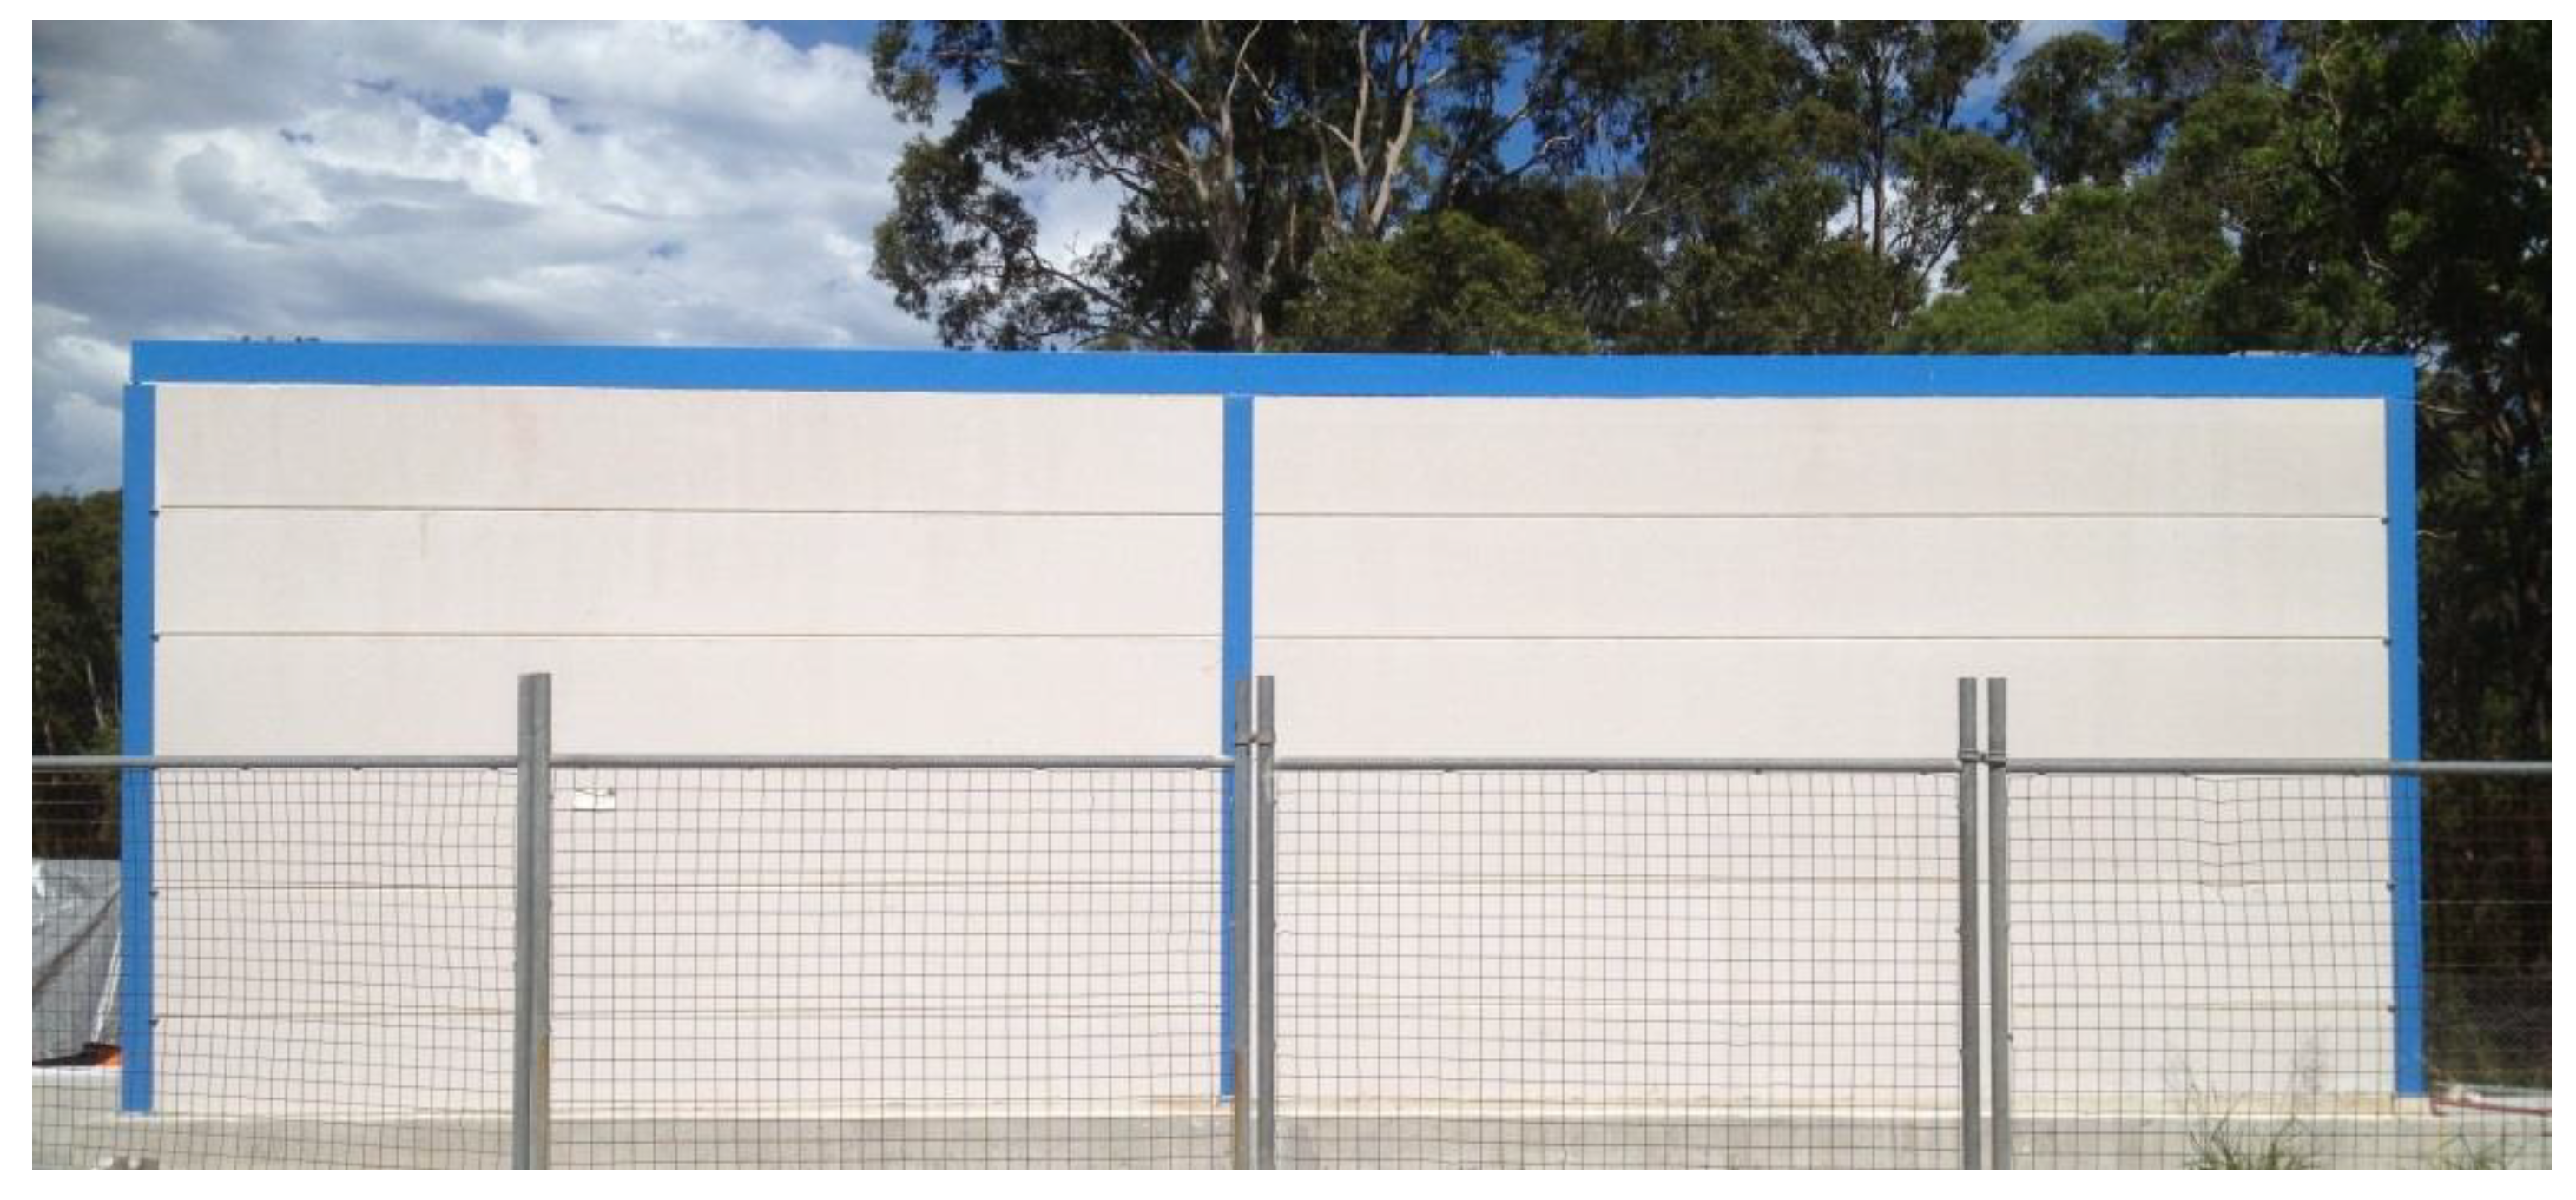
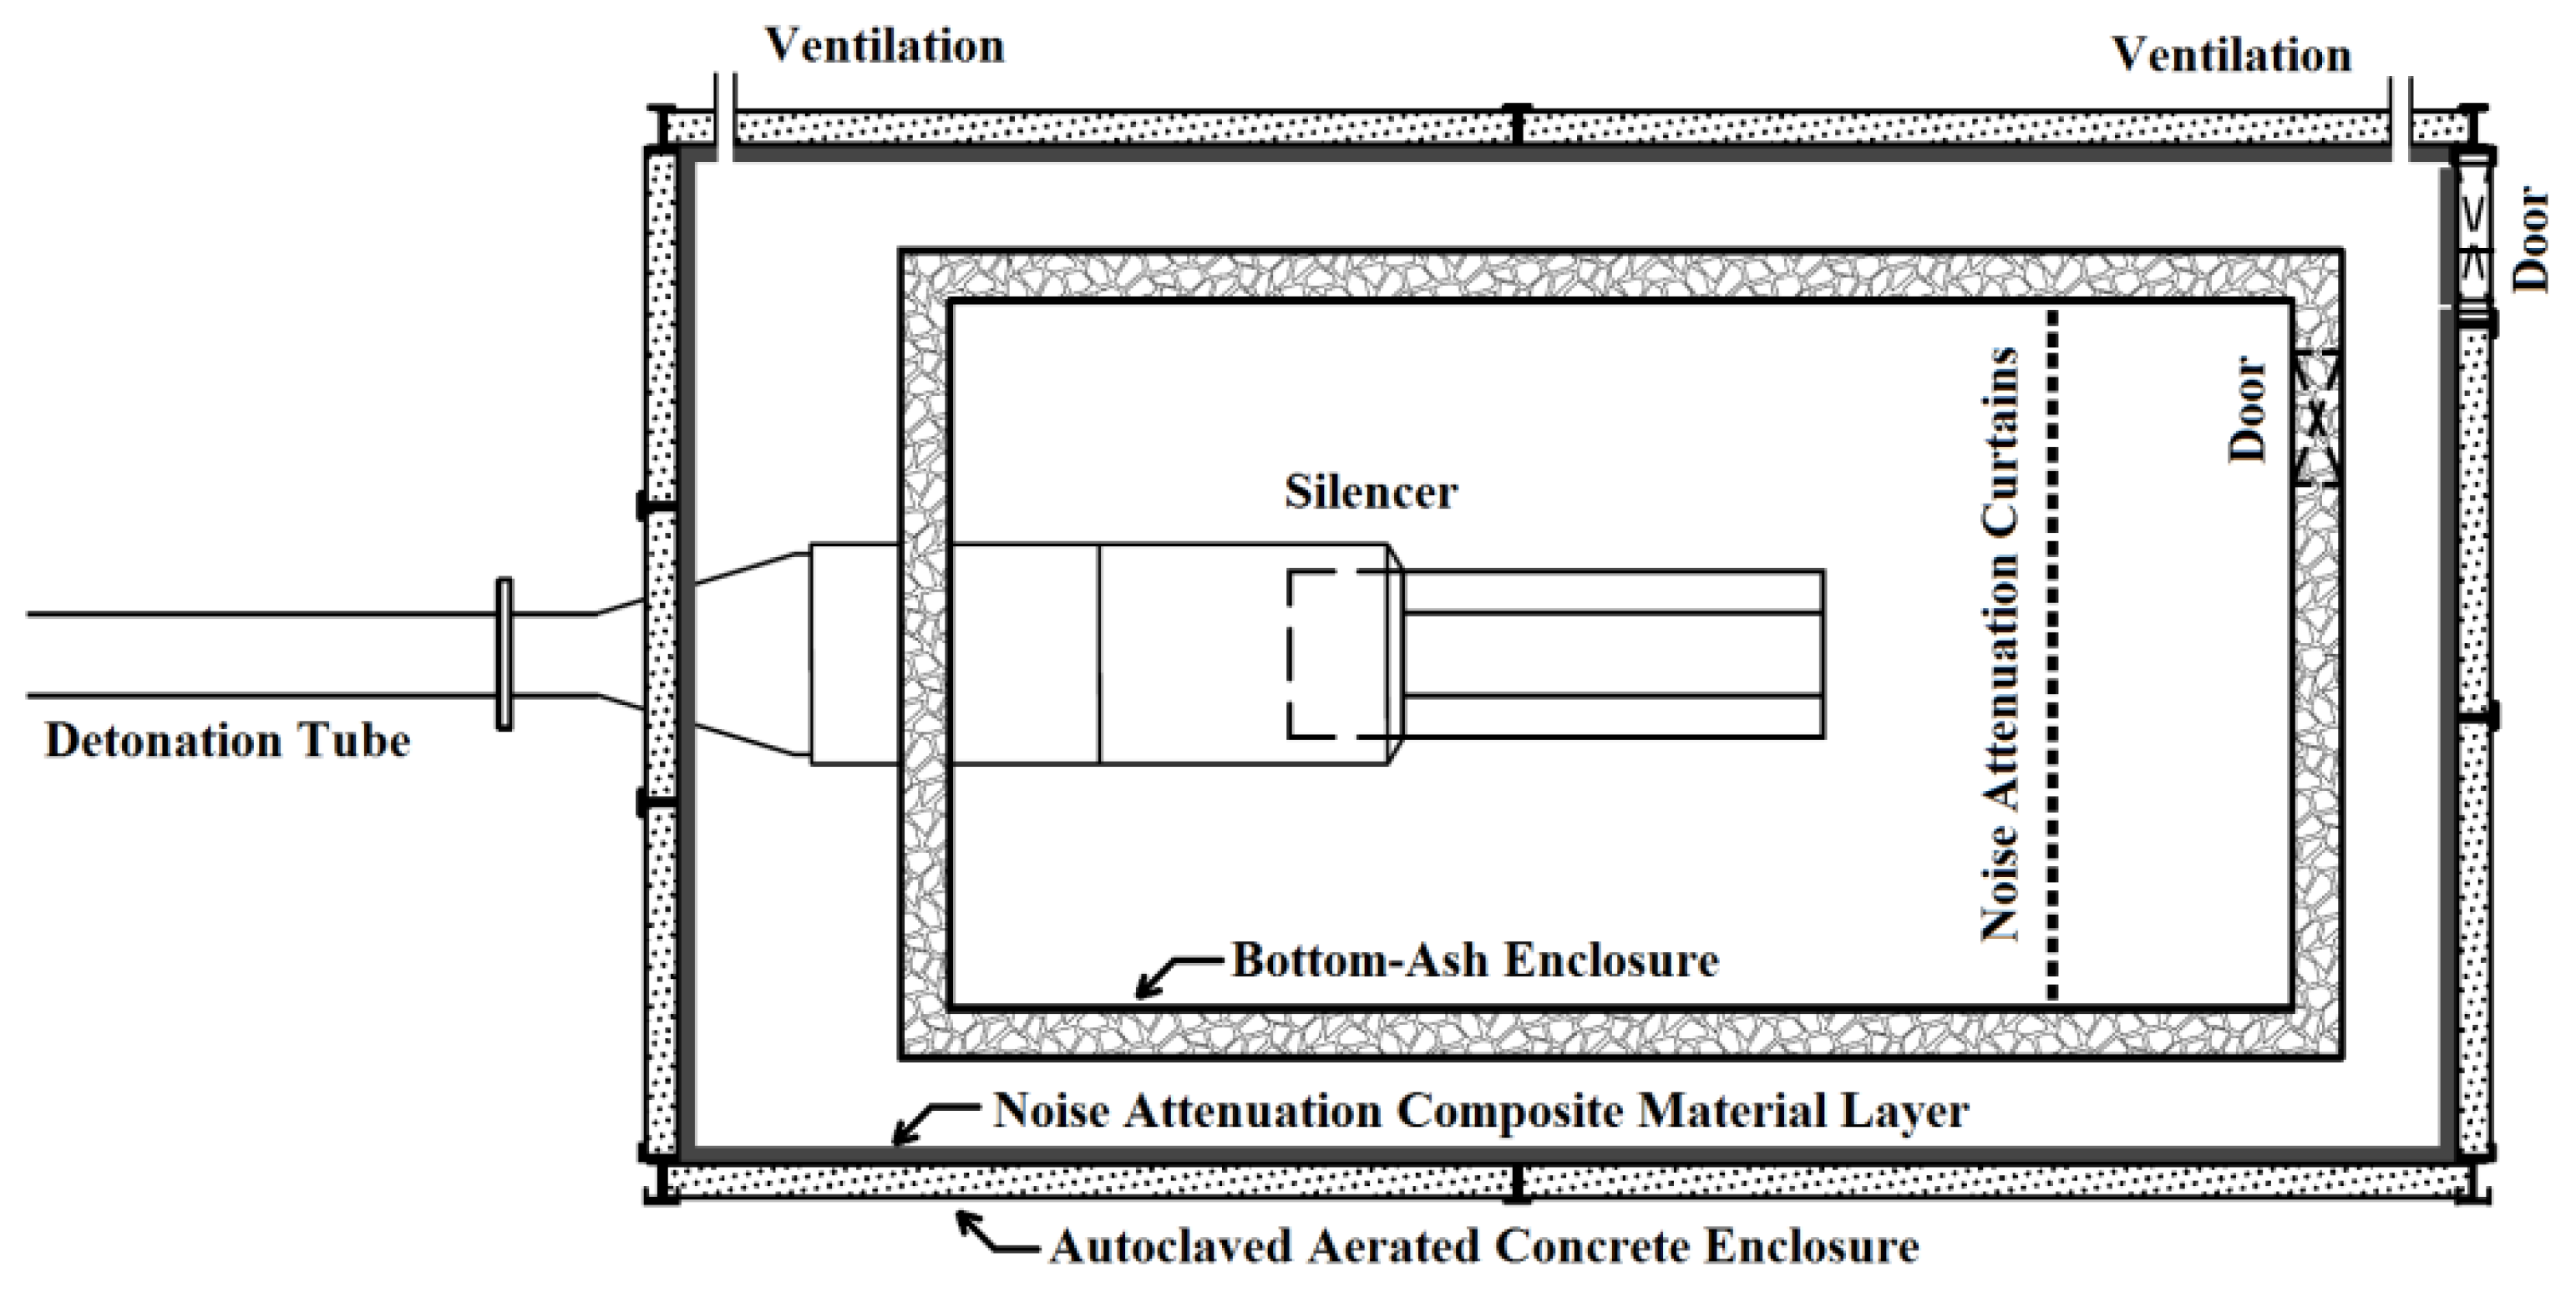
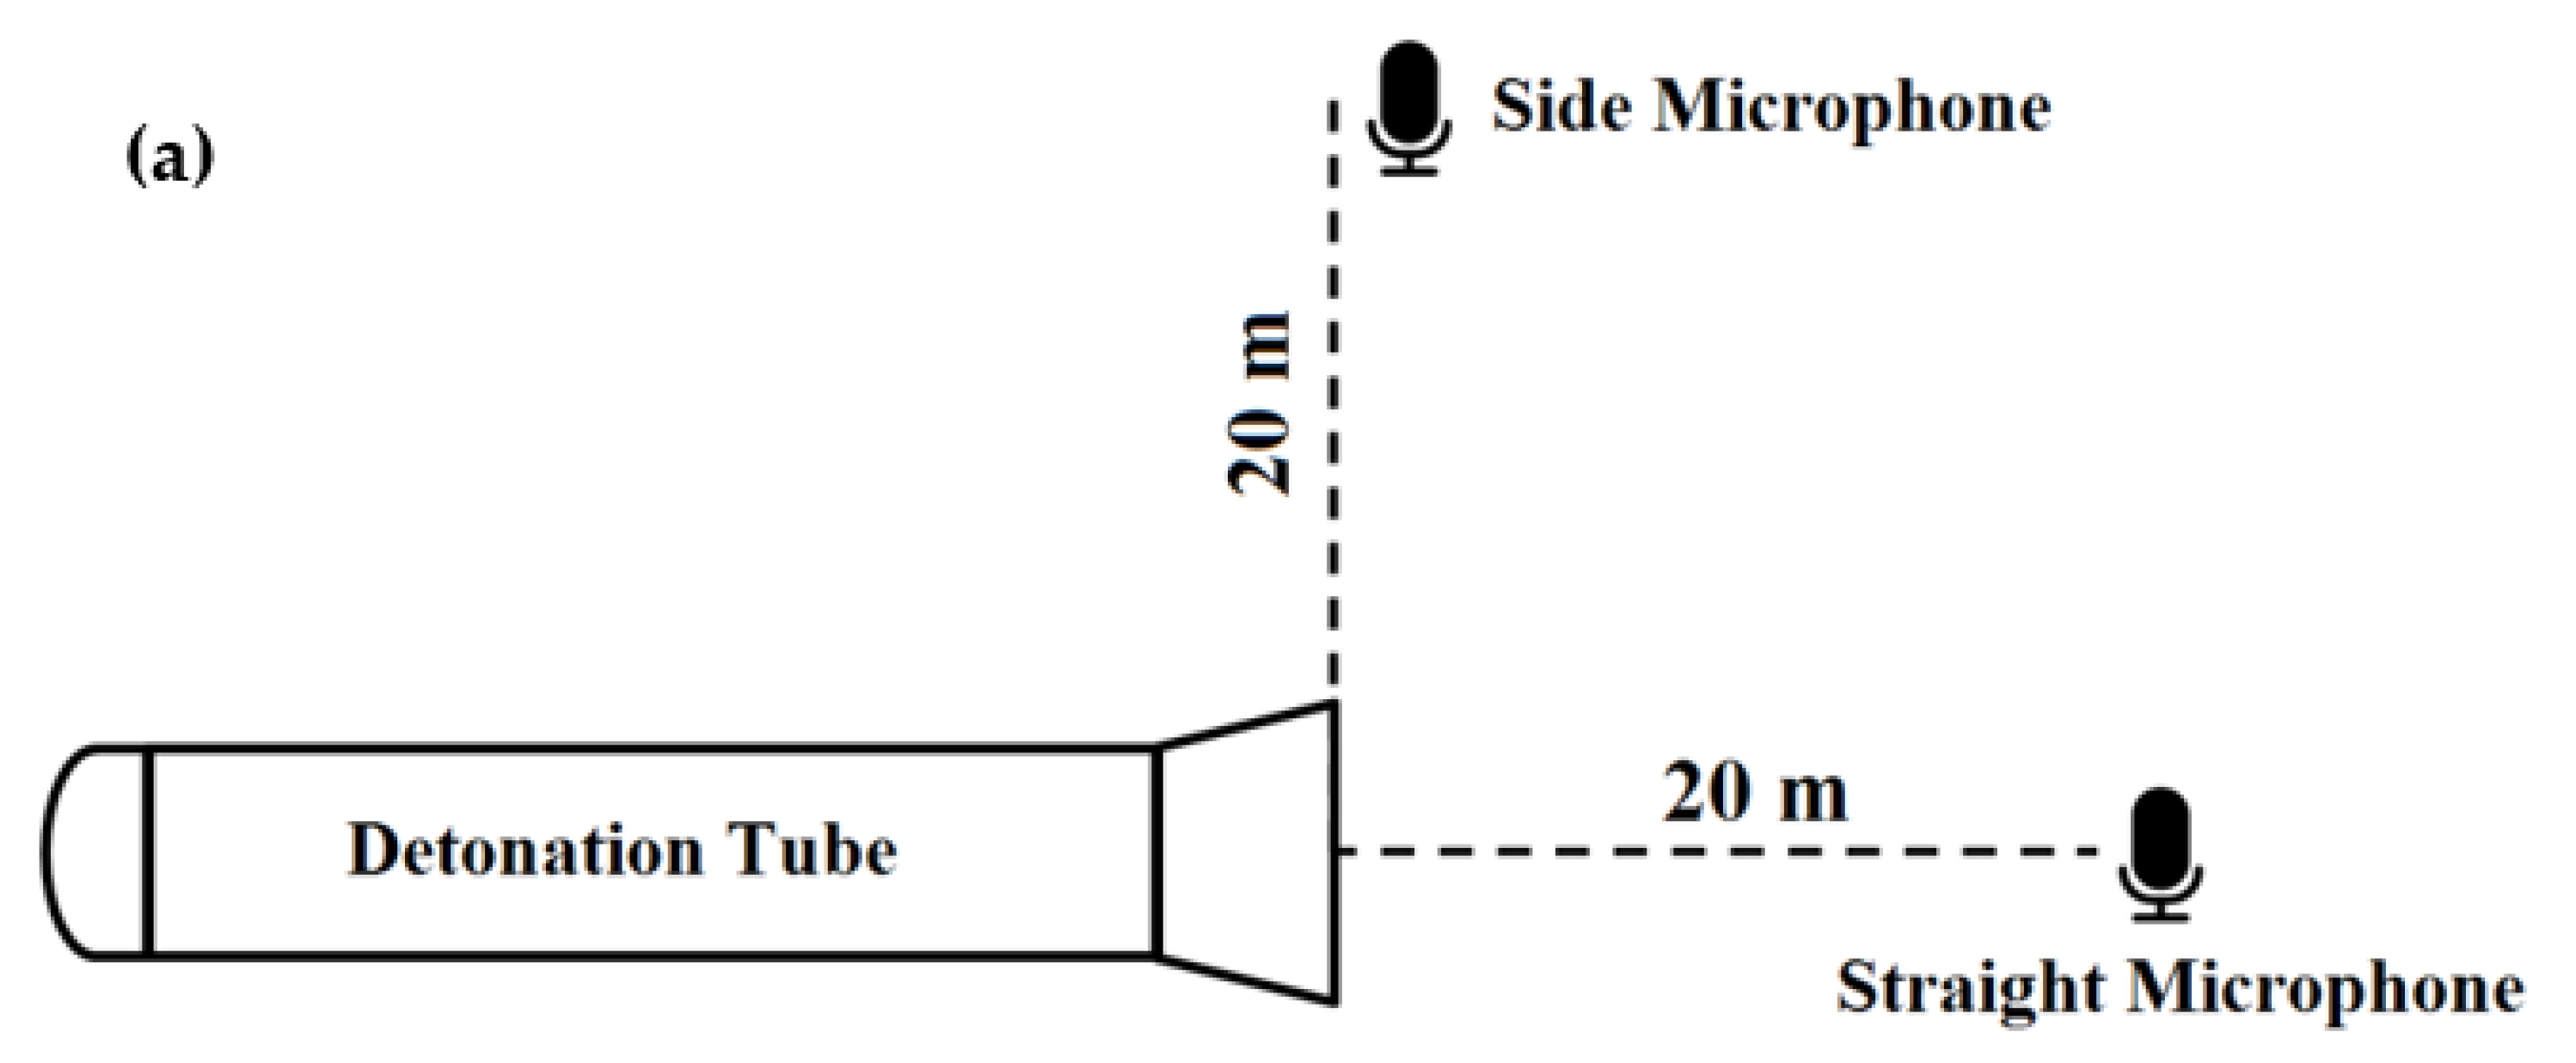
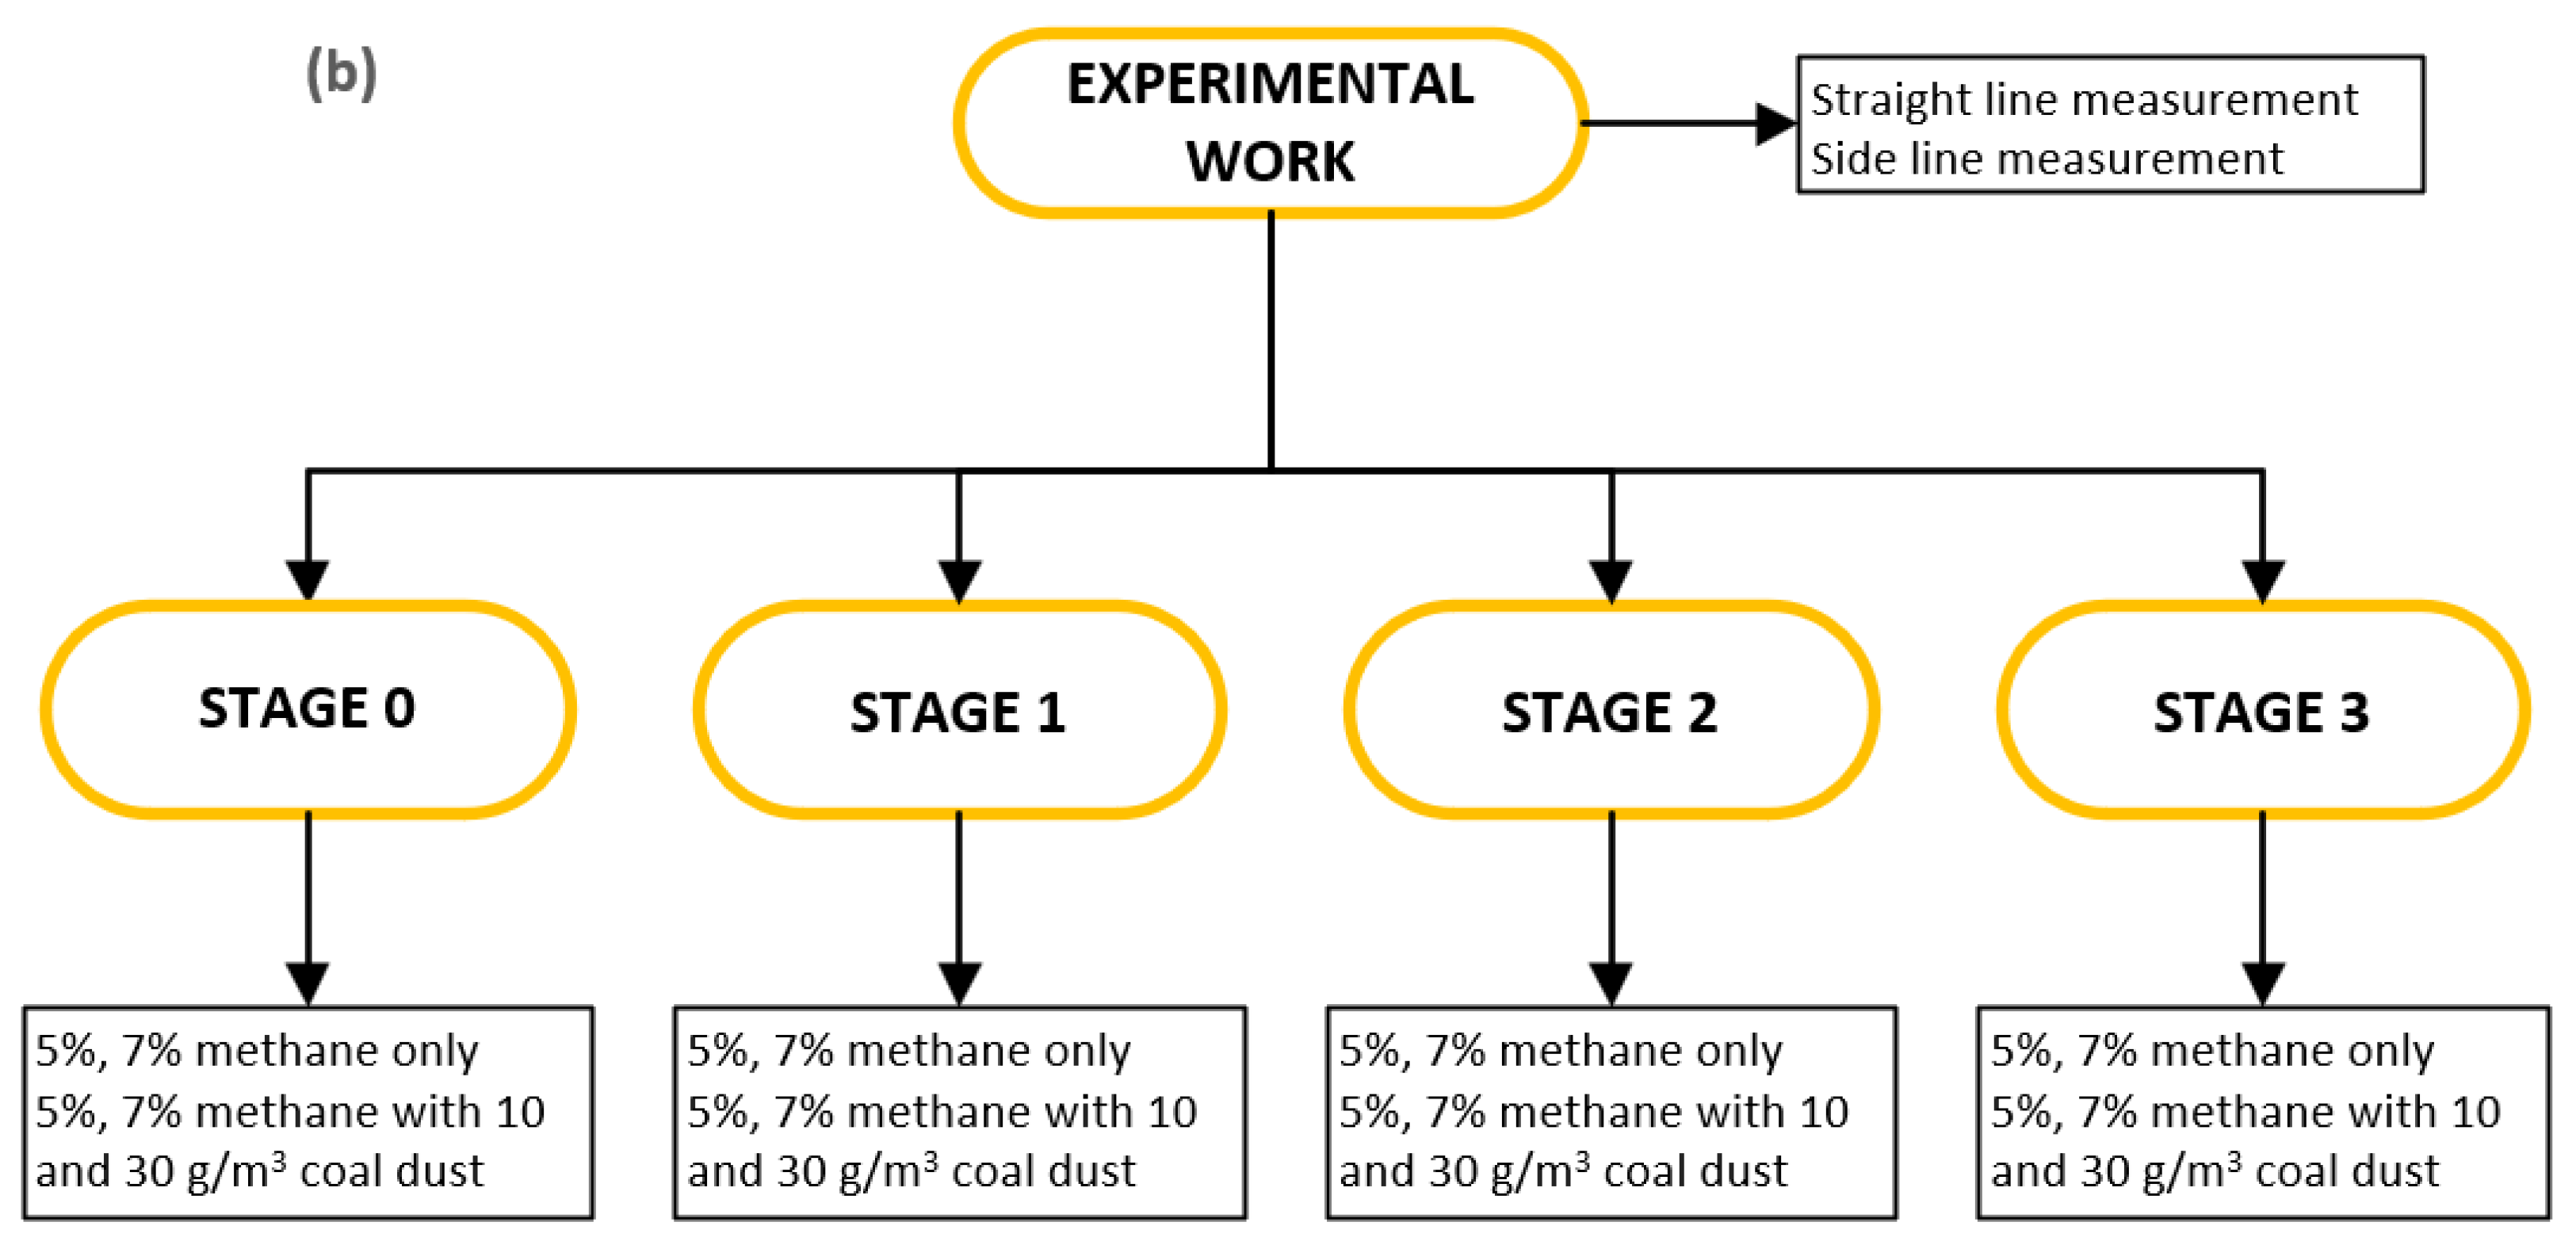
2.1. Experimental Setup

The detonation tube, employed at the University of Newcastle, was of a modular design and consisted of 11 cylindrical modules, attached together with flanges. Each module had three pressure transducers located radially at 120° at the centre of each module length. The first section, termed as the ignition section, was module B1 where 9% methane was employed for ignition. A total of 50 mJ of chemical igniters was employed in this ignition section for the experiments. This section was isolated from the proceeding section, termed the secondary explosion section, by a temporary inflated balloon. The secondary explosion section length was variable, comprised of one or more modules. Similar to module B1, module A2 was comprised of one balloon port and methane injection system. This secondary explosion section was constructed by positioning the A2 module after the B1 module. The section size could be adjusted by moving module A2 to different locations along the length of the tube (e.g., A3, A4, etc.) as can be seen in Figure 2.
One silencer was primarily integrated with the detonation tube as presented in Figure 2. The silencer was made of two parts, joined with a flange. Almost half of the first part contained 100 mm NB (nominal bore) tube bundles. Similarly, almost half of the second part of the silencer contained 75 mm NB tube bundles. This arrangement assisted in the uninterrupted flow through the tubes of the silencer. The noise attenuation material lined the outsides of the tubes in the 75 mm and 100 mm tube bundles.

2.2. Experimental Procedure

A movable ceiling mount noise attenuation curtain set (Figure 3), containing 13 individual curtains, was installed 3.3 m from the silencer end. Each curtain was made from rubber material and had dimensions of 2350 mm × 300 mm × 10 mm. Data collected with the silencer and noise attenuation curtains in this arrangement were designated as Stage 0.
In the next stage, a bottom ash-based enclosure of 300 mm thickness was employed outside the silencer (Figure 4 and Figure 5). A hollow structure, constructed from perforated sheets of 40% open area, was employed in this enclosure and the bottom ash was poured into the hollow structure. The density and porosity of the bottom ash were 700 kg m−3 and 64%, respectively. The bottom ash was sourced from Boral, Australia, and contains mainly mixtures of silica (amorphous), fly ash, aluminium oxide, quartz (crystalline silica) and iron (III) oxide. According to the analysis carried out by NATA, Australia, following the AS 1141.11.1 method, the particle size distribution can be described as a 19 mm sieve: 100%, a 13.2 mm sieve: 68%, a 9.5 mm sieve: 30% and a 6.7 mm sieve: 9%. The curtain set was transferred from the metallic frame to the inside of the enclosure structure at this stage. They were hung from the top of the enclosure structure and the distance between the detonation tube end and the curtain set was reduced from 3.3 m to 1.15 m. The distance from the curtain end to the wall of the enclosure was kept at 1.3 m. The outside dimension of the whole bottom ash structure was 8700 mm (L) × 4902 mm (H) × 3200 mm (W). Data collected after this construction were designated as Stage 1.
An autoclaved aerated concrete (AAC)-based enclosure was built outside of the bottom ash enclosure (Figure 6). The material was sourced from CSR Hebel, Somersby, Australia, and the thickness of the enclosure was 200 mm. The material contains 60–80% calcium silicate hydrate, 20–40% crystalline silica quartz, 10–60% Portland cement and a small amount of additives (<5%). The distances of the AAC walls from the bottom ash walls were: front wall—1350 mm, side walls—650 mm and end wall—700 mm (Figure 7). Four ventilation ducts were employed in the four corners of this enclosure. Data collected after this setup were defined as Stage 2.
A noise attenuation composite material, commercially named Sorberbarrier, was sourced from Pyrotek (Sydney, Australia). This material contains a high mass flexible noise barrier laminated between two layers of polyurethane-based flexible foam. This composite material was attached inside of the AAC enclosure as a 50 mm thick layer. Data collected with this inclusion were described as Stage 3.
In order to record noise level, a SVAN 979 sound level meter (made in Poland, SVANTEK, Warsaw, Poland) was employed in the experiments. The SVAN 979’s frequency range is from 3.15 Hz to 20 kHz, with the total measurement range from 12 dBA Leq to 140 dBA Peak and an accuracy of 0.1 dB.
Figure 8a shows the locations of microphones. One microphone was placed 20 m from the end of the detonation tube in the direction of the flow and this microphone was defined as the straight microphone (Figure 8a). Another microphone was kept 20 m from the end of the detonation tube in the perpendicular direction of the gas flow and was referred to as the side microphone. SvanPC++ software 97x series was employed to analyse the recorded data. Peak noise levels (LApeak, LCpeak and LZpeak) and one-third octave band spectra (in band LAeq) are reported. Figure 8b shows the general experimental work flowchart.
Methane gas (purity—99.95%) and coal dust were sourced from Coregas (Villawood, Australia) and ALS (Brisbane, Australia), respectively. Data collected in the various stages have been plotted and analysed.

3. Results and Discussion

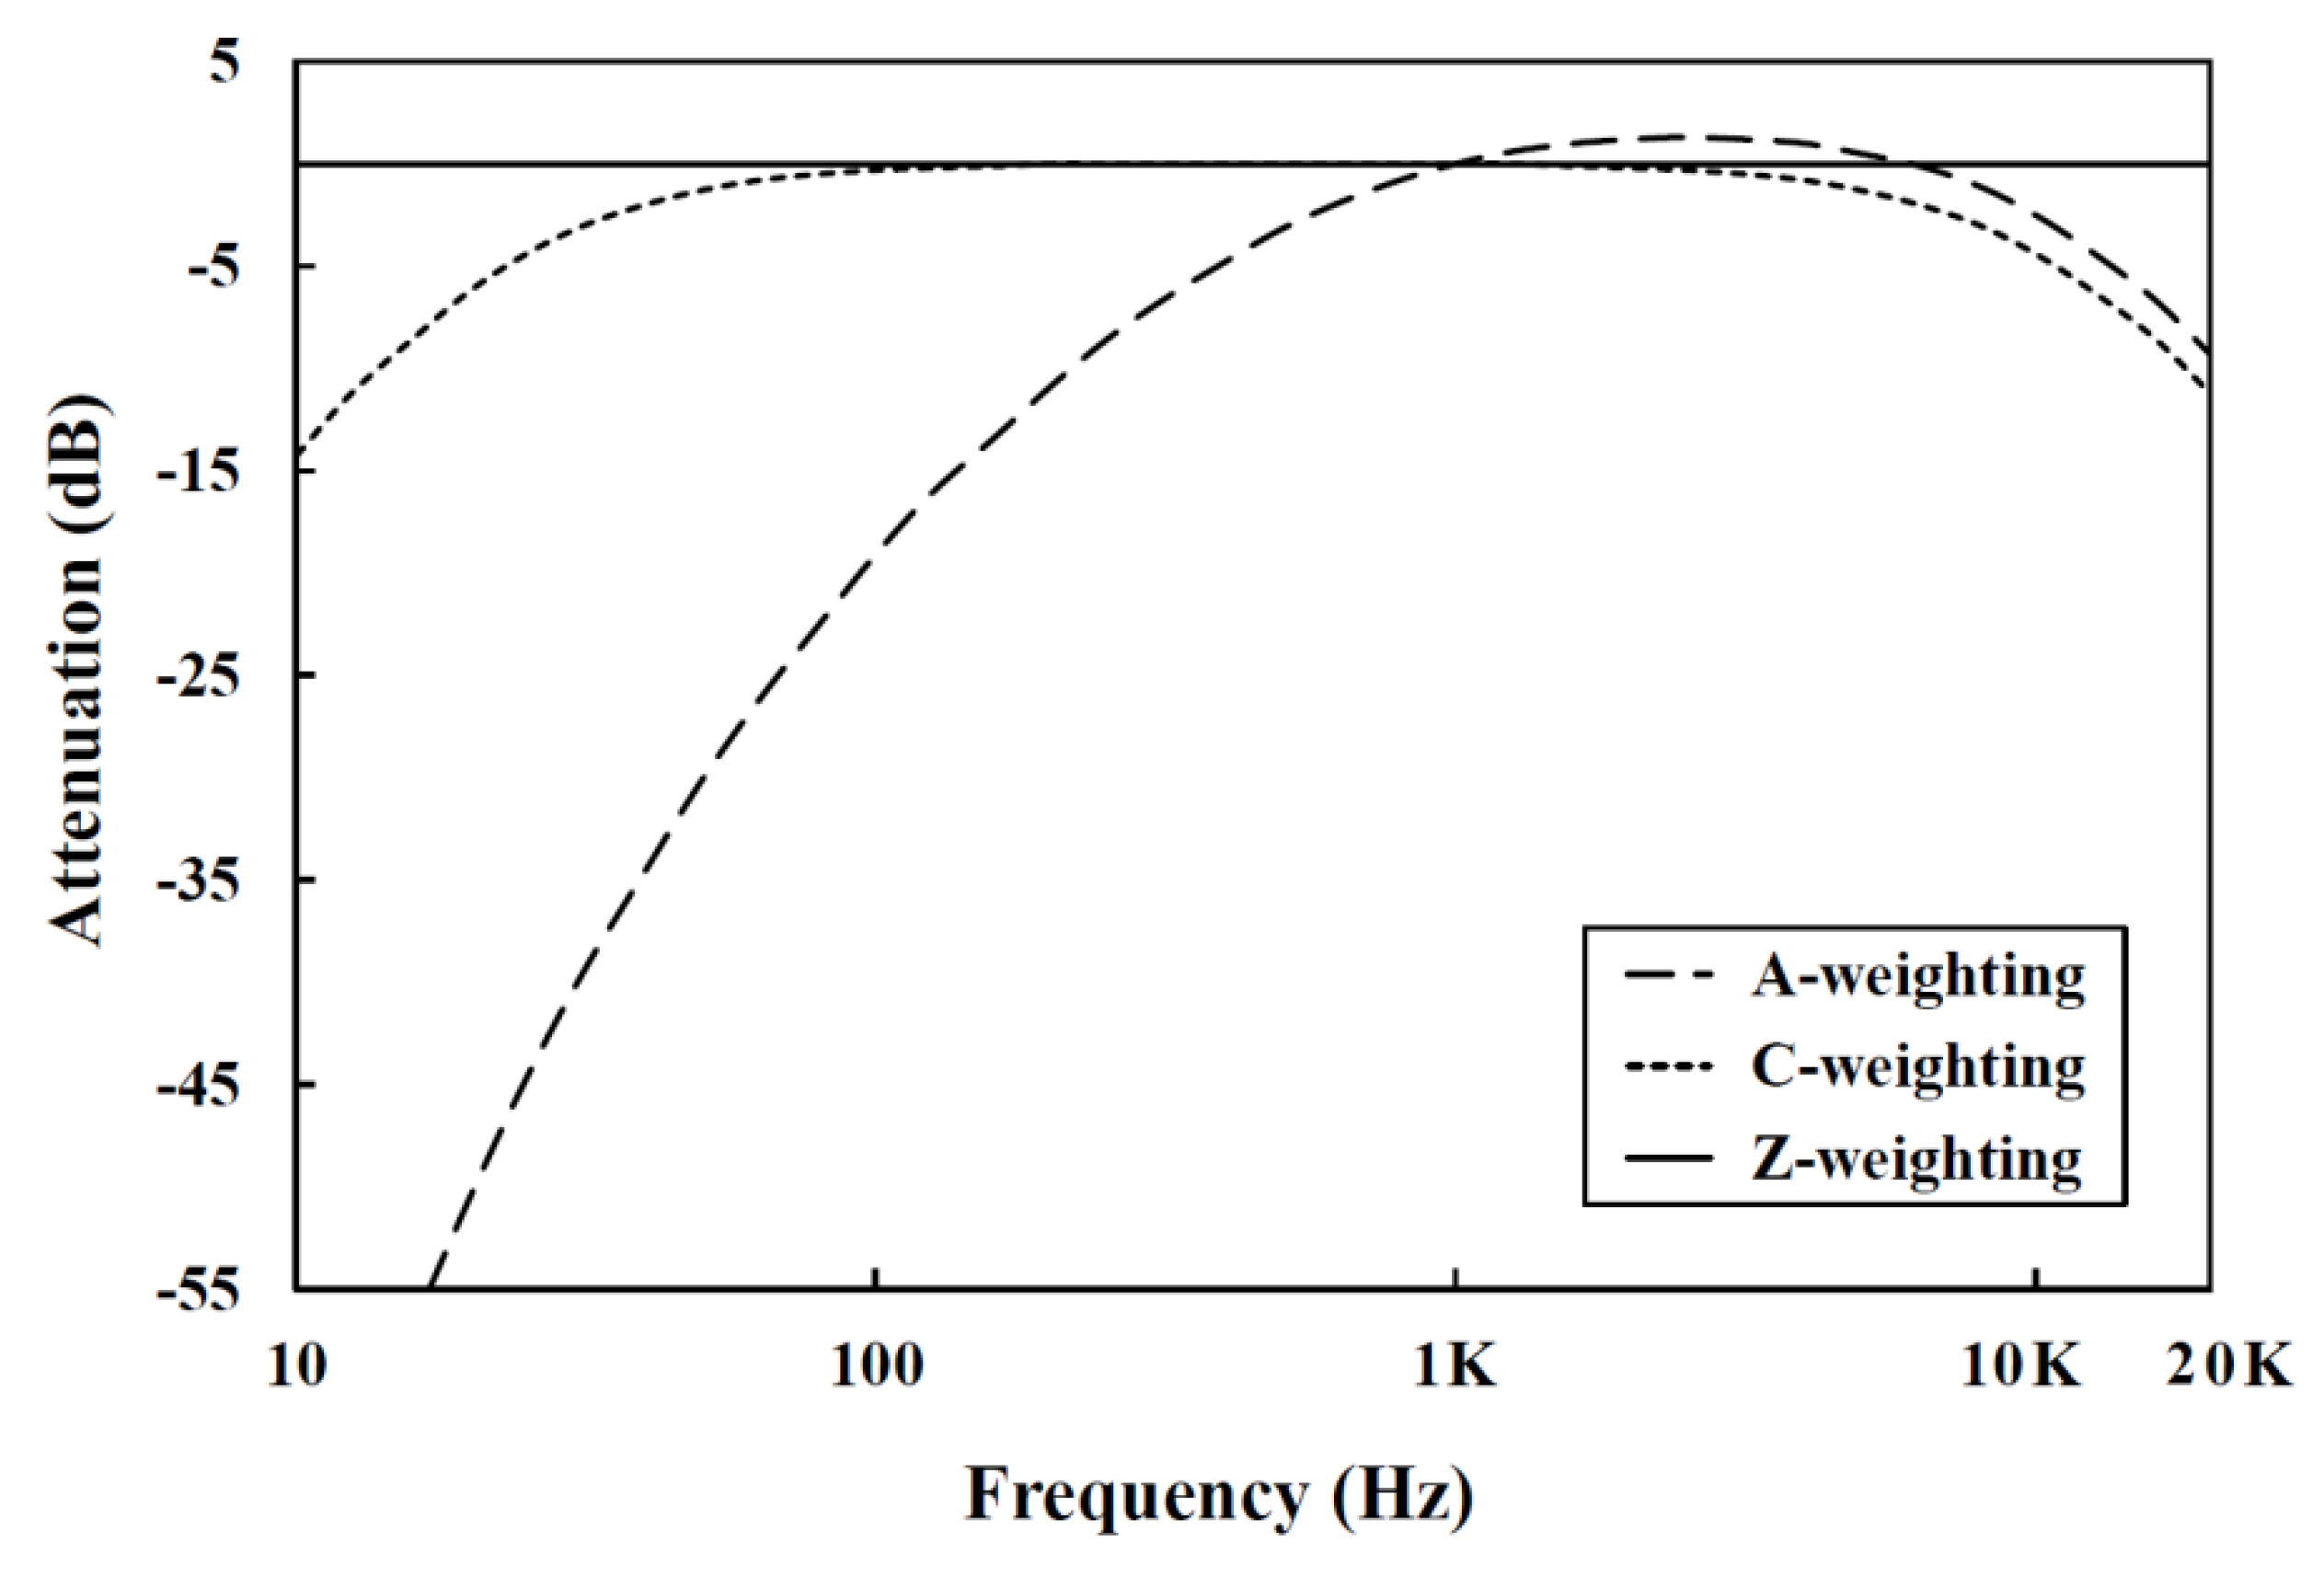
3.1. Attenuation of A-Weighted Noise Level

A-weighted noise levels were measured for various conditions and are reported in this article. As described elsewhere, this measurement replicates a human hearing pattern. Therefore, A-weighted measurements are primarily considered for noise matters.

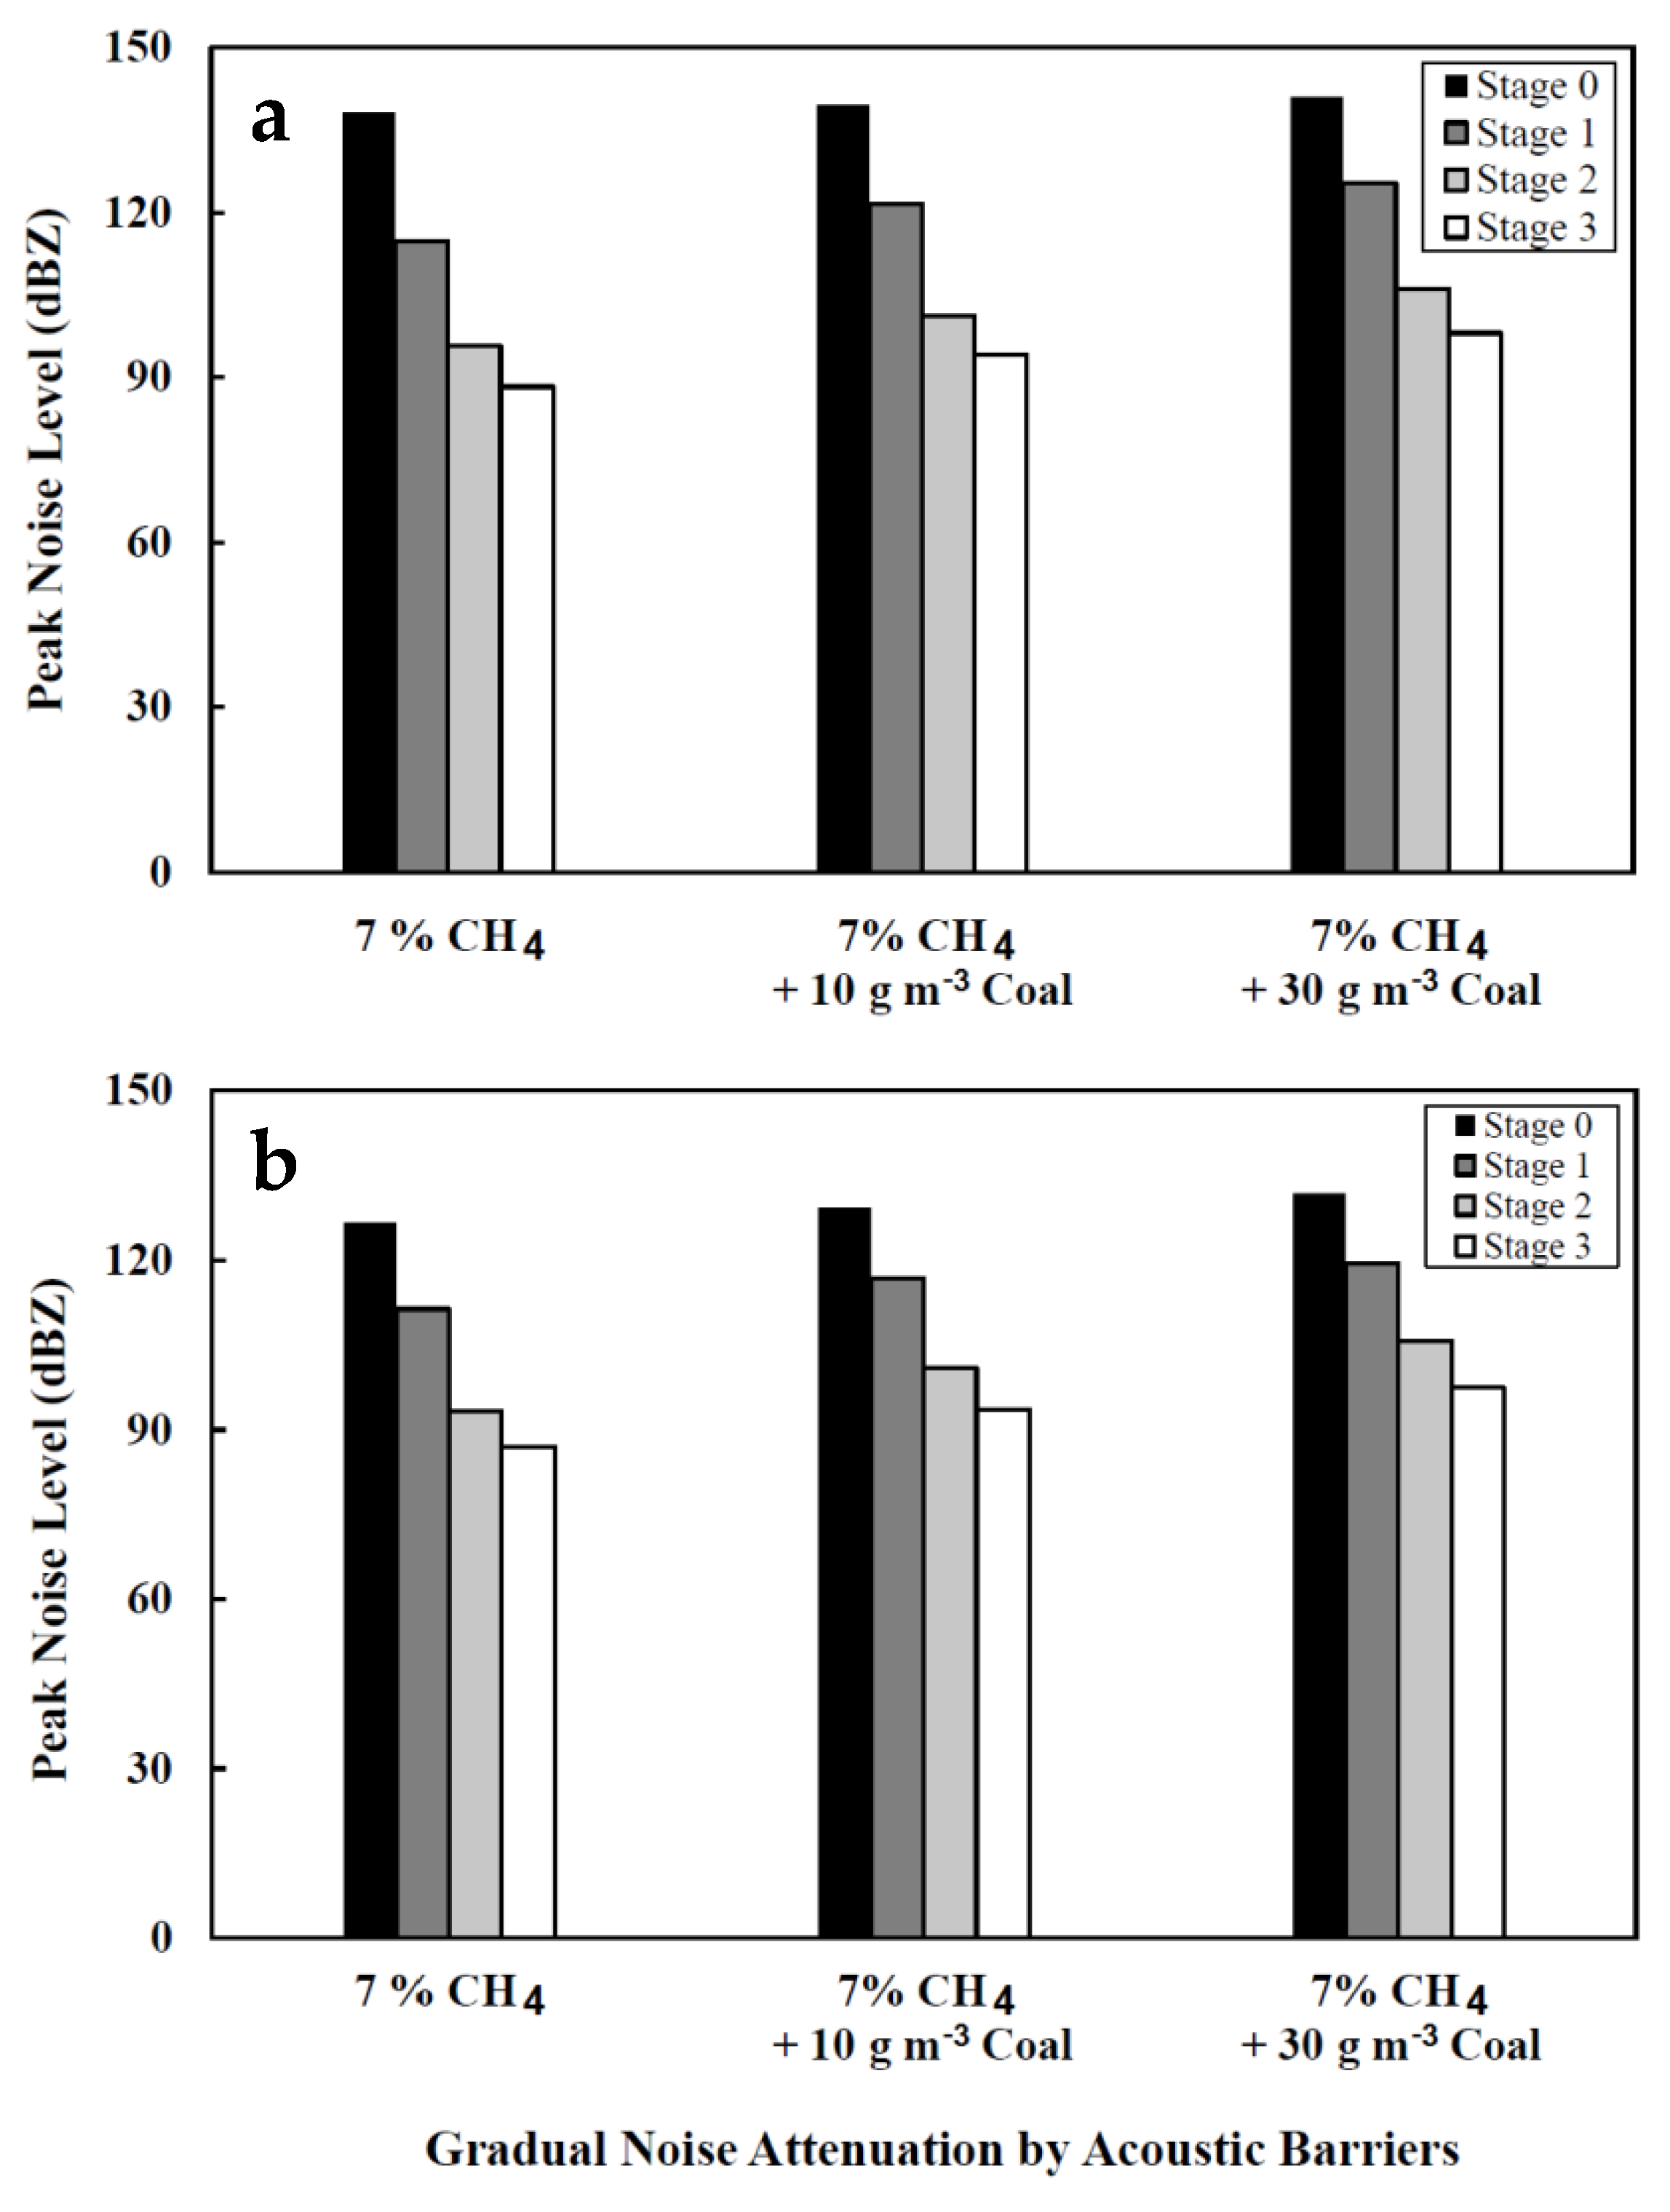
3.1.1. Variation in Methane Concentration

The recorded A-weighted peak noise level (LApeak) from the straight microphone in the explosion test of 5% methane in air at Stage 0 was 115 dBA. The peak noise level rose to 129 dBA when the concentration of methane in the initial mixture was increased to 7%. The introduction of the bottom ash-based acoustic barrier at Stage 1 reduced those noise levels to 91 and 98 dBA for the 5% and 7% methane tests, respectively (see Figure 9). It shows that bottom ash is effective in suppressing explosion noise and the efficiency of bottom ash increases with the increase in the initial noise level. The entire experimental duration, encompassing the initiation of the experiment (ignition of the explosive charge), methane explosion, pressure wave evolution and dissipation, spanned approximately 1.2 s. Sound level meters were activated prior to the commencement of the experimental procedures and deactivated upon completion of the tests. Subsequently, the captured sound data were extracted and subjected to analysis to quantify the noise reduction achieved in each experimental scenario.
The bottom ash enclosure employed in the present study provided a porosity of 64%, and this higher value of porosity assisted in obtaining the effective attenuation of noise levels in the explosion tests.
Investigations at Stage 2 revealed peak noise levels of 69 and 74 dBA for the 5% and 7% methane tests, respectively. Similar to bottom ash, AAC materials showed their effectiveness in suppressing noise. The peak noise levels dropped to 65 and 71 dBA at Stage 3 while conducting investigations with the 5% and 7% methane mixtures. The noise attenuation composite material was therefore effective in the attenuation of noise.
In the perpendicular direction of the gas flow or according to data from the side microphone, the peak noise levels were 108 and 115 dBA at Stage 0 for the explosion tests with 5% and 7% methane, respectively. The peak noise levels dropped to 64 and 70 dBA for the 5% and 7% methane explosion tests at Stage 3. The noise attenuation mechanism therefore efficiently suppressed noise from the explosion tests carried out with 5% and 7% methane.

3.1.2. Variation in Methane Concentration with a Fixed Concentration of Coal Dust

Explosion noise is expected to be higher in the presence of coal dust with the methane–air explosive mixtures. The effect of coal dust on methane explosion has been described in the literature [9,15,46]. Figure 10 is constructed from the explosion data of 5% methane with the 30 g m−3 coal dust and 7% methane with 30 g m−3 coal dust mixtures. The peak noise levels from the straight microphone at Stage 0 were found to be 130 and 136 dBA while conducting explosion tests with the 5% methane plus 30 g m−3 coal dust and 7% methane plus 30 g m−3 coal dust mixtures, respectively. At Stage 3, the peak noise levels reduced to 68 and 81 dBA. According to data from the side microphone, the peak noise levels reduced from 115 to 68 dBA for 5% methane plus 30 g m−3 coal dust and from 120 to 81 dBA for 7% methane plus 30 g m−3 coal dust. This examination shows the attenuation of noise for explosions with a fixed concentration of coal dust while increasing methane concentration. The whole noise suppression mechanism was found to be effective for these tests.

3.1.3. Variation in Coal Dust Concentration with a Fixed Concentration of Methane

The peak noise levels from the explosion tests conducted with a fixed concentration of methane in air with 0, 10 and 30 g m−3 coal dust in the initial explosive mixture were examined (Table 1 and Table 2). The initial peak explosion noise in the direction of the gas flow increased from 129 dBA to 136 dBA (Stage 0) when the initial concentration of coal dust increased from 0 to 30 g m−3 with 7% methane in air (Table 1). The noise suppression values from Stage 0 to 1, Stage 1 to 2 and Stage 2 to 3 were 28–31 dBA, 23–24 dBA and 2–4 dBA, respectively. The three stages of the noise suppression system reduced peak noise levels in the range of 71–81 dBA.
In the perpendicular direction of the gas flow, the peak noise level increased from 115 dBA to 120 dBA (Stage 0) from 0 to 30 g m−3 with 7% methane in air (Table 2). The noise level reduced in the range of 70–81 dBA in Stage 3. The contribution of the bottom ash-based enclosure in the noise suppression was 15–18 dBA, while the AAC enclosure reduced noise by 22–24 dBA. The bottom ash enclosure suppressed less noise than the AAC enclosure in this case. This is because the bottom ash enclosure not only suppressed the noise level but also distributed the flow of the exhaust gas. A broader discussion on the distribution of the gas flow by the bottom ash enclosure can be found in the next section. The noise attenuation composite material suppressed the noise level by 1–3 dBA. From these results, it can be concluded that the noise attenuation system significantly reduced noise levels in all directions from the noise source.

3.1.4. Examination of Noise Reduction in Various Directions

The difference in the peak noise levels recorded by the straight and side microphones at Stage 0 was more than 16 dBA when explosion tests were conducted with 7% methane with 30 g m−3 coal dust (Figure 11). This difference in peak noise levels dropped to 3 dBA at Stage 1. This suggests that the bottom ash enclosure distributes the unidirectional flow of the detonation tube exhaust gases. The effect of the velocity of the burning gases on the velocity of sound decouples as the gases distribute in the enclosure. The difference in the peak noise levels decreased to 1.3 and 0.3 dBA at Stage 2 and Stage 3, respectively. The peak noise level ultimately became almost similar in all directions including the positions of the straight and side microphones.

3.2. Attenuation of C-Weighted Noise Level

When the low-frequency sound components are high, C-weighting provides better attenuation than A-weighting. In a later section, explosion noises generated in the experiments are analysed by one-third octave band frequencies. The analyses show that the explosion noise contained a significant portion of low-frequency components. The following discussion on the attenuation of the C-weighted noise level by each acoustic barrier is therefore helpful in assessing the reduction in the listener’s annoyance level.
Figure 12 presents the attenuations of the C-weighted noise levels by various acoustic barriers. In the direction of the gas flow, the bottom ash-based barrier reduced noise by 25 dBC noise in the 7% methane experiment. In contrast, the AAC barrier and composite material suppressed noise by 21 and 8 dBC, respectively. In the perpendicular direction of the gas flow, the reductions in noise level by the bottom ash enclosure, the AAC enclosure and the composite material were 17, 18 and 8 dBC, respectively. The poroelasticity of the bottom ash and micropores of the AAC enclosure assisted greatly in the noise reduction.
In the presence of coal dust, the initial peak noise levels were found to be higher than the experiments with no coal dust. However, the noise attenuation system handled the additional noise level well and reduced those levels significantly. For the 7% methane with 10 g m−3 coal dust experiment, the peak noise level reduced from 139 to 88 dBC in the direction of the gas flow and from 128 to 88 dBC in the perpendicular direction of the gas flow. When conducting the experiments with 7% methane plus 30 g m−3 coal dust in the initial explosive mixture, the peak noise level reduced from 141 to 93 dBC in the direction of the gas flow and from 131 to 93 dBC in the perpendicular direction of the gas flow.

3.3. Attenuation of Z-Weighted Noise Level

Z-weighted sound measurement is often helpful in scientific analysis and engineering design as the sound pressure levels are not weighted in this measurement. With the intention of presenting data for the wider audience, Figure 13 is constructed with Z-weighted noise levels. The overall attenuation of the noise level by the acoustic barriers can be understood by analysing the Z-weighted sound level. As can be seen from Figure 13, the peak noise levels were 138, 140 and 141 dBZ in the direction of the gas flow when the explosion tests were conducted with 7% methane and 0, 10 and 30 g m−3 coal dust, respectively. These noise levels dropped to 88, 94 and 98 dBZ, respectively, at Stage 3. The corresponding peak noise levels in the perpendicular direction of the gas flow were 127, 129 and 132 dBZ at Stage 0 and 87, 94 and 97 dBZ at Stage 3.
According to the OSHA guidelines, the limit of impulsive noise is 140 dB [47]. The highest Z-weighted noise level at Stage 3, presented in Figure 13, was 98 dBZ. This is much lower than the OSHA guided noise limit. The highest expected noise level is from stoichiometric methane–air mixtures (a separate section is provided next for the stoichiometric methane–air tests). Even for the stoichiometric methane–air mixture with 30 g m−3 coal dust, the attenuated Z-weighted noise level at Stage 3 was 107 dBZ, which is also lower than the OSHA guidelines. This noise attenuation mechanism may therefore be viewed as a successful engineering solution for noise mitigation in industries.

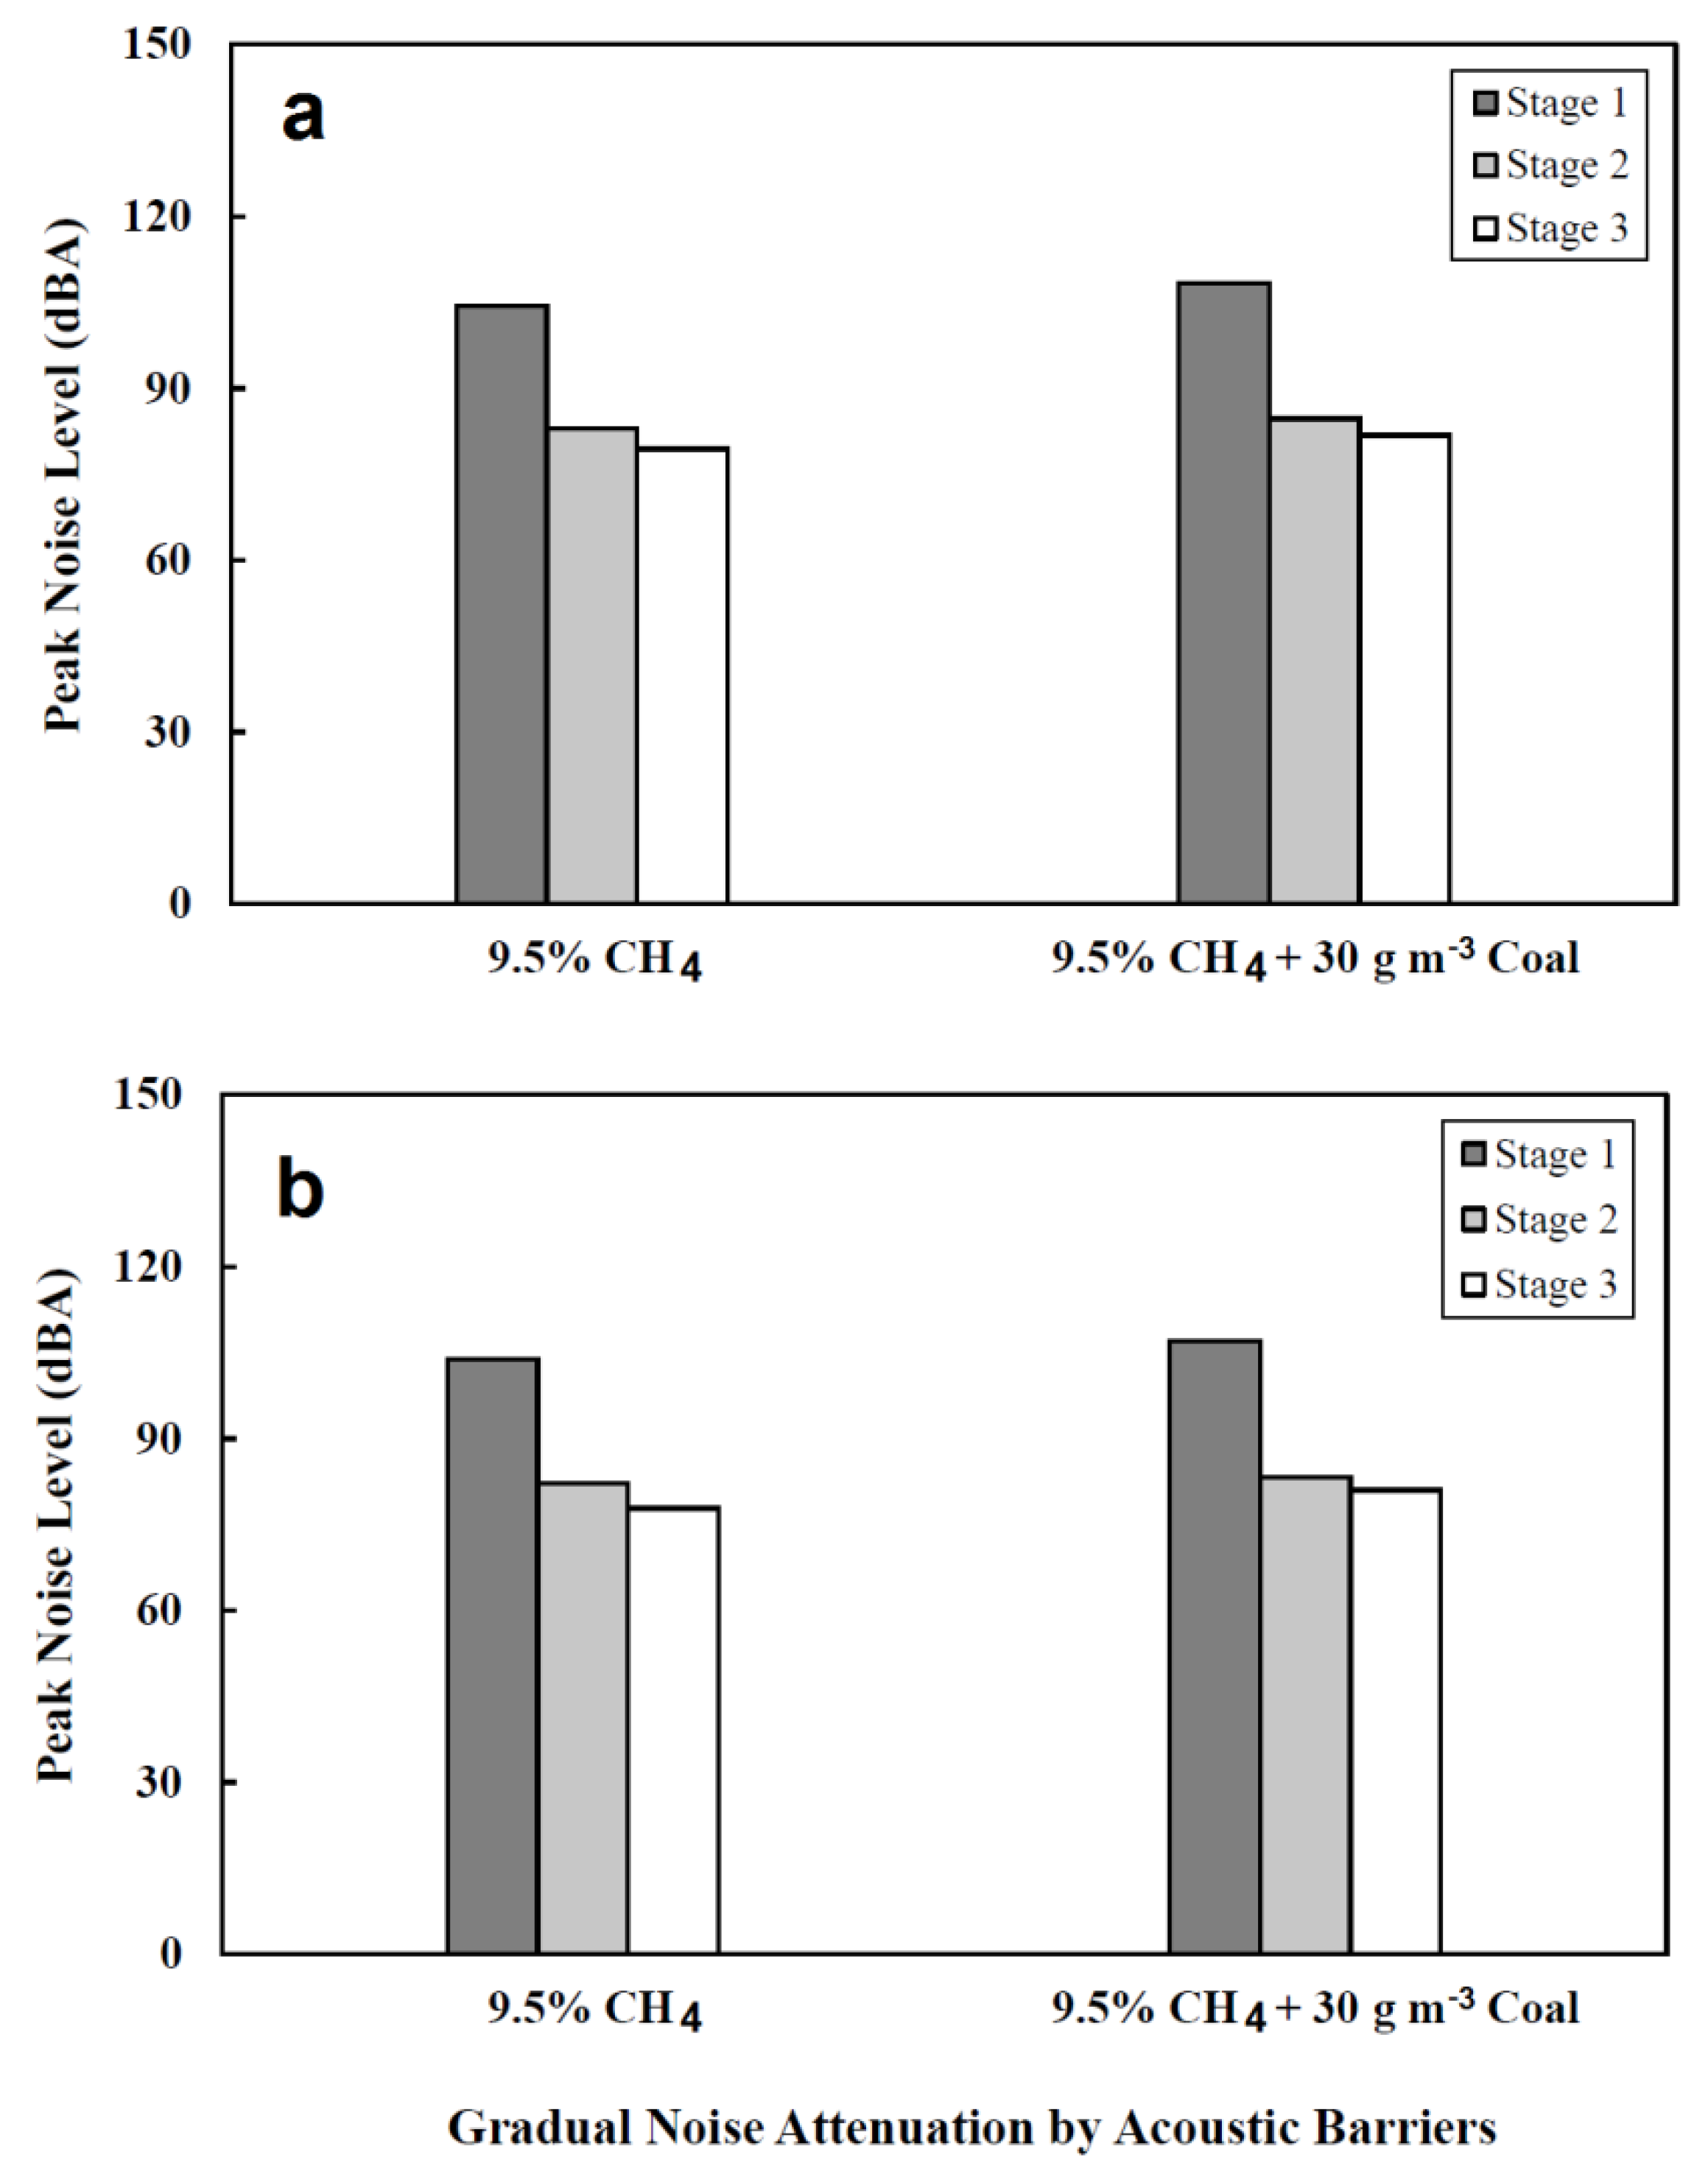
3.4. Noise Attenuation for the Stoichiometric Methane–Air Mixture Tests

The explosion pressure rise depends on the concentration of the methane in the methane–air explosive mixture. Previous studies have shown that the stoichiometric methane–air mixture (9.5% methane in air) produces the highest pressure rise [48,49]. Therefore, the highest explosion noise is expected from the stoichiometric methane–air mixture. At Stage 0, stoichiometric methane–air experiments were not completed as the explosion noise levels with 7% methane with 30 g m−3 were already high (136 dBA). This noise level is already very high and led to the explosion tests with stoichiometric methane–air mixtures not being completed, and therefore, no sound data are available for the stoichiometric methane–air mixture explosion tests at Stage 0. With the aim of exploring the effectiveness of the noise attenuation mechanism integrated with the detonation tube, explosion tests were conducted with stoichiometric methane–air mixtures from Stage 1 to Stage 3 and the obtained data are plotted in Figure 14. It was found that the peak noise level reduced from 104 dBA to 79 dBA (Stage 0 to Stage 3) when the tests were conducted with a stoichiometric methane–air mixture.
The efficacy of the noise attenuation mechanism was investigated further by adding coal dust with a stoichiometric methane–air mixture. The peak noise values were found to be reduced from 108 dBA to 82 dBA (Stage 0 to Stage 3). These values meet the OSHA requirement of A-weighted random noise level (115 dBA for a short period of exposure) [47]. This outcome therefore establishes the described noise attenuation mechanism as an exemplary method for industrial noise problems.

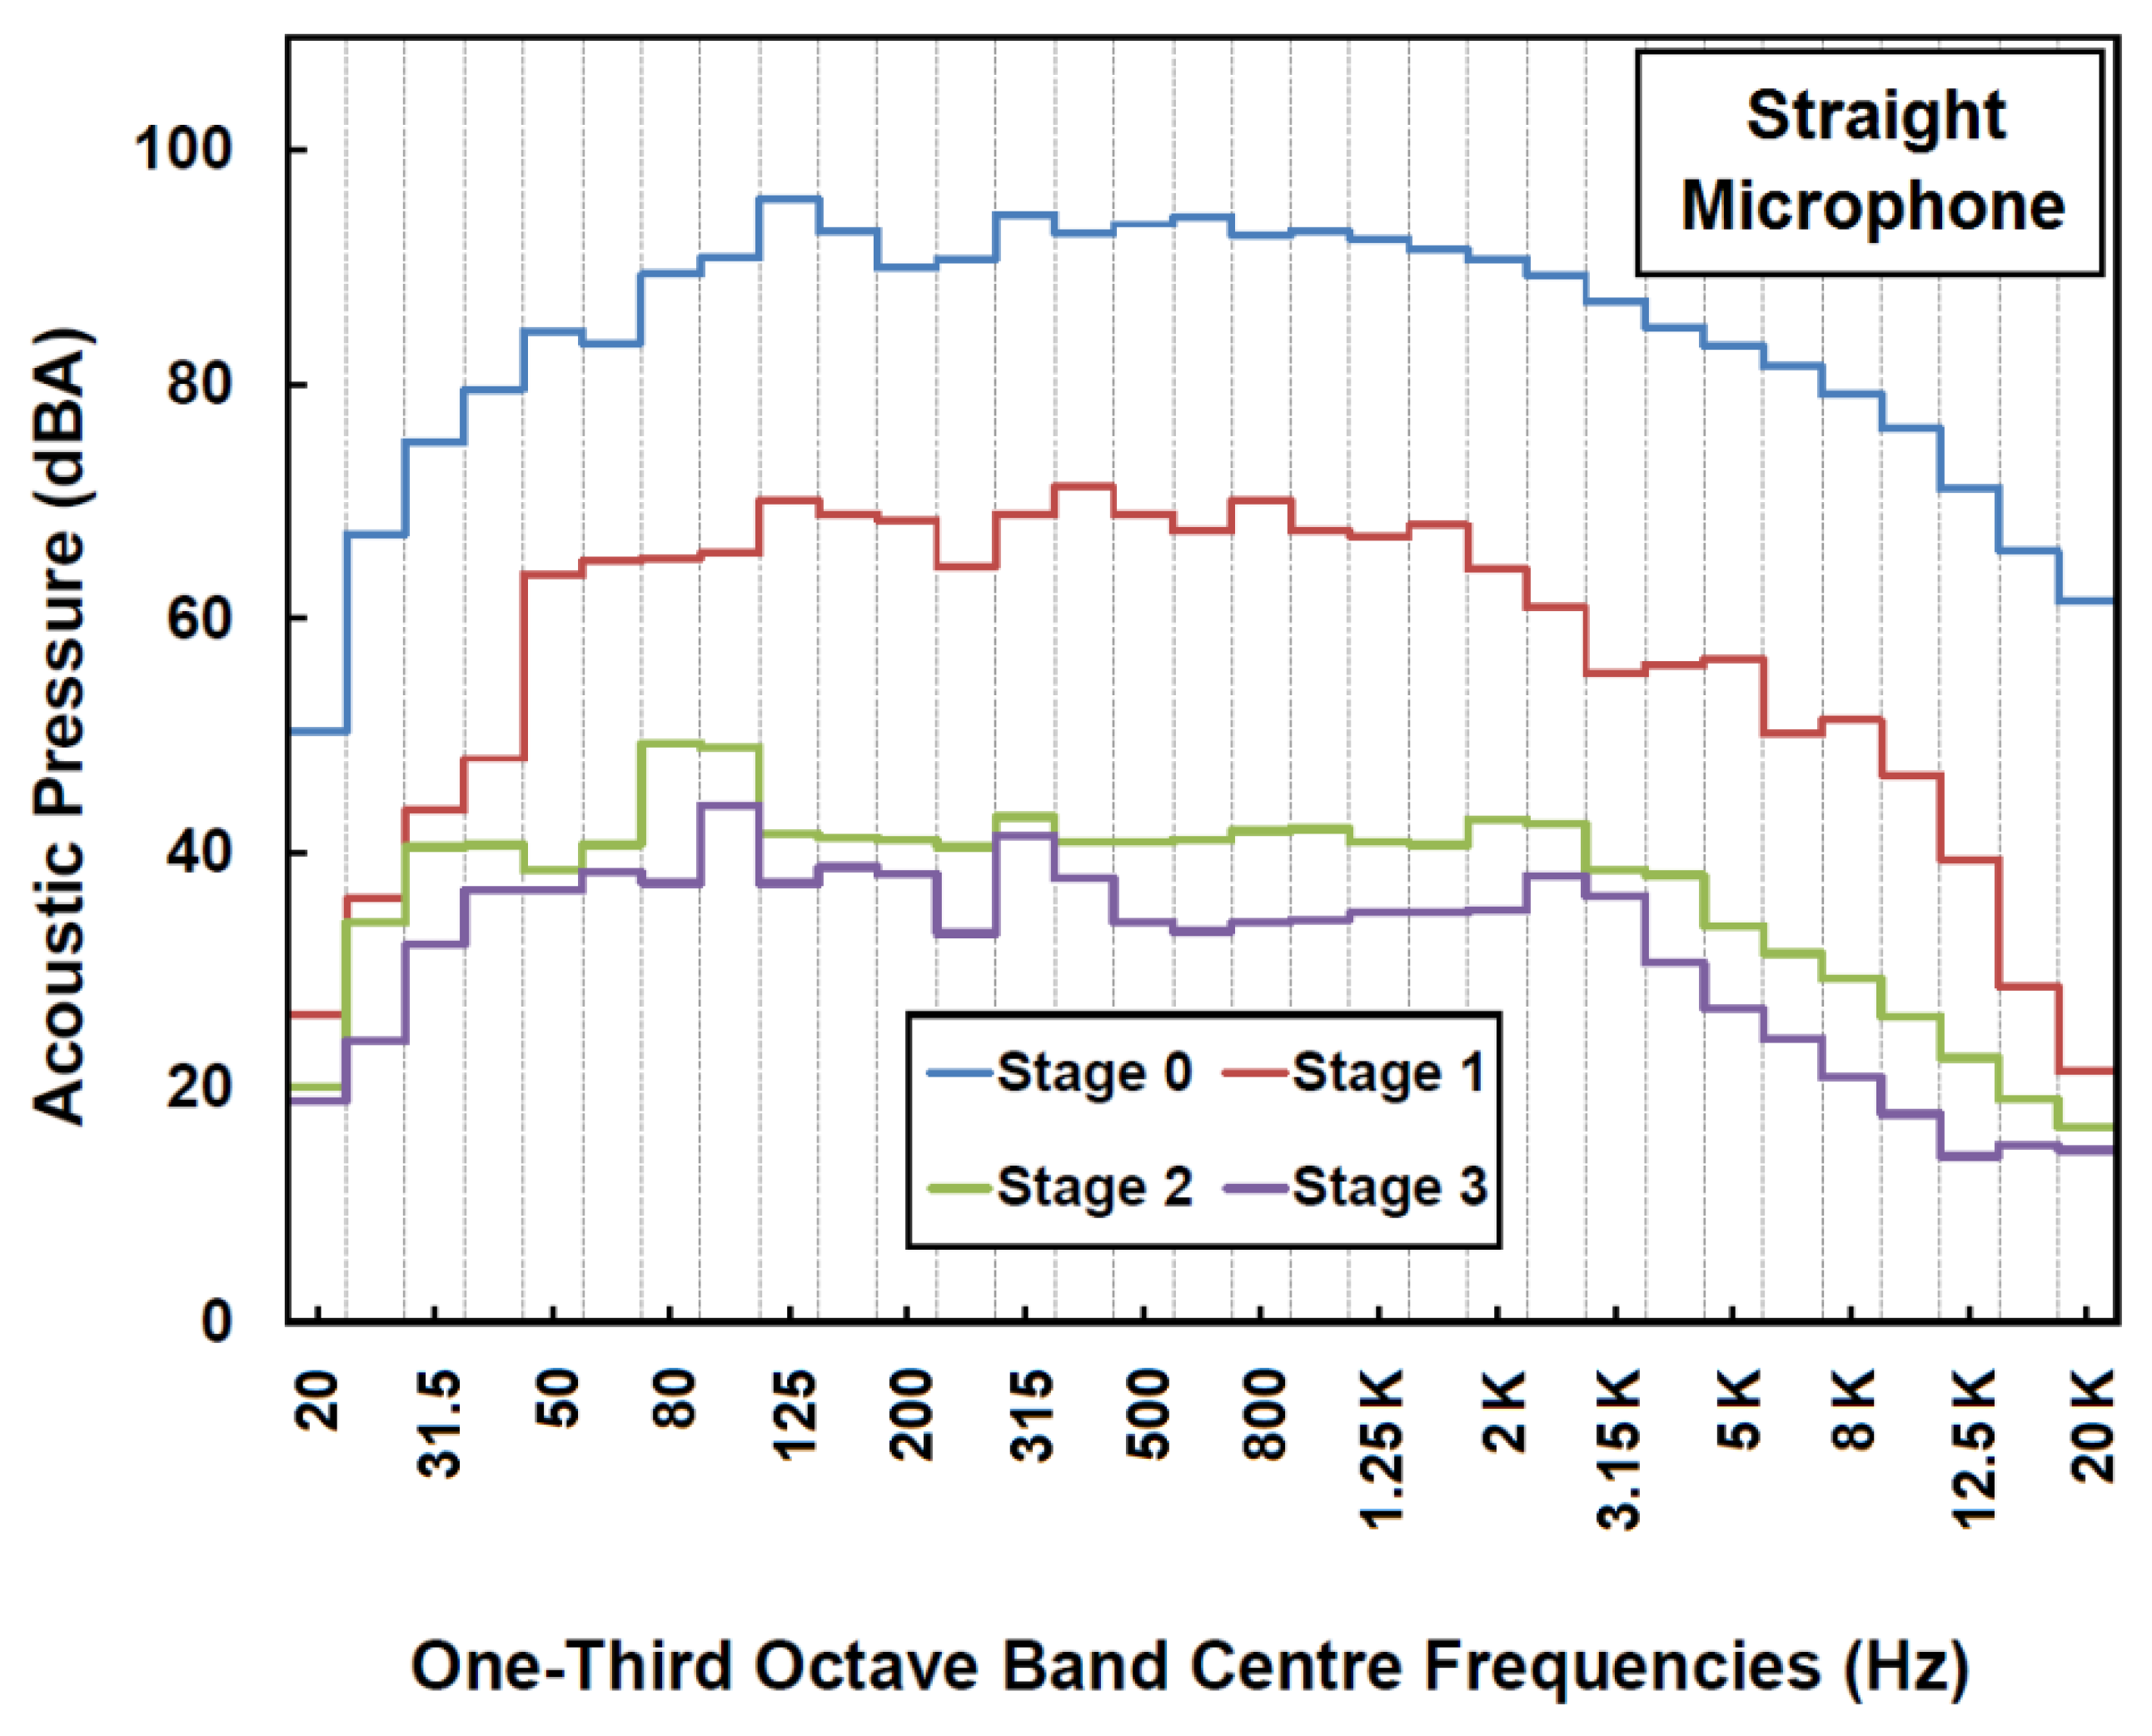
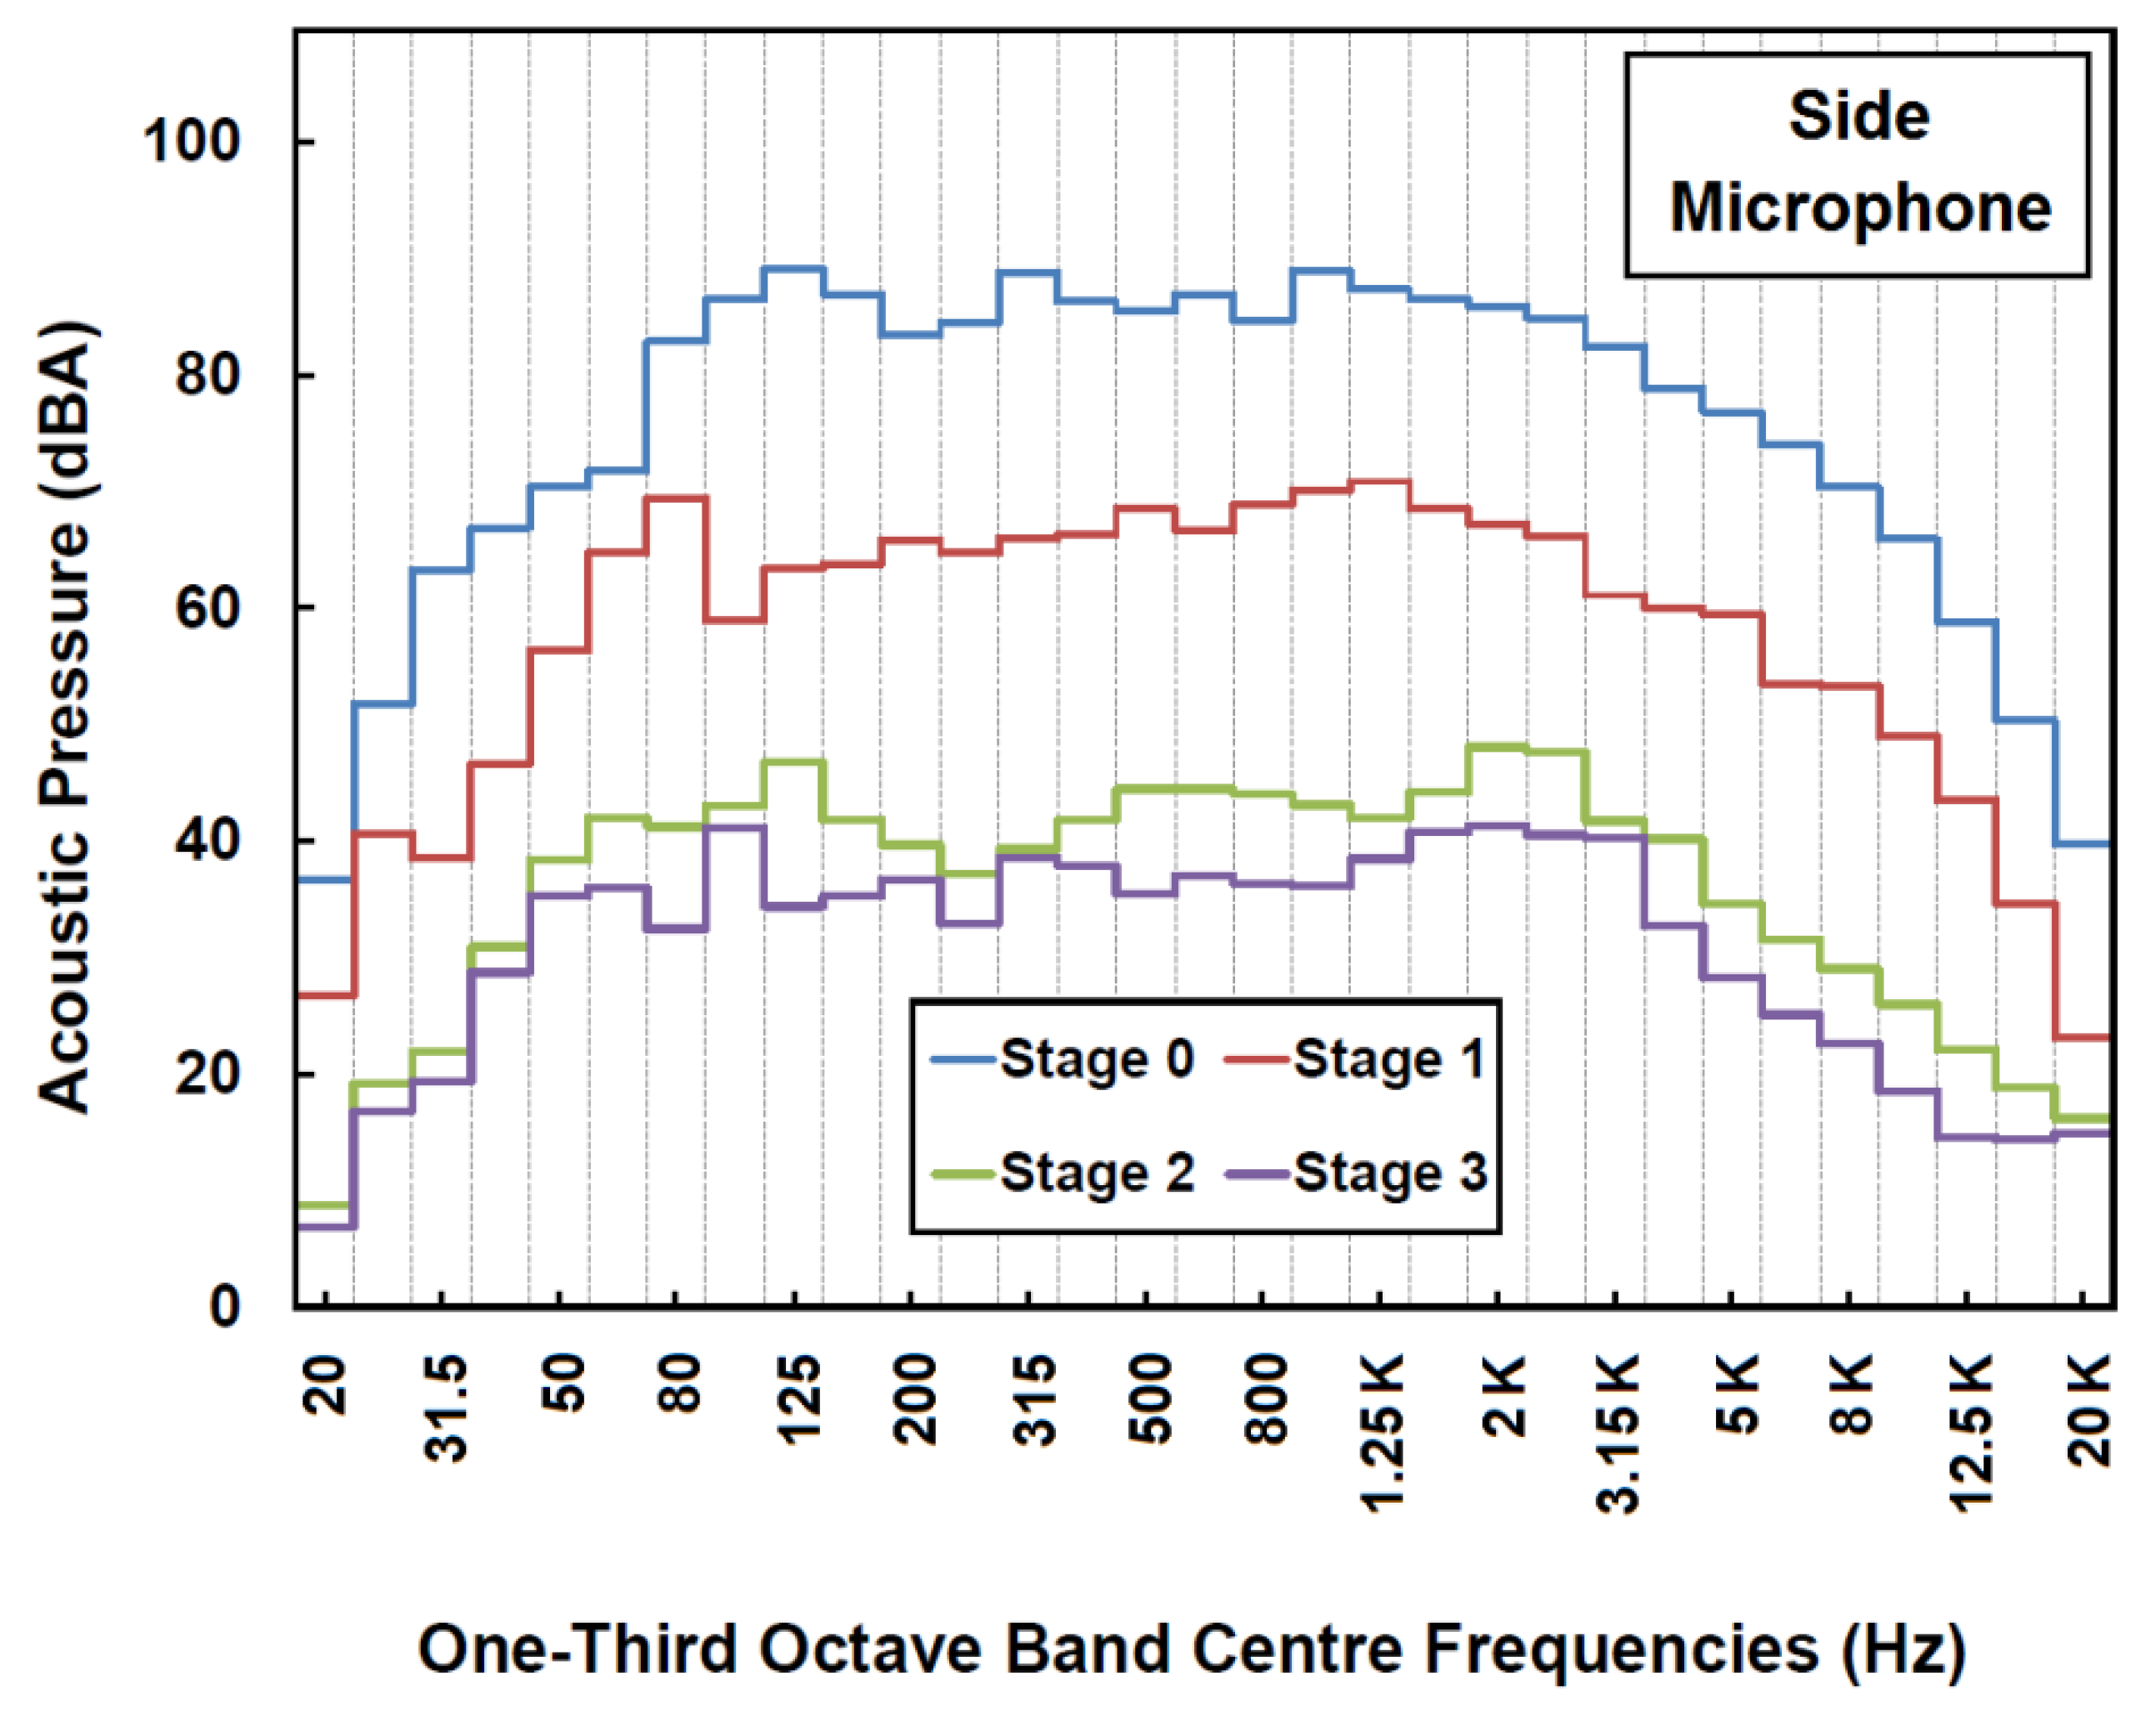
3.5. Suppression of Noise in Each One-Third Octave Band

The noise attenuation behaviour over the audible frequency range can be explored by the octave band analysis. In this discussion, 31 one-third octave bands from 20 to 20,000 Hz have been considered, as described by ISO 266:1997, Acoustics preferred frequencies, standardisation. The whole spectrum of one-third octave centre frequencies according to ISO standardisation includes 20, 25, 31.5, 40, 50, 63, 80, 100, 125, 160, 200, 250, 315, 400, 500, 630, 800, 1 K, 1.25 K, 1.6 K, 2 K, 2.5 K, 3.15 K, 4 K, 5 K, 6.3 K, 8 K, 10 K, 12.5 K, 16 K and 20 K Hz. The abscissae of Figure 15 and Figure 16 are constructed employing these centre frequencies.
As can be seen in Figure 15, the reduction in noise level is observed for the whole spectrum of the audible sound range in Stage 1. As discussed, the poroelasticity property of porous material, such as bottom ash, is powerful in suppressing low-frequency noise. This concept is reflected in Figure 15, where the reduction in noise was observed almost equally for the whole spectrum of the audible frequency range.
The micropores of the AAC enclosure are also helpful in attenuating low-frequency sounds. They significantly reduced the level of low-frequency noise in the perpendicular direction of the gas flow (Figure 16). In the direction of the gas flow, the reduction in low-frequency noise of up to 40 Hz by the AAC enclosure is minimal. This may be because low-frequency sound from the environment was added with the explosion noise in the straight microphone. The effect of the composite material in attenuating noise is very low. This does not necessarily indicate the performance of the material. In the actual tests, this material was amalgamated with the AAC enclosure and, therefore, understanding the performance of the composite material was difficult. Nevertheless, it also reduced noise levels by more than 10 dBA in some octave bands as presented in Figure 15 and Figure 16.

4. Conclusions

Several extra levels of acoustic barriers were integrated to mitigate noise from a detonation tube, originally consisting of a silencer and sound attenuation curtain set. The encapsulation of the detonation tube within the acoustic barriers was found to be effective in attenuating explosion noise to satisfactory levels at the listener ends. The bottom ash enclosure not only attenuated the explosion noise but also distributed the unidirectional flow of the detonation tube exhaust gases. In this context, bottom ash showed superior properties in attenuating explosion noise compared to other acoustic barriers. The bottom ash enclosure was also found to be effective in reducing low-frequency noise.
The AAC enclosure showed good performance in suppressing explosion noise including low-frequency components. The composite material also attenuated some level of noise; however, its true performance was not reflected in the data, as the material was amalgamated with the AAC enclosure.
The bottom ash acoustic barrier suppressed 24–33 dBA of noise. The AAC enclosure and the composite material attenuated noise by 21–24 and 1–6 dBA. Overall, the noise mitigation system reduced levels by 40–60 dBA. This substantial level of noise attenuation assisted in conducting explosion tests without creating adverse health effects caused by noise.
Explosion tests with a stoichiometric methane–air mixture and 30 g m−3 coal dust were expected to generate the highest level of noise. Although no sound data are available from Stage 0 for this explosion test, the three levels of encapsulation attenuated this noise to 82 dBA at Stage 3. This value is lower than OSHA requirements. This suggests that the noise attenuation mechanism has the potential to be integrated with explosion tests as well as similar applications such as industrial machines and engines.

Author Contributions

Conceptualization, J.Z. and B.M.; methodology, J.Z. and S.K.; writing—original draft, S.K. and J.Z.; writing—review and editing, J.Z.; supervision, J.Z. and B.M. All authors have read and agreed to the published version of the manuscript.

Funding

This work was supported by the Department of Resources Energy and Tourism, Australia (grant number—G1201029), and ACA Low Emissions Technologies Ltd., Australia (grant number—G1400523).

Institutional Review Board Statement

This study did not require ethical approval.

Informed Consent Statement

Not applicable.

Data Availability Statement

All the data included in this article.

Conflicts of Interest

The authors declare no conflict of interest.

References

  1. Dhillon, B.S. Mine Safety: A Modern Approach; Springer Science & Business Media: London, UK, 2010. [Google Scholar]
  2. Dubaniewicz, T.H. From Scotia to Brookwood, fatal US underground coal mine explosions ignited in intake air courses. J. Loss Prev. Process Ind. 2009, 22, 52–58. [Google Scholar] [CrossRef]
  3. Richmond, J.K.; Price, G.; Sapko, M.; Kawenski, E. Historical Summary of Coal Mine Explosions in the United States, 1959–1981; US Department of the Interior, Bureau of Mines: Washington, DC, USA, 1983.
  4. Tu, J. Industrial Organization of the Chinese Coal Industry; Freeman Spogli Institute for International Studies: Stanford, CA, USA, 2011. [Google Scholar]
  5. Kundu, S.; Zanganeh, J.; Moghtaderi, B. A review on understanding explosions from methane–air mixture. J. Loss Prev. Process Ind. 2016, 40, 507–523. [Google Scholar] [CrossRef]
  6. Ajrash, M.J.; Zanganeh, J.; Moghtaderi, B. Methane-coal dust hybrid fuel explosion properties in a large scale cylindrical explosion chamber. J. Loss Prev. Process Ind. 2016, 40, 317–328. [Google Scholar] [CrossRef]
  7. Amyotte, P.R.; Mintz, K.J.; Pegg, M.J.; Sun, Y.-H.; Wilkie, K.I. Laboratory investigation of the dust explosibility characteristics of three Nova Scotia coals. J. Loss Prev. Process Ind. 1991, 4, 102–109. [Google Scholar] [CrossRef]
  8. Amyotte, P.R.; Mintz, K.J.; Pegg, M.J.; Sun, Y.H. The ignitability of coal dust-air and methane-coal dust-air mixtures. Fuel 1993, 72, 671–679. [Google Scholar] [CrossRef]
  9. Cashdollar, K.L. Coal dust explosibility. J. Loss Prev. Process Ind. 1996, 9, 65–76. [Google Scholar] [CrossRef]
  10. Cashdollar, K.L. Overview of dust explosibility characteristics. J. Loss Prev. Process Ind. 2000, 13, 183–199. [Google Scholar] [CrossRef]
  11. Dong, C.; Bi, M.; Zhou, Y. Effects of obstacles and deposited coal dust on characteristics of premixed methane–air explosions in a long closed pipe. Saf. Sci. 2012, 50, 1786–1791. [Google Scholar] [CrossRef]
  12. Liu, Y.; Sun, J.; Chen, D. Flame propagation in hybrid mixture of coal dust and methane. J. Loss Prev. Process Ind. 2007, 20, 691–697. [Google Scholar] [CrossRef]
  13. Dastidar, A.G.; Amyotte, P.R.; Pegg, M.J. Factors influencing the suppression of coal dust explosions. Fuel 1997, 76, 663–670. [Google Scholar] [CrossRef]
  14. Garcia-Agreda, A.; Di Benedetto, A.; Russo, P.; Salzano, E.; Sanchirico, R. Dust/gas mixtures explosion regimes. Powder Technol. 2011, 205, 81–86. [Google Scholar] [CrossRef]
  15. Ajrash, M.J.; Zanganeh, J.; Moghtaderi, B. Effects of ignition energy on fire and explosion characteristics of dilute hybrid fuel in ventilation air methane. J. Loss Prev. Process Ind. 2016, 40, 207–216. [Google Scholar] [CrossRef]
  16. Ajrash, M.J.; Zanganeh, J.; Moghtaderi, B. Experimental investigation of the minimum auto-ignition temperature (MAIT) of the coal dust layer in a hot and humid environment. Fire Saf. J. 2016, 82, 12–22. [Google Scholar] [CrossRef]
  17. Oran, E.; Gamezo, V.; Zipf, R.K., Jr. Large-Scale Experiments and Absolute Detonability of Methane/Air Mixtures. Combust. Sci. Technol. 2015, 187, 324–341. [Google Scholar] [CrossRef]
  18. Liu, Q.; Bai, C.; Li, X.; Jiang, L.; Dai, W. Coal dust/air explosions in a large-scale tube. Fuel 2010, 89, 329–335. [Google Scholar] [CrossRef]
  19. Strahle, W.C. A review of combustion generated noise. Prog. Astronaut. Aeronaut 1975, 37, 229–248. [Google Scholar]
  20. O’Brien, W.D. Ultrasound–biophysics mechanisms. Prog. Biophys. Mol. Biol. 2007, 93, 212–255. [Google Scholar] [CrossRef]
  21. Leventhall, G. What is infrasound? Prog. Biophys. Mol. Biol. 2007, 93, 130–137. [Google Scholar] [CrossRef] [PubMed]
  22. Hansen, C.H.; Hansen, K.L. Noise Control from Concept to Application, 2nd ed.; Taylor and Francis Group: Abingdon, UK, 2022. [Google Scholar]
  23. Cirrus Research PLC. A Guide to Noise Measurement Terminology; Cirrus Research PLC: Hunmanby, UK, 2015; Available online: https://www.cirrusresearch.co.uk/library/documents/ebooks/noise-measurement-terminology-guide.pdf (accessed on 9 April 2024).
  24. Tao, Y.; Ren, M.; Zhang, H.; Peijs, T. Recent progress in acoustic materials and noise control strategies—A review. Appl. Mater. 2021, 24, 101141. [Google Scholar] [CrossRef]
  25. Nilsson, M.E. A-weighted sound pressure level as an indicator of short-term loudness or annoyance of road-traffic sound. J. Sound Vib. 2007, 302, 197–207. [Google Scholar] [CrossRef]
  26. Mershon, D.H.; King, L.E. Intensity and reverberation as factors in the auditory perception of egocentric distance. Percept. Psychophys. 1975, 18, 409–415. [Google Scholar] [CrossRef]
  27. Salam, G.C.M.A.; Chattopadhyay, G.C.N.; Jalal, M.; Rumi, U.; Eunus, H.Z.I. A Review on Jet Noise Reduction. J. Mod. Sci. Technol. 2013, 1, 19–29. [Google Scholar]
  28. Munjal, M. Automotive noise–the Indian scene in 2004. Proc. Acoust. 2004 2004, 1, 405–414. [Google Scholar]
  29. Thalheimer, E. Construction noise control program and mitigation strategy at the Central Artery/Tunnel Project. Noise Control Eng. J. 2000, 48, 157–165. [Google Scholar] [CrossRef]
  30. Pedersen, C.S. Human Hearing at Low Frequencies, with Focus on Noise Complaints; Acoustics, Department of Electronic Systems Aalborg University: Aalborg, Denmark, 2008. [Google Scholar]
  31. Forsyth, M. Buildings for Music: The Architect; the Musician, and the Listener from the Seventeenth Century to the Present Day; CUP Archive: Cambridge, UK, 1985. [Google Scholar]
  32. Billeter, P.; Egger, A.; Müller, R. Development and assessment of a new approach to determine structure-borne sound in rooms. In INTER-NOISE and NOISE-CON Congress and Conference Proceedings, Denver, CO, USA, 28–30 August 2013; Institute of Noise Control Engineering: Wakefield, MA, USA, 2013; pp. 4329–4336. [Google Scholar]
  33. Li, X.; Liu, Q.; Pei, S.; Song, L.; Zhang, X. Structure-borne noise of railway composite bridge: Numerical simulation and experimental validation. J. Sound Vib. 2015, 353, 378–394. [Google Scholar] [CrossRef]
  34. Bengtsson, J.; Waye, K.P.; Kjellberg, A. Evaluations of effects due to low-frequency noise in a low demanding work situation. J. Sound Vib. 2004, 278, 83–99. [Google Scholar] [CrossRef]
  35. Zhang, H.; Xie, X.; Jiang, J.; Yamashita, M. Assessment on transient sound radiation of a vibrating steel bridge due to traffic loading. J. Sound Vib. 2015, 336, 132–149. [Google Scholar] [CrossRef]
  36. Sagartzazu, X.; Hervella-Nieto, L.; Pagalday, J. Review in sound absorbing materials. Arch. Comput. Methods Eng. 2008, 15, 311–342. [Google Scholar] [CrossRef]
  37. Verruijt, A. Theory and Problems of Poroelasticity; Delft University of Technology: Delft, The Netherlands, 2013. [Google Scholar]
  38. Serra, Q.; Ichchou, M.N.; Deü, J.F. Wave properties in poroelastic media using a Wave Finite Element Method. J. Sound Vib. 2015, 335, 125–146. [Google Scholar] [CrossRef]
  39. Amadasi, G.; Cerniglia, A.; Duperray, B. Experimantal Determination of Poro-elastic Properties of Materials Commonly Used for Noise and Vibration Control. In Proceedings of the 15th International Congress on Sound and Vibration, Daejeon, Republic of Korea, 10 July 2008; pp. 2457–2464. [Google Scholar]
  40. Narayanan, N.; Ramamurthy, K. Structure and properties of aerated concrete: A review. Cem. Concr. Compos. 2000, 22, 321–329. [Google Scholar] [CrossRef]
  41. Hamad, A.J. Materials; production, properties and application of aerated lightweight concrete: Review. Int. J. Mater. Sci. Eng. 2014, 2, 152–157. [Google Scholar] [CrossRef]
  42. Megasorber. Available online: https://megasorber.com/soundproofing-resources/soundproofing-barrier/ (accessed on 9 April 2024).
  43. Sorberbarrier. (Pyrotek Website). Available online: https://www.pyroteknc.com/products/sorber/sorberbarrier/ (accessed on 9 April 2024).
  44. Parikh, D.; Chen, Y.; Sun, L. Reducing automotive interior noise with natural fiber nonwoven floor covering systems. Text. Res. J. 2006, 76, 813–820. [Google Scholar] [CrossRef]
  45. Arenas, C.; Vilches, L.F.; Cifuentes, H.; Leiva, C.; Vale, J.; Fernández-Pereira, C. Development of Acoustic Barriers Mainly Composed of Co-Combustion Bottom Ash; World of Coal Ash (WOCA): Denver, CO, USA, 2011. [Google Scholar]
  46. Hertzberg, M.; Cashdollar, K.L. Introduction to Dust Explosions; Industrial Dust Explosions; ASTM International: West Conshohocken, PA, USA, 1987. [Google Scholar]
  47. Occupational Safety & Health Administration (OSHA). (United States Department of Labor Website). Available online: https://www.osha.gov/otm/section-3-health-hazards/chapter-5 (accessed on 2 April 2024).
  48. Vanderstraeten, B.; Tuerlinckx, D.; Berghmans, J.; Vliegen, S.; Van, E.; Smit, B. Experimental study of the pressure and temperature dependence on the upper flammability limit of methane/air mixtures. J. Hazard. Mater. 1997, 56, 237–246. [Google Scholar] [CrossRef]
  49. Gieras, M.; Klemens, R.; Rarata, G.; Wolański, P. Determination of explosion parameters of methane-air mixtures in the chamber of 40 dm3 at normal and elevated temperature. J. Loss Prev. Process Ind. 2006, 19, 263–270. [Google Scholar] [CrossRef]
Figure 1. The A, C and Z-frequency weighting curves for the hearing perception pattern of humans [23].
Sustainability 16 03201 g001
Figure 2. Schematic diagram of detonation tube employed at the University of Newcastle, Australia.
Sustainability 16 03201 g002
Figure 3. Stage 0 silencer and noise attenuation curtains at the end of the detonation tube.
Sustainability 16 03201 g003
Figure 4. Stage 1 bottom ash-based enclosure outside the detonation tube in silencer area.
Sustainability 16 03201 g004
Figure 5. The bottom ash particles employed in this application.
Sustainability 16 03201 g005
Figure 6. Stage 2 autoclaved aerated concrete-based enclosure outside the bottom ash enclosure.
Sustainability 16 03201 g006
Figure 7. Acoustic barriers integrated with the detonation tube at the University of Newcastle, Australia.
Sustainability 16 03201 g007
Figure 8. (a) Locations and names of microphones employed in this study (top view), (b) experimental work flowchart.
Sustainability 16 03201 g008aSustainability 16 03201 g008b
Figure 9. Progressive reduction in A-weighted explosion noise level for various initial methane concentrations: (a) straight microphone, (b) side microphone.
Sustainability 16 03201 g009
Figure 10. Progressive reduction in Aweighted explosion noise level for various initial methane concentrations and fixed initial coal dust concentrations: (a) straight microphone, (b) side microphone.
Sustainability 16 03201 g010
Figure 11. A-weighted explosion noise level for 7% methane with 30 g m−3 coal dust recorded by the straight and side microphones.
Sustainability 16 03201 g011
Figure 12. Progressive reduction in C-weighted explosion noise level for 7% methane with 0, 10 and 30 g m−3 coal dust in the initial explosive mixture: (a) straight microphone, (b) side microphone.
Sustainability 16 03201 g012
Figure 13. Progressive reduction in Z-weighted explosion noise level for 7% methane with 0, 10 and 30 g m−3 coal dust in the initial explosive mixture: (a) straight microphone, (b) side microphone.
Sustainability 16 03201 g013
Figure 14. Progressive reduction in A-weighted explosion noise level for 9.5% methane with 0 and 30 g m−3 coal dust in the initial explosive mixture: (a) straight microphone, (b) side microphone.
Sustainability 16 03201 g014
Figure 15. Comparison of one-third octave band explosion noise level for 7% methane with 30 g m−3 coal dust in the initial explosive mixture as recorded from the straight microphone.
Sustainability 16 03201 g015
Figure 16. Comparison of one-third octave band explosion noise level for 7% methane with 30 g m−3 coal dust in the initial explosive mixture as recorded from the side microphone.
Sustainability 16 03201 g016
Table 1. Progressive reduction in A-weighted explosion noise level for 7% methane with 0, 10 and 30 g m−3 coal dust in the initial explosive mixture as recorded from the straight microphone.
StagesPeak Noise Level (dBA)
7% CH47% CH4 and
10 g m−3 Coal Dust
7% CH4 and
30 g m−3 Coal Dust
Stage 0129131136
Stage 198103106
Stage 2747983
Stage 3717581
Table 2. Progressive reduction in A-weighted explosion noise level for 7% methane with 0, 10 and 30 g m−3 coal dust in the initial explosive mixture as recorded from the side microphone.
StagesPeak Noise Level (dBA)
7% CH47% CH4 and
10 g m−3 Coal Dust
7% CH4 and
30 g m−3 Coal Dust
Stage 0115117120
Stage 197102103
Stage 2737882
Stage 3707581
Disclaimer/Publisher’s Note: The statements, opinions and data contained in all publications are solely those of the individual author(s) and contributor(s) and not of MDPI and/or the editor(s). MDPI and/or the editor(s) disclaim responsibility for any injury to people or property resulting from any ideas, methods, instructions or products referred to in the content.

