
Interaction Effect of Export Trade, Foreign Direct Investment and Technological Independent Innovation in China

1
Faculty of Humanities and Social Sciences, Macao Polytechnic University, Macao 999078, China
2
School of Economics and Management, Guangzhou College of Applied Science and Technology, Guangzhou 511370, China
*
Author to whom correspondence should be addressed.
Sustainability 2024, 16(8), 3211; https://doi.org/10.3390/su16083211
Submission received: 17 February 2024
/
Revised: 9 April 2024
/
Accepted: 10 April 2024
/
Published: 11 April 2024
Abstract
:China has made significant progress in the field of clean energy and sustainable development, with its photovoltaic industry technology leading globally. What has been the trajectory of China’s successful technological catch-up over the past two decades? Is China’s experience sustainable? To clarify the interaction logic between export trade (ET), foreign direct investment (FDI), and technological independent innovation (TII) in China, this paper uses panel data from 31 provinces and cities in the Chinese Mainland between 2000 and 2022. A panel vector autoregression (PVAR) model is constructed from a dynamic endogenous perspective to verify the interaction and regional heterogeneity among the three. The results are as follows: (1) The unified analytical framework shows a significant bidirectional “positive feedback effect” between ET and TII. However, FDI inhibits TII to a certain extent. Furthermore, the correlation between ET and FDI is weak. (2) The impact of ET on TII is most pronounced in the western region, while the central region sees the highest contribution rate of FDI to TII. The self-evolution effect of TII is most evident in the eastern region. This study provides suggestions for the government to develop an adaptation policy for local industrial technology conditions and establish a National Sustainable Systems of Innovation (NSSI) with multiple comparative advantages, and serves as a reference for establishing a “Chinese model”.
1. Introduction
Since the turn of the 21st century, China’s economy has undergone rapid development, resulting in a significant improvement in its technological innovation capabilities and the establishment of the Chinese model of technological catch-up. Data show that China’s R&D investment intensity reached a record high of 2.54% in 2022, which is 2.85 times higher than the 0.89% recorded in 2000. In the international context, China is ranked twelfth globally in terms of R&D expenditure intensity, surpassing innovative nations such as France (2.35%) and the Netherlands (2.32%). China is approaching the average level observed among OECD countries (2.67%). The level of China’s independent technological innovation still requires further improvement. Particularly in the past decade, China has continued to rely on chip imports, surpassing even oil imports. The self-sufficiency rate for semiconductor materials remains low, and the core technology of the information technology hardware industry is dependent on others. Chinese high-tech enterprises have faced international interceptions, causing bottleneck issues in core technologies [1]. Therefore, it is crucial to enhance China’s technological innovation system and promote the institutional-level sustainable development of technological innovation to safeguard the security of both industrial and innovation chains. This has emerged as a major research topic within Chinese academia.
In 2023, China accounted for over 60% of the global production and sales of new energy vehicles. Additionally, exports of electric vehicles, lithium batteries, and photovoltaic products increased by nearly 30%. China has successfully achieved catch-up in green technology innovation, particularly in the photovoltaic and other industries. This accomplishment can be attributed to the effective implementation of the “innovation-driven development strategy” at a national level, as well as the continuous improvements in China’s National Sustainable Systems of Innovation (NSSI). This strategy reflects China’s continuous improvement of its National System of Innovation. Research on National Systems of Innovation originated from Freeman’s investigation into Japan’s development experience [2]. Subsequently, scholars have further explored this theory in relation to domestic technology catch-up based on their own national circumstances. Suseno and Standing [3] analyzed the national innovation ecosystems of Australia and Singapore from the points of view of five policy dimensions: human capital investment, infrastructure, private–public sector collaboration, support for funding and commercialization, and innovation corporate culture. Goncalves et al. [4] investigated the impacts of innovation ecosystems on path-breaking innovation. According to Wang [5], China should improve its National Systems of Innovation model based on its own experiences. The operational performance of an NSSI is determined by a country’s technological catch-up experience and viable path dependence. Therefore, it is crucial to examine whether external or internal path dependence plays a leading role in constructing these systems when considering China’s successful achievements in technological catch-up. The role of capital accumulation and technology introduction in China’s technological catch-up has become a focal point in Chinese academic circles. There are two conflicting views on this matter. For example, Professor Lin classified China’s industries into five types: catch-up, leader, exit, curve supermodel, and strategic [6]. He proposed the “growth identification and trend guidance” method, which consists of two tracks and six steps [7]. According to him, comparative advantage also has a significant impact on technological innovation. Capital accumulation and the introduction of technology facilitate the exogenous evolution of China’s technological innovation, serving as the fundamental drivers for achieving technological catch-up. But professor Jia contends that comprehensive value chain upgrading based on independent innovation is more suitable for China’s national conditions compared to the strategy of comparative advantage [8]. The endogenous evolution of technological innovation is considered crucial for China to achieve technological catch-up. Capital accumulation and technology introduction are observed as pivotal in unveiling China’s NSSI towards attaining technological catch-up. Therefore, is China’s experience of technological catch-up sustainable? What is the dynamic relationship between ET, FDI, and TII underlying this process? Does the economic pattern across different regions exert heterogeneous influences on their interaction? Therefore, it is significant to clarify the interaction mechanism between ET, FDI, and TII under a unified analytical framework. This will reveal the logic of technology catching up with the “Chinese model” and improve China’s national innovation theory.
The existing literature [6,7,8,9,10,11,12,13,14,15,16,17,18,19,20,21,22,23,24,25,26,27,28,29,30,31] primarily focuses on a theoretical analysis of the mechanisms underlying capital accumulation and technology introduction for achieving technological catch-up, but empirical analysis is rarely conducted. Moreover, when empirical analysis is performed, it mostly relies on linear regression models [14,15,16,17,18,19,20,21,22,23], which fail to capture the dynamic evolution path of these factors within the unified framework of NSSI. This study makes significant contributions in terms of both theory and practice. (1) Methods innovation. This paper uses the PVAR model to analyze the short-run and long-run dynamic equilibrium, revealing the dynamic evolution process among variables more accurately and improving the scientific nature of understanding China’s technological catch-up. (2) Innovative research perspective. This paper analyzes homogeneity and heterogeneity from two perspectives. It compares the conclusions at the national level with those of the three regions, further revealing the heterogeneity of the influence mechanism among the three. The paper provides empirical evidence for the Chinese government to formulate an adaptation to local conditions in their technology catch-up strategy based on the comparative advantages of diversity. (3) The research conclusion is innovative. The existing literature discusses the one-way influence relationship between the two, which has resulted in conflicting views. This study includes ET, FDI, and TII in the same analytical framework. It clarifies the mechanism of external path dependence and internal path dependence of technological innovation in China’s technological catch-up. The research findings show significant relevance to China and other developing countries or regions worldwide, thereby offering valuable guidance for enhancing their “innovation-driven development strategy” and policies pertaining to TII.
In order to enhance the research quality, this paper’s framework adopts the following structure: Section 2 critically examines the existing literature on the interplay between ET, FDI, and TII. It also presents hypotheses that require verification in this study. Section 3 elucidates the empirical model, the econometric methodology, as well as data and variable selection. In Section 4, we explicate the empirical findings of the PVAR model while testing and explaining our research hypotheses. Finally, Section 5 provides a comprehensive summary of this study along with policy recommendations.
2. Literature Review and Hypothesis
Since the introduction of innovation theory by Schumpeter [9], technological innovation has been recognized as a key driver of economic growth. Antonelli [10] posited that there are two different paths of technological development: internal path dependence and external path dependence. First, internal path dependence refers to the irreversible impact of technological innovation and progress on transformation costs, which is closely related to existing technology and learning opportunities, among other internal characteristics. Second, external path dependence implies that technology choices and changes are influenced by relative prices, and are thus linked to external conditions such as factor endowments and economic systems. Given resource constraints, it becomes imperative to carefully choose the path of technological catch-up. Consequently, considering China’s recent economic development reality, two divergent logics of technological catch-up have emerged.
2.1. External Path Dependence and China’s Technological Independent Innovation
The open economy endogenous growth model posits that technologically backward countries can achieve economic catch-up and technological progress through simple technological imitation [11]. Given the low level of technology, the lack of skilled labor and limited capital, technology adoption and imitation have become important sources of technological progress in developing countries. Antonelli [10] argued that the external path dependence of technological innovation is determined by external conditions that govern and determine the successful adoption of new technologies at the systemic level. Influenced by such academic perspectives, the concept of “market exchange for technology” has long been widely adopted as an investment strategy in China [12]. The rapid accumulation of scarce capital comes from both domestic capital self-accumulation and foreign capital inflows.
On capital accumulation and technological catching-up, Professor Lin [6,7] believed that, first, the same industry all over the world uses roughly similar production technology, so a country’s technology level is endogenous to the industry, which is determined by the factor endowment structure. Second, a country’s technology advances mainly through industrial upgrading, which is based on changes in the factor endowment structure, which in turn is reflected in capital accumulation. Third, in order to maximize capital accumulation, it is necessary to make full use of comparative advantages and gain exchange value in international trade. Therefore, the new structural economics school, represented by Professor Lin, believes that according to the principle of comparative advantage, the priority industries for China’s development must be low-technology and high-value-added labor-intensive industries. In order to improve their overall technical level [13]. Some empirical studies on China’s ET and TII [14,15] also support this positive impact.
On technology introduction and catch-up, Ali et al. employed various econometric techniques to confirm that FDI can have a positive impact on technological innovation in BRICS countries [16]. Empirical studies on China also support the conclusion that FDI can effectively reduce the cost of introducing and absorbing advanced technologies and promote the diffusion of advanced technologies in China [17,18]. Multinational corporations can facilitate technology transfer and knowledge sharing with host countries, making them an effective means for developing countries to introduce and adopt new technologies. Wu and Zhang [19] suggested that secondary innovation can be achieved through the innovation of advanced technology, re-absorption, digestion, and integration, based on imitation and the utilization of latecomer advantages. Secondary innovation refers to the reinvention of existing processes based on imported technology.
On capital accumulation and technology introduction, many scholars argue that FDI has a complementary effect on the export activities of domestic enterprises. For instance, Villar et al. [20] compared developed markets with emerging markets, and found evidence of an export spillover effect. Additionally, there are arguments for a dynamic relationship between FDI and exports. For instance, Bricongne et al.’s research indicates that the complementarity or substitutability of FDI and exports depends on whether the products belong to the core competitiveness of enterprises and the demand scale of destination markets [21]. Previous data from China confirm the causal relationship between the two. For example, Xie et al. used the customs database to demonstrate that FDI has a positive impact on the quality of China’s exported products [22].
Therefore, under the external path dependence model, the process of China’s TII is as follows: “export—capital accumulation—technology introduction—technology digestion, absorption—secondary innovation and independent innovation”. Thus, hypothesis 1, hypothesis 2 and hypothesis 3, to be tested in this paper, are obtained.
H1:
The capital accumulation brought by foreign export trade can promote independent technological innovation in China.
H2:
Foreign direct investment can promote the introduction of technology, thereby improving independent technological innovation in China.
H3:
There is a mutually reinforcing relationship between export trade and foreign direct investment in China.
2.2. Internal Path Dependence and China’s Technological Independent Innovation
This section is on the ET and TII. For a considerable period, China’s economic growth model has been export-oriented, which has significantly contributed to China’s capital accumulation and had a notable impact on China’s technological innovation. However, since the turn of the 21st century, China has endeavored to move away from the export-driven economic growth model of the past and explore a connotational economic growth model that places greater emphasis on the endogenous evolution of technology. This presents a challenge to Prof Lim’s perspective. Opponents argue that while the theory of comparative advantage may demonstrate the benefits of the international division of labor, it cannot serve as a guiding principle for industrial upgrading and technological catch-up [23]. This is because the crucial factor in economic development and technological catch-up is knowledge and learning, as noted by Stiglitz [24]. Stiglitz and Greenwald [25] argued that the improvement of living standards comes from technological progress rather than capital accumulation, and that what really separates developed countries from less developed countries is mainly the knowledge gap. Without independent innovation, emerging economies like China will always find it difficult to bridge the technology gap. For a large developing country like China, its comparative advantages are not singular but diversified. Its degree of dependence on the global market is very different from that of a small “export-oriented economy” like Singapore. The reason why small countries need to take full advantage of international markets is to achieve economies of scale, while large countries have a sufficiently large market that can facilitate the emergence of new industries. The process of industrial upgrading in large countries often goes beyond incremental progress and enables significant progress in the development of specific sectors. Moreover, through industrial upgrading, large countries can also make significant progress in specific industries [26]. Technological progress is unrelated to foreign trade growth, but predominantly stems from grassroots creativity tested through competition [27].
This section is on technology introduction and TII. The introduction of foreign capital does not guarantee technology transfer, nor does it necessarily improve the independent innovation ability of technology through knowledge sharing [28] in technology introduction. FDI often needs to be combined with the accumulation of other innovation factors to be effective. For instance, Nelson and Winter [29] argued that enterprise resources, routines, capabilities, innovation, and organizational learning have a positive impact on promoting organizational change and improving performance. Ning et al. investigated the impact of FDI on the knowledge characteristics of local technological development and the innovation environment. They founded that the local gathering of skilled returnees created different interactive environments for absorbing foreign knowledge, which promoted technological innovation [30]. The research on innovation system theory highlights the significance of the self-evolution of TII. Professor Jia, representing the school of evolutionary development economics, argued that a country can only seize the “window of opportunity” for technological catch-up by concentrating on the self-accumulation of knowledge and technology [8]. Using innovation-driven and TII is more suitable for enabling developing countries to achieve technological catch-up strategies than relying solely on comparative advantages.
Therefore, contrary to the foregoing external path dependence of technological innovation, the view holds that the path of TII should be internal path dependence, which has nothing to do with capital accumulation and technology introduction. As Creane and Miyagiwa argued, FDI almost always reduces welfare in the host country [31]. Hypothesis 4 to be tested in this paper is obtained.
H4:
Technological independent innovation is influenced by self-evolution in China.
2.3. Brief Review
Previous research has explored the correlation between ET, FDI, and TII from various perspectives. However, there are still some limitations. One of the main shortcomings is the lack of examination of the overall dynamic relationship among the three factors. When examining the relationship between ET, FDI, and TII, all four hypotheses are found to be valid. Technological innovation is a complex and dynamic process, and the interaction between these three factors may differ when examined together in a unified framework compared to when they are examined separately. Therefore, it is necessary to analyze the potential negative outcomes within the unified framework. Secondly, there is a lack of investigation into regional heterogeneity. Research based on homogeneity ignores the tension between the three regions, as well as the possible compatible and mutually exclusive effects caused by them. Due to differences in economic structure, different regions have different comparative advantages, which largely determine their distinct paths towards achieving technological catch-up. There is a significant difference between the industrial technology policies of local governments and the strategic decision-making at the national level. In light of this, the present study incorporates the three components into the unified analytical framework of NSSI and uses the PVAR model to investigate the interaction mechanism and heterogeneity among the three components. The aim is to clearly depict the dynamic relationship among the three components in the context of China with diverse comparative advantages.
3. Research Design
3.1. PVAR Model
The Vector Autoregressive (VAR) model, proposed by Sims [32,33], has been widely utilized in empirical research. This model estimates the dynamic relationship between jointly endogenous variables by regressing on lagged variables for all current variables in the model. However, it is not suitable for panel data analysis due to its limitations. To address this issue, Holtz Eakin et al. [34] introduced the Panel Vector Autoregression (PVAR) method, which incorporates both time effects and fixed effects. Similar to the VAR model, it does not require a predetermined causal relationship between variables; instead, each variable is treated as endogenous, and its influence, along with that of lagged variables, on other variables in the model is analyzed. Additionally, the PVAR framework possesses characteristics of a large cross-section and short time series duration. Jaffe and Palmer [35] considered non-stationary individual effects, and augmented instrumental variables to enhance the quasi-difference autoregressive equation within the PVAR framework.
The PVAR model has been widely used by scholars to analyze the dynamic relationship between bivariate or multivariate variables. For instance, Charfeddine and Kahia [36] utilized the PVAR model to examine how renewable energy and financial development impact carbon dioxide (CO2) emissions and the economy. San Chia et al. [37] employed the PVAR model to investigate the dynamic link between transparency, financial development, income inequality, and economic growth in developing countries. The utilization of the PVAR model is a scientifically and logically sound approach in this paper, as it enables the depiction of the dynamic relationship between ET, FDI, and TII within a consistent analytical framework using 23 years of short panel data from 31 provinces and cities in China.
This section considers the dynamic complexity of the relationship between the two types of technological innovation’s roadbed dependence. To investigate the potential internal causal relationship between them scientifically and accurately, this study constructs a PVAR model at both national and regional levels. The model aims to unveil the dynamic relationship and analyze the heterogeneity. It is worth noting that China’s economy exhibits an evident spatial imbalance pattern, characterized by a typical “high in the east and low in the west” phenomenon. Therefore, based on similar regional advantages, China can be divided into three economic belts: the Eastern Economic Belt, which comprises 11 regions; the Central Economic Belt, consisting of 8 regions; and the Western Economic Belt, encompassing 12 regions. Exploring regional heterogeneity helps to reveal diverse comparative advantages within China, which has significant practical implications. The PVAR model is shown in Equation (1).
where is the coefficient matrix () of the pre-determined endogenous variable vector , is the lag order, represents the number of provinces and cities in the region (the whole country or the eastern, central and western regions), represents the time ranging from 2000 to 2022, is the fixed effect, is the sum time effect, and is the random disturbance term.
The vector of endogenous variables specifically includes:
3.2. Variable Description
3.2.1. Export Trade (ET)
The level of ET reflects the ability of a country or region to export goods and services. For developing countries, economic development lacks capital elements, and the best way to rapidly accumulate capital is to make use of comparative advantages to carry out international trade [6]. There are two types of statistics available on the export volume at the provincial level in China: those based on the location of the business unit and those based on the source of domestic goods. To scientifically measure the foreign export situation in different regions, this paper selects data on the total import and export volume of business units in various provinces and cities in China, as suggested by scholars [14,15]. The variable of ET is represented by the natural logarithm of the data, denoted as .
3.2.2. Foreign Direct Investment (FDI)
FDI represents the inflow of foreign capital and serves as a direct manifestation of foreign investment introduction in a country. It is widely recognized as a crucial mechanism for transnational corporations to transfer technology to developing nations. FDI reflects the level of foreign capital and technology introduction. Following the methodology of scholars [17,18], this paper selects FDI data from various provinces and cities in China. The natural logarithm of FDI is denoted as .
3.2.3. Technological Independent Innovation (TII)
TII reflects the controllable degree of a country’s technological innovation ability and is the embodiment of the competitiveness of a national innovation system. The Outline of the National Strategy for Innovation-Driven Development was issued by China in 2016 to comprehensively enhance the capacity for TII. The invention patent reflects the level of independent innovation achieved by society. Its number is an indicator of this achievement. This paper follows the practices of scholars [14,38] and selects data from the national patent database on the number of authorized invention patent applications from various provinces and cities. The natural logarithm of these data is taken and denoted as , which represents the variable of TII.
3.3. Data Sources
Based on a comprehensive consideration of the availability of data and the scientific rationality of empirical analysis, this paper takes the panel data of provinces and cities in China from 2000 to 2022 (31 provinces and municipalities in the mainland, excluding Hong Kong, Macao and Taiwan) as the research samples. In order to ensure the verifiability of the study and the consistency of the statistical caliber, the data in this paper are all from publicly published statistical yearbooks and government reports, mainly including China Statistical Yearbook, China Statistical Yearbook on Science and Technology, and China Statistical Yearbook on Trade and Foreign Economy.
4. Empirical Results and Analysis of the Pvar Model
The PVAR program, originally developed by Dr. Love [39,40], is widely used and has been optimized by Dr. Lian Yujun in China to include the “pvar2”-related commands. In this study, we utilized Stata16 software with generalized moment estimation (GMM), and employed the forward Helmert method to eliminate individual fixed effects as well as the mean method to remove time fixed effects. The PVAR model presented in Equations (1) and (2) was estimated using Stata15.1 software and the “pvar2” command.
4.1. Stationarity Test
The empirical test of the PVAR model requires the stationarity of panel data to avoid the problem of “spurious regression”. There are three types of unit root tests: those including both the linear time trend term and the individual fixed effect term (category Ⅰ, which is the test with the most stringent conditions), those including only the individual fixed effect term (category Ⅱ), and those excluding the linear time trend term and the individual fixed effect term (category Ⅲ, which is the test with the most liberal conditions). In this paper, the Levin–Lin–Chu (LLC) unit root test with a lag period of one period is selected according to the usual situation, and the “levinlin” command is implemented (Table 1).
According to the test results, the LLC statistics of ET, FDI and TII cannot pass the significance test under the same circumstances, which indicates that the variables may have unit roots. Therefore, it is essential to conduct first-order differencing on the variable group prior to performing the Levin–Lin–Chu unit root test. At the national level, the LLC statistics of the variable group are all less than the critical value corresponding to the significance level of 1% in the three cases, thus disproving the null hypothesis of the existence of unit root. From the perspective of the three types of economic belts, they all pass the unit root test at the significance level of 10% in the case of Category I, and pass the test at the significance level of 1% in the case of category III. This shows that the panel data are stable and can be analyzed in the next step.
The panel unit root test results are utilized to conduct cointegration tests, aiming to ascertain the existence of a long-term equilibrium relationship in the first-order single integrated panel data. When incorporating both the linear time trend term and individual fixed effects term, the “xtwest” command is employed for conducting cointegration tests, with the outcomes presented in Table 2. At the national level, two statistics exhibit significance at a 1% level and one statistic demonstrates significance at a 5% level, thereby rejecting the null hypothesis that no cointegrating relationship exists among ET, FDI, and TII. Furthermore, three statistics from Eastern region data pass the test at a significance level of 1%; two statistics from Central region data pass at a significance level of 1%; while two statistics from Western region data pass at a 5% significance level. These findings indicate that there is indeed a significant long-run equilibrium relationship among ET, FDI, and TII. Consequently, estimation using PVAR model can be pursued.
4.2. PVAR Model Estimation
This paper uses the PVAR model to construct a set of panel systems to analyze the dynamic impact of ET, FDI, and TII.
4.2.1. Optimal Lag Period
Firstly, the command “helm” was executed and the data were processed with the Helmert process to eliminate individual fixed effects and time fixed effects to improve the reliability of model estimation.
Second, the “soc” command was executed to determine the optimal lag period for the group of variables. In this paper, AIC, HQIC, and SBIC are utilized to assess the optimal lag period, with selection based on minimizing these test indicators. The results in Table 3 demonstrate that from a national perspective, the optimal lag period for the variable group is three periods; thus, a PVAR (3) model can be constructed. Regarding regions specifically, the eastern region exhibits an optimal lag period of four periods leading to the construction of a PVAR (4) model. Similarly, for the central region, an optimal lag period of two periods leads to constructing a PVAR (2) model. Lastly, in the western region, one-period lags result in constructing a PVAR (1) model. The optimal lag time varies across different levels, indicating the significant influence of regional heterogeneity on the variable group. Therefore, it is imperative to establish PVAR models separately at both national and three regional levels.
4.2.2. PVAR Model Estimated by GMM
We execute the “pvar2” command to determine the PVAR model. In this paper, the generalized method of moments (GMM) is used for parameter estimation to improve the validity of coefficient estimation. The estimated results of the country and the three economic zones are shown in Table 4.
ET is taken as the explained variable. It has been found that only the central region of FDI has a significant impact on ET, and the promotion effect is much higher than in other regions. As large-scale industrial transfer occurs from the relatively developed eastern region to the central and western regions in China, the attraction of the central region for FDI is gradually increasing. TII at the national and eastern regional levels has a significant promoting effect on ET during phase 3 and phase 4. This reflects the transformation of China’s export product structure, with high-tech products gradually replacing low-technology products.
FDI was taken as the explained variable. The findings demonstrate the significant impact of ET on FDI at the national level, indicating that China’s growing ET continues to attract multinational companies to invest in the country. However, regional heterogeneity is evident. Moreover, both TII and technology introduction play a crucial role in FDI at the national level and particularly in the central region. This suggests that China’s current innovation system follows a technology catch-up route that incorporates both independent innovation and technology transfer, with successful integration observed in the central region during industrial technology transfer from the eastern region.
TII was taken as the explained variable. The study shows that the impact of ET on TII is not statistically significant in the central region. However, the western region exhibits the strongest and most timely influence. Additionally, FDI has a significantly greater effect on TII in the western region. These results highlight the importance of capital accumulation and technology transfer facilitated by ET and FDI for fostering TII in underdeveloped areas. It is important to note that TII exhibits characteristics of self-evolution at a national level.
4.3. Granger Causality Test
The above analysis shows that the variable group has stationarity. The results are shown in Table 5.
Based on the national-level significance results, it has been found that there is a two-way promotion between ET and TII, with ET causing TII according to Granger causality. However, the Granger causality between FDI and TII is not statistically significant. The p value for rejection probability indicates that there is a 0.9% probability that ET is not the cause of TII, a 2.4% probability that FDI is not the cause of ET, and a 0.6% probability that TII is not the cause of ET. These results are consistent with the conclusion of the PVAR model mentioned earlier, indicating that capital accumulation resulting from ET provides financial support for technology absorption, transfer, and TII. However, it is important to note that the introduction of technology does not necessarily promote knowledge and the self-accumulation of technology. In the current situation, it is challenging for high and new technologies to achieve technology transfer with the investment of multinational corporations, particularly as countries generally regulate frontier technologies.
Heterogeneity analysis is performed based on the significant results obtained from various regions. The eastern region has consistently accounted for over 50% of the national GDP, and the Granger causality test outcomes align closely with those at the national level. The rejection probability values of the ET and TII of the central region, and not FDI, are 2.6% and 3.96%, respectively, which confirms the reality that the central region undertakes the industrial technology transfer of the eastern region and foreign countries. This reflects the central region’s role in facilitating technology transfer from both the eastern region and foreign sources, indicating that its path towards technological catch-up primarily relies on attracting foreign capital to promote independent innovation through capital and technology infusion. In the western region, both FDI and ET act as drivers of TII, and the rejection probability values are 1.1% and 5.6%, highlighting how this region effectively leverages its latecomer advantage to accelerate capital accumulation.
In summary, firstly, all regional results support the Granger causality of ET in TII, indicating that capital accumulation can indeed provide impetus to short-term technological innovation. Therefore, H1 is valid. Secondly, FDI in the country and the eastern region does not exhibit significant influence on the Granger causality of TII. Hence, it is less reliable to assume that H2 holds within the same framework. Thirdly, there is no significant Granger causality between FDI and ET in the central and western regions. Consequently, the reliability of assuming that H3 holds within this framework is also low.
4.4. Impulse Response
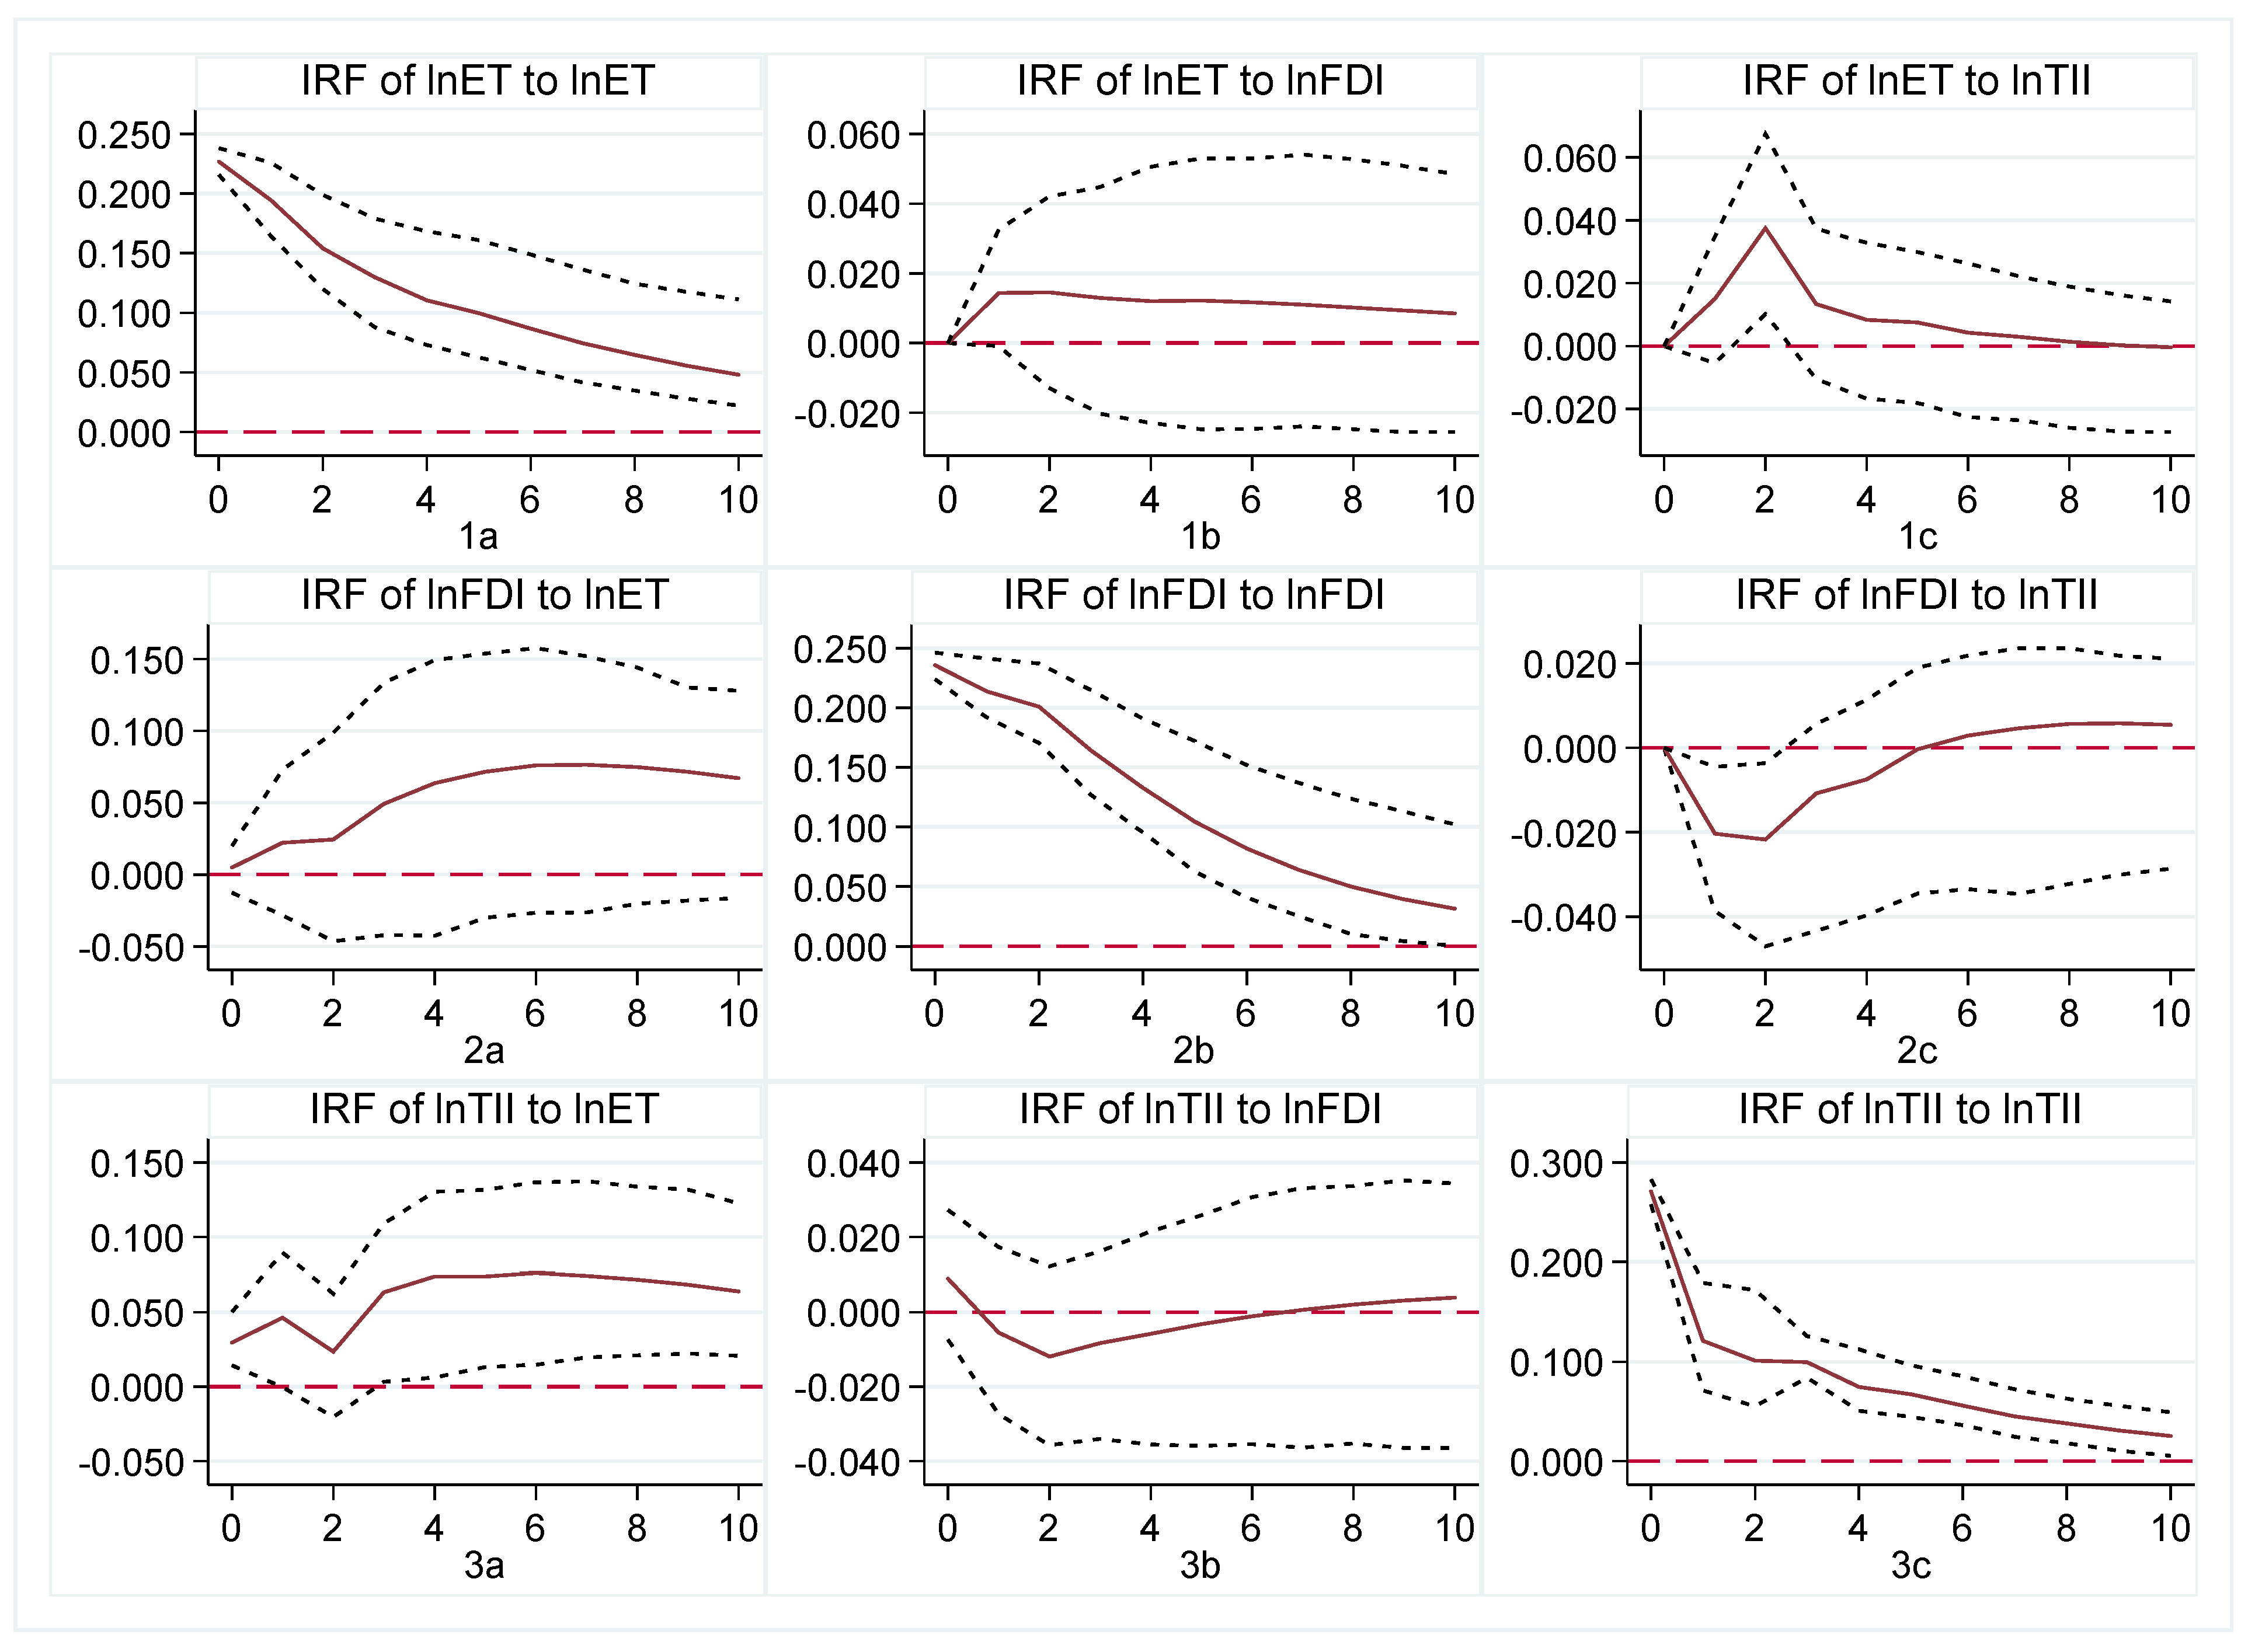
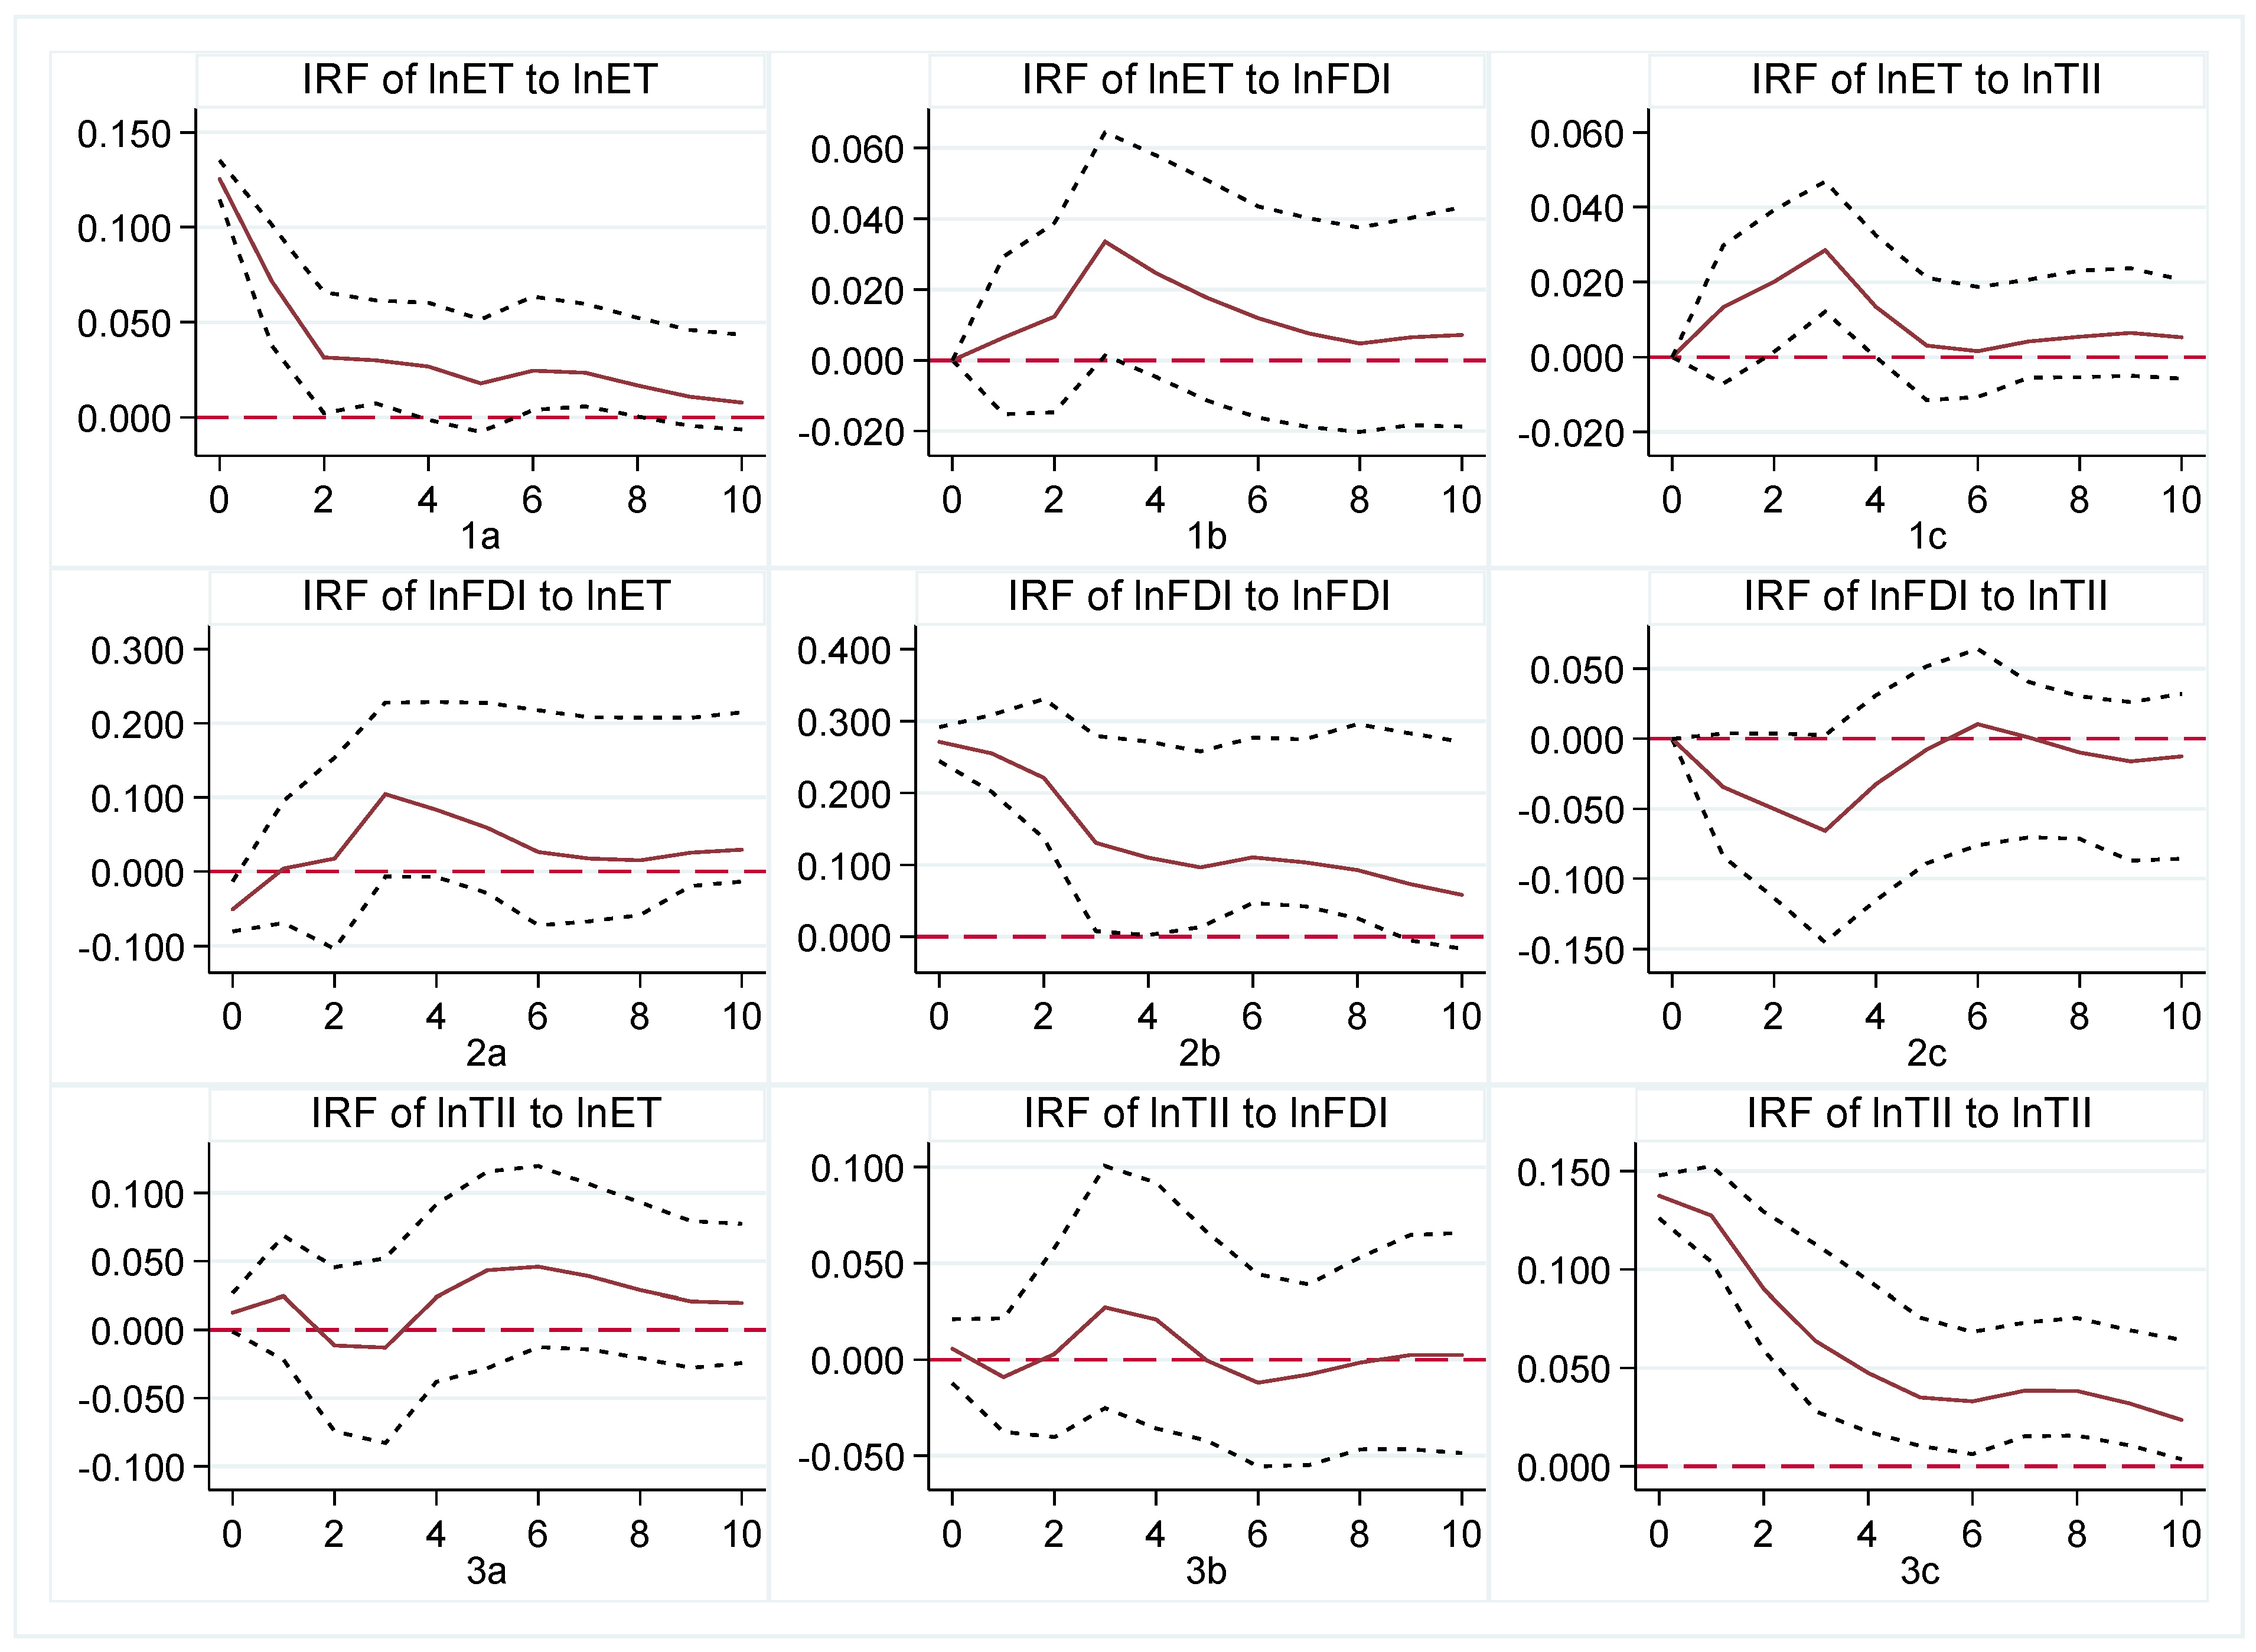
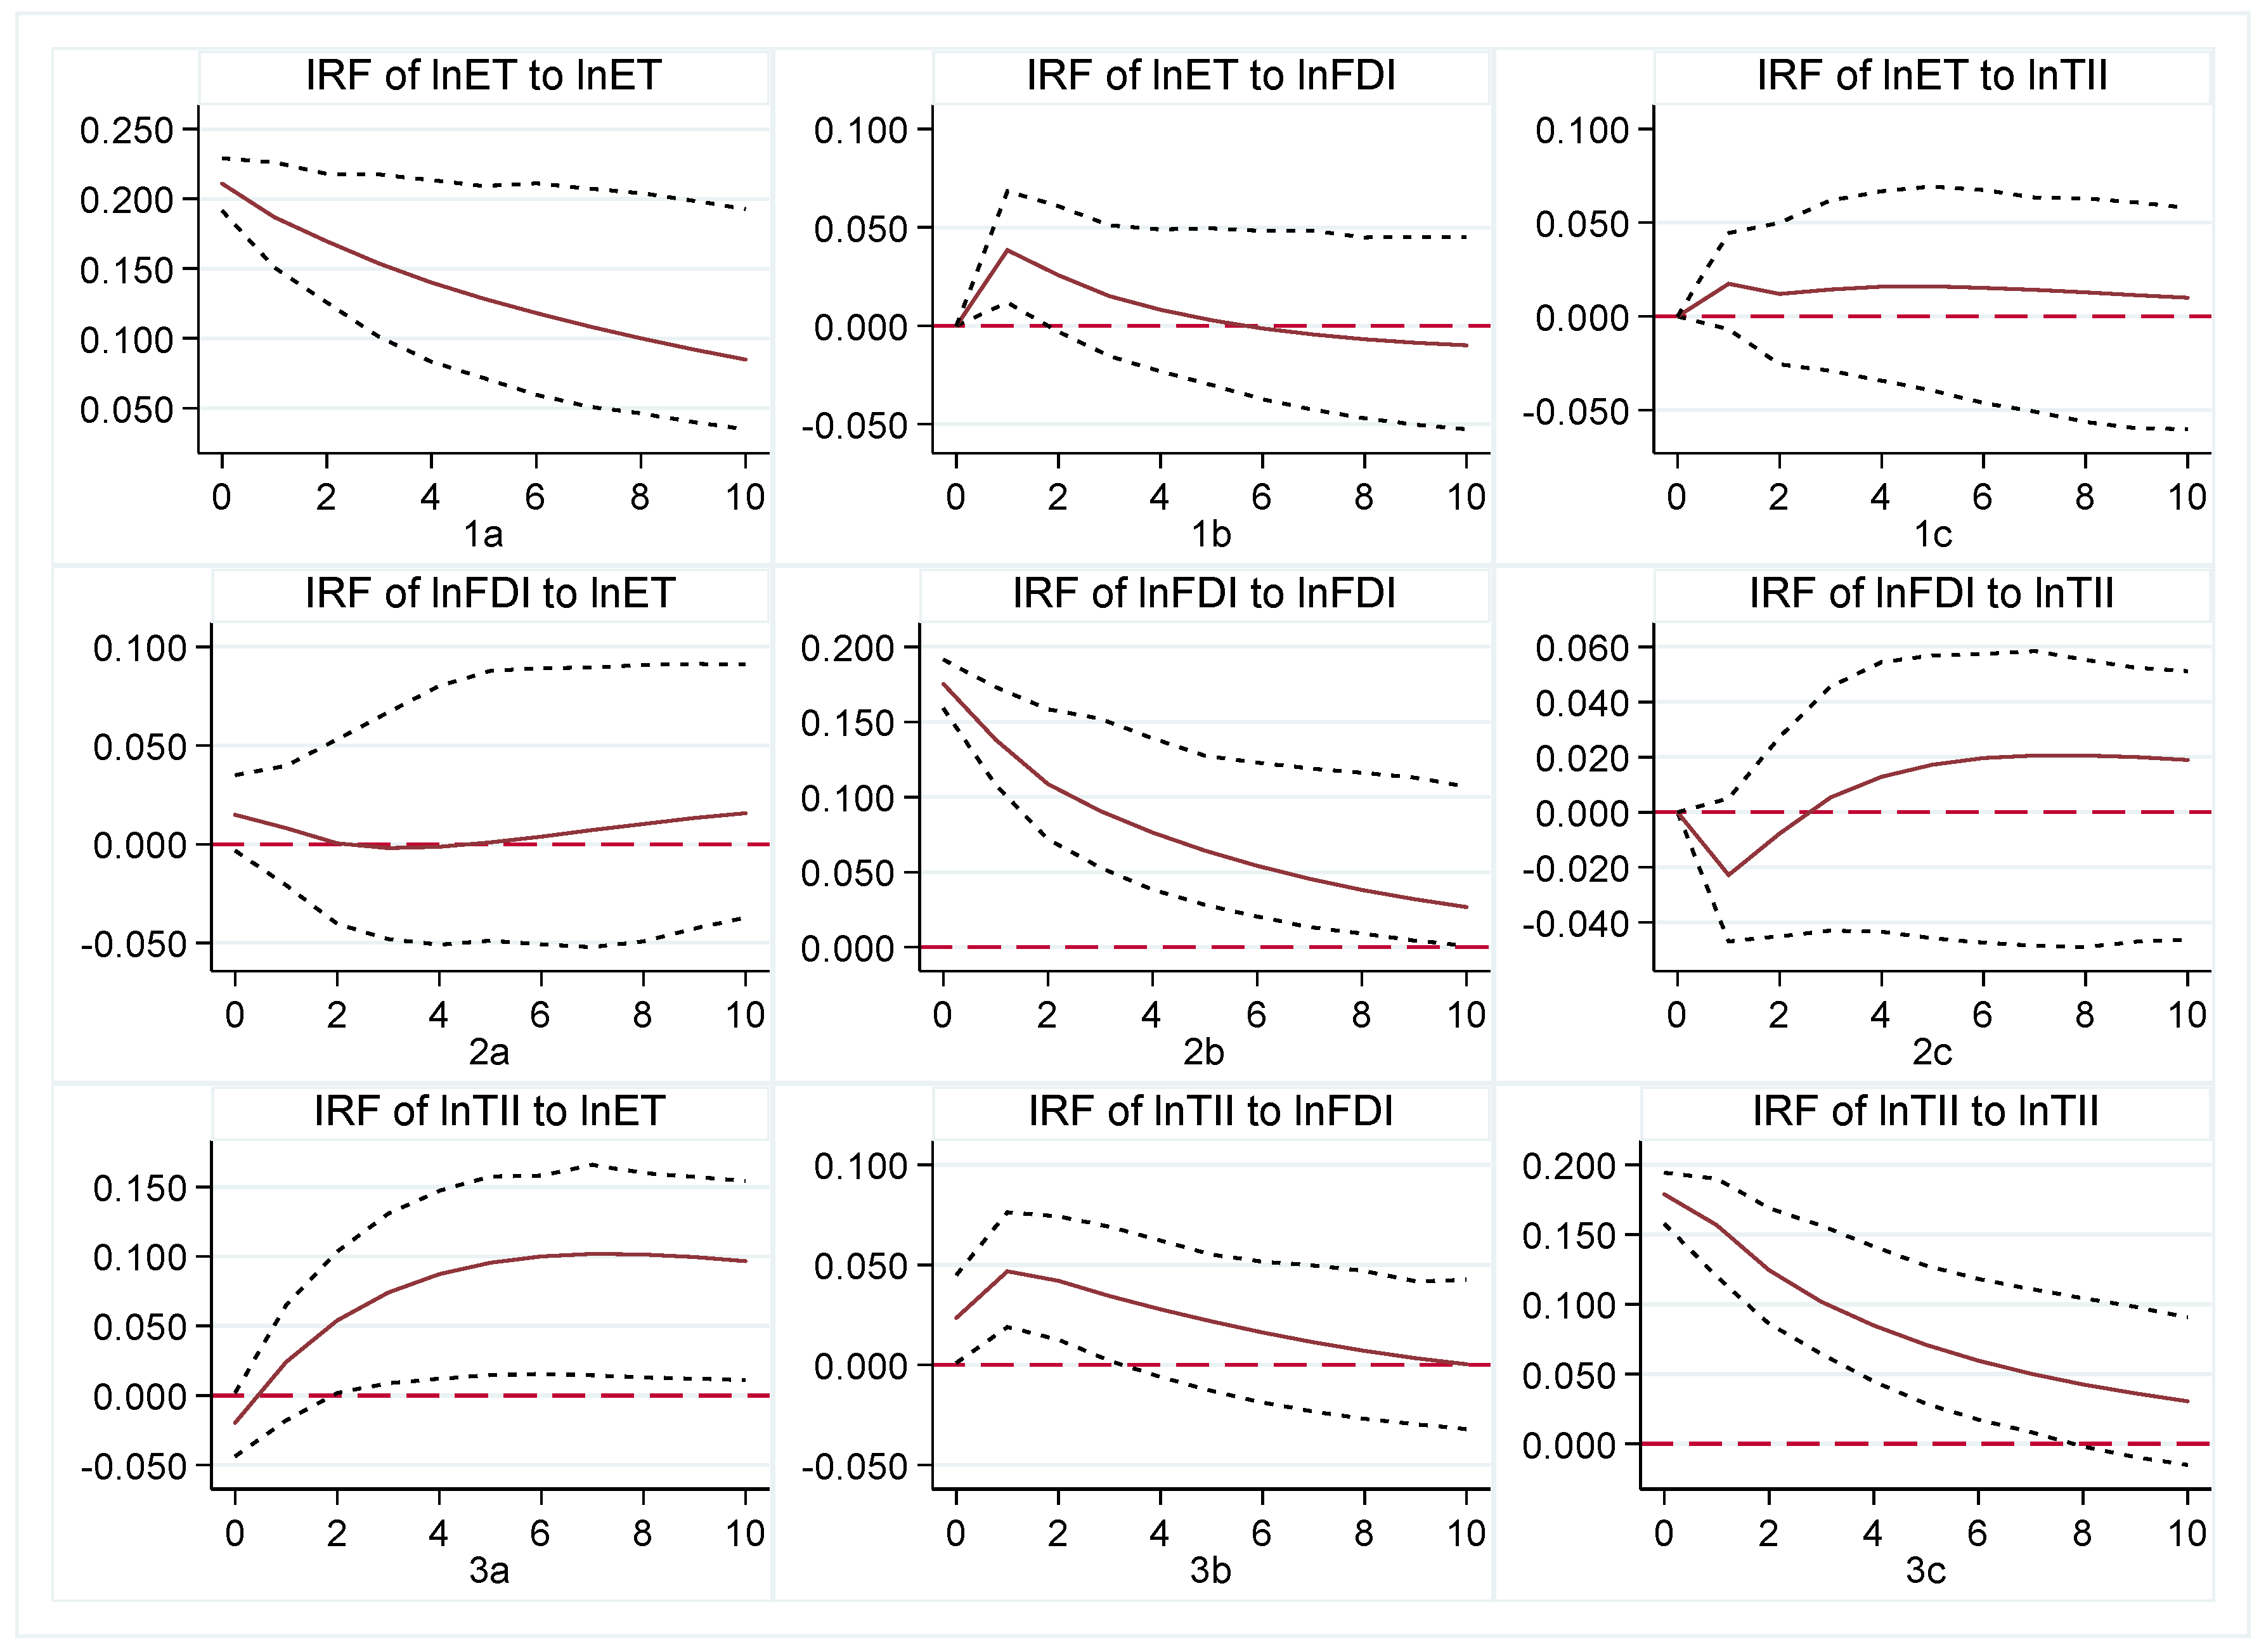
Impulse response functions reflect how the endogenous variables reflect changes in themselves and all other endogenous variables. However, the regression coefficients of the PVAR model struggle to accurately reflect the dynamic transmission path and interaction effect between future variables. Therefore, on the basis of the aforementioned PVAR model estimation and based on 200 Monte Carlo simulations, we continue to analyze the dynamic influence relationship brought about by the mutual impact of each variable in the next 10 cycles within the 95% confidence interval. The results are shown in Figure 1, Figure 2, Figure 3 and Figure 4. The figure shows that the three regions are roughly the same as at the national level, but also show some heterogeneity.
4.4.1. ET and TII
The ET plays a positive role in promoting TII, exhibiting an evident “positive feedback effect” in the short term. However, the impact of TII on ET is relatively weak and exhibits significant regional heterogeneity. A comparison between 1c and 3a in Figure 1, Figure 2, Figure 3 and Figure 4 reveals that the influence of one unit of ET on TII reaches its peak during the second cycle before declining, displaying an inverted “V” trend to some extent. Nevertheless, there are noticeable regional disparities in subsequent attenuation. This indicates that financial support derived from ET demonstrates diminishing marginal utility in regions with abundant funds, like the eastern region, but continues to play a role in regions with relatively scarce funds, such as the central and western regions. Additionally, it is observed that TII has the greatest impact on ET within the western region, reaching a peak value of 0.3, followed by the central region. At both national and eastern regional levels, response trends exhibit similar wave-like patterns, which reflect differences in technological catch-up modes resulting from variations in economic structures across different regions. Specifically, the eastern region has gradually reduced its reliance on low-technology product exports and shifted towards exporting higher-technology value-added products, such as those from photovoltaic industries.
4.4.2. FDI and TII
In the short term, FDI hinders TII. The impact of TII on FDI varies significantly across different regions, with a distinct pattern observed in the central region. Please refer to Figure 1, Figure 2, Figure 3 and Figure 4 for a comparison between 2c and 3b. Firstly, technology introduction in all regions exerts a certain “crowding out effect” on TII, which is particularly pronounced in the eastern region where the peak influence reaches approximately −0.06. This indicates that local investments by multinational corporations’ technology transfers limit the allocation of learning resources towards digesting and absorbing foreign technologies, leading to crowding out effects on original knowledge and technology inputs in the short term. However, during the third period, there is a shift from a negative to a positive impact of FDI on TII, suggesting that technology transfer’s influence on independent innovation in the central region is long-term and far-reaching. Secondly, initial positive impacts are observed between TII and FDI in both central and western regions before diminishing to zero; this implies that transnational corporations assess local capacity for undertaking technology when making investments locally. However, due to the high level of TII, the eastern region is less sensitive to technology transfer from transnational corporations, which inhibits independent innovation to a certain extent.
4.4.3. ET and FDI
The interaction between ET and FDI exhibits a certain degree of positivity, although there are significant regional disparities. From the disparities depicted in 1b and 2a of Figure 1, Figure 2, Figure 3 and Figure 4 firstly, the response degree, speed, and attenuation degree of FDI differ under the impact of a one-unit increase in ET. Notably, the response speed of the central region is the fastest, the response degree of the eastern region is the highest, and the attenuation degree at the national level is the lowest, while the response in the western region is negative. This indicates that ET has distinct effects on different regions’ ability to attract foreign capital. Secondly, after the impact of one FDI unit, although the ET has a positive impact, the impact process is completely different. ET performs best at the national level, showing a gradual upward trend and reaching its highest point in the sixth cycle. This shows that even though the structure of export products is changing, ET is still an important means to promote China’s economic growth, and China’s position as the world’s manufacturing factory is still stable. The performance of the central region is first decreased and then increased, indicating that even if it has undertaken industrial transfer of the eastern region, its location advantage is still not obvious, and its attractiveness to FDI still needs to be enhanced.
In conclusion, both the national level and the heterogeneity of the three types of regions reflect the diversity of China’s comparative advantages. As a large-scale market, it can promote both the external path dependence and internal path dependence of technological innovation. Therefore, the paradigm of China’s technological catch-up is different from that of small-scale markets, which can only rely on a single path.
4.5. Variance Decomposition
The impulse response functions elucidate the trajectories of random disturbances on endogenous variables, providing valuable insights into the relationship between technological progress and foreign trade. Consequently, a variance decomposition analysis based on these functions can enable further exploration into the nature of random disturbances. Table 6 presents the variations in the proportions of different groups of regional variables affected by shocks across countries and at three specific levels.
(1) Overall, the contribution rates of ET, FDI, and TII to their respective impacts are relatively evident. ET and TII exhibit a mutually reinforcing influence to some extent. Over time, FDI has a weak inhibitory effect on TII. There are noticeable regional disparities in the contribution of TII to FDI, which aligns with the findings of impulse response functions.
(2) The interaction between ET, FDI, and TII is examined. Firstly, the overall impact of ET on TII in different regions of China is evident. Notably, the western region demonstrates the most significant influence with a contribution rate of 50.9% in the fifth period. The eastern region exhibits the fastest growth rate, tripling from period 5 to period 10. The national level and central region also double their contribution rates from period 5 to period 10, while remaining stable at 23.9% and 37.5%, respectively. Secondly, FDI’s contribution to TII falls short compared to that of ET; it only reaches a value of 4.2% in the central region during phase 10—although this is still twenty-one times higher than at the national level and twice as high as in both eastern and western regions combined—indicating that technology transfer plays a more substantial role in knowledge acquisition within this particular area compared to others. Thirdly, there are notable regional differences regarding how much ET contributes to FDI: its impact on both national-level and western regions is more pronounced (14.1% and 12.l%, respectively) during phase 10; however, despite nearly doubling from periods 5 to 10, its contribution rate remains lowest in the central region at only 0.7%. Lastly, there exists a weak influence of FDI and TII on ET, with no apparent regional disparities.
(3) From the perspective of the self-evolution of TII, the eastern region exhibits the highest contribution rate and a significantly lower decay rate compared to other regions. This indicates that the economic development in the eastern region has a solid foundation, with relatively insignificant influence from ET and FDI. Gradually, advantages in knowledge and technology accumulation have become evident, leading to a gradual catch-up with global technological advancements. On the other hand, both central and western regions demonstrate relatively lower contribution rates at only 58.4% and 46.5%, respectively, during the 10th period. This highlights that regions with greater backwardness face more challenges in accumulating knowledge and technology, while heavily relying on capital accumulation and technology introduction facilitated by ET and FDI.
In summary, the results of variance decomposition analysis confirm the findings from impulse response function analysis that different regions in China possess varying comparative advantages and exhibit distinct paths towards achieving technological catch-up. This explains why scholars have arrived at conflicting conclusions when examining the interaction between ET and TII, FDI and TII, as well as ET and FDI separately. However, by incorporating all three factors into a single analytical framework alongside regional analysis, empirical evidence supports Hypotheses 1 and 4, while failing to verify Hypotheses 2 and 3.
5. Conclusions and Implications
In order to deeply understand the path of a country’s technological catch-up, it is necessary to analyze the main variables under a unified framework to reveal the path dependence of the evolution of the National Sustainable Systems of Innovation. Currently, most studies on the impact of capital accumulation and technology transfer on technological catch-up are predominantly theoretical, or rely on empirical analysis of export trade (ET), foreign direct investment (FDI), and technological independent innovation (TII). These studies often adopt a linear regression approach from a unidirectional perspective, overlooking their interdependence and neglecting to explore their reciprocal relationship. Using a sample of macroeconomic data from 31 provinces and cities on the Chinese mainland from 2000 to 2022, this study employs the PVAR model, Granger causality test, impulse response function, and variance decomposition to examine and analyze the dynamic interaction between ET, FDI, and TII in China. The analysis is conducted considering national homogeneity and heterogeneity based on three types of economic zones. The specific findings are as follows:
(1) The PVAR model, impulse response analysis, variance decomposition, and Granger causality test findings support each other, indicating a bidirectional interaction effect between China’s ET and TII in the short term. Specifically, the western region exhibits a significant superposition effect of ET on TII, while the eastern region demonstrates a pronounced positive feedback effect of TII on ET. By incorporating ET into our analytical framework, we address the limitations identified by Wu and Zhang [19] and confirm that capital accumulation plays a role in technological catch-up. However, its role is different from that explained by Lin [6,7]. Export trade’s capital accumulation does not create external path dependence for China’s technological innovation. Instead, it provides capital elements for the formation of internal path dependence, which facilitates the introduction and adoption of technological innovation, thereby promoting knowledge and technology accumulation. The study’s conclusion supports Antonelli’s perspective that ET stimulates creative and innovative efforts, promoting the Schumpeterian cycle between ET and technological innovation [40];
(2) In terms of self-evolution of TII, the eastern region has the highest contribution rate and a significantly lower decay rate compared to other regions. These research findings support Professor Jia’s perspective on the endogenous evolution of technological innovation [8], but do not substantiate Lu et al.’s claim that China’s technological catch-up is unrelated to ET and FDI [27]. According to this study, short-term deviations from the long-term equilibrium trend among variable groups are effectively adjusted over time to ensure a stable long-term equilibrium in terms of external path dependence on technological innovation. This study aims to fill an empirical research gap identified in the existing literature [8,24,25], and confirms that China’s path towards technological catch-up displays characteristics of short-term internal path dependence;
(3) The empirical findings show that there are regional disparities in the dynamic relationship between ET, FDI, and TII within the unified framework of NSSI in China. Hypotheses 1–4 hold true when examined individually, but only Hypotheses 1 and 4 remain valid under the same framework. The above statement shows that the development experience of TII in developed countries is not easily applicable to developing countries [41]. China’s progress in technological catch-up over the past two decades can be attributed not only to its proactive approach in expanding export trade and attracting foreign direct investment based on comparative advantages, but also to its internal efforts in cultivating high-tech industries and promoting independent technological innovation based on the principle of inverse comparative advantage.
Although this paper provides supplements and confirmations to existing research in the Chinese scenario, it is unable to reveal the specific influence process among the three from a more micro perspective due to the limitations of the PVAR model. Further exploration using more econometric techniques is needed to complete these studies. However, the research conclusion can still provide ideas for the maker of industrial technology policy. Based on the aforementioned research findings, this paper proposes policy recommendations for enhancing NSSI and establishing a sustainable technology catch-up model across the following four dimensions;
(4) At the national strategic level, the government should develop industrial technology policies that are adapted to local conditions, while taking into account both external and internal path dependencies of technological innovation. China’s spatial economic pattern of “high in the east and low in the west” has facilitated diversified comparative advantages [26]. Considering the heterogeneity of innovation factors, technology specificity, and the impact of technology on relative factor prices [42], China’s strategy for catching up in technology should take these two path dependencies into account. It should focus on improving the integrity and efficiency of the industrial chain, expanding the scope and depth of both industrial and innovation chains, and fostering a new framework for technological advancement in industry with “domestic large-scale circulation” as its core, while simultaneously promoting domestic and international dual circulation;
(5) Technological catch-up in the eastern region should commence from the high end of the value chain, with a focus on leveraging regional advantages along the eastern coast and breaking through core technological bottlenecks. Local governments should strategically develop high-tech industries based on their comparative advantages, while emphasizing original accumulation and brand marketing in R&D and design. Enhancing basic technology research, fostering an innovative environment, and promoting originality are essential for improving the endogenous evolution efficiency of independent innovation. Adhering to a comprehensive value chain upgrading strategy centered around independent innovation as its core principle [8], it is crucial to seize opportunities for technological catch-up;
(6) In the central region, it is crucial to effectively integrate technology introduction and independent innovation to achieve technological catch-up. Firstly, local governments should capitalize on this opportunity by enhancing the business environment and intensifying efforts to attract FDI. By actively undertaking the outsourcing and relocation of manufacturing industries from developed countries and the eastern region, we can assimilate advanced technologies from both domestic and international sources, thereby accumulating new comparative advantages. Secondly, creating a favorable innovation environment is equally important. This entails digesting and absorbing technology transfers while persistently pursuing TII, fully leveraging the role of knowledge and technology accumulation as well as diffusion within the “Government–Industry–University–Research” innovation network [43]. The aim is to address the challenge of “low-end high-end industries” while promoting an industrial structure that extends towards both ends of the “smile” curve;
(7) Technological catch-up in the western region should adhere to the “dual-core drive” of opening up and regional cooperation, and accelerate capital accumulation. The economic foundation of the western region is relatively weak, particularly lacking in capital factors but abundant in natural resources. Local governments should formulate industrial technology policies based on local realities, develop industries with distinctive advantages, and seize the technological catch-up opportunities brought by the national “Belt and Road” strategy. On one hand, it is necessary to increase openness by strengthening ET, leveraging the role of CAFTA and the China–Central Asia Free Trade Area, and actively integrating products with ASEAN and Central Asian countries. On the other hand, it is essential to enhance domestic regional cooperation by utilizing comparative advantages for undertaking industrial transfers from other regions while actively participating in reconstructing domestic intra-product systems of labor division. This can be done through means such as purchasing or imitating technologies to achieve secondary innovation, and promote the optimization and upgrading of the industrial structure.
Author Contributions
Conceptualization, X.L. and C.L.; methodology, X.L. and C.L.; software, X.L.; formal analysis, C.L.; data curation, X.L.; writing—original draft, X.L.; writing—review & editing, C.L. All authors have read and agreed to the published version of the manuscript.
Funding
This work was supported by the Humanities and Social Science Fund of Ministry of Education of China (21YJAZH006); The Guangdong Office of Philosophy and Social Science (GD22YYJ10); The Guangzhou Office of Philosophy and Social Science (2022GZGJ41).
Institutional Review Board Statement
The study did not involve humans or animals.
Informed Consent Statement
Not applicable.
Data Availability Statement
The data used to support the findings of this study are available from the corresponding author upon request.
Acknowledgments
We are thankful for the suggestions and efforts from the reviewers and editors.
Conflicts of Interest
The authors declare no conflicts of interest.
References
- Chen, J.; Yang, Z.; Zhu, Z.Q. The Solution of ‘Neck Sticking’ Technology during the 14th Five-Year Plan Period: Identification Framework, Strategic Change and Breakthrough Path. Reform 2020, 12, 5–15. [Google Scholar]
- Freeman, C. Technology Policy and Economic Performance: Lessons from Japan; Pinter: London, UK, 1987. [Google Scholar]
- Suseno, Y.; Standing, C. The Systems Perspective of National Innovation Ecosystems. Syst. Res. Behav. Sci. 2018, 35, 282–307. [Google Scholar] [CrossRef]
- Goncalves, E.; De Matos, C.M.; De Araujo, I.F. Path-Dependent Dynamics and Technological Spillovers in the Brazilian Regions. Appl. Spat. Anal. Policy 2019, 12, 605–629. [Google Scholar] [CrossRef]
- Wang, F.T. Choice of National Innovation System Model in China: Theory, History and Practice. Frontiers 2022, 20, 55–62. [Google Scholar] [CrossRef]
- Lin, Y.F. Industrial Policy and China’s Economic Development: From the Perspective of New Structural Economics. Fudan J. Hum. Soc. Sci. Ed. 2017, 2, 148–153. [Google Scholar] [CrossRef]
- Lin, Y.F.; Zhang, J.; Wang, Y.; Kou, Z.L. Summary, Reflection and Prospect of Industrial Policy; Peking University Press: Beijing, China, 2018. [Google Scholar]
- Jia, G.L. Evolutionary development economics and new structural economics: Which industrial policy theoretical paradigm is more suitable for Chinese national conditions. South China J. Econ. 2018, 37, 5–35. [Google Scholar] [CrossRef]
- Schumpeter, J. The Theory of Economic Development; Routledge Imprint: London, UK, 2021. [Google Scholar] [CrossRef]
- Antonelli, C. The Economics of Innovation, New Technologies and Structural Change; Routledge Imprint: London, UK, 2003. [Google Scholar] [CrossRef]
- Rivera-Batiz, L.A.; Romer, P.M. Economic Integration and Endogenous Growth. Q. J. Econ. 1991, 106, 531–555. Available online: https://www.jstor.org/stable/2937946 (accessed on 16 February 2024). [CrossRef]
- Yao, Y. The Influence of Non-State-owned Economic Components on the Technical Efficiency of Chinese Industrial Enterprises. Econ. Res. J. 1998, 12, 29–35. [Google Scholar]
- Lin, Y.F. Industrial Policy and National development: From the Perspective of New Structural Economics. Comparison 2016, 6, 163–173. [Google Scholar]
- Rauf, A.; Ma, Y.; Jalil, A. Change in factor endowment, technological innovation and export: Evidence from China’s manufacturing sector. Eur. J. Innov. Manag. 2021, 26, 134–156. [Google Scholar] [CrossRef]
- Cai, Y.L.; Wu, G.L.; Zhang, D.S. Does Export Trade Promote Firm Innovation? Ann. Econ. Financ. 2020, 21, 483. Available online: http://aeconf.com/Articles/Nov2020/aef210208.pdf (accessed on 16 February 2024).
- Ali, N.; Phoungthong, K.; Khan, A.; Abbas, S.; Dilanchiev, A.; Tariq, S.; Sadiq, M.N. Does FDI foster technological innovations? Empirical evidence from BRICS economies. PLoS ONE 2023, 21, e0282498. [Google Scholar] [CrossRef]
- Tan, J.; Zhang, Y.Q.; Cao, H. The FDI-spawned technological spillover effects on innovation quality of local enterprises: Evidence from industrial firms and the patents in China. Appl. Econ. 2023, 55, 5800–5815. [Google Scholar] [CrossRef]
- Wang, Q.Z.; Liu, S.X. How Do FDI and Technological Innovation Affect Carbon Emission Efficiency in China? Energies 2022, 15, 9209. [Google Scholar] [CrossRef]
- Wu, X.B.; Zhang, H.Y. From Secondary Innovation to Beyond Catch-Up: The Transition of Innovation Capability of Chinese High-Tech Enterprises. Soc. Sci. Front. 2018, 10, 85–90+2. [Google Scholar]
- Villar, C.; Mesa, R.J.; Barber, J.P. A meta-analysis of export spillovers from FDI: Advanced vs emerging markets. Int. J. Emerg. Mark. 2020, 15, 991–1010. [Google Scholar] [CrossRef]
- Bricongne, J.C.; Bedoya, S.F.; Forero, M.L. The proximity-concentration trade-off with multi-product firms: Are exports and FDI complements or substitutes? World Econ. 2023, 46, 1264–1289. [Google Scholar] [CrossRef]
- Xie, W.W.; Xue, T.H. FDI and Improvements in the Quality of Export Products in the Chinese Manufacturing Industry. Emerg. Mark. Financ. Trade 2016, 56, 3106–3116. [Google Scholar] [CrossRef]
- Yu, Y.D. Reconstruction of Development Economics: A review of Lin Yifu’s New Structural Economics. China Econ. Q. 2013, 3, 1075–1078. [Google Scholar]
- Stiglitz, J.E. Rethinking development economics. World Bank Res. Obs. 2011, 26, 230–236. [Google Scholar] [CrossRef]
- Stiglitz, J.E.; Greenwald, B.C. Creating a Learning Society: A New Approach to Growth, Development, and Social Progress; Columbia University Press: Cambridge, MA, USA, 2014. [Google Scholar]
- Zhu, F.Q. How to Promote Industrial Upgrading based on the Transportation of Comparative Advantage: A Comment on Lin Yifu’s New Structural Economics. Acad. Mon. 2017, 2, 64–79. [Google Scholar]
- Lu, F. Industrial upgrading and the policy choice of China’s economic development. Beijing Cult. Rev. 2016, 4, 60–68. [Google Scholar]
- Musa, C.I.; Sahabuddin, R.; Tawe, A.; Haeruddin, M.I.M. Effect of knowledge sharing and technological innovation capabilities on competitive advantage on MSME’s culinary sector. Econ. Financ. Lett. 2023, 10, 245–256. [Google Scholar] [CrossRef]
- Nelson, R.R.; Winter, S.G. The Schumpeterian Trade off Revisited. Am. Econ. Rev. 1982, 72, 114–132. Available online: https://www.jstor.org/stable/1808579 (accessed on 16 February 2024).
- Ning, L.T.; Guo, R.; Chen, K.H. Does FDI bring knowledge externalities for host country firms to develop complex technologies? The catalytic role of overseas returnee clustering structures. Res. Policy 2023, 52, 104767. [Google Scholar] [CrossRef]
- Creane, A.; Miyagiwa, K. Export versus FDI: Learning through propinquity. Int. J. Econ. Theory 2020, 16, 361–379. [Google Scholar] [CrossRef]
- Sims, C.A. Comparison of Interwar and Postwar Business Cycles: Monetarism Reconsidered. Am. Econ. Rev. 1980, 70, 250–257. Available online: https://www.jstor.org/stable/1815476 (accessed on 16 February 2024).
- Sims, C.A. Macroeconomics and Reality. Econometrica 1980, 48, 1–48. Available online: https://www.jstor.org/stable/1912017 (accessed on 16 February 2024). [CrossRef]
- Holtz-Eakin, D.; Newey, W.; Rosen, H.S. Estimating Vector Autoregressions with Panel Data. Econometrica 1988, 56, 1371–1395. Available online: https://www.jstor.org/stable/1913103 (accessed on 16 February 2024). [CrossRef]
- Jaffe, A.B.; Palmer, K. Environmental regulation and innovation: A panel data study. Rev. Econ. Stat. 1997, 79, 610–619. Available online: https://www.jstor.org/stable/2951413 (accessed on 16 February 2024). [CrossRef]
- Charfeddine, L.; Kahia, M. Impact of renewable energy consumption and financial development on CO2 emissions and economic growth in the MENA region: A panel vector autoregressive (PVAR) analysis. Renew. Energy 2019, 139, 198–213. [Google Scholar] [CrossRef]
- San Chia, P.; Law, S.H.; Trinugroho, I.; Wiwoho, J.; Damayanti, S.M.; Sergi, B.S. Dynamic linkages among transparency, income inequality and economic growth in developing countries: Evidence from panel vector autoregressive (PVAR) model. Res. Int. Bus. Financ. 2022, 60, 101599. [Google Scholar] [CrossRef]
- Zhang, Y.; Cheng, Y.; She, G.M. Can Government Subsidy Improve High-tech Firms’ Independent Innovation? Evidence from Zhongguancun Firm Panel Data. J. Financ. Res. 2018, 460, 123–140. [Google Scholar]
- Love, I.; Zicchino, L. Financial Development and Dynamic Investment Behavior: Evidence from Panel VAR. Q. Rev. Econ. Financ. 2006, 46, 190–210. [Google Scholar] [CrossRef]
- Antonelli, C.; Feder, C. The Schumpeterian creative response: Export and innovation: Evidence for OECD countries 1995-2015. Econ. Politica 2021, 38, 803–821. [Google Scholar] [CrossRef]
- Zhang, X.Z.; Shi, F. Burning the Bridge: How History has been Falsified to Justify Neoliberal Capitalism. Acad. Res. 2010, 9, 61–63+74. [Google Scholar]
- Zhu, F.Q. Two Schools of Industrial Policy and Corresponding Bridging. South China J. Econ. 2018, 1, 36–47. [Google Scholar] [CrossRef]
- Wang, Z.; Zhang, S.M. How Can the Deep Integration of Government-Industry-University-Research-User Systematically Break Through Key Core Technologies. Forum Sci. Technol. China 2023, 6, 75–85+107. [Google Scholar] [CrossRef]
Figure 1.
Impulse response of 10 cycles between ET, FDI and TII at the national level. Notes: The horizontal axis represents the number of lag periods (years), the middle curve is the impulse response function curve. Errors are 5% on each side generated by Monte Carlo with 200 reps. The dashed lines above and below indicate the 5% and 95% confidence intervals, respectively. Same as Figure 2, Figure 3, Figure 4.

Figure 2.
Impulse response of 10 cycles between ET, FDI and TII in eastern China.

Figure 3.
Impulse response of 10 cycles between ET, FDI and TII in central China.

Figure 4.
Impulse response of 10 cycles between ET, FDI and TII in western China.


Table 1.
T-value results of Levin–Lin–Chu unit root tests.
| Variables | Type | Nation | Eastern | Central | Western |
|---|---|---|---|---|---|
| Ⅰ | −19.429 *** | −12.549 *** | −10.169 * | −12.005 ** | |
| Ⅱ | −18.203 *** | −10.611 *** | −9.376 *** | −11.634 *** | |
| Ⅲ | −15.735 *** | −8.897 *** | −7.745 *** | −10.833 *** | |
| Ⅰ | −20.343 *** | −11.955 ** | −11.220 *** | −12.316 *** | |
| Ⅱ | −17.141 *** | −10.356 *** | −9.921 *** | −10.752 *** | |
| Ⅲ | −16.061 *** | −9.735 *** | −9.921 *** | −10.31 *** | |
| Ⅰ | −21.659 *** | −10.533 * | −10.774 *** | −16.280 *** | |
| Ⅱ | −18.109 *** | −8.769 ** | −9.694 *** | −15.229 *** | |
| Ⅲ | −16.244 *** | −7.639 *** | −8.355 *** | −13.685 *** |
Note: (1) “*”, “**” and “***” indicate significance at the confidence levels of 1%, 5% and 10%, respectively. (2) “ln” represents the log value of the original data of the variable, and “d” represents the first-order difference.
Table 2.
p-value results of the cointegration test.
| Statistic | Nation | Eastern | Central | Western |
|---|---|---|---|---|
| Gt | 0.000 | 0.008 | 0.002 | 0.011 |
| Ga | 0.418 | 0.388 | 0.703 | 0.310 |
| Pt | 0.000 | 0.005 | 0.004 | 0.011 |
| Pa | 0.020 | 0.006 | 0.219 | 0.129 |
Table 3.
Results of the optimal lag period.
| Lag | AIC | HQIC | SBIC | |
|---|---|---|---|---|
| Nation | 3 | 0.453 * | 1.345 * | 0.801 * |
| Eastern | 4 | −1.521 | −0.376 * | −1.058 * |
| Central | 2 | −0.997 * | −0.190 * | −0.669 * |
| Western | 1 | 2.119 * | 2.749 * | 2.373 * |
Note: “*” indicates the optimal lag period under this information criterion.
Table 4.
Estimation results of GMM parameters of PVAR model.
| Be Explained Variable | Explanatory Variable | Nation L3 | Eastern L4 | Central L2 | Western L1 |
|---|---|---|---|---|---|
| Coef. (p) | Coef. (p) | Coef. (p) | Coef. (p) | ||
| h_lnET | 0.051 (0.266) | 0.039 (0.636) | 0.014 (0.881) | 0.881 (0.000 ***) | |
| h_lnFDI | 0.006 (0.887) | 0.069 (0.109) | 0.22 (0.007 ***) | −0.051 (0.304) | |
| h_lnET | h_lnTII | 0.115 (0.002 ***) | 0.111 (0.002 ***) | 0.077 (0.325) | 0.044 (0.703) |
| h_lnET | 0.095 (0.030 **) | −0.434 (0.121) | 0.029 (0.577) | 0.090 (0.407) | |
| h_lnFDI | 0.106 (0.003 ***) | 0.181 (0.318) | 0.001 (0.989) | 0.913 (0.000 ***) | |
| h_lnFDI | h_lnTII | 0.045 (0.079 *) | 0.173 (0.118) | 0.174 (0.039 **) | −0.051 (0.552) |
| h_lnET | 0.203 (0.000 ***) | 0.190 (0.082 *) | −0.012 (0.843) | 0.759 (0.011 **) | |
| h_lnFDI | 0.037 (0.375) | −0.100 (0.244) | −0.142 (0.011) | 0.184 (0.056 *) | |
| h_lnTII | h_lnTII | 0.111 (0.032 ***) | 0.011 (0.828) | −0.072 (0.287) | 0.302 (0.160) |
Notes: (1) “h” denotes the result of eliminating the fixed effect via the Helmert transformation. (2) “L1” means the lag of the first order. (3) The p-values are indicated in brackets. (4) “*”, “**” and “***” indicate significance at the confidence levels of 1%, 5% and 10%, respectively. The meanings provided below shall remain unchanged unless otherwise specified.
Table 5.
Results of granger causality test.
| Be Explained Variable | Explanatory Variable | Nation L3 | Eastern L4 | Central L2 | Western L1 |
|---|---|---|---|---|---|
| Coef. (p) | Coef. (p) | Coef. (p) | Coef. (p) | ||
| h_lnFDI | 1.608 (0.658) | 5.737 (0.220) | 7.272 (0.026 **) | 1.057 (0.304) | |
| h_lnET | h_lnTII | 11.501 (0.009 ***) | 11.630 (0.020 **) | 1.257 (0.534) | 0.145 (0.703) |
| ALL | 12.261 (0.056 *) | 16.853 (0.032 **) | 8.450 (0.076 *) | 1.096 (0.578) | |
| h_lnET | 9.462 (0.024 **) | 8.860 (0.065 *) | 0.520 (0.771) | 0.688 (0.407) | |
| h_lnFDI | h_lnTII | 5.053 (0.168) | 4.380 (0.357) | 4.477 (0.107) | 0.354 (0.552) |
| ALL | 17.963 (0.006 ***) | 12.969 (0.113) | 5.444 (0.245) | 1.059 (0.589) | |
| h_lnET | 12.295 (0.006 **) | 24.646 (0.000 ***) | 6.353 (0.042 **) | 6.491 (0.011 **) | |
| h_lnTII | h_lnFDI | 1.731 (0.630) | 4.492 (0.344) | 6.468 (0.039 **) | 3.648 (0.056 *) |
| ALL | 16.513 (0.011 **) | 30.550 (0.000 ***) | 9.702 (0.046 **) | 7.892 (0.019 **) |
“*”, “**” and “***” indicate significance at the confidence levels of 1%, 5% and 10%, respectively.
Table 6.
Results of variance decomposition.
| Nation | Eastern | Central | Western | ||||||||||
|---|---|---|---|---|---|---|---|---|---|---|---|---|---|
| s | lnET | lnFDI | lnTII | lnET | lnFDI | lnTII | lnET | lnFDI | lnTII | lnET | lnFDI | lnTII | |
| lnET | 5 | 0.982 | 0.005 | 0.013 | 0.870 | 0.071 | 0.058 | 0.978 | 0.016 | 0.006 | 0.988 | 0.003 | 0.009 |
| lnFDI | 5 | 0.039 | 0.956 | 0.005 | 0.084 | 0.879 | 0.037 | 0.004 | 0.986 | 0.010 | 0.074 | 0.910 | 0.016 |
| lnTII | 5 | 0.102 | 0.003 | 0.895 | 0.031 | 0.025 | 0.944 | 0.150 | 0.057 | 0.793 | 0.509 | 0.026 | 0.465 |
| lnET | 10 | 0.981 | 0.008 | 0.011 | 0.859 | 0.085 | 0.057 | 0.979 | 0.012 | 0.009 | 0.975 | 0.012 | 0.013 |
| lnFDI | 10 | 0.141 | 0.854 | 0.005 | 0.088 | 0.880 | 0.032 | 0.007 | 0.963 | 0.030 | 0.121 | 0.862 | 0.017 |
| lnTII | 10 | 0.239 | 0.002 | 0.759 | 0.128 | 0.023 | 0.849 | 0.375 | 0.042 | 0.584 | 0.644 | 0.019 | 0.337 |
Disclaimer/Publisher’s Note: The statements, opinions and data contained in all publications are solely those of the individual author(s) and contributor(s) and not of MDPI and/or the editor(s). MDPI and/or the editor(s) disclaim responsibility for any injury to people or property resulting from any ideas, methods, instructions or products referred to in the content. |
© 2024 by the authors. Licensee MDPI, Basel, Switzerland. This article is an open access article distributed under the terms and conditions of the Creative Commons Attribution (CC BY) license (https://creativecommons.org/licenses/by/4.0/).
Share and Cite
MDPI and ACS Style
Li, X.; Li, C. Interaction Effect of Export Trade, Foreign Direct Investment and Technological Independent Innovation in China. Sustainability 2024, 16, 3211. https://doi.org/10.3390/su16083211
AMA Style
Li X, Li C. Interaction Effect of Export Trade, Foreign Direct Investment and Technological Independent Innovation in China. Sustainability. 2024; 16(8):3211. https://doi.org/10.3390/su16083211
Chicago/Turabian StyleLi, Xianke, and Chongyan Li. 2024. "Interaction Effect of Export Trade, Foreign Direct Investment and Technological Independent Innovation in China" Sustainability 16, no. 8: 3211. https://doi.org/10.3390/su16083211
Note that from the first issue of 2016, this journal uses article numbers instead of page numbers. See further details here.