Article

The Integration of Sustainable Technology and Big Data Analytics in Saudi Arabian SMEs: A Path to Improved Business Performance

by
Arwa Mohammed Asiri
1,2,*,
Sabah Abdullah Al-Somali
1,2 and
Rozan Omar Maghrabi
1,2
1
Faculty of Economics and Administration, Management Information System Department, King Abdulaziz University, Jeddah 21589, Saudi Arabia
2
The Management of Digital Transformation and Innovation Systems in Organization Research Group, King Abdulaziz University, Jeddah 21589, Saudi Arabia
*
Author to whom correspondence should be addressed.
Sustainability 2024, 16(8), 3209; https://doi.org/10.3390/su16083209
Submission received: 29 February 2024 / Revised: 4 April 2024 / Accepted: 8 April 2024 / Published: 11 April 2024
(This article belongs to the Special Issue Business Analytics and Big Data for Business Sustainability II)

Abstract

:
Big data analytics technology offers significant opportunities for innovation and performance improvement for small- and medium-sized enterprises (SMEs) operating in competitive environments. However, reaping these benefits requires the adoption of such technologies by SMEs. This study investigates the factors influencing the adoption of big data and analytics in Saudi Arabian SMEs in the service and manufacturing sectors, with a particular focus on the role of facilitating sustainable technology in enabling sustainable business performance. Data were collected from managers of SMEs in Saudi Arabia using a quantitative method. The proposed hypotheses were tested using structural equation modeling with SmartPLS 4.0. The findings reveal that big data security and management support significantly influence the perceived ease of use and usefulness of big data analytics in SMEs. Perceived ease of use significantly influences the adoption of big data analytics. Furthermore, facilitating sustainable technology was a significant predictor of sustainable business performance. Additionally, the study revealed that the adoption of big data analytics significantly influenced business performance. The insights obtained from this study can be useful for the service and manufacturing industries operating in Saudi Arabia, particularly regarding the key influencing factor of perceived ease of use that determines the adoption of big data analytics in the Saudi Arabian SME market.

1. Introduction

This research study is primarily focused on the adoption of big data analytics (BDA) by small- and medium-sized enterprises (SMEs). Big data is a collection of subject-oriented data comprising information from a given time period that helps decision-makers [1]. Scholars such as Sen et al. [2] and Coleman et al. [3] have emphasized the significance of identifying the crucial factors regarding the adoption of BDA. They have also thrown light on the opportunities and challenges that SMEs face while considering adopting BDA. This study is particularly relevant to SMEs in Saudi Arabia, as studies by Alshamaila et al. [4] and Alalwan et al. [5] have shown an increasing interest in BDA in the country. Therefore, it is crucial to establish a comprehensive framework for understanding SMEs’ adoption of BDA. Awa et al. [6] and Baig et al. [7] have provided insights into technology–organization–environment factors that can be integrated into such a framework, while Maroufkhani et al. [8] and Akhtar et al. [9] have contributed by identifying determinants of BDA adoption in SMEs. Collectively, these studies underscore the complexity of BDA adoption in SMEs, necessitating a holistic approach to comprehending and supporting this process.
Related studies on the use of BDA in various organizations show that businesses can benefit from using BDA as a solid foundation for improving performance [3,10]. Large companies in all industries use this valuable technology to enhance customer relationships significantly, product selection and development, and ultimately profitability [11]. However, BDA is a relatively new phenomenon for SMEs [3]. According to the International Labor Organization [12], SMEs contribute to job creation, where they generate two-thirds of jobs worldwide. Firms with less than 100 employees create 50 percent of private sector jobs in developing economies [13]. In the Saudi Arabian context, 92 percent of all businesses are SMEs, contributing 33 percent of the country’s GDP [14]. However, the prevailing literature stresses the significance of BDA in large corporations [15].
According to Mikalef et al. [16], more studies on the adoption of BDA by SMEs are needed. Many SMEs are still hesitant to adopt BDA technology or fail to make practical use of BDA investment, although it has been argued that BDA plays a crucial role in improving sustainability efforts [17]. These SMEs are far behind when it comes to BDA adoption because of their limited resources and lack of understanding of the main factors that hinder the adoption and use of such technologies despite understanding their importance in enhancing sustainability [18]. ccording to previous research, there are not many studies that focus on the adoption of BDA among SMEs. Only a few studies exist, and they are quite limited [19,20]. Moreover, SMEs in developing countries such as the KSA have different situations and circumstances that need further investigation. Therefore, this study utilizes a technological, organizational, and environmental (TOE) framework to investigate the factors that drive BD adoption in the SME sector. The TOE model is suitable for this study because it is adaptable and can explain the levels of technology adoption among these businesses [8]. Hence, this research aims to explore the influencing factors of BDA adoption within SMEs in Saudi Arabia. Precisely, this study identifies the following research objectives from the above discussion.
  • Objective 1: To critically evaluate key critical factors that influence BDA adoption by SMEs in Saudi Arabia;
  • Objective 2: To examine the impact of facilitating sustainable technology on sustainable business performance in Saudi Arabian SMEs;
  • Objective 3: To develop a holistic framework to understand SMEs’ adoption of BDA in Saudi Arabia.
This section provides a background on this research study, along with a description of the problem, research gaps, and goals. Following this is an explanation of the literature review, the development of the theoretical hypotheses, and the study theoretical model. The study’s methodology is described in the section that follows, which also includes a presentation of the survey data’s findings from Saudi SMEs. The final section presents a discussion on management implications, limitations, and future directions.

2. Literature Review

2.1. Industry 4.0 and Sustainable Business Performance

The incorporation of Industry 4.0 technologies, including the use of big data and big data analytics applications, shows transformative potential for businesses and improves sustainable business performance in small and medium enterprises (SMEs) [21]. Big data is a revolutionary technology, defined as “a collection of subject-oriented data with information from a specific time period that assists the management decision-making process” [9]. Big data has 10 unique characteristics, known as the 10 V’s: volume, velocity, veracity, value, variety, variability, validity, vulnerability, volatility, and visualization [1,7,10]. Figure 1 illustrates the 10 V’s of big data. By the integration of Industry 4.0 capabilities, which is categorized by the digitization of business and industrial processes, (SMEs) can use advanced analytics, among other technologies, to obtain insights from massive datasets [3]. This capacity is essential for maximizing operational effectiveness, reducing waste, and improving decision-making procedures, all of which support environmental and economic sustainability [22]. In an increasingly data-driven economy, small- and medium-sized enterprises (SMEs) can gain a competitive edge by using big data analytics to forecast market trends, customize consumer experiences, and strengthen supply chain resilience [23]. Furthermore, big data and analytics support the more general goals of sustainable development by promoting sustainable practices and enabling the efficient use of resources, which helps SMEs not only grow economically but also perform in an environmentally conscious manner [17]. In order to tackle the challenges of the twenty-first century, SMEs that aim for sustainable business performance will find that the use of big data and analytics within the context of Industry 4.0 is a crucial enabler [24].

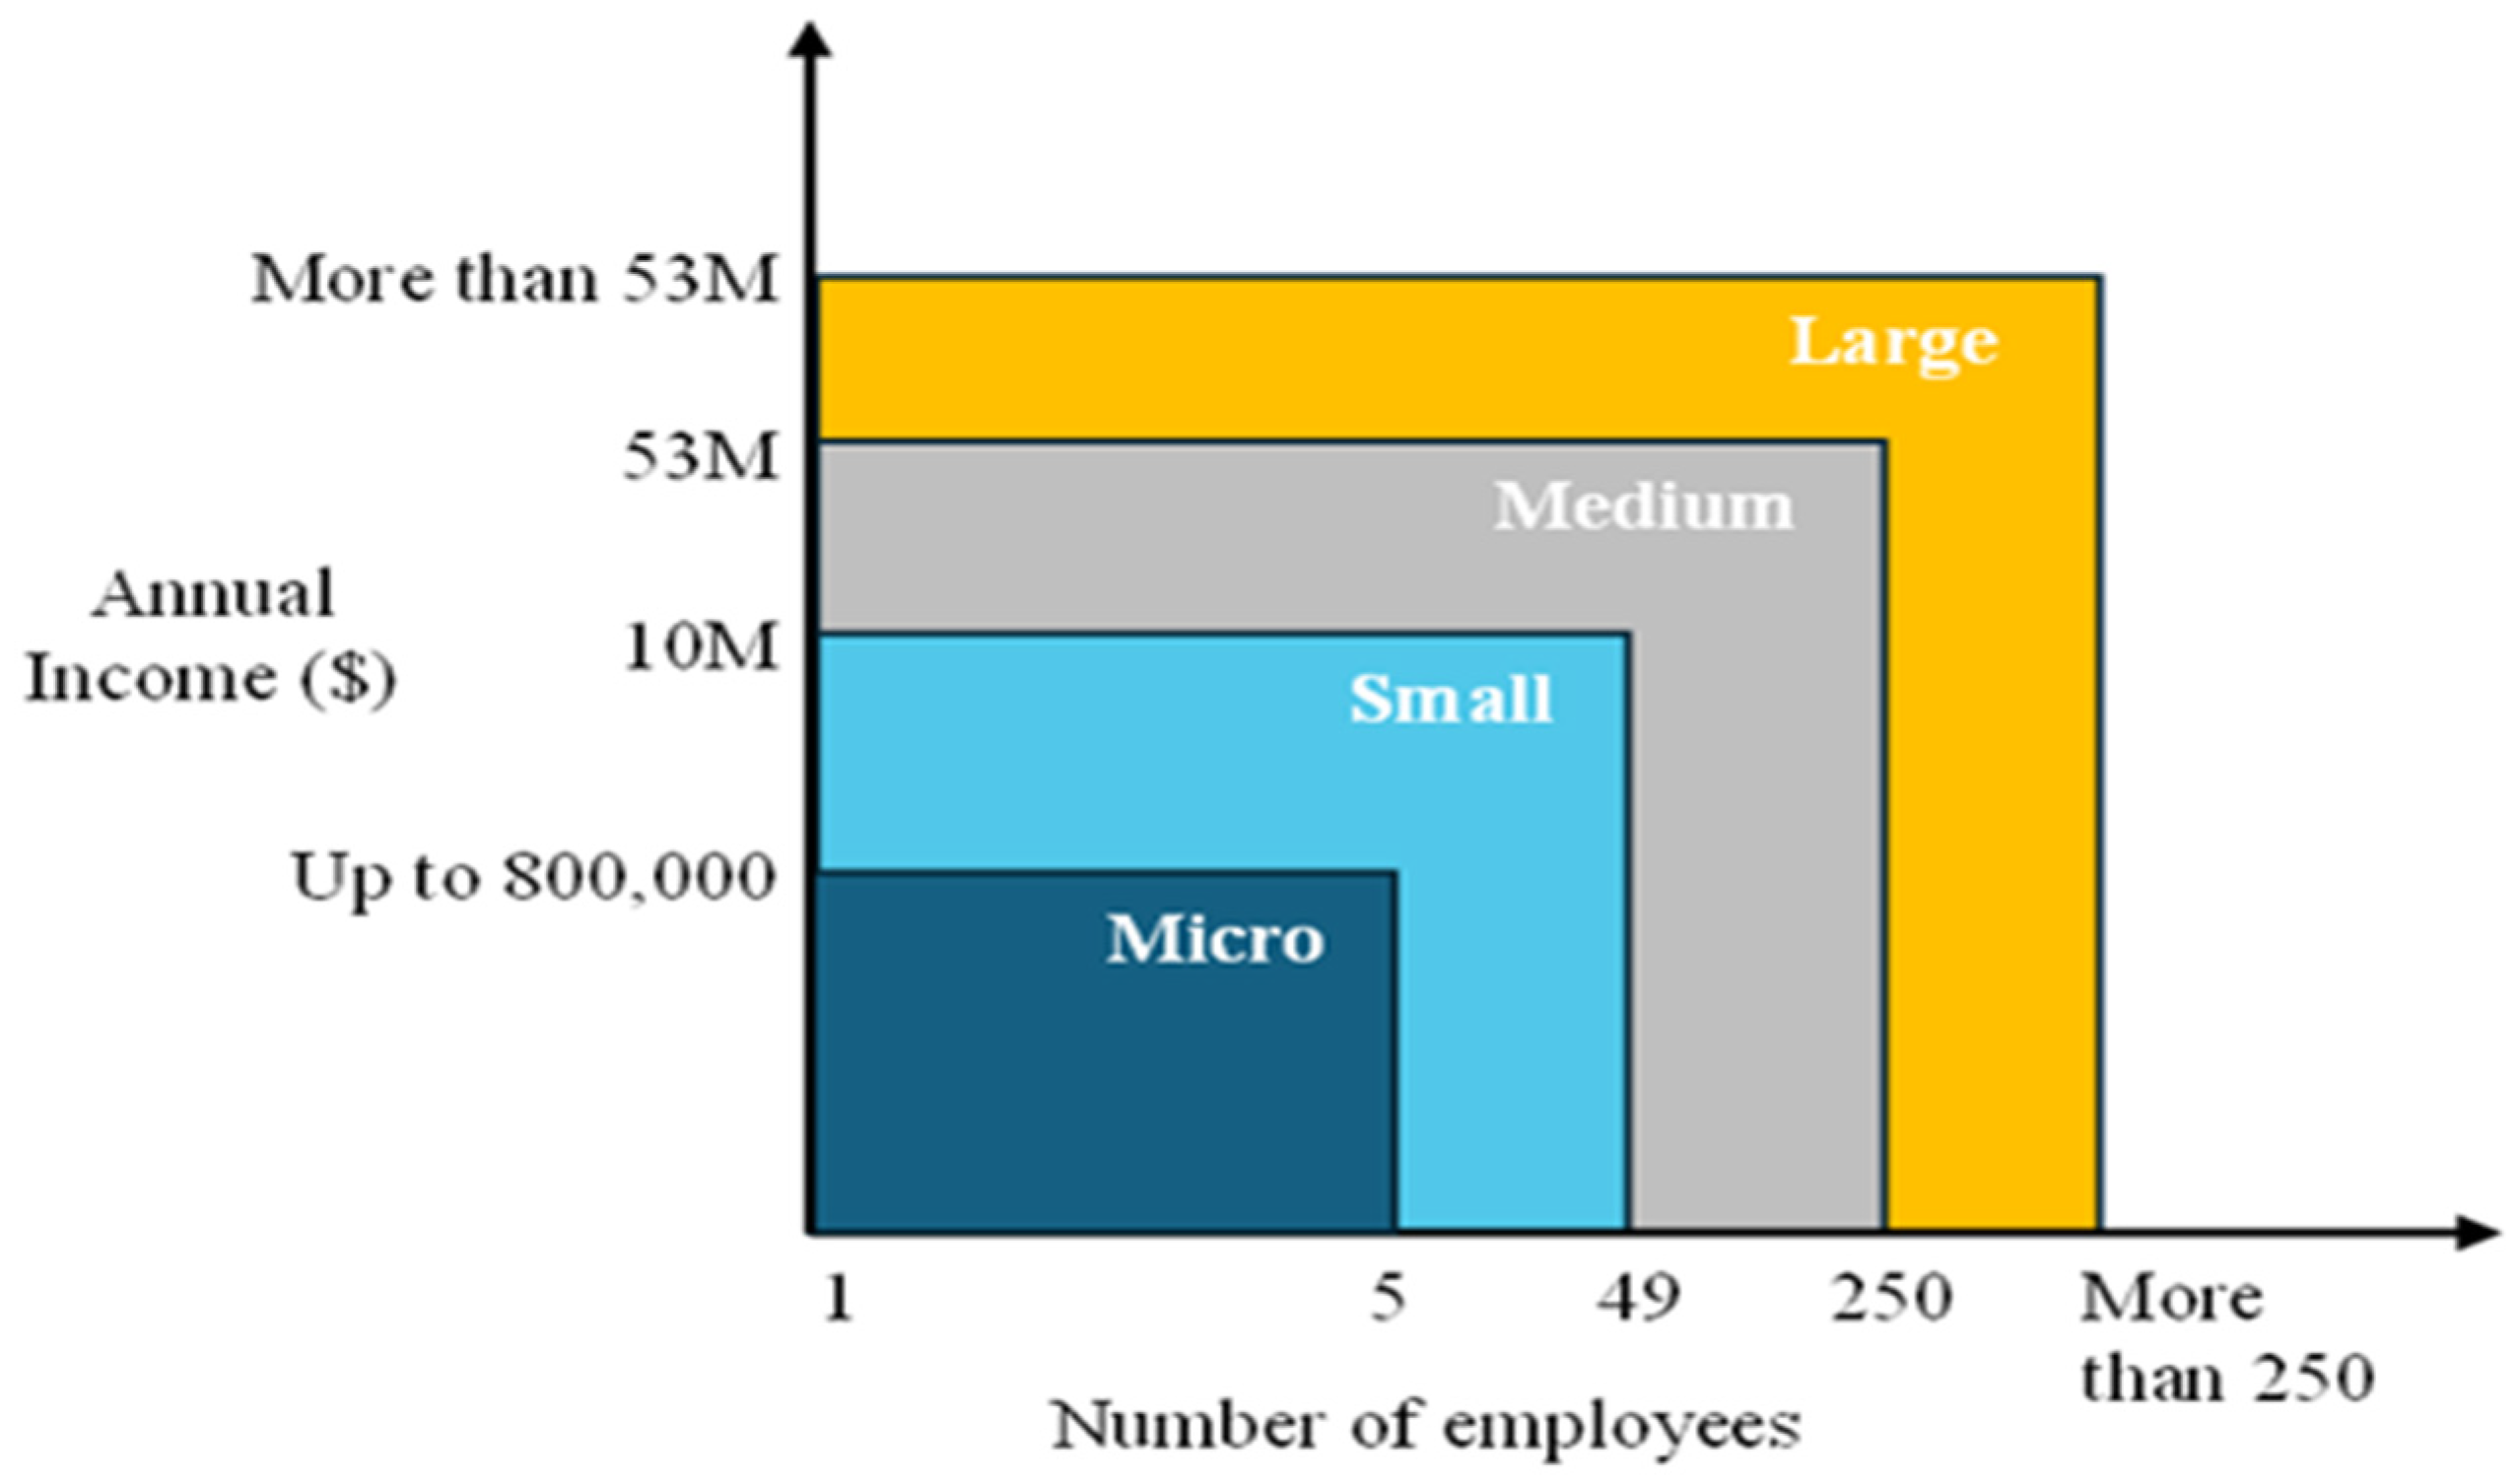
2.2. Small- and Medium-Sized Enterprises (SMEs) in Saudi Arabia

SMEs in Saudi Arabia have seen a remarkable transformation and significant growth due to the support programs provided by the government [25]. In 2016, the country introduced its 2030 vision to diversify its economy, reduce its dependence on oil revenue, and promote sustainable development [26]. To have a more diversified economy and less reliance on oil, one of the primary goals of Vision 2030 is to raise the percentage of non-oil exports in non-oil GDP from 16 to 50%. In terms of employment, the nation wants to bring Saudi Arabia’s unemployment rate down from about 12 to 7%. Along with raising the private sector’s GDP share from the current level of 40 to 65%, the vision calls for rising from 25th to among the top 10 in the global competitive index. One particular goal that is related to SMEs, is to increase the share of SMEs in the GDP from 20% to 35% [27]. This vision is based on empowering small and medium enterprises (SMEs) as key contributors to economic development, innovation, and job creators through fostering a vibrant entrepreneurial ecosystem [28].
According to Monsha’at, companies are classified based on their full-time employees’ numbers and revenue volume (see Figure 2). Based on the criteria identified, the number of employees in small businesses should be less than 50, and in medium-sized ones, less than 250 employees. On the other hand, revenue for small and medium-sized businesses should not exceed 40 million and 200 million, respectively. The data suggests that almost 1.2 million SMEs are operating in the Kingdom of Saudi Arabia, and SMEs are experiencing continuous growth [13].
The SME sector in Saudi Arabia is becoming a driving force across many industries and sectors, including tourism, e-commerce, retail, food and beverage, and fintech. Given the vast and diverse geography of Saudi Arabia, data suggest that 41.4 percent of these SMEs are located in Riyadh, which is followed by Makkah at 18.1 percent, demonstrating the geographic variety of entrepreneurship [13].
In regards to government support, Saudi Arabia strategically tries to improve the SMEs’ competency and business environment [29]. These steps include establishing the SME Bank which focuses on boosting the SME sector’s contribution to GDP and the BIBAN forum (Saudi Arabia’s largest start-up, SME, and entrepreneurship conference) dedicated to developing a robust climate for SMEs. The government’s dedication to developing SMEs as a vibrant economic sector completely aligns with Vision 2030 objectives, as Saudi Arabia is seeking to reduce its economic dependence by greatly increasing its GDP, lowering unemployment rates, increasing women’s involvement in the workforce, and being a blooming center for entrepreneurial endeavors [30]. The Saudi government’s persistent support for SMEs can change the country’s economic landscape and advance it closer to the lofty objectives of Vision 2030 [31].
SMEs have an essential role to play in achieving the goals of the Saudi economy, which contributes to the diversification of production and employment of citizens affecting the future of the kingdom and its youth. Small- and medium-sized enterprises (SMEs) are a vital component of the country’s economy for several reasons, including their potential to provide employment opportunities and reduce unemployment rates, particularly among the youth, relieving pressure from the public sector [32]. The latest data available in October 2021 showed that approximately five million individuals were employed by SMEs in the Kingdom. These companies employ 62% of the total workforce in the private sector and contribute to reducing unemployment rates in the country [33]. With the increasing use of technology and globalization, competition among Saudi Arabian SMEs has intensified. As a result, many of these businesses have turned to innovative strategies and technologies to offer unique products and services and remain competitive in the market [34]. In light of these factors, SMEs in Saudi Arabia are constantly working to manage their operations effectively and keep up with the ever-evolving information technology landscape to gain a competitive edge.
Previous studies in Saudi Arabia have discussed factors that might affect technology adoption in SMEs. These studies have revealed the complex interplay between external financing avenues and internal organizational dynamics in shaping SMEs’ technological adoption and business performance. Alshebami’s [35] investigation into the crowdfunding landscape shows how performance expectancy, social influence, and trust significantly drive young entrepreneurs toward these platforms. The study suggests that alternative financing can crucially support SMEs’ endeavors to integrate advanced technologies and sustainable practices, which may enable SMEs to overcome the initial capital challenge associated with adopting big data analytics. Another study has shed light on how internal factors may interact to influence SMEs’ economic outcomes. Integrating sustainable practices and technologies within business processes is not merely a financial challenge but also a matter of promoting an innovative and entrepreneurial culture within the firm. The emphasis on green innovation aligns with the global push towards sustainability, indicating that SMEs’ focus on environmental innovations can significantly contribute to their competitive advantage and performance in the market [36].
Although prior studies have highlighted the importance of external financial factors and internal organizational dynamics, there is a lack of research focusing on the nuanced interplay of internal organizational aspects that directly influence technology adoption decisions. Furthermore, while the external mechanisms and the broader entrepreneurial ecosystem’s influence on SMEs’ technological and innovative capacities have been documented, the specific internal organizational requirements for leveraging BDA for enhanced competitiveness and sustainability in business performance have not been adequately addressed. This study aims to fill this gap by offering insights into the critical internal mechanisms that enable or hinder the effective integration of big data analytics and sustainable technologies in SMEs operating within the complex and competitive Saudi Arabian business environment.

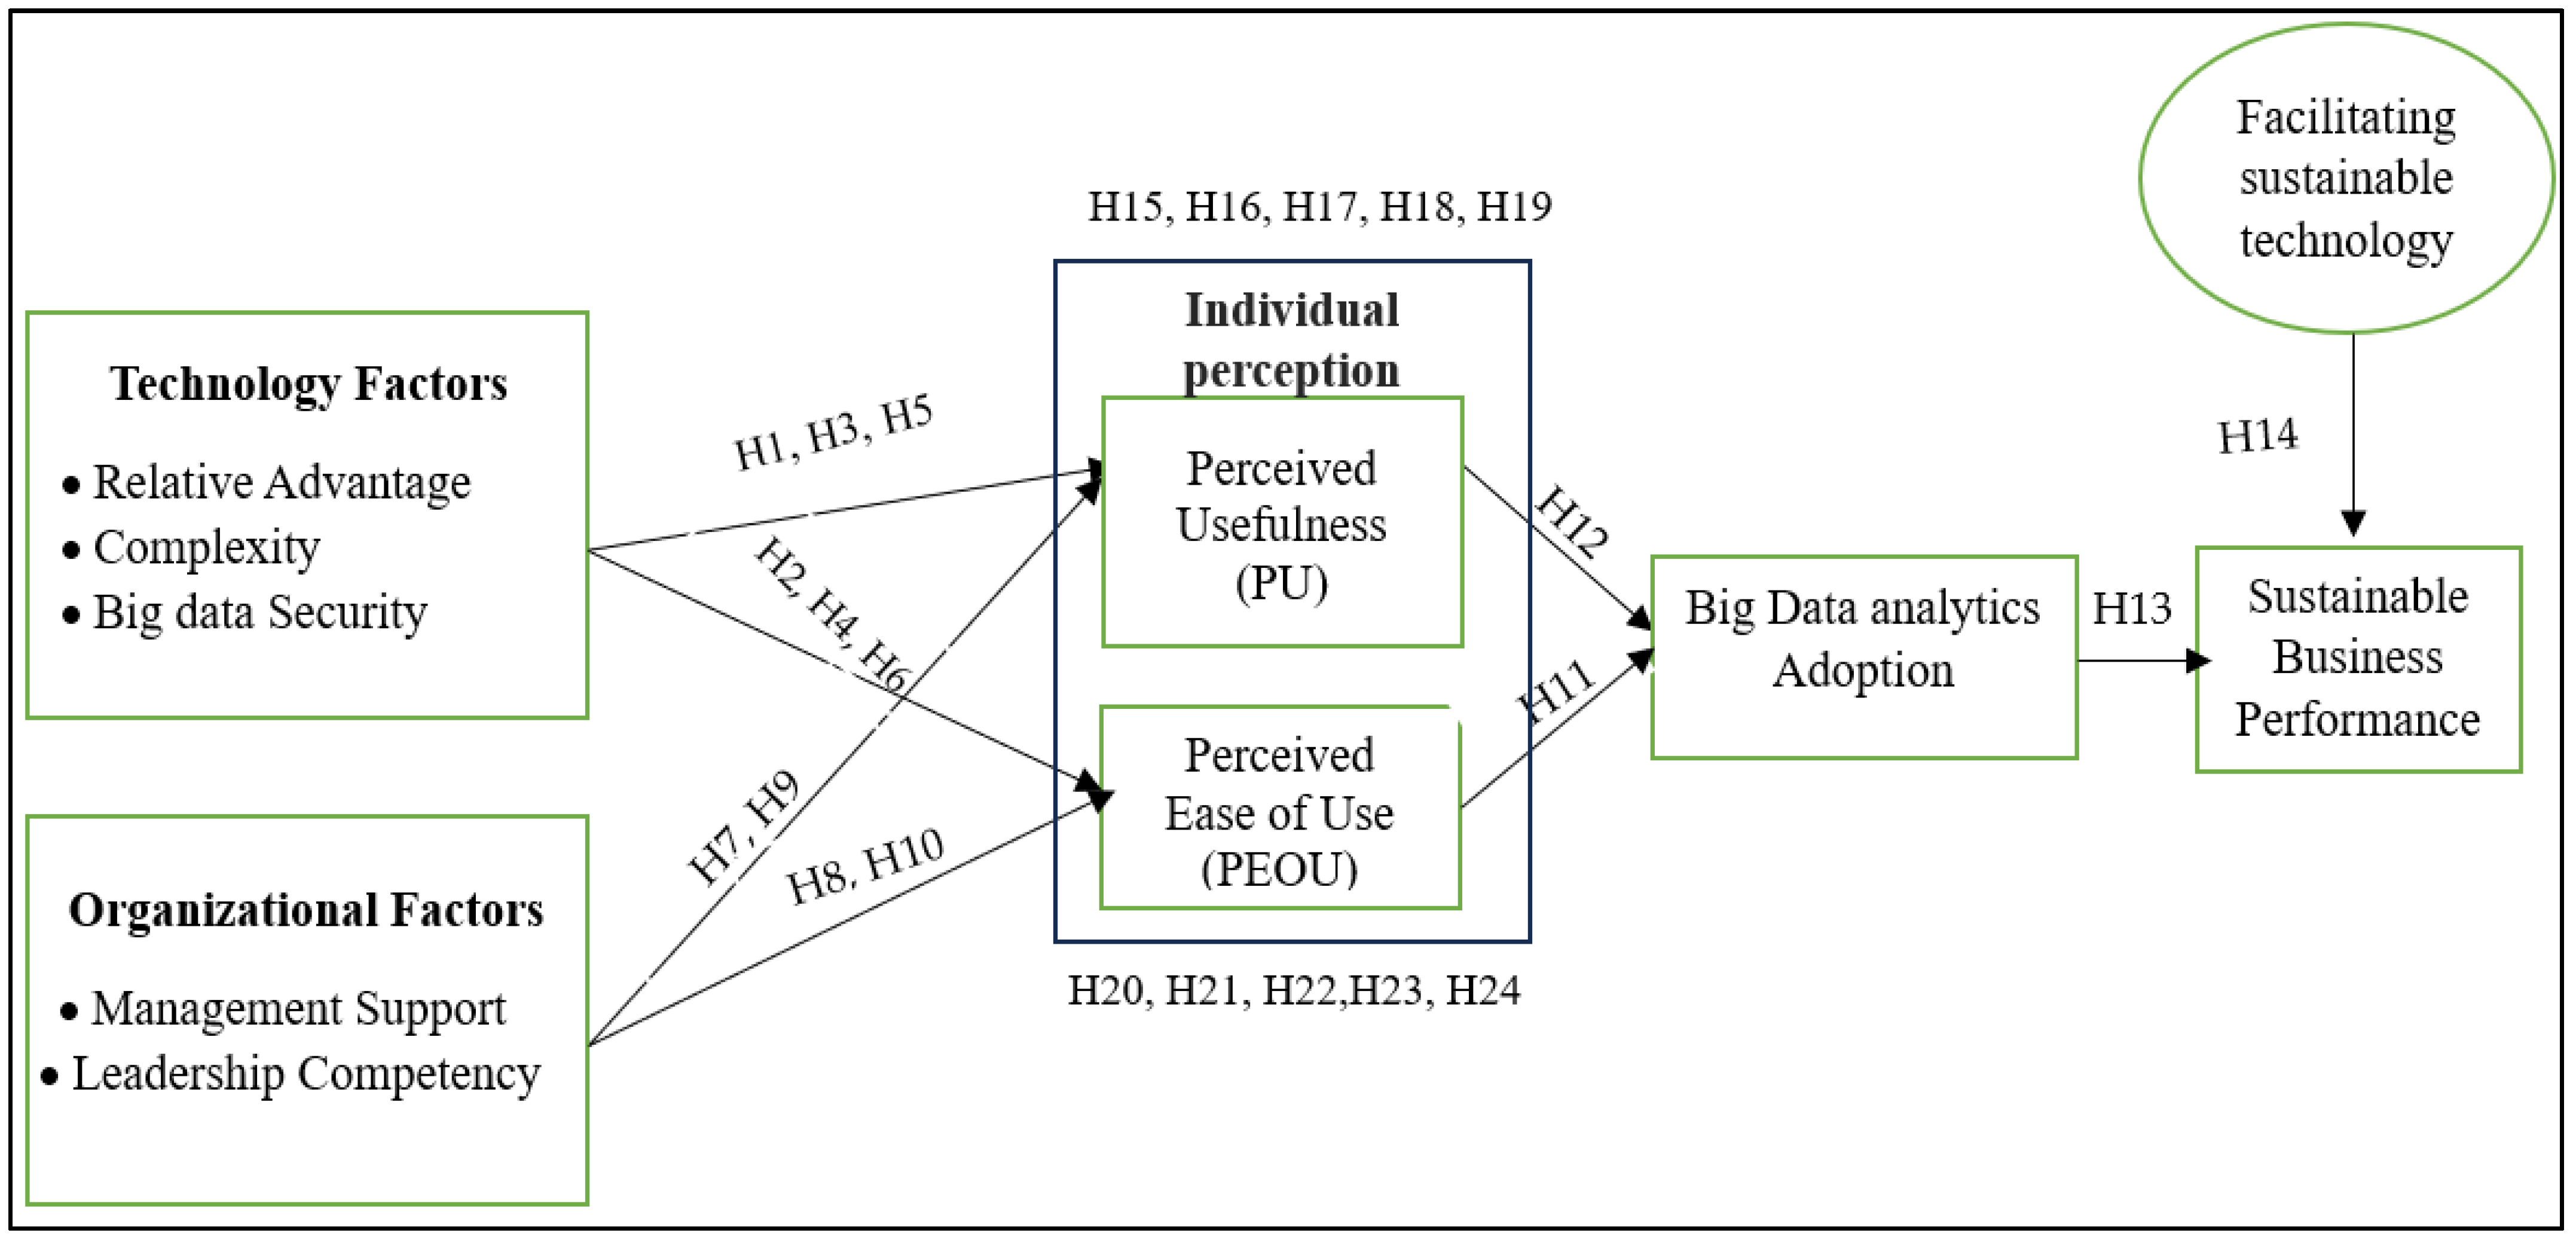
2.3. Theoretical Background and Proposed Framework

The adoption of any innovation or technology depends on individual and/or organizational levels to initially accept and/or use the innovation to solve problems [6]. Several theories and models have been employed by scholars to study technology adoption and use [6,7,8]. This study will integrate the Technology Acceptance Model (TAM) and the technology–organization–environment (TOE) framework to understand SMEs’ adoption of BDA in Saudi Arabia.

2.3.1. Technology Acceptance Model (TAM)

TAM evolved as a leading model in explaining and predicting technology adoption. TAM is one of the key theoretical frameworks in information system research used by organizations to study technology such as BDA [37,38]. TAM theorizes that behavior plays a central role in any adoption of technology [38]. Venkatesh [38] further illustrated the work of Davis [39] by incorporating the key elements of perceived usefulness (PU) and perceived ease of use (PEOU) as key elements driving the adoption and acceptance of a technology. TAM offers a structured prism through which SMEs’ readiness and intention to adopt technology such as BDA can be assessed and understood [37,40]. TAM provides a theoretical lens that enables us to dive into the key factors driving SMEs’ decisions to integrate BDA into their operations. According to Verma et al. [37], the characteristics of the big data analytics system have a significant impact on belief in the benefits of big data analytics and PU. Taking into consideration the research from Okcu et al. [40], one can conclude that BDA should be exploited as a competitive asset to reduce uncertainty in decision-making and to improve organizational competitiveness.

2.3.2. Technological, Organizational and Environmental (TOE) Framework

The TOE framework provides a superior theoretical base for studying technology adoption and use [8,41,42]. TOE is believed to be the most prevalent for adoption in enterprise contexts [8] because it suggested generic determinants that provide more significant perspectives for examining users’ viewpoints regarding particular systems or technology. TOE framework examines the factors that influence the adoption and diffusion of emerging innovations at three levels: technological, organizational, and environmental [43]. The technological aspect includes technological competence and technological assets; the organizational context includes organizational culture, organizational structure, and upper management team; and the environmental level places more emphasis on how external factors such as market conditions and competition affect businesses [43].
The research framework integrates TAM and TOE, supporting BDA adoption in SMEs. These theories shed light on different adoption factors, and when combined, they form a robust model to understand the many factors that influence SMEs to adopt BDA technology. Appendix A summarizes prior theoretical models pertaining to small and medium enterprises in several developing countries.

2.4. Technological Factors

The organizational adoption of BDA depends upon the technological factors concerning BDA. The technological factors that impact the organization’s adoption of technology and innovation are generally derived from Rogers’ innovation diffusion theory [44]. Rogers’ theory, which was originally developed in the 1960s, is still a widely used theory to study and understand technology adoption [5]. According to Rogers [45], “a technology is a design for instrumental action that reduces the uncertainty in the cause-effect relationships involved in achieving a desired outcome” (p. 13). Therefore, given the benefits of reducing uncertainty and enhancing the performance of said objectives and goals, it becomes extremely attractive for organizations and individuals to adopt the technology. This section discusses several technological factors that might influence technology adoption in organizations including relative advantage, complexity and big data security.
The relative advantage (RA) is considered the key factor derived from DIT regarding technology adoption by organizations [10,46]. RA is the extent to which an organization perceives a particular technology or innovation, such as BDA, to be effective and superior to existing technology and innovation [45,47]. The measurement of RA by the company can take the form of many standards or benchmarks, such as economics [10], productivity [47], customer satisfaction [48], and relative competitiveness [49]. Thus, organizations are more likely to adopt innovations and technologies that offer the organization potential in terms of product efficiency, effectiveness, and higher overall benefits [41]. Furthermore, RA also facilitates the organization’s decision-making ability regarding technology adoption by focusing on the associated strategic aspects [50]. Technology such as BDA is critical to achieving strategic goals in the digital and AI era [7]. Therefore, adopting BDA can help organizations stand out among competitors and realize their strategic vision more effectively [51]. This study offers the following research hypotheses based on this literature evidence:
Hypothesis H1. 
RA significantly influences the PU of BDA adoption.
Hypothesis H2. 
RA significantly influences the PEOU of BDA adoption.
The complexity of technology and innovation, such as BDA, is how much technology and innovation are perceived as ambitious or challenging to adopt and implement in an organization [45,47]. The diffusion of innovation considers the complexity of technology, a key factor behind organizations’ intention to adopt technology [52,53]. Every technology and innovation presents a management challenge [54]. The changes are proposed to be implemented in the process, workflow, organizational structure, or overall culture [55]. Thus, technologies and innovations with fewer change management challenges are easy to implement and adopt [56]. However, complex and sophisticated technologies, such as BDA, are perceived to be more complex [57]. Empirical research has already demonstrated the negative relationship between BDA and its adoption [4]. Moreover, BDA technology adoption may depend upon the usefulness factor [58,59]. It is argued that BDA is a highly useful capability for organizations in the era of AI and digitization [60]. Organizations can generate highly effective insights from BDA, which can be used to maximize customer value and profits [61,62]. Further, with recent changes in the skill composition of the labor market [9,63], BDA can be perceived as easy to implement [64]. Therefore, we propose the following hypotheses for this research study:
Hypothesis H3. 
Complexity significantly influences PU of BDA adoption.
Hypothesis H4. 
Complexity significantly influences the PEOU of BDA adoption.
Security refers to protecting the organization’s data, information, and other digital assets from being attacked as part of a cybercrime operation [65]. The attack can include the loss or theft of critical information about consumers, suppliers, internal work, and other important aspects of an organization’s operations [66]. The lack of security and information integrity may result in the infringement of consumer rights by manipulating consumers’ privacy and secret information [67]. Therefore, to protect consumer privacy and the organization’s important information assets, it is necessary to implement resources, infrastructure, and personnel to protect an organization’s information security and integrity [68]. In the age of big data, the security of an organization has taken considerable importance [69]. Big data presents valuable resources to organizations in terms of insights that can be used to maximize perceived value and important resources to improve the business model [70]. Still, consumer privacy, sanctioned and protected by the rule of law worldwide, also presents a significant challenge [71]. Thus, it is essential for organizations to continuously invest in resources that promise integrity and security of information [72]. Consistent with that, big data infrastructure, which includes storing data using cloud computing infrastructure, is more secure than traditional in-house servers maintained by organizations [73]. Cloud computing solutions harmonize with big data by helping firms store data in large quantities and undertaking analytics to generate helpful insights. Still, it also provides an effective solution to protect the integrity and security of the data and information [74]. Thus, it can be argued that BDA technology has made the data easier to collect and store and is very helpful in using various solutions, such as cloud computing. Thus, the research study develops the following research hypotheses:
Hypothesis H5. 
BDS significantly influences the PU of BDA adoption.
Hypothesis H6. 
BDS significantly influences the PEOU of BDA adoption.

2.5. Organizational Factors

Organizational factors play a pivotal role in the successful adoption and utilization of big data analytics (BDA) within organizations. This section discusses some of these factors including management support and leadership competency that may influence the technology’s perceived usefulness and ease of use.
Management support (MS) refers to the level of understanding and commitment of an organization’s top management towards BDA [75,76]. It is critical for implementing strategic changes within an organization, as it enables the investment of necessary resources such as technology and innovation [77]. Further, the top management of any organization possesses leadership capabilities, and leadership is essential for motivating the rest of the organization to adopt any particular change easily, such as BDA [76]. Further, top management’s support is also necessary in strategically using the new technology and innovation to maximize its benefits [78]. Thus, in the case of BDA, top management’s support can result in the vision of its effective perceived ease of use and perceived usefulness in the range of activities, which can include business model innovation, improving products, services, and processes, and utilizing consumer data to derive meaningful insights for maximizing the value of the customers. Thus, this study presents the following research hypotheses:
Hypothesis H7. 
MS significantly influences the PU of BDA adoption.
Hypothesis H8. 
MS significantly influences the PEOU of BDA adoption.
Leadership competency (LC) is defined as a manager’s understanding of information technology and systems, which enables them to understand and sense the changing information technology and system-related landscape, and resulting opportunities and challenges [79]. Information technology and systems self-efficacy allows managers to comprehend the opportunities BDA provides to SMEs and utilize their technology infrastructure to implement and adopt technology into the organizations [80]. Those leaders of SME organizations who possess high competency in information system technology are better positioned to leverage the BDA more effectively than those with less big data-related competency. Further, leaders with BDA-related competencies will be better able to communicate the advantages and insights generated by using BDA technology [81] to all stakeholders. Leaders with high big data competency will employ it to solve various problems in organizations and tap any existing opportunity by undertaking data-driven decisions [3]. At the same time, leaders with a higher BDA-related competency will employ it more frequently and confidently to undertake data-driven, impactful choices [82]. Thus, the following research hypotheses are offered by this study:
Hypothesis H9. 
LC significantly influences the PU of BDA adoption.
Hypothesis H10. 
LC significantly influences the PEOU of BDA adoption.

2.6. Individual Perception

Individual perception in the adoption of new technology pertains to how individuals’ beliefs and responses to a specific technology or innovation and the impact of the technology on their decision to accept or decline it [83]. Individuals are more inclined to adopt a technology if they view it as advantageous and worthwhile. In fact, if individuals do not perceive the technology as beneficial or relevant to their requirements, they are unlikely to adopt it. Perceived ease of use (PEOU) and perceived usefulness (PU) are key determinants of the TAM model that capture users’ perception. PEOU can be defined as an organization’s subjective assessment of technology that is easy to use and utilize to solve problems, tap opportunities, and integrate into the organization’s system and value chain [59,83]. PEOU can be considered a technology that is simplistic, convenient, and easy to learn and implement in the system [83]. PEOU is significant in adopting big data and analytics as it determines its successful integration into the organization’s value chain [59]. The perception of the user-friendliness, accessibility, and manageability of big data tools can significantly impact their willingness to be adopted and implemented in various activities [82]. Thus, it is very important to design BDA tools to be highly user-friendly with a user-centric approach [84]. As a result, more stakeholders, including non-technical professionals, are given the ability to exploit the potential of data-driven insights. Further, the BDA’s PEOU is becoming increasingly critical as it develops and becomes more widely available [85], which leads to the extraction of actionable intelligence from their massive datasets that ultimately foster innovation and informed decision-making [86]. Perceived usefulness (PU) can be better described as an organization’s assessment of technology as being highly effective and likely to enhance the overall performance and productivity of the company [83,87]. PU is also the organization’s subjective assessment of technology as valuable, beneficial, and potentially solving major problems it is facing [47,88]. PU is reported to be an important factor in the widespread adoption of various novel technologies, such as BDA [37]. BDA benefits organizations by revealing significant trends, patterns, and insights from consumer and organizational data that would otherwise go unnoticed [52]. The organization can use these insights to gain a competitive edge, make better decisions, increase operational effectiveness, and improve consumer experiences and overall organizational performance [89]. BDA fosters a data-driven culture where all of the organization’s stakeholders embrace the potential of data to accomplish strategic goals and spur innovation [40]. Thus, the perceived value of BDA remains crucial in how well it is integrated into routine tasks and decision-making processes as businesses continue to employ it [90]. Therefore, the study offers the following research hypotheses:
Hypothesis H11. 
PEOU significantly influences BDA adoption.
Hypothesis H12. 
PU significantly influences BDA adoption.

2.7. The Adoption of BDA and Sustainable Business Performance

BDA technology is highly promising for organizations, especially SMEs [2,3]. The data and resulting insights are essential in corporate and strategic decision-making [3,63]. It has been believed even before the onset of BDA technology that data-driven decisions have a lasting impact on the positive performance of the organization [91]. Managers have regarded data-driven decisions positively, as they have helped them achieve the intended objectives [92]. BDA technology has presented various dynamic opportunities to organizations, especially SMEs, defined by resource constraints, to leverage their power by developing strategic frameworks to compete in the dynamic market [8]. The big data and resulting insights will be crucial for SMEs to continuously improve their products, services, and processes to maximize their perceived value in customers’ minds [93]. Further, BDA provides high probabilistic predictions of future industry and market trends that can play a critical role in realizing SMEs’ strategic objectives and long-term performance [94]. Thus, it becomes pertinent for SMEs to make a timely decision to adopt, integrate, and implement BDA technology, tools, and infrastructure to collect, store, and synthesize the insights that BDA offers [95]. Further, continuous use and experience with big data and analytics would make it easier for SMEs to leverage them to foster innovation, productivity, and organizational performance [30] continuously. Therefore, the study offers the following research hypothesis:
Hypothesis H13. 
The adoption of BDA significantly influences sustainable business performance.

2.8. Facilitating Sustainable Technology and Sustainable Business Performance

Facilitating sustainable technology (FST) can best be described as an organization’s ability to leverage the power of new technologies, such as BDA, to achieve its strategic objectives and gain a competitive advantage in the market [96]. At its core, FST shows an organization’s understanding of the power of BDA and the benefits it can bring to the organization in various aspects [96]. FST involves not only ordinary familiarity with technological trends but also in-depth understanding and assessment regarding the adoption and integration of pertinent technologies [15]. It also encompasses the understanding and evaluation of both general and specific infrastructure, tools, investment, and skills required to adopt and implement sustainable technologies [97]. Moreover, FST recognizes that technology is constantly evolving, necessitating the organization’s capacity to adapt quickly and promote creativity within this dynamic context [98]. Furthermore, FST can directly enhance organizational performance by understanding the role and power that BDA can play in leveraging the organization, its infrastructure, and other critical aspects. Therefore, the following research hypotheses are offered:
Hypothesis H14. 
FST significantly influences sustainable business performance.

2.9. The Mediation Effect of Users’ Perception of Technological and Organizational Contexts on the Adoption of Big Data Analytics

Numerous studies have shown the significance of relative advantage in facilitating technology and innovation adoption. Alam et al. [99] highlighted the significance of relative advantage and discovered that this factor has a significant relationship with the adoption of e-commerce in SMEs. Prause [100] argued that the complexity issue related to IT infrastructure must be addressed by evaluating the external organizational context to suppliers, customers, or governmental authorities in terms of efficiency gains or possible constraints from the adopted innovation. Additionally, Nasrollahi et al. [20] argued that even though the advantages of big data adoption can enhance the effectiveness of businesses and individuals, issues regarding security and privacy continue to impede its adoption. This suggests that in the adoption of big data in organizations, privacy and security monitoring methods for data administration and storage should be addressed, especially in the context of developing countries such as Saudi Arabian SMEs. Management support is crucial in SMEs. In fact, SMEs decision-makers are typically part of a top-management team, and their dedication and endorsement are crucial for the successful adoption of innovation. Attempting to identify the factors influencing big data analytics in Jordan, Lutfi et al. [19] emphasized the importance of top-management support in adopting big data. In their article from 2020, Hernandez-de-Menendez et al. [101] discussed the essential competencies required for Industry 4.0. Leader competency for Industry 4.0 requires knowledge that adds value collaboratively in various disciplinary domains. In fact, leaders in SMEs need to acquire new competencies and continually attend training programs to develop their competencies [101].
Chemjor et al. [102] conducted an explanatory research design to examine the mediation effect of PU and PEOU on the relationship between technology context and cloud computing adoption. The findings of the study have shown that PEOU and PU have an impact on the relationship between technology context and the acceptance of information technology.
Nuryyev et al. [103] extended the theoretical foundations of the TAM to examine the factors influencing the intention to adopt cryptocurrency payments among SMEs. Moreover, the study took into consideration the mediating effect of PU and PEOU and their influence on the intention to adopt cryptocurrency payment. Big data analytics can enhance the financial and market performance of Saudi SMEs effectively by having an effective combination of business talent and management skills to use data in new ways and achieve victory in the economic competition. Based on the evidence from the literature, the current study suggests the following research hypotheses:
Hypothesis H15. 
PU significantly mediates the relationship between relative advantage and big data analytics adoption in Saudi Arabian SMEs.
Hypothesis H16. 
PU significantly mediates the relationship between complexity and big data analytics adoption in Saudi Arabian SMEs.
Hypothesis H17. 
PU significantly mediates the relationship between big data security and big data analytics adoption in Saudi Arabian SMEs.
Hypothesis H18. 
PU significantly mediates the relationship between management support and big data analytics adoption in Saudi Arabian SMEs.
Hypothesis H19. 
PU significantly mediates the relationship between leadership competency and big data analytics adoption in Saudi Arabian SMEs.
Hypothesis H20. 
PEOU significantly mediates the relationship between relative advantage and big data analytics adoption in Saudi Arabian SMEs.
Hypothesis H21. 
PEOU significantly mediates the relationship between complexity and big data analytics adoption in Saudi Arabian SMEs.
Hypothesis H22. 
PEOU significantly mediates the relationship between big data security and big data analytics adoption in Saudi Arabian SMEs.
Hypothesis H23. 
PEOU significantly mediates the relationship between management support and big data analytics adoption in Saudi Arabian SMEs.
Hypothesis H24. 
PEOU significantly mediates the relationship between leadership competency and big data analytics adoption in Saudi Arabian SMEs.
The study develops a conceptual framework, as shown in Figure 3.

3. Research Methodology

3.1. Research Design

BDA provides an immense amount of opportunities for SMEs to leverage their power by enhancing customer-perceived value and organizations’ performance [2]. Thus, the purpose of this research study is to comprehensively understand the factors that foster SMEs’ adoption of BDA. By combining the insights from both technology acceptance and innovation diffusion theories, the conceptual framework has been carefully crafted [34,80]. This approach ensures that the resulting framework is comprehensive and effective in addressing the challenges at hand. Consistent with the aim, this study has employed a quantitative research design to understand the impact of technology and organizational-driven factors on the SMEs’ adoption of BDA through PEOU and PU [38]. The survey questionnaire has been used in this study as a data collection tool. As a matter of fact, the survey questionnaire approach is especially helpful in establishing a standard for the measurement of perceptions, attitudes, and behaviors, which facilitates the generalizability of results [54]. Research methodology based on survey questionnaires was employed in this study, which allowed researchers to analyze relationships between constructs and test hypotheses empirically. Studies on technology adoption have shown the effectiveness of this approach [54,82]. This study used PLS-SEM for data analysis [95].

3.2. Population and Sampling

The SMEs operating within Saudi Arabia are the population under study. We targeted SMEs’ top managers and IT experts who are responsible for undertaking big data technology adoption decisions. In fact, top managers, including CEOs, CFOs, and other senior executives, are responsible for setting strategic direction, allocating resources for technological investments, and fostering a culture that embraces digital transformation. IT experts, on the other hand, are tasked with assessing the feasibility of BDA integration, managing the implementation process, ensuring data security and training staff to effectively use the technology. Given the sizable number of SMEs, this study employed convenience sampling techniques in order to target managers who are both responsible for technology-related choices and looking to implement BDA in their organizations.
Respondents were given assurances that the research is meant for academic purposes; that their responses are not about being right or wrong, and their responses are confidential. Efforts were also made to improve the scale of the items. This was achieved by avoiding vague concepts in the questionnaire and the survey was written in simple, specific, and concise language.
The software G*power 3.1 was used to calculate the appropriate sample size for this research [94]. Four hundred (400) surveys were disseminated through several means of contact, such as emails and internal company communication platforms, social media and industry forums, to reach a diverse audience. In total, 292 responses were received (73% response rate). The returned questionnaires with incomplete or missing items were removed from the sample. The final sample size was 282 (70%). We used Google Docs to create the survey questionnaire due to its user-friendly design, easy accessibility, and powerful data management features.

3.3. Survey Instruments

The measurement scales used in the current study are modified from earlier investigations. The study includes several constructs, each of which was defined by a certain number of items taken from reputable scholarly sources. Four items are used for both RA and complexity; the first comes exclusively from Lian et al. [104], while the second comes from Chen et al. [70], Thompson et al. [105], and Agrawal [106]. MS makes use of three items cited in research by Thompson et al. [105] and Chen et al. [70]. Both PEOU and PU utilize six items, each sourced from Davis [83] and Shabbir and Gardezi [107]. The FTC includes three items sourced from Venkatesh et al. [38] and Ahmad et al. [108]. Both BDS and BDA adoption utilize two items each, the former solely from Rajan and Baral [109] and the latter combining insights from Suh and Han [110]. Lastly, there are nine items in the LC derived from the work of Compeau and Higgins [111] and Kwiotkowska et al. [112]. These constructs offer an organized method for examining BDA adoption, as do the items they are linked with, all of which have their roots in scholarly sources. The measurements of the research variables and their sources are presented in Appendix B.

3.4. Data Analysis Techniques

This study has employed the data analysis techniques of PLS-SEM using the software packages of SmartPLS 4.0 [113]. The PLS-SEM is a multiple regression technique that is being widely used by researchers within the organizational behavior, technology adoption, and management domains [114]. Moreover, PLS-SEM is a causal modeling approach and a sophisticated multivariate analysis technique that enables us to assess the complexity of the model and examine the validity of the theory using empirical models [115,116]. It is believed that the PLS-SEM method is oriented to elucidate the variance of the research model and to identify statistically significant constructs [116].
The results of PLS-SEM using SmartPLS 4.0 are generated as part of the measurement model and structural model [117,118]. The measurement model is applied to develop data and instrument reliability and validity to test the hypothesis and make predictions about the relationship enshrined in each hypothesis [117]. The structural model is applied to test the hypothesis based on the bootstrapping procedure of creating 5000 sub-samples of existing data [118].

4. Results

4.1. Demographic Information

Table 1 presents important information about the survey participants. Out of the total respondents, 64.9% are male and 35.1% are female. The data show that the majority of participants, amounting to 76.2%, hold bachelor’s degrees, which implies that a highly educated professional population took the survey. The study considered the category of the firms in the sector. The manufacturing sector constitutes 80.1% of the total respondents, while the wholesale and retail sectors comprise only 19.9%. Regarding positions, managers made up almost 79% of the participants, followed by directors, who accounted for 12.4%. The targeted firms had a minimum of 10 employees and a maximum of 250, in which small enterprises constitute 51% of the total respondents, while medium-sized enterprises comprise 49%.

4.2. Assessing Validity and Reliability

This study has employed PLS-SEM as a data analytical tool. As an analytical tool, PLS-SEM helps assess the construct’s reliability and validity [114]. The study assesses convergent validity, discriminant validity, and reliability. First, the study measures the convergent validity (factor loadings > 0.70, average variance extracted (AVE) > 0.50, and reliability (Cronbach alpha and compositive reliability > 0.70) [114,119]. When a construct strongly correlates with other measures of the same construct, it is said to have convergent validity [120]. The consistency of these measurements is referred to as reliability. According to Hair et al. [114], the items with outer loadings greater than 0.7 are typically regarded as adequate for demonstrating convergent validity. The majority of the items in the data meet this requirement, indicating strong convergent validity. Finally, Table 2 shows that factor loadings on all measurement scales are higher than 0.70. On the other hand, AVE values should be greater than 0.5, as cited in Hair et al. [117]. Convergent validity is further confirmed by all AVE values (e.g., complexity at 0.776, FTC at 0.763) above this cutoff (Table 2).
In order to be considered satisfactory for reliability, Cronbach’s alpha and composite reliability values must also be greater than 0.7 [107,109]. Having a high Cronbach’s alpha and composite reliability score indicates a high level of internal consistency and reliability. Table 2 confirms model reliability via high Cronbach’s alpha and composite reliability across constructs. Both convergent validity and reliability of the measurement model are strong. The AVE values for each construct are significantly above the 0.5 threshold, and most outer loadings are higher than the suggested threshold. Likewise, satisfactory Cronbach alpha and composite reliability values confirm the constructs’ reliability.

4.3. Discriminant Validity

This study has assessed discriminant validity, which refers to and is employed to determine that every construct is unique and measures its separate phenomena. It deploys PLS-SEM and SmartPLS 4.0 to assess discriminant validity using the heterotrait/monotrait ratio of correlations (HTMT). The HTMT helps researchers assess discriminant validity by evaluating the similarity between the construct of the conceptual model [120]. The literature suggests that an HTMT value of 0.85 can be considered as a particular construct that is significantly different and unique from others in the conceptual model [119]. The results of HTMT for this study are shown in Table 3. Given that every construct reports an HTMT value about other constructs that is less than or equal to 0.85, the results unequivocally demonstrate that each of the constructs in this study has achieved its discriminant validity.

4.4. Model Fitness

R-square (R2) refers to the determination of the predictive power of the conceptual model by assessing the extent to which each endogenous or independent variable in the study contributes variance to exogenous or dependent variables [117,119]. The literature suggests that to assess predictive power by contribution variance, the R2 measure is one of the most suitable [121,122]. Table 4 shows the R2 results, illustrating that PEOU and PU contribute to a 45.4% variance in the adoption of BDA. Further, RA, complexity, BDS, MS, and LC combined contribute a variance of 69.3% in PEOU and 62.8% in PU.
Model fitness is also defined as the ability of a conceptual model to match or fit with observable data. It assesses the degree to which the relationship between the variables in the conceptual model is well represented in the data [118]. While employing SmartPLS 4.0 software packages, this study has used standardized root mean square residual (SRMR) to gauge the model’s fitness. According to the literature, the SRMR value should be smaller than 0.08 to assume that the research model has attained fitness [123]. Given that the SRMR value is less than 0.08 (0.074) in Table 4, the findings demonstrate that the current study has reached its model fitness.

4.4.1. Structural Equation Modeling (SEM)

The structural model is the procedure in the PLS-SEM to test the hypothesis and calculate the effect size [117,119].
This study has employed the bootstrapping process by creating 5000 sub-samples to assess the research hypotheses.

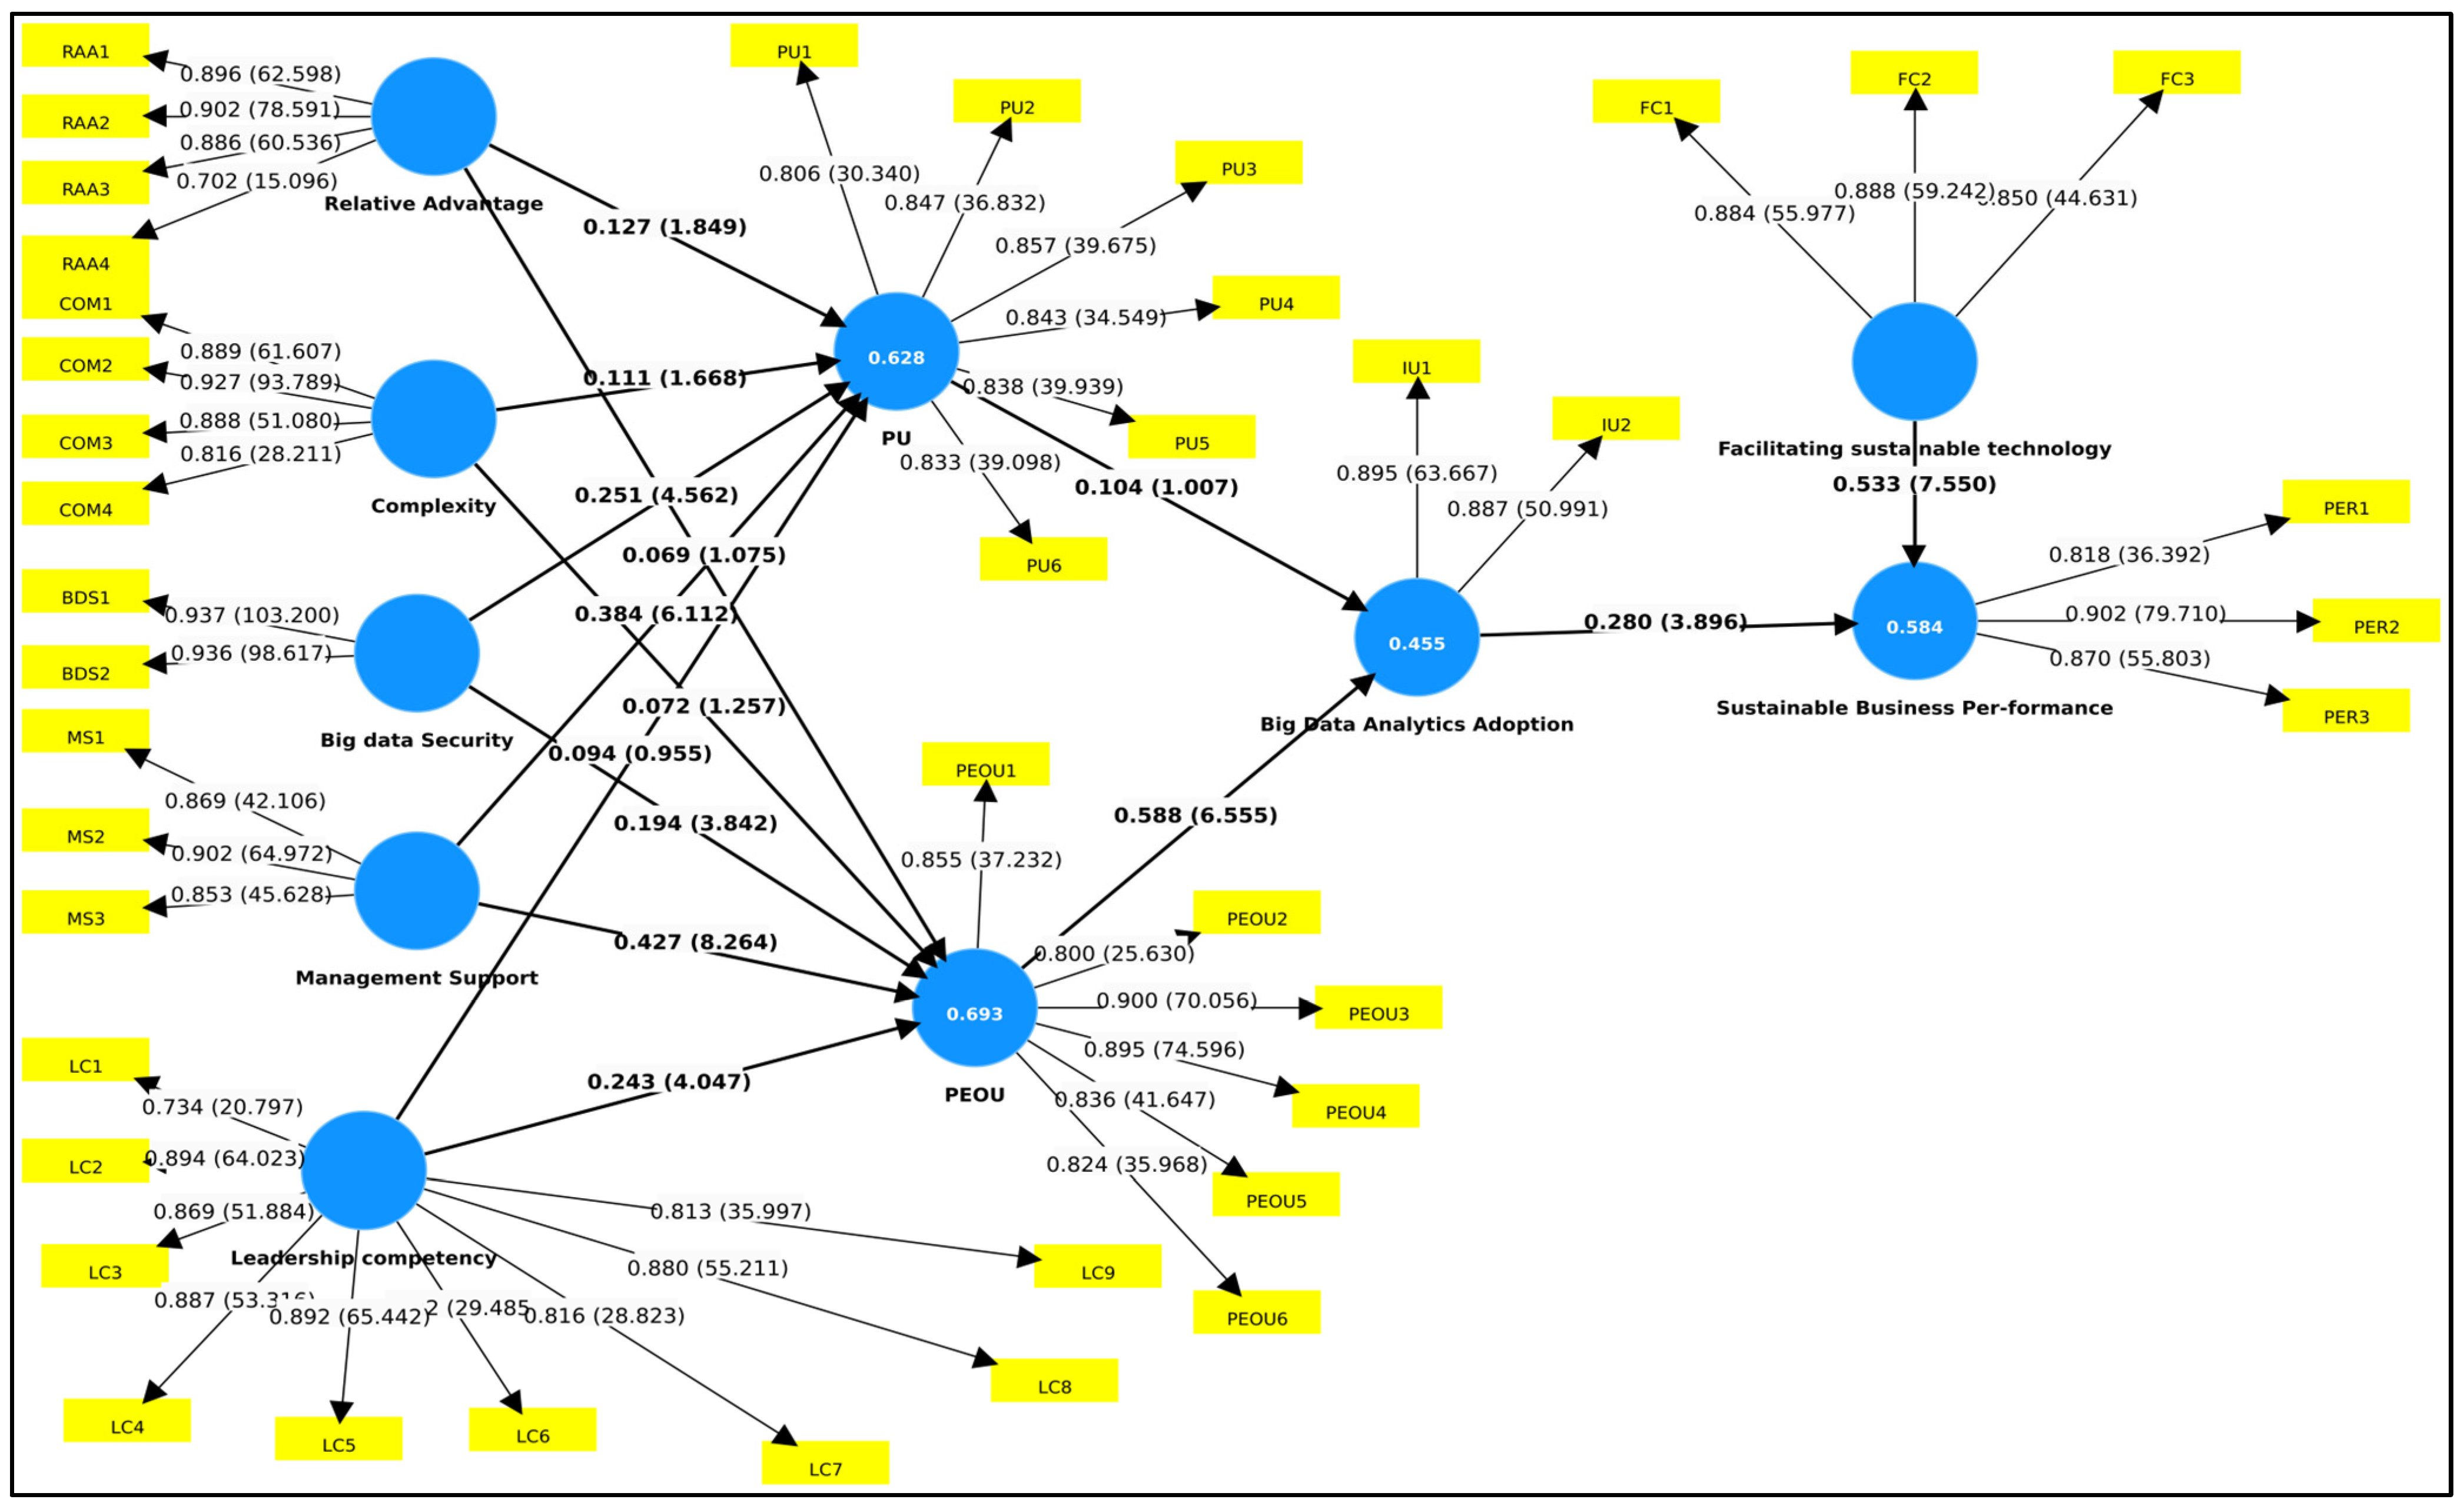
4.4.2. Assessing Path Model

The study used SEM analysis to test the research hypotheses (Table 5). The study used a 5% significance level with a 95% confidence interval. The value of p should be lower than 0.05 and the t-value should be greater than +1.96. The direct effects reveal the straightforward impact of one variable on another, uninfluenced by other intervening variables (Figure 4). Moreover, we tested the variance inflation factors (VIFs), which assess the amount of multicollinearity in a set of multiple regression variables. According to Hair et al. [124], collinearity occurs when there are high correlation coefficients between two indicators. High multi-collinearity impacts the estimation of weights and their statistical significance. As recommended by Hair et al. [122] the VIF scores have to be less than 5 and even less than 3.3 in PLS. Based on the initial analysis of possible collinearity, the VIF values corresponding to the hypotheses 1, 2, 3, 4, 8, 9, 10, 11, 12, 13 and 14, which were 2.558 for H1, 1.19 for H2, 1.754 for H3, 1.683 for H4, 2.422 for H5, 2.558 for H6, 1.19 for H7, 1.754 for H8, 1.683 for H9, 2.422 for H10, 2.792 for H11, 2.792 for H12, 2.237 for H13, and 2.237 for H14 were less than 3.3. In fact, all the VIF scores ranged from 1.19 to 2.792 (refer to Table 5), which are lower than the maximum level (3.3) of VIF [107]. Thus, the collinearity was confirmed as acceptable according to Huang et al. [125].
Common method bias (CMB) was also checked to measure the constructs of the study [126]. CMB can be defined as the variance that is consistently linked to the measurement process rather than the underlying constructs being measured. CMB can lead to measurement errors and can impact the validity of the conclusions. Harman one-factor analysis was adopted to deal with the issue of CMB. No evidence of CMB was found and the result of Harman one-factor analysis was <50% (47.590%) [126,127,128].
Table 5 shows that H1: RA → PU (β = 0.127, t = 1.849, p = 0.046)—accepted, indicating a significant positive relationship between RA and PU. The findings suggest that the advantages of BDA do indeed necessarily translate to its usefulness.
H2: RA → PEOU (β = 0.071, t = 1.075, p = 0.282)—rejected, the result shows that the RA of BDA does not affect its ease of use.
H3: Complexity → PU (β = 0.108, t = 1.668, p = 0.095)—rejected, revealing insignificant relation between complexity and PU.
H4: Complexity → PEOU (β = 0.071, t = 1.257, p = 0.209)—rejected, suggesting that BDA systems are not difficult to be understood and used for SMES.
H5: BDS → PU (β = 0.243, t = 4.562, p = 0.000)—accepted, highlighting the significant impact of BDS on the PU of BDA.
H6: BDS → PEOU (β = 0.190, t = 3.842, p = 0.001)—also accepted, this result underscores the importance of BDS in influencing PEOU.
H7: MS → PU (β = 0.391, t = 6.112, p = 0.000)—accepted, the acceptance of this hypothesis indicates a strong positive relationship between MS and PU of BDA.
H8: MS → PEOU (β = 0.429, t = 8.264, p = 0.000)—accepted, showing that MS greatly influences the PEOU.
H9: LC → PU (β = 0.097, t = 0.995, p = 0.340)—rejected, the rejection of this hypothesis indicates insignificant relationship between LC and PU of BDA.
H10: LC → PEOU (β = 0.243, t =4.047, p = 0.000)—accepted, showing that LC greatly influences the PEOU.
H11: PEOU → BDA adoption (β = 0.583, t = 6.555, p = 0.000)—accepted, the acceptance of this hypothesis indicates a strong positive relationship between PEOU and the adoption of BDA
H12: PU → BDA Adoption (β = 0.110, t = 1.007, p = 0.314)—rejected, suggesting that insignificant relationship between PU and the adoption of BDA
H13: BDA Adoption → Sustainable Business Performance (β = 0.284, t = 3.896, p = 0.000)—accepted, the acceptance of this hypothesis indicates a strong positive relationship between the adoption of BDA and the achievement of sustainable business performance.
H14: FST → Sustainable Business Performance (β = 0.531, t = 7.55, p = 0.000)—accepted, the acceptance of this hypothesis indicates a strong positive relationship between the use of facilitating sustainable technology and sustainable business performance
Mediating effects demonstrate how a certain variable can impact another variable by introducing an intervening variable. In our study, the hypotheses from H15 to H24 attempt to outline these effects. H16, which explores the influence of complexity on the adoption of BDA and sustainable business performance through PU, does not seem statistically significant. The corresponding values of β-value (0.012) and p-value (0.180), validate this lack of significance. Similarly, H20 and H21, which observe the mediating role of PEOU in the relationship between relative advantage and complexity and the adoption of BDA, also appeared insignificant, as supported by the corresponding β-values, t-values, and p-values. H15, H17, H18, and H19 which explore the influence of relative advantage, big data security, management support and leadership competency on the adoption of BDA and sustainable business performance through PU was statistically significant. Their corresponding values, such as the t-values (2.236 to 3.143) and p-values (ranging from 0.002 to 0.025), validate this strong significance. Finally, H22, H23, and H24, which observe the mediating role of PEOU in the relationship between big data security, management support and leadership competency and the adoption of BDA, also appeared significant as supported by the corresponding β-values, t-values, and p-values.
Collectively, these results offer a complete understanding of the various factors that influence the adoption of BDA, highlighting the complex interplay between technological attributes, organizational support, and individual perceptions. Figure 4 shows the structural equation modeling (SEM) model.

5. Discussion

BDA technology allows SMEs to boost their ability to compete while gaining an edge over their competitors [3]. This powerful instrument allows SMEs to gain extensive knowledge of customer demands and preferences [2], allowing them to produce goods and services that fit their requirements and tastes successfully. Furthermore, BDA technology may help SMEs use this knowledge for development [8], which is becoming more essential for competing in the modern, rapidly evolving digitalized environment [3]. Given the various benefits and effectiveness of BDA, there is still some concern about its adoption by SMEs [1]. This study has theorized, based on the TAM and TOE [38], that SMEs can adopt BDA based on PEOU and PU [83].
This study’s results support previous findings, revealing several noteworthy similarities and differences. First off, Davis’ [83] TAM—which emphasizes PEOU as an important factor in technology adoption—aligns with RA, BDS, and MS as significant factors in the adoption of BDA. The research by Coleman et al. [3], Sen et al. [2], and Surbakti et al. [72] demonstrate this correlation, highlighting the importance of these factors in SMEs’ decision-making processes regarding adopting BDA.
In the Saudi context, where Vision 2030 aims to diversify the economy and stimulate SME growth, the role of BDA emerges as a critical enabler of innovation and competitiveness. The significant impact of management support (MS) on the perceived usefulness and ease of use of BDA emphasizes the importance of leadership commitment to technology adoption, aligning with Alshamaila et al.’s [4] findings that managerial attitudes significantly influence organizational readiness for technology adoption. Moreover, the positive relationship between big data security (BDS) and both the perceived usefulness and ease of use of BDA highlights the importance of increased awareness among Saudi SMEs in terms of data integrity and security. This concern is particularly relevant in the Saudi market, where the increasing digitalization of business operations heightens the risks associated with data breaches [129].
The study findings indicate that relative advantage does not influence perceived ease of usage. This finding contradicts with Chen et al.’s [70] study, which identified a correlation between perceived ease of use and relative advantage. Indeed, technological innovations possess distinct competitive advantages that may not be universally applicable. Furthermore, the rate of technological diffusion and integration, the quality of available skills, and the quality of infrastructure vary significantly amongst different societies. Therefore, the availability of these factors determines the advantage of a particular innovation. Complexity was not a significant determinant and was not related to PU and PEOU. SMEs did not perceive big data as being challenging to comprehend and utilize. This supports the findings of other research, such as that conducted by Prause [100], highlighting the necessity of having strong management support for adoption intention in the long term.
The study’s conclusions regarding the impact of leadership competency (LC) on BDA adoption are consistent with the multi-level analysis conducted by Abrell-Vogel and Rowold [75], which highlights leadership’s crucial role in the ease of technological implementation in organizations. In fact, appointing leaders who are receptive to innovation, knowledgeable about current technological trends, and able to champion the use of technology is crucial [6,72]. It is worth noting that leadership is undoubtedly fundamental in driving the implementation of BDA and promoting its adoption. Moreover, leaders who possess the necessary skills and knowledge are better positioned to influence, motivate, and guide their teams toward embracing new technologies. The strong beta value and the highly significant p-value of leadership competence on PEOU highlight the importance of competent leaders in successfully implementing and utilizing BDA within organizations.
The effect of FST on sustainable business performance was statistically significant. This is consistent with the study of Akter et al. [15] who found that successful implementation of innovations enables organizations to achieve a sustainable competitive advantage and business performance. Finally, the study affirms the importance of considering user factors in the adoption of technology by recognizing the impacts of PEOU and PU on BDA adoption. These findings align with the results of Grover et al. [79] and Davis [85].
The study found that user perceptions specifically perceived usefulness (PU) and perceived ease of use (PEOU) act as a mediator in the relationship between big data security and adoption of BDA. In fact, when it comes to technology, especially digital or online platforms, security is a critical aspect that affects users’ trust and willingness to adopt and use the technology. Small- and medium-sized enterprises must implement robust security measures, maintain transparent communication about data protection procedures, and continuously educate users about the BDA’s security features. Indeed, by building trust and addressing security concerns, SMEs can improve user perception and ultimately boost adoption rates. In conclusion, understanding the mediating role of user perception can assist organizations and developers in identifying barriers to adoption and formulating strategies to address them. By focusing on improving user perception through efficient communication, training, and user experience design, SMES can boost the likelihood of successful adoption and usage of BDA [83].

5.1. Theoretical Implications

This research study offers three critical implications for the theory and model of technology adoption. First, it provides a comprehensive and practical set of factors overlooked in the broader literature impacting the adoption of BDA. These factors include RA, complexity, BDS MS, and LC. Second, this study contributes to the theory by building an understanding that technology should be accessible and easier to understand, as SMEs may be constrained by resource and performance pressure. Finally, it offers important implications for developing empirical evidence from the much-ignored organizational setting of Saudi Arabia. The evidence and findings indicate that the factors discussed in the discussion section have an impact on the adoption of BDA technology. This impact can be attributed to the nascent development of SMEs in Saudi Arabia, as they can play an important role in enhancing the sustainability of Saudi Arabia’s economy.

5.2. Managerial Implications

This study offers three important implications for managers interested in adopting BDA at their respective SMEs. First, SME managers should prioritize developing interactive, user-friendly interfaces and thorough training programs to deconstruct the complexity of these technologies and guarantee that employees can use technology effectively. Second, managers must promote these technologies within the organization by fostering a culture prioritizing data-driven decision-making. This requires leadership advocacy as well as active MS. By addressing these issues, BDA technology integration into SME operations may be significantly improved, promoting innovation and competitiveness within the industry.
The conclusions of this study have many significant managerial ramifications for SMEs considering implementing BDA. First, the importance of RA, BDS, LC, and MS in shaping the adoption choice emphasizes managers’ need to pay close attention to these aspects. It is possible to increase these systems’ PEOU and PU, increasing the likelihood of adoption by highlighting the simplification of BDA processes and guaranteeing strong security measures. Furthermore, adopting BDA can help organizations stand out among competitors and realize their strategic vision more effectively. In addition, a strong MS is crucial to providing the required resources and cultivating a culture that recognizes and appreciates the advantages of BDA. This involves investing in education and training to raise staff members’ proficiency with BDA technologies.
Moreover, it is believed that leadership holds a significant role in BDA adoption and SME managers should balance focusing on the technical and functional aspects of BDA tools and their emphasis on leadership. Furthermore, managers should prioritize user experiences when designing and implementing BDA systems, as PEOU and PU directly impact adopters’ intentions. To summarize, a comprehensive approach that integrates robust MS, user-centric tool design, and a focus on security and simplicity is advised for successfully adopting BDA in SMEs.

5.3. Limitations and Future Directions

Although our research offers an insightful discussion and managerial and theoretical implications for adopting BDA, several limitations should be considered. First, the influence of FST on business performance suggests a special dynamic in the context of BDA adoption by SMEs that merits more investigation. In fact, sustainable technologies in information technology and systems, such as green technologies and Industry 4.0 innovations, can improve the adoption and use of BDA. Indeed, by developing sustainable technologies, organizations can increase efficiency, sustain competitive advantage, enhance business processes, and improve customer experiences. Furthermore, looking at potential moderating factors, such as organizational culture, organizational structures, or industry type, might deepen our research and provide a complete understanding of the difficulties associated with technology adoption in the SME sector. These limitations highlight the need for a greater study to improve our theories and models, ensuring a more nuanced understanding of the variables influencing SMEs’ decisions to use BDA technologies. AI and the IoT are disruptive technologies that can help SMEs gain a competitive edge and improve business performance. Future studies should explore their potential.

6. Conclusions

BDA is a technology that offers benefits to SMEs. By integrating BDA technologies, SMEs can unlock innovation, competitiveness, and sustainability in terms of performance. These technologies allow SMEs to gain insights from data, enabling them to understand consumer behaviors and market trends effectively. Moreover, BDA empowers SMEs with the tools to sharpen their edge by adapting to market changes, anticipating customer needs, and personalizing their services. In today’s changing business landscape, the ability to innovate and adapt is crucial for SMEs’ success. Using BDA, SMEs can enhance their competitiveness and ensure their long-term viability as agile market leaders. Leveraging this transformative technology not only improves performance but also helps SMEs overcome obstacles, seize opportunities, and navigate a path toward growth and prosperity.
This study examined the important aspects of the SMEs’ BDA adoption and integrated it into their business operations. Further, this study has also found that factors such as RA, LC, MS, and BDS are key factors that yield SMEs’ PEOU and PU. The complexity of these technologies, which includes elaborate algorithms and enormous databases, has emerged as a key determinant. Their usability is significantly impacted by how accessible and understandable they are to the SMEs.

Author Contributions

A.M.A. was responsible for conceptualization, writing—original draft preparation, methodology, visualization, validation, investigation, resources, supervision, project administration, and funding acquisition. S.A.A.-S. was responsible for methodology, validation, data curation, and writing—original draft preparation. R.O.M. was responsible for writing—original draft preparation, formal analysis, software, investigation, data curation, validation, and writing—review and editing. All authors have read and agreed to the published version of the manuscript.

Funding

The research was funded by Institutional Fund Projects under grant no. (IFIP: 1445-245-1443). The authors gratefully acknowledge the technical and financial support provided by the Ministry of Education and King Abdulaziz University, DSR, Jeddah, Saudi Arabia.

Institutional Review Board Statement

The study was conducted in accordance with the Declaration of Helsinki, and approved by the Ethics Research Committee (REC) of the Faculty of Economics and Administration at King Abdulaziz University (protocol code Ref. REC 1/9 24/2/2023) for studies involving humans.

Informed Consent Statement

Informed consent was obtained from all subjects involved in the study.

Data Availability Statement

The datasets generated and analyzed during the current study are not publicly available due to privacy and confidentiality agreements as well as other restrictions. The datasets, however, are available upon reasonable request. Inquiries related to these may be submitted to the corresponding author.

Acknowledgments

We are grateful to all respondents who participated in this study.

Conflicts of Interest

The authors declare no conflicts of interest.

Abbreviations

BDABig Data Analytics
BDSBig Data Security
DITDiffusion of Innovation Theory
HTMTHeterotrait–monotrait
LCLeadership Competency
MSManagement Support
PEOUPerceived Ease of Use
PUPerceived Usefulness
RARelative Advantage
SMEsSmall- and Medium-sized Enterprises
TAMTechnology Acceptance Model
TOETechnology–Organization–Environment (TOE)
RBVResource-Based View
DOIDiffusion of Innovation

Appendix A. Summarizes Prior Theoretical Models Pertaining to SMEs in Developing Countries

StudyUnderlining TheoriesSample
Maroufkhani et al. [8]The technology–organization–environment (TOE) modelSMEs in China
Perdana et al. [11]resource-based view (RBV)SMEs in Singapore
Maroufkhani et al. [41]TOE model and RBVSMEs in Iran
Bhardwaj et al. [42]Technology Acceptance Model (TAM), Diffusion of Innovation (DOI), and TOE.SMEs in India
Atan and Mahmood [130]DOI, TOE, and the dynamic capabilities theoryMalaysian SMEs
Al-Azzam et al. [131]TAMSMEs in Jordan
Trường [132]TOE and TAMSMEs in Vietnam

Appendix B. Measurement of Research Variables

VariableMeasuresSource
Relative AdvantageRAA1My organization expects big data analytics to help in reducing costs.Lian et al. [104]
RAA2My organization expects big data analytics to help in quick real-time data capturing and analysis.
RAA3My organization expects big data analytics to help reduce paperwork.
RAA4My organization expects big data analytics help in achieving organizational excellence.
ComplexityCOM1My organization believes that big data analytic is complex to use.Chen et al. [70], Thompson et al. [105], Agrawal [106]
COM2My organization believes that big data analytic adoption is a complex process.
COM3The adoption of data analytic requires continuous evaluation and adjustment
COM4The adoption of data analytic is long process that requires change management.
Big Data SecurityBDS1My organization has already introduced and adopted big data analytics Suh and Han [110]
BDS2My organization intends to use big data analytics
Management Support MS1Top management promotes the use of big data analytics [70,105]
MS2Top management creates support for big data analytics initiatives within the organization.
MS3Top management promotes big data analytics as a strategic priority within the organization
Leadership competencyLC1Our leaders are imaginative and innovative in all aspects of one’s work.Compeau and Higgins [111,112]
LC2Our leaders implement standardized procedures to ensure the continued use of big data analytics.
LC3Our leaders have clear vision of the future direction of the organization to meet business priorities.
LC4Our leaders make sound judgments and decisions based on reasonable assumptions and factual information
LC5Our leaders see the wider issues and broader implications.
LC6Our leaders identify opportunities and threats
LC7Our leaders plan ahead, organize all resources, and coordinate them efficiently and effectively.
LC8Our leaders encourage problem solving, innovative ideas and proposals.
LC9Our leaders have significant impact on increasing profitability in enterprise
Facilitating sustainable technologyFC1We manufacture with advanced sustainable technologiesCurrent study, Venkatesh et al. [38], Ahmad et al. [108]
FC2We have more skillful technical workers and operational workers
FC3We cooperate with stakeholders (suppliers/customer) to develop sustainable technologies
Perceived Ease of UsePEOU1Learning to use big data analytics would be easy.Davis et al. [83], Shabbir and Gardezi [107]
PEOU2It is easy to get big data analytics to do what we want them to do.
PEOU3The interaction with big data analytics would be clear and understandable.
PEOU4Big data analytics would be flexible to interact with.
PEOU5Big data analytics are easy to use.
PEOU6It would be easy for me to become skillful at using big data analytics.
Perceived UsefulnessPU1Using big data analytics would allow us to accomplish our work more quickly.
PU2Using big data analytics would improve business.performance.
PU3Using big data analytics would increase employees’ productivity.
PU4Using big data analytics would improve the effectiveness of the business.
PU5Using big data analytics would help in understanding the needs of our customer.
PU6Big data analytics are useful in monitoring of business process.
Big data AdoptionIU1My organization has already introduced and adopted big data analytics Rajan and Baral [109]
IU2My organization intends to use big data analytics
Sustainable Business PerformancePER1Return on investment of our organization increased.Haseeb et al. [133], Zulkiffli et al. [134]
PER2Profitability growth has been outstanding.
PER3Overall financial performance has exceeded competitors.

References

  1. Gonzales, R.; Wareham, J.; Serida, J. Measuring the impact of data warehouse and business intelligence on en-terprise performance in Peru: A developing country. J. Glob. Inf. Technol. Manag. 2015, 18, 162–187. [Google Scholar]
  2. Sen, D.; Ozturk, M.; Vayvay, O. An overview of big data for growth in SMEs. Procedia-Soc. Behav. Sci. 2016, 235, 159–167. [Google Scholar] [CrossRef]
  3. Coleman, S.; Göb, R.; Manco, G.; Pievatolo, A.; Tort-Martorell, X.; Reis, M.S. How can SMEs benefit from big data? Challenges and a path forward. Qual. Reliab. Eng. Int. 2016, 32, 2151–2164. [Google Scholar] [CrossRef]
  4. Alshamaila, Y.; Papagiannidis, S.; Li, F. Cloud computing adoption by SMEs in the north east of England: A multi-perspective framework. J. Enterp. Inf. Manag. 2013, 26, 250–275. [Google Scholar] [CrossRef]
  5. Alalwan, A.A.; Dwivedi, Y.K.; Rana, N.P. Factors influencing adoption of mobile banking by Jordanian bank customers: Extending UTAUT2 with trust. Int. J. Inf. Manag. 2017, 37, 99–110. [Google Scholar] [CrossRef]
  6. Awa, H.O.; Ukoha, O.; Igwe, S.R. Revisiting technology-organization-environment (TOE) theory for enriched applicability. Bottom Line 2017, 30, 2–22. [Google Scholar] [CrossRef]
  7. Baig, M.I.; Shuib, L.; Yadegaridehkordi, E. Big data adoption: State of the art and research challenges. Inf. Process. Manag. 2019, 56, 102095. [Google Scholar] [CrossRef]
  8. Maroufkhani, P.; Iranmanesh, M.; Ghobakhloo, M. Determinants of big data analytics adoption in small and medium-sized enterprises (SMEs). Ind. Manag. Data Syst. 2023, 123, 278–301. [Google Scholar] [CrossRef]
  9. Akhtar, P.; Frynas, J.G.; Mellahi, K.; Ullah, S. Big data-savvy teams’ skills, big data-driven actions and business performance. Br. J. Manag. 2019, 30, 252–271. [Google Scholar] [CrossRef]
  10. Choudhury, V.; Karahanna, E. The relative advantage of electronic channels: A multidimensional view. MIS Q. 2008, 32, 179–200. [Google Scholar] [CrossRef]
  11. Perdana, A.; Lee, H.H.; Koh, S.; Arisandi, D. Data analytics in small and mid-size enterprises: Enablers and inhibitors for business value and firm performance. Int. J. Account. Inf. Syst. 2022, 44, 100547. [Google Scholar] [CrossRef]
  12. International Labour Organization. Guide to Recommendation 189: Job Creation in Small and Medium Sized Enterprises Recommendation; International Labour Organization: Geneva, Switzerland, 2022. [Google Scholar]
  13. Alraedah Finanace. Annual Report; Alraedah Finanace: Riyadh, Saudi Arabia, 2020. [Google Scholar]
  14. Akter, S.; Hossain, M.A.; Sajib, S.; Sultana, S.; Rahman, M.; Vrontis, D.; McCarthy, G. A framework for AI-powered service innovation capability: Review and agenda for future research. Technovation 2023, 125, 102768. [Google Scholar] [CrossRef]
  15. Mikalef, P.; Boura, M.; Lekakos, G.; Krogstie, J. Big data analytics and firm performance: Findings from a mixed-method approach. J. Bus. Res. 2019, 98, 261–276. [Google Scholar] [CrossRef]
  16. Lutfi, A.; Alsyouf, A.; Almaiah, M.A.; Alrawad, M.; Abdo, A.A.K.; Al-Khasawneh, A.L.; Ibrahim, N.; Saad, M. Factors influencing the adoption of big data analytics in the digital transformation era: Case study of Jordanian SMEs. Sustainability 2022, 14, 1802. [Google Scholar] [CrossRef]
  17. Nasrollahi, M.; Ramezani, J.; Sadraei, M. The impact of big data adoption on SMEs’ performance. Big Data Cogn. Comput. 2021, 5, 68. [Google Scholar] [CrossRef]
  18. Ghobakhloo, M.; Iranmanesh, M.; Vilkas, M.; Grybauskas, A.; Amran, A. Drivers and barriers of Industry 4.0 technology adoption among manufacturing SMEs: A systematic review and trans- formation roadmap. J. Manuf. Technol. Manag. 2022, 33, 1029–1058. [Google Scholar] [CrossRef]
  19. Somohano-Rodríguez, F.M.; Madrid-Guijarro, A. Do industry 4.0 technologies improve Cantabrian manufacturing smes performance? The role played by industry competition. Technol. Soc. 2022, 70, 102019. [Google Scholar] [CrossRef]
  20. Lima Jr, O.; Fernandes, G.; Tereso, A. Benefits of adopting innovation and sustainability practices in project management within the SME context. Sustainability 2023, 15, 13411. [Google Scholar] [CrossRef]
  21. Willetts, M.; Atkins, A.S.; Stanier, C. Barriers to SMEs adoption of big data analytics for competitive advantage. In Proceedings of the 2020 Fourth International Conference on Intelligent Computing in Data Sciences (ICDS), Fez, Morocco, 21–23 October 2020; pp. 1–8. [Google Scholar]
  22. Bachmann, N.; Tripathi, S.; Brunner, M.; Jodlbauer, H. The contribution of data-driven technologies in achieving the sustainable development goals. Sustainability 2022, 14, 2497. [Google Scholar] [CrossRef]
  23. Santos, A.d.M.; Becker, A.M.; Ayala, N.F.; Sant’Anna, Â.M.O. Industry 4.0 as an enabler of sustainability for small and medium enterprises. Acad. Rev. Latinoam. Adm. 2024; ahead-of-print. [Google Scholar] [CrossRef]
  24. Talebkhah, M.; Sali, A.; Marjani, M.; Gordan, M.; Hashim, S.J.; Rokhani, F.Z. IoT and big data applications in smart cities: Recent advances, challenges, and critical issues. IEEE Access 2021, 9, 55465–55484. [Google Scholar] [CrossRef]
  25. Al Naimi, S.M. Economic diversification trends in the Gulf: The case of Saudi Arabia. Circ. Econ. Sustain. 2022, 2, 221–230. [Google Scholar] [CrossRef]
  26. Saudi Arabia’s Vision 2030. Saudi Arabia, the Heart of the Arab and Islamic Worlds, the Investment Powerhouse, and the Hub Connecting Three Continents. 2016. Available online: https://www.my.gov.sa/wps/portal/snp/content/saudivision/?lang=en/1000 (accessed on 20 January 2024).
  27. Akinwale, Y.O.; Alaraifi, A.A.; Ababtain, A.K. Entrepreneurship, innovation, and economic growth: Evidence from Saudi Arabia. In Eurasian Economic Perspectives: Proceedings of the 28th Eurasia Business and Economics Society Conference, Coventry, UK, 29–31 May 2019; Springer: Berlin/Heidelberg, Germany, 2020; pp. 25–40. [Google Scholar]
  28. Small and Medium Enterprises General Authority (Monsha’at). SME MONITOR Monsha’at Quarterly Report Q3 2022; Small and Medium Enterprises General Authority: Riyadh, Saudi Arabia, 2023.
  29. Rafiki, A. Determinants of SME growth: An empirical study in Saudi Arabia. Int. J. Organ. Anal. 2020, 28, 205–225. [Google Scholar] [CrossRef]
  30. Nouwailati, K.; Al-Habibi, O. Growing New Industrial Supply Chains; KPMG: Amstelveen, The Netherlands, 2022. [Google Scholar]
  31. Innovation and Economic Development Department. KAUST SME Survey Report; King Abdullah University of Science and Technology: Thuwal, Saudi Arabia, 2020.
  32. Adaileh, M.J. An empirical study of internet use in Saudian’s small and mediums enterprises. Asian Soc. Sci. 2012, 8, 169. [Google Scholar] [CrossRef]
  33. Report, M.Q. SME Monitor Q1 2022; Monshaat: Riyadh, Saudi Arabia, 2022. [Google Scholar]
  34. AlBar, A.M.; Hoque, M.R. Factors affecting the adoption of information and communication technology in small and medium enterprises: A perspective from rural Saudi Arabia. Inf. Technol. Dev. 2019, 25, 715–738. [Google Scholar] [CrossRef]
  35. Alshebami, A.S. Crowdfunding platforms as a substitute financing source for young Saudi entrepreneurs: Empirical evidence. SAGE Open 2022, 12, 21582440221126511. [Google Scholar] [CrossRef]
  36. Alshebami, A.S. Green innovation, self-efficacy, entrepreneurial orientation and economic performance: Interactions among Saudi small enterprises. Sustainability 2023, 15, 1961. [Google Scholar] [CrossRef]
  37. Verma, S.; Bhattacharyya, S.S.; Kumar, S. An extension of the technology acceptance model in the big data analytics system implementation environment. Inf. Process. Manag. 2018, 54, 791–806. [Google Scholar] [CrossRef]
  38. Venkatesh, V.; Morris, M.G.; Davis, G.B.; Davis, F.D. User acceptance of information technology: Toward a unified view. MIS Q. 2003, 27, 425–478. [Google Scholar] [CrossRef]
  39. Davis, F.D. A Technology Acceptance Model for Empirically Testing New End-User Information Systems: Theory and Results. Ph.D. Thesis, Massachusetts Institute of Technology, Cambridge, MA, USA, 1985. [Google Scholar]
  40. Okcu, S.; Hancerliogullari Koksalmis, G.; Basak, E.; Calisir, F. Factors affecting intention to use big data tools: An extended technology acceptance model. In Proceedings of the Industrial Engineering in the Big Data Era: Selected Papers from the Global Joint Conference on Industrial Engineering and Its Application Areas, GJCIE 2018, Nevsehir, Turkey, 21–22 June 2018; pp. 401–416. [Google Scholar]
  41. Maroufkhani, P.; Tseng, M.-L.; Iranmanesh, M.; Ismail, W.K.W.; Khalid, H. Big data analytics adoption: Determinants and performances among small to medium-sized enterprises. Int. J. Inf. Manag. 2020, 54, 102190. [Google Scholar] [CrossRef]
  42. Kumar Bhardwaj, A.; Garg, A.; Gajpal, Y. Determinants of blockchain technology adoption in supply chains by small and medium enterprises (SMEs) in India. Math. Probl. Eng. 2021, 2021, 5537395. [Google Scholar] [CrossRef]
  43. Tornatzky, L.; Fleischer, M. The Process of Technology Innovation; Lexington Books: Lexington, MA, USA, 1990. [Google Scholar]
  44. Rogers, E. Diffusion of Innovations, 4th ed.; Google-Books-ID: v1ii4QsB7jIC; Simon and Schuster: New York, NY, USA, 2010. [Google Scholar]
  45. Rogers, E. Diffusion of Innovations, 5th ed.; Free Press: New York, NY, USA, 2003. [Google Scholar]
  46. Opasvitayarux, P.; Setamanit, S.-O.; Assarut, N.; Visamitanan, K. Antecedents of IoT adoption in food supply chain quality management: An integrative model. J. Int. Logist. Trade 2022, 20, 135–170. [Google Scholar] [CrossRef]
  47. Izuagbe, R.; Hamzat, S.A.; Joseph, E.I. Electronic information resources (EIR) adoption in private university libraries: The moderating effect of productivity and relative advantage on perceived usefulness. J. Inf. Sci. Theory Pract. 2016, 4, 30–48. [Google Scholar] [CrossRef]
  48. Kahandawa, K.; Wijayanayake, J. Impact of mobile banking services on customer satisfaction: A study on Sri Lankan state commercial bank. Int. J. Comput. Inf. Technol. 2014, 3, 546–552. [Google Scholar]
  49. Na, Y.K.; Kang, S.; Jeong, H.Y. The effect of market orientation on performance of sharing economy business: Focusing on marketing innovation and sustainable competitive advantage. Sustainability 2019, 11, 729. [Google Scholar] [CrossRef]
  50. Bakici, T.; Nemeh, A.; Hazir, Ö. Big data adoption in project management: Insights from french organizations. IEEE Trans. Eng. Manag. 2021, 70, 3358–3372. [Google Scholar] [CrossRef]
  51. Walker, R.S.; Brown, I. Big data analytics adoption: A case study in a large South African telecommunications organisation. S. Afr. J. Inf. Manag. 2019, 21, 1–10. [Google Scholar] [CrossRef]
  52. Majumder, M.G.; Gupta, S.D.; Paul, J. Perceived usefulness of online customer reviews: A review mining approach using machine learning & exploratory data analysis. J. Bus. Res. 2022, 150, 147–164. [Google Scholar]
  53. Sanson-Fisher, R.W. Diffusion of innovation theory for clinical change. Med. J. Aust. 2004, 180, S55–S56. [Google Scholar] [CrossRef]
  54. Cabrera, Á.; Cabrera, E.F.; Barajas, S. The key role of organizational culture in a multi-system view of technology-driven change. In Global Information Systems; Routledge: London, UK, 2008; pp. 178–199. [Google Scholar]
  55. Tushman, M.L.; Smith, W. Organizational technology. In Blackwell Companion to Organizations; Blackwell Publishers: Boston, MA, USA, 2017; pp. 386–414. [Google Scholar]
  56. Pérez-Luño, A.; Bojica, A.M.; Golapakrishnan, S. When more is less: The role of cross-functional integration, knowledge complexity and product innovation in firm performance. Int. J. Oper. Prod. Manag. 2019, 39, 94–115. [Google Scholar] [CrossRef]
  57. Hong, Y.; Zhang, M.; Meeker, W.Q. Big data and reliability applications: The complexity dimension. J. Qual. Technol. 2018, 50, 135–149. [Google Scholar] [CrossRef]
  58. Lee, I. Big data: Dimensions, evolution, impacts, and challenges. Bus. Horiz. 2017, 60, 293–303. [Google Scholar] [CrossRef]
  59. Meitasari, R.C.; Manurung, E.T. Perceived ease of use and usefulness of big data to audit quality. Proceeding Int. Conf. Account. Financ. 2023, 1, 123–128. [Google Scholar]
  60. Iyamu, T. A framework for selecting analytics tools to improve healthcare big data usefulness in developing countries. S. Afr. J. Inf. Manag. 2020, 22, 1–9. [Google Scholar] [CrossRef]
  61. Duan, Y.; Edwards, J.S.; Dwivedi, Y.K. Artificial intelligence for decision making in the era of Big Data–evolution, challenges and research agenda. Int. J. Inf. Manag. 2019, 48, 63–71. [Google Scholar] [CrossRef]
  62. Venkatesh, V. Determinants of perceived ease of use: Integrating control, intrinsic motivation, and emotion into the technology acceptance model. Inf. Syst. Res. 2000, 11, 342–365. [Google Scholar] [CrossRef]
  63. De Mauro, A.; Greco, M.; Grimaldi, M.; Ritala, P. Human resources for Big Data professions: A systematic classification of job roles and required skill sets. Inf. Process. Manag. 2018, 54, 807–817. [Google Scholar] [CrossRef]
  64. Gurcan, F.; Cagiltay, N.E. Big data software engineering: Analysis of knowledge domains and skill sets using LDA-based topic modeling. IEEE Access 2019, 7, 82541–82552. [Google Scholar] [CrossRef]
  65. Von Solms, R. Information security management: Why standards are important. Inf. Manag. Comput. Secur. 1999, 7, 50–58. [Google Scholar] [CrossRef]
  66. Soomro, Z.A.; Shah, M.H.; Ahmed, J. Information security management needs more holistic approach: A literature review. Int. J. Inf. Manag. 2016, 36, 215–225. [Google Scholar] [CrossRef]
  67. Axelrod, C.W.; Bayuk, J.L.; Schutzer, D. Enterprise Information Security and Privacy; Artech House: Norwood, MA, USA, 2009. [Google Scholar]
  68. Ashenden, D. Information Security management: A human challenge? Inf. Secur. Tech. Rep. 2008, 13, 195–201. [Google Scholar] [CrossRef]
  69. Alguliyev, R.; Imamverdiyev, Y. Big data: Big promises for information security. In Proceedings of the 2014 IEEE 8th International Conference on Application of Information and Communication Technologies (AICT), Astana, Kazakhstan, 15–17 October 2014; pp. 1–4. [Google Scholar]
  70. Chen, H.-M.; Schütz, R.; Kazman, R.; Matthes, F. How Lufthansa Capitalized on Big Data for Business Model Renovation. MIS Q. Exec. 2017, 16, 19. [Google Scholar]
  71. Yu, S. Big privacy: Challenges and opportunities of privacy study in the age of big data. IEEE Access 2016, 4, 2751–2763. [Google Scholar] [CrossRef]
  72. Ahmed, E.S.A.; Saeed, R.A. A survey of big data cloud computing security. Int. J. Comput. Sci. Softw. Eng. (IJCSSE) 2014, 3, 78–85. [Google Scholar]
  73. Rebollo, O.; Mellado, D.; Fernández-Medina, E.; Mouratidis, H. Empirical evaluation of a cloud computing information security governance framework. Inf. Softw. Technol. 2015, 58, 44–57. [Google Scholar] [CrossRef]
  74. Song, H.H. Testing and evaluation system for cloud computing information security products. Procedia Comput. Sci. 2020, 166, 84–87. [Google Scholar] [CrossRef]
  75. Abrell-Vogel, C.; Rowold, J. Leaders’ commitment to change and their effectiveness in change–a multilevel investigation. J. Organ. Chang. Manag. 2014, 27, 900–921. [Google Scholar] [CrossRef]
  76. Graves, L.M.; Sarkis, J.; Gold, N. Employee proenvironmental behavior in Russia: The roles of top management commitment, managerial leadership, and employee motives. Resour. Conserv. Recycl. 2019, 140, 54–64. [Google Scholar] [CrossRef]
  77. Michaelis, B.; Stegmaier, R.; Sonntag, K. Affective commitment to change and innovation implementation behavior: The role of charismatic leadership and employees’ trust in top management. J. Chang. Manag. 2009, 9, 399–417. [Google Scholar] [CrossRef]
  78. El-Kassar, A.-N.; Singh, S.K. Green innovation and organizational performance: The influence of big data and the moderating role of management commitment and HR practices. Technol. Forecast. Soc. Chang. 2019, 144, 483–498. [Google Scholar] [CrossRef]
  79. Schiuma, G.; Schettini, E.; Santarsiero, F.; Carlucci, D. The transformative leadership compass: Six competencies for digital transformation entrepreneurship. Int. J. Entrep. Behav. Res. 2022, 28, 1273–1291. [Google Scholar] [CrossRef]
  80. Schmidt, D.H.; van Dierendonck, D.; Weber, U. The data-driven leader: Developing a big data analytics leadership competency framework. J. Manag. Dev. 2023, 42, 297–326. [Google Scholar] [CrossRef]
  81. Wu, X.; Liang, L.; Chen, S. How big data alters value creation: Through the lens of big data competency. Manag. Decis. 2022, 60, 707–734. [Google Scholar] [CrossRef]
  82. Surbakti, F.P.S.; Wang, W.; Indulska, M.; Sadiq, S. Factors influencing effective use of big data: A research framework. Inf. Manag. 2020, 57, 103146. [Google Scholar] [CrossRef]
  83. Davis, F.D. Perceived usefulness, perceived ease of use, and user acceptance of information technology. MIS Q. 1989, 13, 319–340. [Google Scholar] [CrossRef]
  84. Shahbaz, M.; Gao, C.; Zhai, L.; Shahzad, F.; Hu, Y. Investigating the adoption of big data analytics in healthcare: The moderating role of resistance to change. J. Big Data 2019, 6, 6. [Google Scholar] [CrossRef]
  85. Aboelmaged, M.; Mouakket, S. Influencing models and determinants in big data analytics research: A bibliometric analysis. Inf. Process. Manag. 2020, 57, 102234. [Google Scholar] [CrossRef]
  86. Tien, E.L.; Ali, N.M.; Miskon, S.; Ahmad, N.; Abdullah, N.S. Big data analytics adoption model for Malaysian SMEs. In Proceedings of the Emerging Trends in Intelligent Computing and Informatics: Data Science, Intelligent Information Systems and Smart Computing, Johor, Malaysia, 22–23 September 2019; pp. 45–53. [Google Scholar]
  87. Grover, P.; Kar, A.K.; Janssen, M.; Ilavarasan, P.V. Perceived usefulness, ease of use and user acceptance of blockchain technology for digital transactions–insights from user-generated content on Twitter. Enterp. Inf. Syst. 2019, 13, 771–800. [Google Scholar] [CrossRef]
  88. Karahanna, E.; Straub, D.W. The psychological origins of perceived usefulness and ease-of-use. Inf. Manag. 1999, 35, 237–250. [Google Scholar] [CrossRef]
  89. Mican, D.; Sitar-Tăut, D.-A.; Moisescu, O.-I. Perceived usefulness: A silver bullet to assure user data availability for online recommendation systems. Decis. Support Syst. 2020, 139, 113420. [Google Scholar] [CrossRef]
  90. Al-Rahmi, W.M.; Yahaya, N.; Aldraiweesh, A.A.; Alturki, U.; Alamri, M.M.; Saud, M.S.B.; Kamin, Y.B.; Aljeraiwi, A.A.; Alhamed, O.A. Big data adoption and knowledge management sharing: An empirical investigation on their adoption and sustainability as a purpose of education. IEEE Access 2019, 7, 47245–47258. [Google Scholar] [CrossRef]
  91. Mandinach, E.B.; Honey, M.; Light, D. A theoretical framework for data-driven decision making. In Proceedings of the Annual Meeting of the American Educational Research Association, San Francisco, CA, USA, 7–11 April 2006. [Google Scholar]
  92. Ikemoto, G.S.; Marsh, J.A. Cutting through the “data-driven” mantra: Different conceptions of data-driven decision making. Teach. Coll. Rec. 2007, 109, 105–131. [Google Scholar] [CrossRef]
  93. Liu, Y.; Soroka, A.; Han, L.; Jian, J.; Tang, M. Cloud-based big data analytics for customer insight-driven design innovation in SMEs. Int. J. Inf. Manag. 2020, 51, 102034. [Google Scholar] [CrossRef]
  94. Saleem, H.; Li, Y.; Ali, Z.; Mehreen, A.; Mansoor, M.S. An empirical investigation on how big data analytics influence China SMEs performance: Do product and process innovation matter. In Corporate Performance and Managerial Ties in China; Routledge: London, UK, 2021; pp. 9–34. [Google Scholar]
  95. Asad, M.; Asif, M.U.; Khan, A.A.; Allam, Z.; Satar, M.S. Synergetic effect of entrepreneurial orientation and big data analytics for competitive advantage and SMEs performance. In Proceedings of the 2022 International Conference on Decision Aid Sciences and Applications (DASA), Chiangrai, Thailand, 23–25 March 2022; pp. 1192–1196. [Google Scholar]
  96. Trieu, H.D.; Van Nguyen, P.; Nguyen, T.T.; Vu, H.M.; Tran, K. Information technology capabilities and organizational ambidexterity facilitating organizational resilience and firm performance of SMEs. Asia Pac. Manag. Rev. 2023, 28, 544–555. [Google Scholar] [CrossRef]
  97. Konlechner, S.; Müller, B.; Güttel, W.H. A dynamic capabilities perspective on managing technological change: A review, framework and research agenda. Int. J. Technol. Manag. 2018, 76, 188–213. [Google Scholar] [CrossRef]
  98. Zamani, E.D.; Smyth, C.; Gupta, S.; Dennehy, D. Artificial intelligence and big data analytics for supply chain resilience: A systematic literature review. Ann. Oper. Res. 2023, 327, 605–632. [Google Scholar] [CrossRef] [PubMed]
  99. Shah Alam, S.; Ali, M.Y.; Jani, M.F.M. An empirical study of factors affecting electronic commerce adoption among SMEs in Malaysia. J. Bus. Econ. Manag. 2011, 12, 375–399. [Google Scholar] [CrossRef]
  100. Prause, M. Challenges of industry 4.0 technology adoption for SMEs: The case of Japan. Sustainability 2019, 11, 5807. [Google Scholar] [CrossRef]
  101. Hernandez-de-Menendez, M.; Morales-Menendez, R.; Escobar, C.A.; McGovern, M. Competencies for industry 4.0. Int. J. Interact. Des. Manuf. (IJIDeM) 2020, 14, 1511–1524. [Google Scholar] [CrossRef]
  102. Chemjor, E.M.; Maru, L. Effect of user perception on the relationship between technology context and adoption of cloud computing: Evidence from SMES in Nairobi county, Kenya. Int. J. Econ. Commer. Manag. 2017, V, 10–28. [Google Scholar]
  103. Nuryyev, G.; Wang, Y.-P.; Achyldurdyyeva, J.; Jaw, B.-S.; Yeh, Y.-S.; Lin, H.-T.; Wu, L.-F. Blockchain technology adoption behavior and sustainability of the business in tourism and hospitality SMEs: An empirical study. Sustainability 2020, 12, 1256. [Google Scholar] [CrossRef]
  104. Lian, J.-W.; Yen, D.C.; Wang, Y.-T. An exploratory study to understand the critical factors affecting the decision to adopt cloud computing in Taiwan hospital. Int. J. Inf. Manag. 2014, 34, 28–36. [Google Scholar] [CrossRef]
  105. Thompson, R.L.; Higgins, C.A.; Howell, J.M. Personal computing: Toward a conceptual model of utilization. MIS Q. 1991, 15, 125–143. [Google Scholar] [CrossRef]
  106. Agrawal, K. Investigating the determinants of Big Data Analytics (BDA) adoption in Asian emerging economies. Acad. Manag. Proc. 2015, 1, 11290. [Google Scholar] [CrossRef]
  107. Shabbir, M.Q.; Gardezi, S.B.W. Application of big data analytics and organizational performance: The mediating role of knowledge management practices. J. Big Data 2020, 7, 47. [Google Scholar] [CrossRef]
  108. Ahmad, N.; Lazim, H.M.; Shamsuddin, A.; Wahab, E.; Abu, N.A. The relationship between technological capability and manufacturing performance. Int. J. Supply Chain Manag. 2019, 8, 930–946. [Google Scholar]
  109. Rajan, C.A.; Baral, R. Adoption of ERP system: An empirical study of factors influencing the usage of ERP and its impact on end user. IIMB Manag. Rev. 2015, 27, 105–117. [Google Scholar] [CrossRef]
  110. Suh, B.; Han, I. The impact of customer trust and perception of security control on the acceptance of electronic commerce. Int. J. Electron. Commer. 2003, 7, 135–161. [Google Scholar]
  111. Compeau, D.R.; Higgins, C.A. Application of social cognitive theory to training for computer skills. Inf. Syst. Res. 1995, 6, 118–143. [Google Scholar] [CrossRef]
  112. Kwiotkowska, A.; Gajdzik, B.; Wolniak, R.; Vveinhardt, J.; Gębczyńska, M. Leadership competencies in making Industry 4.0 effective: The case of Polish heat and power industry. Energies 2021, 14, 4338. [Google Scholar] [CrossRef]
  113. Cheah, J.-H.; Sarstedt, M.; Ringle, C.M.; Ramayah, T.; Ting, H. Convergent validity assessment of formatively measured constructs in PLS-SEM: On using single-item versus multi-item measures in redundancy analyses. Int. J. Contemp. Hosp. Manag. 2018, 30, 3192–3210. [Google Scholar] [CrossRef]
  114. Hair, J.F.; Risher, J.J.; Sarstedt, M.; Ringle, C.M. When to use and how to report the results of PLS-SEM. Eur. Bus. Rev. 2019, 31, 2–24. [Google Scholar] [CrossRef]
  115. Beran, T.N.; Violato, C. Structural equation modeling in medical research: A primer. BMC Res. Notes 2010, 3, 267. [Google Scholar] [CrossRef] [PubMed]
  116. Salgado, T.; Tavares, J.; Oliveira, T. Drivers of mobile health acceptance and use from the patient perspective: Survey study and quantitative model development. JMIR Mhealth Uhealth 2020, 8, e17588. [Google Scholar] [CrossRef] [PubMed]
  117. Hair Jr, J.F.; Howard, M.C.; Nitzl, C. Assessing measurement model quality in PLS-SEM using confirmatory composite analysis. J. Bus. Res. 2020, 109, 101–110. [Google Scholar] [CrossRef]
  118. Sarstedt, M.; Ringle, C.M.; Cheah, J.-H.; Ting, H.; Moisescu, O.I.; Radomir, L. Structural model robustness checks in PLS-SEM. Tour. Econ. 2020, 26, 531–554. [Google Scholar] [CrossRef]
  119. Henseler, J.; Ringle, C.M.; Sarstedt, M. A new criterion for assessing discriminant validity in variance-based structural equation modeling. J. Acad. Mark. Sci. 2015, 43, 115–135. [Google Scholar] [CrossRef]
  120. Ab Hamid, M.; Sami, W.; Sidek, M.M. Discriminant validity assessment: Use of Fornell & Larcker criterion versus HTMT criterion. J. Phys. Conf. Ser. 2017, 890, 012163. [Google Scholar]
  121. Hair, J.F.; Ringle, C.M.; Sarstedt, M. PLS-SEM: Indeed a silver bullet. J. Mark. Theory Pract. 2011, 19, 139–152. [Google Scholar] [CrossRef]
  122. Miles, J. R-squared, adjusted R-squared. In Encyclopedia of Statistics in Behavioral Science; John Wiley & Sons, Inc.: Hoboken, NJ, USA, 2005. [Google Scholar]
  123. Hair, J.F.; Astrachan, C.B.; Moisescu, O.I.; Radomir, L.; Sarstedt, M.; Vaithilingam, S.; Ringle, C.M. Executing and interpreting applications of PLS-SEM: Updates for family business researchers. J. Fam. Bus. Strategy 2021, 12, 100392. [Google Scholar] [CrossRef]
  124. Hair Jr, J.F.; Hult, G.T.M.; Ringle, C.M.; Sarstedt, M.; Danks, N.P.; Ray, S. Partial Least Squares Structural Equation Modeling (PLS-SEM) Using R: A Workbook; Springer Nature: Berlin/Heidelberg, Germany, 2021. [Google Scholar]
  125. Huang, C.-Y.; Wang, H.-Y.; Yang, C.-L.; Shiau, S.J. A derivation of factors influencing the diffusion and adoption of an open source learning platform. Sustainability 2020, 12, 7532. [Google Scholar] [CrossRef]
  126. Podsakoff, P.M.; MacKenzie, S.B.; Lee, J.-Y.; Podsakoff, N.P. Common method biases in behavioral research: A critical review of the literature and recommended remedies. J. Appl. Psychol. 2003, 88, 879. [Google Scholar] [CrossRef] [PubMed]
  127. Podsakoff, P.M.; MacKenzie, S.B.; Podsakoff, N.P. Sources of method bias in social science research and recommendations on how to control it. Annu. Rev. Psychol. 2012, 63, 539–569. [Google Scholar] [CrossRef] [PubMed]
  128. Won, N.C.; Wan, C.Y.; Sharif, M.Y. Effect of leadership styles, social capital, and social entrepreneurship on organizational effectiveness of social welfare organization in Malaysia: Data screening and preliminary analysis. Int. Rev. Manag. Mark. 2017, 7, 117–122. [Google Scholar]
  129. Saeed, S.; Altamimi, S.A.; Alkayyal, N.A.; Alshehri, E.; Alabbad, D.A. Digital transformation and cybersecurity challenges for businesses resilience: Issues and recommendations. Sensors 2023, 23, 6666. [Google Scholar] [CrossRef] [PubMed]
  130. Atan, M.; Mahmood, R. The influence of organisation dimension in business analytics adoption by Malaysian SMEs. J. Adv. Comput. Technol. Appl. (JACTA) 2022, 4, 5244. [Google Scholar]
  131. Al-Azzam, M.; Al-Alwan, M.; Alqahtani, M.; Al-Hawary, S.; Alserhan, A. Determinants of behavioral intention to use big data analytics (BDA) on the information and communication technologies (ICT) SMEs in Jordan. Decis. Sci. Lett. 2023, 12, 605–616. [Google Scholar] [CrossRef]
  132. Truong, P.N.X. Adopting digital transformation in small and medium enterprises: An empirical model of Influencing factors based on TOE-TAM integrated. J. Financ. Mark. Res. 2023, 13, 45–57. [Google Scholar] [CrossRef]
  133. Haseeb, M.; Hussain, H.I.; Kot, S.; Androniceanu, A.; Jermsittiparsert, K. Role of social and technological challenges in achieving a sustainable competitive advantage and sustainable business performance. Sustainability 2019, 11, 3811. [Google Scholar] [CrossRef]
  134. Zulkiffli, S.N.A.; Zaidi, N.F.Z.; Padlee, S.F.; Sukri, N.K.A. Eco-Innovation Capabilities and Sustainable Business Performance during the COVID-19 Pandemic. Sustainability 2022, 14, 7525. [Google Scholar] [CrossRef]
Figure 1. The 10V’s of big data [22].
Sustainability 16 03209 g001
Figure 2. SMEs size in Saudi Arabia (Source: current study).
Sustainability 16 03209 g002
Figure 3. Conceptual framework.
Sustainability 16 03209 g003
Figure 4. Structural equation modeling (SEM).
Sustainability 16 03209 g004
Table 1. Demographic information.
VariablesCategoriesFrequencyPercentValid PercentCumulative Percent
GenderMale18364.964.964.9
Female9935.135.1100.0
PositionIT Expert258.98.98.9
Director/Dept. head3512.412.421.3
Manager22278.778.7100.0
IndustryManufacturing22680.180.180.1
wholesale and retail5619.919.9100.0
EducationAssociate degree217.47.47.4
Bachelor’s Degree21576.276.283.7
Higher degree (master/doctor degree)4616.316.3100.0
SizeSmall enterprises (10–49 employees)14451.151.151.1
Medium-sized enterprises (50–250 employees)13848.948.9100
Table 2. Construct reliability and validity.
ConstructsItemsFactor LoadingsCronbach AlphaComposite ReliabilityAVE
Relative Advantage (RAA)RAA10.8960.8720.9120.723
RAA20.902
RAA30.886
RAA40.702
Complexity (COM)COM10.8890.9030.9330.776
COM20.927
COM30.888
COM40.816
Big data Security (BDS)BDS10.9370.8590.9340.876
BDS20.936
Management Support (MS)MS10.8690.8470.9070.766
MS20.902
MS30.853
Leadership competency (LC)LC10.7310.9500.9580.717
LC20.896
LC30.873
LC40.889
LC50.893
LC60.821
LC70.815
LC80.883
LC90.807
Perceived usefulness (PU)PU10.8060.9150.9340.701
PU20.847
PU30.857
PU40.843
PU50.838
PU60.833
Perceived Ease of Use (PEOU)PEOU10.8550.9240.9410.727
PEOU20.800
PEOU30.900
PEOU40.895
PEOU50.836
PEOU60.824
Facilitating sustainable technology (FC)FC10.8840.8450.9060.763
FC20.888
FC30.850
Big Data Analytics Adoption (IU)IU10.8950.7400.8850.793
IU20.887
Sustainable Business Performance (PER)PER10.8130.8290.8380.746
PER20.905
PER30.871
Table 3. HTMT ratio.
Constructs12345678910
  • IU
2.
BDS
0.788
3.
COM
0.5750.484
4.
FC
0.8110.7950.693
5.
LC
0.7850.5950.8040.766
6.
MS
0.7510.6010.5700.7590.632
7.
PEOU
0.8100.6940.6530.7740.7340.834
8.
PER
0.8610.7830.6220.5800.7650.7070.811
9.
RAA
0.7590.6960.8470.7870.7820.6340.7110.807
10.
PU
0.6960.7050.6300.7770.6640.7820.8710.7550.707
Table 4. R-square results.
ConstructsR2R2 AdjustedSRMR (Estimated Model)
BDA Adoption0.4550.4510.074
Perceived ease of use0.6930.687
Perceived usefulness 0.6280.621
Sustainable Business Performance 0.5580.555
Table 5. Direct and mediating effects.
EffectsDirect EffectsMediating EffectsVIFt-Valuep-ValueDecision
Beta ValueBeta Value
H1: RA → PU0.127 2.5581.8490.046Accepted
H2: RA → PEOU0.071 1.191.0750.282Rejected
H3: Complexity → PU0.108 1.7541.6680.095Rejected
H4: Complexity → PEOU0.071 1.6831.2570.209Rejected
H5: BDS → PU0.243 2.4224.5620.000Accepted
H6: BDS → PEOU0.190 2.5583.8420.000Accepted
H7: MS → PU0.391 1.196.1120.000Accepted
H8: MS → PEOU0.429 1.7548.2640.000Accepted
H9: LC → PU0.097 1.6830.9550.340Rejected
H10: LC → PEOU0.243 2.4224.0470.000Accepted
H11: PEOU → BDA adoption0.583 2.7926.5550.000Accepted
H12: PU → BDA Adoption0.110 2.7921.0070.314Rejected
H13: BDA Adoption → Sustainable Business Performance0.284 2.2373.8960.000Accepted
H14: FST → Sustainable Business Performance0.531 2.2377.550.000Accepted
H15: RA → PU → BDA Adoption→Sustainable Business Performance 0.08 2.2520.024Mediation exists
H16: Complexity → PU → BDA Adoption→Sustainable Business Performance 0.012 1.340.180No mediation
H17: BDS → PU → BDA Adoption → Sustainable Business Performance 0.036 2.4680.014Mediation exists
H18: management support → PU → BDA Adoption → Sustainable Business Performance 0.083 3.1430.002Mediation exists
H19: leadership competency → PU → BDA Adoption → Sustainable Business Performance 0.049 2.2360.025Mediation exists
H20: RA→PEOU → BDA Adoption → Sustainable Business Performance 0.063 1.6960.090No mediation
H21: Complexity → PEOU → BDA Adoption → Sustainable Business Performance 0.011 1.4220.155No mediation
H22: BDS → PEOU→BDA Adoption→Sustainable Business Performance 0.104 2.7090.007Mediation exists
H23: management support → PEOU → BDA Adoption → Sustainable Business Performance 0.069 3.8060.000Mediation exists
H24: leadership competency → PEOU → BDA Adoption → Sustainable Business Performance 0.041 2.4860.013Mediation exists
Disclaimer/Publisher’s Note: The statements, opinions and data contained in all publications are solely those of the individual author(s) and contributor(s) and not of MDPI and/or the editor(s). MDPI and/or the editor(s) disclaim responsibility for any injury to people or property resulting from any ideas, methods, instructions or products referred to in the content.

