1. Introduction
Since 2001, the United Nations has assessed the current status of global e-government development, and they published the first annual e-government survey report in 2004, “UN Global E-Government Survey 2003” [
1], whose E-Government Development Index (EGDI), as a composite index, is calculated by weighting three standardized indices, namely, the Telecommunications Infrastructure Index (TII), the Human Capital Index (HCI), and the Online Services Index (OSI), and is designed to assess the level of e-government development in the world’s major economies. According to the 2022 United Nations e-government survey [
2], the level of global e-government development has continued to improve, with the average value of the E-Government Development Index (EGDI) increasing from 0.5988 in 2020 to 0.6102 in 2022, and more than two-thirds of countries having a high or very high EGDI, reflecting the continued development of e-government. With the continued development of e-government, the rapidity of government processing services has been improved, and the development of social production capacity has been promoted to a certain extent. Exploring the impact of e-government development on the development of a new generation of productive capacities and analyzing the mechanism of action behind it are key to better exploiting the role of e-government development in promoting sustained economic growth and accelerating poverty reduction, economic diversification, and job creation.
With the continuous innovation of internet technology, the development of e-government has become a focus of all major economies in the international community today. The United Nations, in order to help economies more accurately diagnose and measure their economic performance and ultimately formulate more effective policies and implementation programs, has introduced the New Generation Productive Capacity Index (PCI) to provide countries with a new indicator other than gross domestic product (GDP) to measure their economic progress. With the active use of both indices rising across economies, can e-government contribute to the continued development of the New Generation Productive Capacity Index (PCI)?
From the perspective of major global economies, e-government development can indeed promote the development of a new generation of productive capacities. In recent years, more and more countries have strengthened their institutional and legal frameworks for e-government development, committed themselves to promoting e-government development, and actively incorporated e-government into their national development strategies [
3]. As early as 1993, the United States took the lead in proposing the development of e-government, calling for the establishment of a public-oriented “e-government” to provide the public with convenient access to government services and opportunities. Later, Canada, Germany, Singapore, and other economies launched e-government development plans one after another. Throughout the 11 e-government surveys published by the United Nations from 2003 to 2022 [
4], there is a significant positive correlation between the level of e-government development and productive capacity development. Of course, this significant positive correlation cannot be simply interpreted as a certainty that e-government can contribute to economic development; after all, there is another possible explanation for this positive correlation, namely that the higher a country’s productive capacity is, the more capable it is of building e-government. Therefore, from a global perspective, to show that e-government can contribute to the development of the new generation of productive capacity, it is necessary to explore the development mechanism behind it and to clarify the magnitude of its role.
This paper systematically examines the mechanisms by which e-government building contributes to the development of a new generation of productive capacities from the perspective of e-government strengthening the capacity of government services. From the global data, there are certain commonalities in the organizational structures and service dimensions of e-government development in major economies, including the provision of convenient and efficient online government services to the public [
5,
6]. The United Nations E-Government Survey 2022 [
2] emphasizes that, by promoting an integrated strategy of data design and delivery, governments can avoid a siloed approach to e-government and are better able to integrate and coordinate efforts among different sectoral agencies to deliver e-government services to all populations. Thus, in the area of government services, e-government development can enhance the ability of the government to serve the community or the public [
7]. From the perspective of government departments, if there are more social enterprises that handle related affairs through e-government, this will inevitably reduce the manpower cost of the government in providing related government services and enhance the efficiency of the government [
8]. From the perspective of the public, if the public obtains relevant government services through the e-government service platform, this will certainly reduce the cost of public time and labor in obtaining relevant government services and improve the efficiency of social production [
9]. The benefits brought about by the use of e-government services by society are high efficiency and low marginal costs [
10]. This is the essential feature of digital technology-enabled government services. Therefore, the more the public uses e-government, the lower the cost is for government departments to provide equivalent government services and the faster the development of social productive capacity will be.
For this reason, this paper models the above elements and constructs a general equilibrium model that endogenizes e-government, so as to examine the competitive behavior of internal government departments in the field of government services. In a nutshell, the provision of government services by the government for the public is one of the necessary elements for the public to participate in social production, and the public needs to pay a certain fee, such as paying a certain amount of tax, to access the government services provided by the government. Before the construction of e-government, the government only provided government services to the public through offline channels. The offline channel is a single monopolistic channel, which will inevitably produce a monopolistic market for government services. This market will surely impose mark-up pricing on government services due to costs, which will in turn increase the burden of paying taxes and fees on the public and affect the development of social production capacity. After the construction of e-government services, there is a certain degree of competition between e-government platforms and offline channels, and the monopolistic market of the past will be transformed into a dual oligopoly market, where competition will make the cost of government services fall. Whether the government builds an e-government service platform is determined by the government’s internal decision-making mechanism, and depends on the utilization rate or potential utilization rate of the e-government service platform. When the utilization growth reaches a certain height, the government will choose to build an e-government service platform. The use of e-government services affects the New Generation Productive Capacity Index (PCI) through two mechanisms: the construction of e-government services makes it possible to reduce the cost of service provision by the government, i.e., it generates compliance cost benefits. Having said that, the high frequency of e-government use by the public affects the cost of service provision by the government, which then affects the various tax rates of the whole society, i.e., it generates fiscal expenditure benefits. Under the dual mechanism of compliance cost benefits and fiscal expenditure benefits, e-government will further enhance the productive capacity index of society.
To summarize, the research contribution of this paper is mainly reflected in the following three aspects: first, the contribution on the research perspective. This paper extends the research on e-government in terms of improving the efficiency of governments and authorities in handling affairs to the research on its impact on the productive capacity of society. The implementation of e-government is crucial for governments [
11], and its impact on social life is profound. The existing literature focuses mainly on studying how e-government affects the work of departments and their personnel within the government, such as the penetration rate of e-government websites [
12], the maturity level of government authorities that are building e-government [
13], the factors that promote the adoption of e-government in the government [
14], the effectiveness of the access to the government’s e-government portals [
15,
16,
17], etc. and there are insufficient discussions on how the application of e-government in the governmental sector impacts a country’s productive capacity. This paper focuses on the construction of e-government and deepens our comprehensive understanding of the spillover effects generated by the wide application of e-government. Second, this paper presents theoretical contributions. This paper proposes a general equilibrium model that reveals the impact of building e-government on the government and the public, and more comprehensively reveals the mechanism of the impact of e-government construction at the level of the whole economy. The existing literature mainly focuses on the study of public trust in e-government [
18,
19], revealing the extent of the impact of e-government on the relationship between residents and local governments [
20]. The main purpose of this paper is to reveal that the development of e-government will change the original model of government services, and that this change in the model will affect the mechanism of social tax payment and reduce the cost burden on the public, especially on businesses. Third, this paper contributes empirical evidence. This paper utilizes the data of the major economies around the world to reveal the relationship between the construction of e-government and the new generation of productive capacity, and then effectively proves the specific impact of e-government on the government, enterprises, and individuals through the test of cost mechanism and financial mechanism. The current literature on e-government focuses on whether it affects the development of the financial sector [
21], some of the literature evaluates the user experience of e-government services [
22], and no literature has yet examined how e-government affects governments, firms, and individuals at the economic level. Unlike the existing literature, this paper focuses on the impact of e-government on the new generation of productive capacity, revealing that e-government construction does not increase the financial burden on the government, but reduces the burden on businesses and individuals, thus providing new insights into understanding the productivity effects of e-government development.
Therefore, the research objective of this paper is to use data to prove the fact that there exists a positive contribution of e-government to the new generation of productive capacity, and to verify whether e-government development will increase the government’s expenses and the time cost of accessing government services by enterprises and individuals, as well as the cost of expenses. In order to achieve the above research objectives, this paper is designed with the following argument structure: the first part clarifies the existence of an influential relationship between e-government development and the new generation of productive capacity. The second part explains the data and model of this study. The third part shows the results of the empirical evidence of this study. The fourth part analyzes the specific influence mechanism of e-government development on governments, enterprises, and individuals, and proves whether e-government is beneficial to the development of society’s productive capacity. The fifth part is the conclusion of this study.
2. Data and Model Description
In order to construct the model of this paper, this paper utilizes the data of the E-Government Development Index (EGDI) of 181 economies in the world from 2003 to 2022, and applies the relevant data published by the United Nations to empirically test the core conclusions of this paper’s model. In terms of variable selection, this paper utilizes the E-Government Development Index (EGI) published by the United Nations Department of Economic and Social Affairs (UNDESA) from 2003 to 2022 to measure the level of e-government development, and the New Generation Productive Capacity Index (PCI) from 2000 to 2022, introduced by the United Nations Conference on Trade and Development (UNCTAD), to measure the level of development of productive capacity in each economy. Since the EGI is not available on a yearly basis, only the EGIs and PCIs for 2003, 2004, 2005, 2008, 2010, 2012, 2014, 2016, 2018, 2020, and 2022 of the 181 economies are selected for this paper.
Table 1 mainly shows the variable explanation of all of the variables involved in this paper. The first row of the E-Government Development Index (EGDI) is the explanatory quantity (independent variable) of this paper, and the data are derived from the e-government surveys published by the United Nations Department of Economic and Social Affairs. The second row of the New Generation Productive Capacity Index (PCI) is the core explanatory variable (dependent variable) of this paper, with data derived from the United Nations Conference on Trade and Development. This paper seeks to investigate the extent to which e-government development affects the new generation of productive capacity. Digital technologies are increasingly being used by economies to improve their response to disasters or other emergencies in order to increase the resilience of the social organism [
23]. The United Nations has called for economies to focus on e-government development and economic development at the same level. In addition, the United Nations, in order to access and measure their economic performance more accurately and develop more effective policies and programs, has launched the PCI to provide countries with new indicators beyond gross domestic product (GDP) to measure their economic progress. Rebeca Grynspan [
24], Secretary-General of the UNCTAD, said, “No nation has ever developed without building the required productive capacities, which are key to enabling countries to achieve sustained economic growth with accelerated poverty reduction, economic diversification and job creation.” Thus, e-government is closely linked to productive capacity-building.
First, the PCI published by the United Nations Conference on Trade and Development has eight core components (control variable), namely natural capital, human capital, energy (electricity), information and communications technology, structural change, transport, private sector, and institutions. Among these, natural capital refers to the availability of resources for extractive industries and agriculture; human capital refers to the fertility rate, the educational status of the population, the embeddedness of research and development (R and D) activities, the health status of the population, and the amount of skills it possesses; energy (electricity) refers to the availability, sustainability, and efficiency of the energy used to generate electricity; ICT refers to the population’s access to, and use of, the communication system; structural change is the ability of an economy to effectively carry out structural transformation of the economy; transport is the ability to move people and goods between two places; private sector is the dynamism of the private sector within the economy and the level of policy support for the private sector; institutional setup is the political stability of the economy and the efficiency of the government’s administration. A higher PCI is an indication of an economy’s greater productive capacity and its higher economic potential.
Second, the procedures score, time score, cost score, and mean score in
Table 1 are the variables of interest for the compliance cost effect in this paper. These data come from the Doing Business Report published by the World Bank [
25]. Among them, the procedures score, time score, and cost score are commonly used to measure the scores of an economy in terms of the procedures, time, and cost of doing business, and the scores indicate the degree of convenience, with a range of values from 0 to 100 and a higher score indicating that simpler procedures, a shorter time required, and a lower cost of doing business for an individual or a business in that economy. In the cost mechanism test, the E-Government Development Index (EDGI) is used as the explanatory variable—the independent variable—and the procedures score, time score, cost score, and mean score are used as the dependent variable.
Third, in
Table 1, the government expenditure on education, household consumption expenditure, general government final consumption expenditure, and final consumption expenditure are the relevant variables tested by the fiscal mechanism in this paper. These data are from the Economic Statistics Branch of the United Nations Statistics Division [
26,
27]. In the testing of fiscal mechanisms, the E-Government Development Index (EGDI) is used as the explanatory variable, that is, the independent variable. The government expenditure on education, household consumption expenditure, general government final consumption expenditure, and final consumption expenditure are the dependent variable.
Fourth, the last five rows in
Table 1 are the central government debt (total), USD at current prices in millions GDP, Annual Consumer Price Index, population ageing rate (65+), and population growth rate (percentage), and these are the relevant variables of the mixed factor test. The data for the first three variables are from the United Nations World Bank and those for the last two are from the Population Division of the United Nations Department of Economic and Social Affairs. In the mixed-factor test, the E-Government Development Index (EGDI) is used as the explanatory variable, that is, the independent variable. The New Generation Productive Capacity Index (PCI) is the explanatory variable of this paper, that is, the dependent variable. The central government debt (total), USD at current prices in millions GDP, Annual Consumer Price Index, population ageing rate (65+), and population growth rate (percentage) are the moderating variables.
Descriptive statistical results for all of the above variables are shown in
Table 2.
Table 3 is a survey of the natural capital, human capital, energy (electricity), information and communications technology, structural change, transport, private sector, institutions, procedures score, time score, cost score, mean score, government expenditure on education (logarithm), household consumption expenditure (logarithm), general government final consumption expenditure (logarithm), final consumption expenditure (logarithm), central government debt (total) (logarithm), USD at current prices in millions GDP (logarithm), Annual Consumer Price Index (logarithm), population ageing rate (65+), and population growth rate (percentage), all of which are the result of correlation analysis. The results showed that 187 pairs exhibited a significant positive correlation at the 1% level. The top three correlation coefficients are household consumption expenditure (logarithm) and final consumption expenditure (logarithm) (0.998); government expenditure on education (logarithm) and general government final consumption expenditure (logarithm) (0.989); and expenditure on education (logarithm) and USD at current prices in millions GDP (logarithm) (0.985). Five pairs showed significant positive correlation at the 5% level. The top three correlation coefficients are natural capital and central government debt (total) (logarithm) (0.105); private sector and central government debt (total) (logarithm) (0.103); time score and central government debt (total) (logarithm) (0.099); and mean score and central government debt (total) (logarithm) (0.099). Two pairs showed a significant positive correlation at the 10% level. They are cost score and central government debt (total) (logarithm) (0.083), and central government debt (total) (logarithm) and population growth rate (percentage) (0.078). A total of 45 pairs showed a significant negative correlation at the 1% level. The top three correlation correlations are natural capital and private sector (−0.684); energy (electricity) and natural capital (−0.664); and institutions and natural capital (−0.663). One pair showed a significant negative correlation at the 10% level: private sector and Annual Consumer Price Index (logarithm) (−0.037). The other 13 pairs had no significant correlation. The specific results of the correlation analysis are shown in
Table 3.
Table 4 shows the results of the variance inflation factor VIF test on the variables. The purpose of conducting the variance inflation factor VIF test on variables is to prevent the problem of high linear correlation between explanatory variables and control variables during the variable selection process. After the test, it was found that the VIF values of all the variables were less than 10; therefore, there is no serious problem of multicollinearity in the experimental data. Although the VIF values of information and communications technology (ICT); human capital and E-Government Development Index (EGDI) exceeded five and there is a certain multicollinearity problem, they do not affect the final regression results, so there is no need to pay special attention to this phenomenon here.
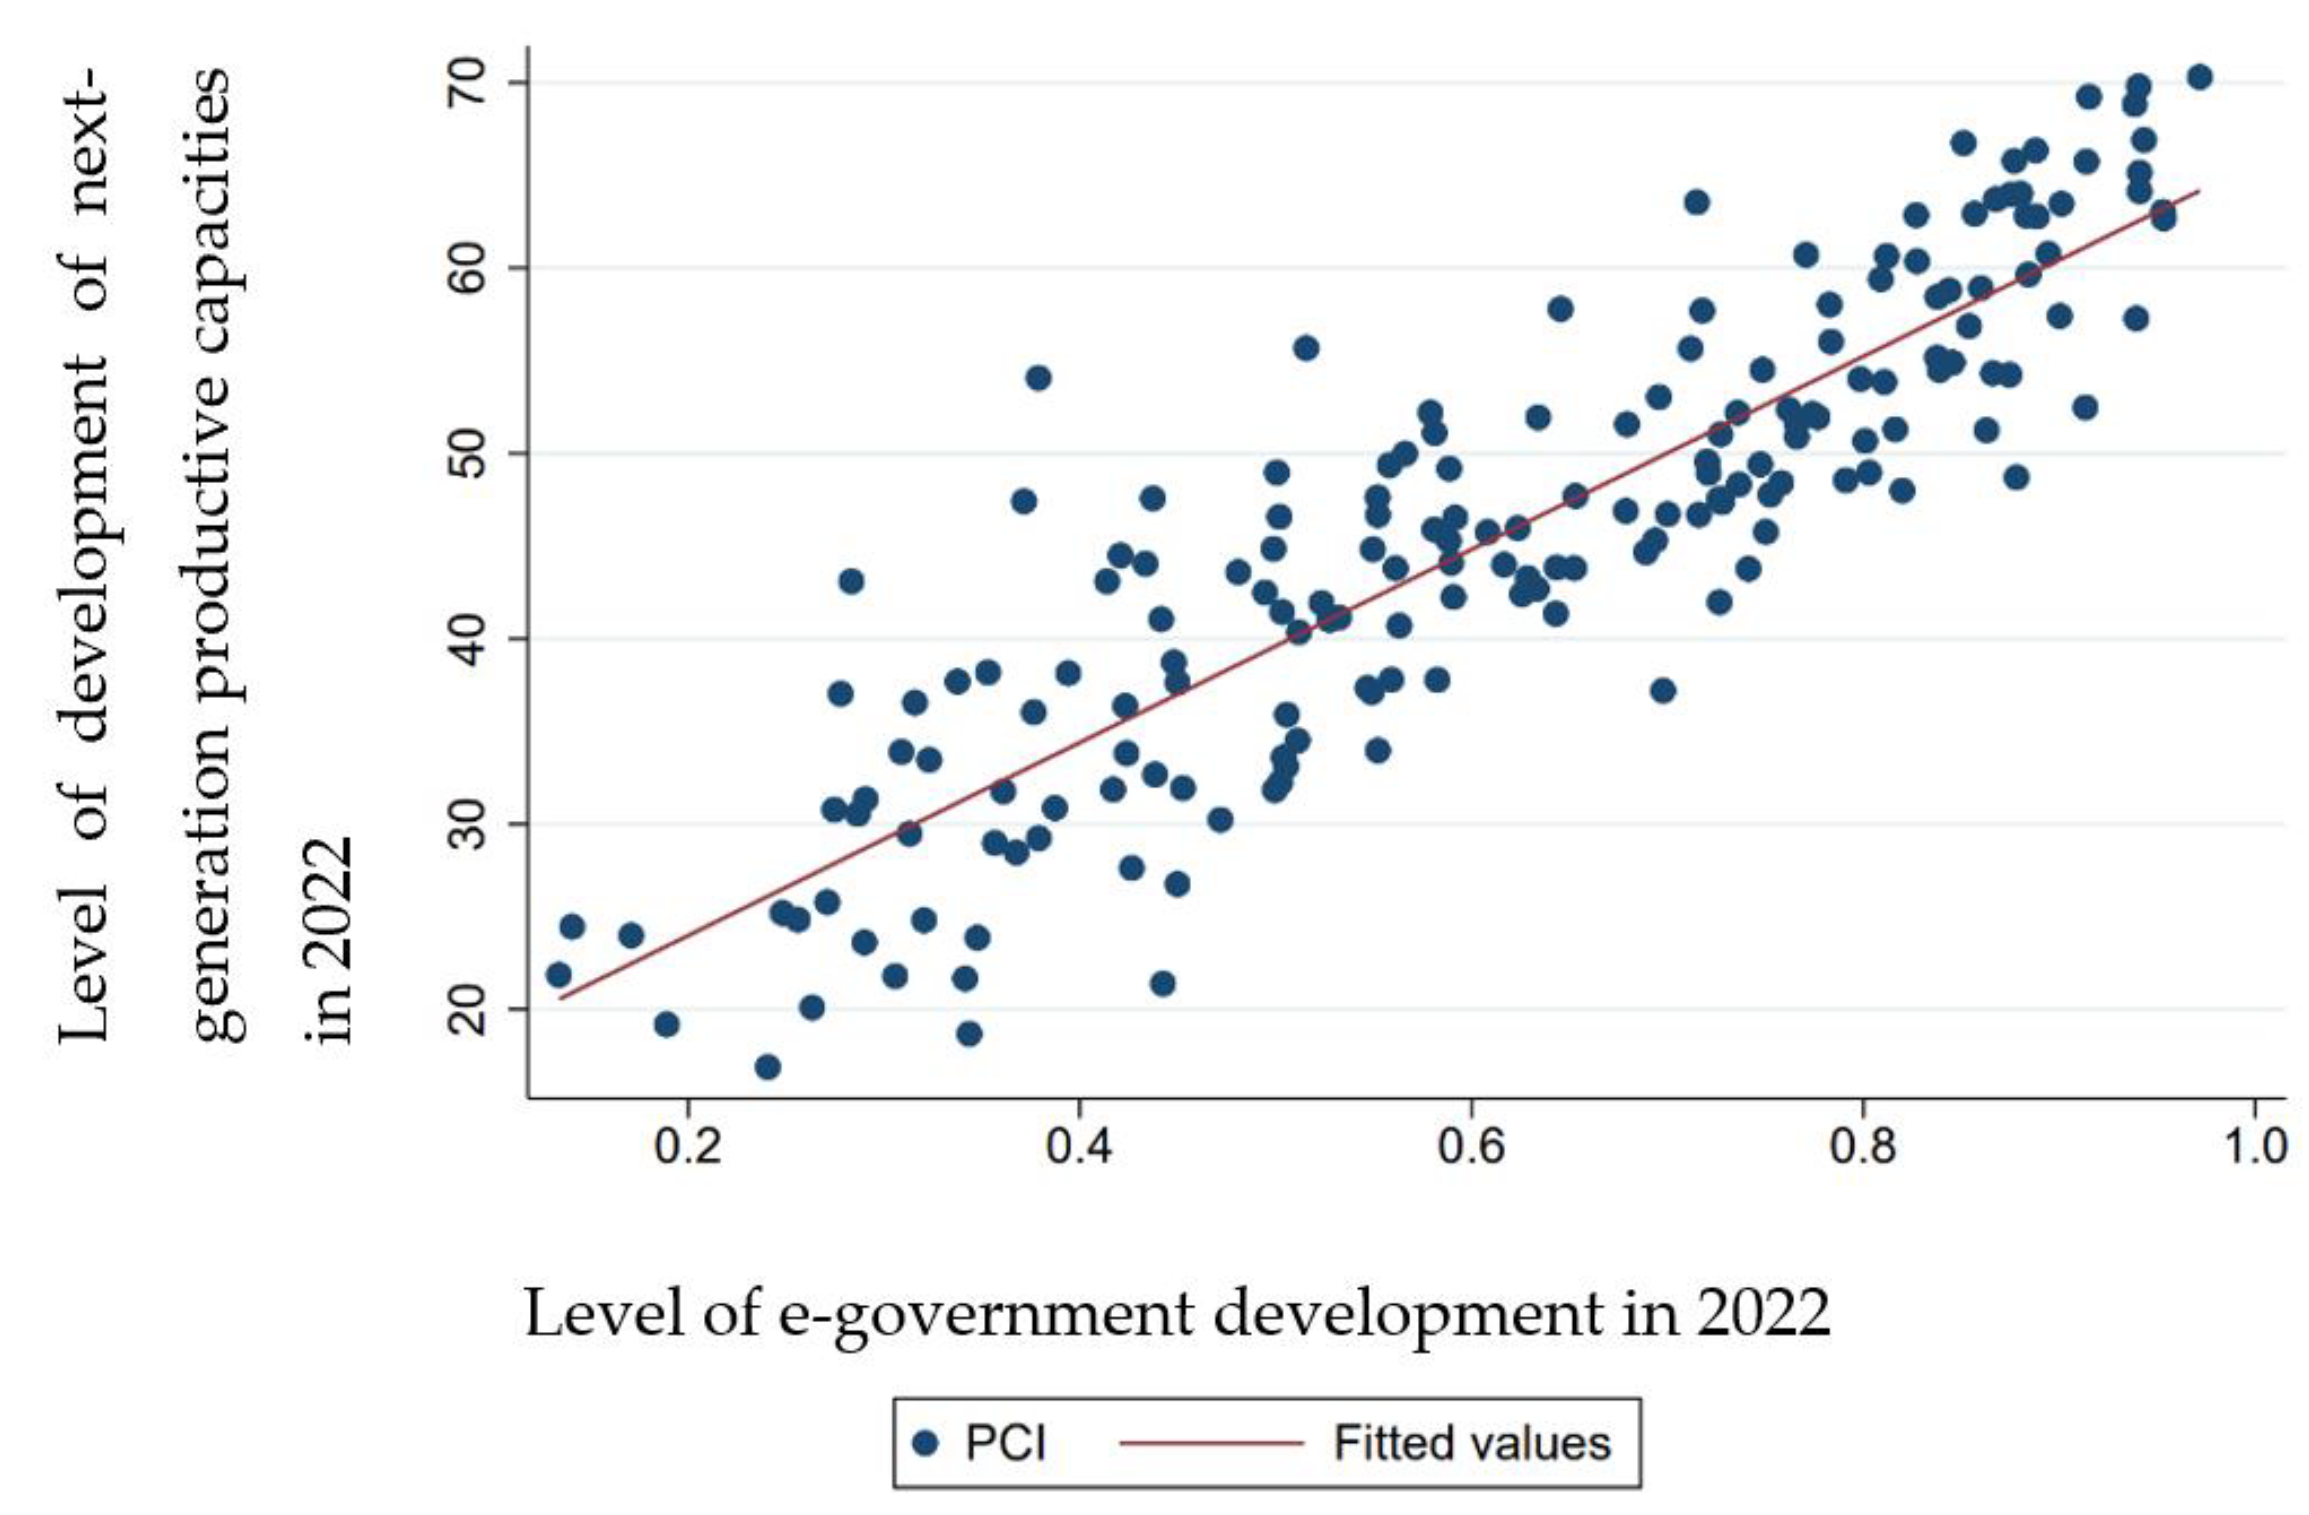
In terms of empirical strategies, first,
Figure 1 of this paper illustrates the relationship between the level of e-government development and the new generation of productive capacities in 181 economies in 2022: the level of e-government development and the level of development of the new generation of productive capacities are significantly and positively correlated.
Additionally, this paper uses a panel fixed-effects model to estimate the impact of e-government development on the new generation of productive capacity (see
Table 5). The empirical results show that e-government can promote the development of the new generation of productive capacity. In particular, the estimated coefficient of the level of e-government development on the New Generation Productive Capacity Index (PCI) is 1.128, which is significantly positive at the 1% level. The data show that when the E-Government Development Index (EGDI) rises by 1%, the economy’s new generation production capacity index will increase by 16.955. In addition, from the model established in this paper, e-government construction is endogenous, and whether or not each economy has the behavior of constructing e-government is internally determined by each economy and is affected by the rate of e-government use; from the measurement data, the economic volume of each economy, especially the government spending, effects the level of e-government construction, so there may be some reverse causality between e-government construction and new generation production capacity. In order to verify whether there is endogeneity between the variables, this paper uses the average value of the E-Government Development Index (EGDI) of the economies within each region in each year as an instrumental variable, and the estimation results show that the level of e-government development can promote the development of the new generation of production capacity.
Finally, this paper empirically examines the specific mechanisms by which e-government construction promotes a new generation of productive capacity-building. This paper demonstrates, through the compliance cost effect, that e-government construction reduces the cost of doing business, indicating that e-government construction can reduce the cost of obtaining government services for enterprises; moreover, this paper demonstrates, through the financial expenditure effect, that e-government construction can promote the development of education in the economy.
3. Empirical Studies
- (i)
Baseline regression
The panel data in this paper were used for regression analysis. Firstly, the Hausman test was used to select the random effect model and the fixed-effect model, and the corresponding concomitant probability of the Hausman test was
p = 0.000 (<0.05); therefore, the fixed-effect model was selected in this paper (see
Table 5 for the results of the Hausman test).
This paper constructs a panel two-way fixed-effects model as:
where
denotes the economy and
denotes the year.
denotes the level of development of the new generation of productive capacity,
denotes the level of development of e-government construction,
denotes economy fixed effects, and
denotes year fixed effects. In addition,
denotes the control variables affecting the New Generation Productive Capacity Index (PCI), which include natural capital, human capital, energy (electricity), information and communications technology, structural change, transport, private sector, and institutional setting.
Table 6 reports the regression results using a panel fixed-effects model. In column (1) of
Table 6, the E-Government Development Index (EGDI) is the core explanatory variable. In column (1), controlling only for economy fixed effects and year fixed effects, the coefficient of the level of the EGDI at this point is 16.955, which is significantly positive at the 1% level, indicating that, when the level of the EGDI increases by 1%, the new generation of productive capacity will be increased by 16.955. When the control variables of energy (electricity) and human capital are added one by one from column (2) to (8), the coefficient of the level of the EGDI is significantly positive; the energy (electricity), human capital, and human capital control variables are added one by one in this case, and the coefficient of the level of the EGDI is significantly positive. The coefficient of the e-government development level is significantly positive; energy (electricity) is significantly positive and human capital is significantly positive. When adding the control variables of ICT, institutional setup, natural capital, private sector, and structural change one by one, the coefficient of the level of e-government development is significantly negative at this point; ICT, institutional setup, natural capital, private sector, and structural change are significantly positive. The results are not significant when the transport control variable is added.
- (ii)
Endogenous issues
Theoretically, this paper has demonstrated that there is a positive relationship between the level of e-government development and the new generation of productive capacity. Measurement-wise, there may be some reverse causality between the two, i.e., the higher the productive capacity of an economy, the more capable it is of promoting e-government. Therefore, the panel fixed-effects model may have estimation bias. In order to further verify the causal relationship between e-government building and the new generation’s productive capacity, this paper draws on Fisman and Svensson’s (2007) [
28] study and uses the mean value of the E-Government Development Index (EGDI) of other economies within each region in each year as an instrumental variable, and conducts regression analyses using the panel fixed-effects model containing the instrumental variables (see
Table 7). The reason for doing so is that the decision to develop e-government in economies within each region (The regions are: East Asia and the Pacific, Europe and Central Asia, Latin America and the Caribbean, the Middle East and North Africa, North America, South Asia, and sub-Saharan Africa. The categorization is derived from the World Bank) may come from the influence of neighboring countries. For example, the construction of e-government in neighboring countries will promote the flow of professionals in the neighboring countries into electronic technology, computer technology, and other related professions, or produce a spillover effect to affect the speed of e-government development in the neighboring countries; therefore, whether or not a country builds an e-government will be influenced by its neighboring countries. Moreover, the intensity of e-government construction in other economies generally does not affect the intensity of e-government construction a given economy through other channels, thus satisfying the exclusivity requirement of the instrumental variable.
Table 7 reports the regression results for the instrumental variables. Column (1) reports the effect of the level of e-government development on the new generation of productive capacity and shows that the regression coefficient for the level of e-government development is significantly positive at the 1% level, indicating that an increase in the level of e-government development can contribute to the advancement of the new generation of productive capacity. Control variables are added in columns (2) through (9) sequentially. The control variable added in column (2) is energy (electricity), which is significantly positive for the level of e-government development. The addition of the human capital control variable in column (3) yielded insignificant results, indicating that human capital plays a minor role in the process of e-government’s impact on the new generation’s productive capacity. In columns (3)–(9), when the control variables of human capital, ICT, institutional setup, natural capital, private sector, structural change, and transport are added one by one to energy (electricity), the results are significantly negative, suggesting that the new generation of productive capacity is negatively affected. This result is broadly consistent with the expectations of the theoretical model and verifies that the level of e-government development does have an impact on the new generation of productive capacity.
- (iii)
Robustness tests
Table 7 verifies the mechanism of the impact of e-government construction on the new generation of productive capacity with instrumental variables, and in this section, we will adjust the sample scope based on
Table 7 to verify the robustness of this sample. The results of this regression are affected by the time horizon of the selected sample. Therefore, in order to verify whether the time horizon affects the results, column (1) of
Table 8 restricts the time horizon to 2010 onwards to test the impact of the level of e-government development on the new generation of productive capacity, and the regression results are significantly positive. Column (2) tests the impact of the level of e-government development on the new generation of productive capacity by controlling for the region, based on controlling for the variable of energy (electricity), and the results show that the impact of the level of e-government development on the new generation of productive capacity is significantly positive at the 5% level when only selecting data for the economies of sub-Saharan Africa. Column (3) restricts the time horizon to 2010 onwards to test the effect of the level of e-government development on the new generation of productive capacity and the regression results are not significant. Columns (4) through (9) test the robustness of the sample by controlling for the year range and region range, respectively, and the results show that the new generation of productive capacity is negatively affected, further validating the robustness of the panel regression results using instrumental variables.
4. Mechanism Testing
- (i)
Cost mechanism test
In order to test the cost mechanism in the theoretical model, we cite the relevant data published in the World Bank’s Doing Business Report [
25], from which we extract the cost score, time score, and procedures score, and calculate the average value of the above three variables, which in turn leads to the mean score of the cost mechanism test. This is taken as one of the explanatory variables. First of all, the Sobel test was conducted on the cost score, time score and procedures score, respectively: firstly,
Table 9 shows the result of the Sobel test on the cost score in the “cost” variable. The result shows that the Sobel test’s result is 17.443, which is significant at the 1% level, i.e., the cost score can moderate the relationship between e-government and the new generation of productive capacity. Secondly, we can see the result of the Sobel test for the time score in the “cost” variable in
Table 10. The result indicates that the Sobel test is 4.052, which is notable at the 1% level. In other words, the time score can also moderate the relationship between e-government and the new generation of production capacity. Thirdly,
Table 11 displays that the Sobel test for the procedures score in the “cost” variable resulted in 4.796, which is significant at the 1% level, meaning that the procedures score can regulate the relationship between e-government and the new generation of production capacity. Fourth, it is shown in
Table 12 that the result of the Sobel test on the mean score in the “cost” variable is 12.852, which is remarkable at the 1% level. That is to say, the mean score can also regulate the relationship between e-government and the new generation of productive capacity. Therefore, the “cost” variable can mediate the main relationship between e-government and the new generation of productive capacity.
The regression equation for the cost mechanism test is:
where
denotes the economy
in the
, which is the cost of accessing government services in a given year, the
denotes the level of development of e-government construction, and
denotes time fixed effects. In this section of the experiment, we focus on the coefficients of
, where
denotes the cost mechanism effect under e-government construction and is expected to be significantly positive.
In
Table 13, column (1) includes the “cost score” as an explanatory variable. The “cost score” is the average of the World Bank’s Doing Business Report scores for the cost of starting a business (male), the cost of starting a business (female), the cost of enforcing property, the cost of enforcing a contract, the cost of obtaining electricity, and the cost of obtaining a construction permit. The value of the “cost score” is closely related to the cost of obtaining government services, and the larger the value, the lower the cost of obtaining government services is for enterprises in the economy, and the more conducive the economy is to the development of productivity. The regression results show that the level of e-government development is significantly positively related to the cost of access to government services, which means that the development of e-government in an economy is conducive to reducing the cost of access to government services for firms within the economy. In column (2), the “time score” is used as an explanatory variable. The “Time Score” is calculated as the average of the World Bank’s Doing Business Report’s time to start a business (male) score, time to start a business (female) score, time to enforce property score, time to enforce contracts score, time to obtain electricity score, and time to apply for a construction permit score. The value of the “Time Score” is closely related to the cost of obtaining government services, and the larger the value, the shorter the time is for enterprises in the economy to obtain government services and the more conducive the economy is to the development of productivity. The regression results show that the level of e-government development is significantly positively related to the time score of firms’ access to government services, which implies that the development of e-government in an economy is conducive to shortening the time of firms’ access to government services within the economy. In column (3), the “procedures score” is used as an explanatory variable. The “procedures score” is calculated as the average of the World Bank’s Doing Business Report’s procedures score for starting a business (male), procedures score for starting a business (female), procedures score for enforcing property, procedures score for enforcing contracts, procedures score for obtaining electricity, and procedures score for obtaining a construction permit. The value of the “procedures score” is closely related to the cost of obtaining government services, and the larger its value, the fewer the procedures for obtaining government services for enterprises in an economy, meaning it is more conducive to the development of productivity. The regression results show that the level of e-government development is significantly positively related to the procedures score of firms’ access to government services, which means that the development of e-government in an economy is conducive to a reduction in the procedures score of firms’ access to government services within the economy. In column (4), the “mean score” is used as an explanatory variable. The “mean score” is calculated from the average of the first three items, the “cost score”, “time score”, and “procedures score”. The regression results show that the level of e-government development is significantly positively correlated with the mean values of the “cost score”, “time score”, and “procedures score”, which means that the development of e-government in an economy will lead to the development of the business sector. This means that the development of e-government in an economy will significantly reduce the cost of acquiring e-government. In summary, according to the regression results of the panel fixed-effects model, the development of e-government can reduce the cost of access to government services for enterprises within an economy, which is conducive to the development of productive capacity and verifies the results of the cost mechanism test in the theoretical model.
- (ii)
Financial mechanism test
This section focuses on testing the fiscal expenditure mechanism in the theoretical model. The results of the theoretical model indicate that, if an economy develops e-government, it will reduce the cost for firms to access government services, but there is a possibility that it will increase government or household expenditures. To further illustrate the relationship between e-government development and government expenditure on education, general government final consumption expenditure, final consumption expenditure, and household consumption expenditure, this section uses a panel fixed-effects model to validate the relationship between e-government building and the regression equation:
where
denotes the economy
in
fiscal expenditures in the year, the
denotes the level of e-government construction development, and
denotes time fixed effects. In this section of the experiment, we focus on the coefficients of
where
denotes the fiscal mechanism effect under e-government construction, and the sign of
determines the effect of e-government construction on fiscal expenditure within an economy.
In order to facilitate the study of fiscal expenditure effects within individual economies, this section takes the government expenditure on education, general government final consumption expenditure, final consumption expenditure, and household consumption expenditure as the explanatory variables to investigate the relationship between these four variables and the level of e-government development. Given that the values of government expenditure on education, general government final consumption expenditure, final consumption expenditure, and household consumption expenditure are too large, the relationship between these four variables and the level of e-government development is examined. The expenditure is too large for easy calculation, so the four variables are logarithmically treated in this section without affecting the experimental results. Since there are missing values for the government expenditure on education, general government final consumption expenditure, final consumption expenditure, and household consumption expenditure, this section will first study the relationship between the level of e-government development and the new generation of production capacity, i.e., selecting the variables containing government expenditure on education, general government final consumption expenditure, final consumption expenditure, and household consumption expenditure to verify whether the positive relationship between e-government development and the new generation of productive capacity still exists. According to the results of the panel fixed-effects model (see
Table 14), in column (1), the positive relationship between e-government development and the new generation of productive capacity still exists in the selected sample of economies, and the result is significantly positive. In column (2), using the logarithm of the government expenditure on education as the explanatory variable, the regression coefficient for the level of e-government development is 0.489, which is significantly positive at the 10% level. In column (3), the logarithm of the general government final consumption expenditure is used as the explanatory variable, in which case the regression coefficient of the level of e-government development is 0.474, which is significantly positive at the five percent level. In columns (4) and (5), using the log of the final consumption expenditure and the household consumption expenditure as explanatory variables, respectively, the regression coefficients for the level of e-government development are 0.216 and 0.160, but both results are insignificant.
The theoretical model predicts that the level of e-government development will increase the government expenditure on education, which to some extent will contribute to the development of education in an economy and, thus, to the development of productive capacity. At the same time, the level of e-government development will increase general government expenditures without affecting the total government expenditures and the household consumption expenditures.
- (iii)
confounding factors test
According to
Figure 1, above, the New Generation Productive Capacity Index (PCI) and the E-Government Development Index (EGDI) have some positive correlation. Since the New Generation Productive Capacity Index (PCI) and the E-Government Development Index (EGDI) are both variables that are country-level, they are both variables that are country-level aggregates that are endogenous to several state variables that proxy for the overall state of economic development of a country.
Consequently, in this section, the macroeconomic forces that may drive the positive correlation in
Figure 1 will be discussed. Firstly, in the last decade, governments around the world have run large fiscal deficits because of the global financial crisis and COVID-19 pandemic. Large deficits affect the financing capacity of the banking sector [
29], which in turn affects not only countries’ aggregate productive capacity but also the governments’ resources to invest in e-government capabilities. Secondly, notably, 2022 also coincides with the global surge in inflation due to supply chain issues following the Russian invasion of Ukraine [
30]. Inflationary pressures affect both economic growth (and the potential GDP) and incentives to invest in government efficiency (i.e., e-government capabilities). Lastly, the aging global population (demographics) increases fiscal pressures on governments (i.e., social security burdens), which not only affects productive capacity (workforce reduction and decline in the labor share of income) but also creates incentives to invest in e-government capabilities.
This section examines the role of governments’ fiscal space, the inflationary pressures’ effect, and whether the studied demographics can positively drive the E-Government Development Index (EGDI) and the New Generation Productive Capacity Index (PCI). The EGDI and the New Generation Productive Capacity Index (PCI) are positively correlated. Therefore, the central government debt [
31] and GDP (USD at current prices in millions GDP) [
32] are selected as proxies for the role of governments’ fiscal space; the Annual Consumer Price Index [
33] as a proxy for inflationary pressures’ effect; population ageing rate (65+) [
34] and population growth rate [
34] as proxy variables for the demographics. In addition, since the values of the central government debt and GDP are too large, the above three variables are logarithmized for the convenience of the study, which does not affect the experimental results.
In
Table 15, the results of the moderating effect analysis of central government debt are presented. Column (2) shows that the interaction term variable (EGDIln_Debt, EGDIln_Debt = EGDI * ln_Debt) is significantly positively correlated at the 1% level in regards to the effect of the E-Government Development Index (EGDI) on the New Generation Productive Capacity Index (PCI). However, according to columns (1) and (2), the EGDI, as the dependent variable, is significantly positively correlated at the 1% level before the inclusion of the interaction term variable (EGDIln_Debt), and becomes uncorrelated after the inclusion of the interaction term variable (EGDIln_Debt). Since the interaction term variable (EGDIln_Debt) is significant at the 1% level, this indicates that ln_Debt acts as a moderating variable and has a moderating effect on the relationship between the dependent variable (PCI) and the independent variable (EDGI). However, the reason for the above situation is that our model estimation is biased due to the high degree of covariance between the independent variable (EDGI) and the moderator variable (ln_Debt). In order to mitigate the high covariance between the independent variable (EDGI) and the moderating variable (ln_Debt) in the process of analyzing the moderating effect, the independent variable and the moderating variable need to be centered. By centering, the bias generated by the above model can be corrected without affecting the estimation of the model. After centering the independent variable (EDGI) and the moderator variable (ln_Debt), the interaction term variable (EGDIln_Debt_c, EGDIln_Debt_c = c_EGDI * c_ln_Debt) was generated. Putting the new interaction term variable (EGDIln_Debt_c) into the regression model yields the results in column (3). The results show that the new interaction term variable (EGDIln_Debt_c) is significantly positively correlated at the 1% level, which is consistent with the previous regression results obtained by adding the interaction term variable without centering; the independent variable (EDGI) also changes from non-significant to significantly positively correlated at the 1% level, which is more consistent with the original regression model. Therefore, in this model, centering corrects the bias generated by the model. According to column (3), the new interaction term variable (EGDIln_Debt_c) is significantly positively correlated at the 1% level, and the independent variable (EDGI) is also significantly positively correlated at the 1% level, which indicates that the moderator variable (ln_Debt) significantly enhances the effect of the independent variable (EDGI) on the dependent variable (PCI). That is to say, the central government debt plays a significant contributing role in the impact of the E-Government Development Index (EGDI) on the New Generation Productive Capacity Index (PCI).
In
Table 16, the results of the moderating effect analysis of the GDP are presented. Column (2) shows that the interaction term variable (EGDIln_GDP, EGDIln_GDP = EGDI * ln_GDP) is significantly positively correlated at the 1% level in terms of the effect of the E-Government Development Index (EGDI) on the New Generation Productive Capacity Index (PCI). Moreover, columns (1) and (2) show that the EGDI, as the independent variable, is significantly and positively correlated at the 1% level in terms of the effect of the E-Government Development Index (EGDI) on the dependent variable (PCI) before and after the addition of the interaction term variable (EGDIln_GDP). Therefore, it indicates that the moderator variable (ln_GDP) significantly enhances the effect of the independent variable (EDGI) on the dependent variable (PCI). That is to say, the GDP plays a significant role in the role of the E-Government Development Index (EGDI) on the New Generation Productive Capacity Index (PCI).
In
Table 17, the results of the moderating effect analysis of the annual consumer price index are presented. Column (2) shows that the effect of the interaction term variable (EGDIln_Con, EGDIln_Con = EGDI * ln_Consumer) in the E-Government Development Index (EGDI) on the New Generation Productive Capacity Index (PCI) is significantly negative at the 1% level. Moreover, columns (1) and (2) show that the EGDI, as the independent variable, is significantly positively correlated at the 1% level in terms of the action of the E-Government Development Index (EGDI) on the dependent variable (PCI) before and after the addition of the interaction term variable (EGDIln_Con). Therefore, it indicates that the moderating variable (ln-Consumer) significantly weakens the influence of the independent variable (EDGI) on the dependent variable (PCI), indicating that the annual consumer price index plays a significant inhibitory role in the effect of the E-Government Development Index (EGDI) on the New Generation Productive Capacity Index (PCI).
In
Table 18, the results of the moderating effect analysis of the population ageing rate are presented. Column (2) shows that the interaction term variable (EGDIAge, EGDIAge = EGDI * AgeingRate) is significantly negatively correlated at the 1% level in terms of effect of the E-Government Development Index (EGDI) on the New Generation Productive Capacity Index (PCI). Moreover, columns (1) and (2) show that the EGDI, as the independent variable, is significantly positively correlated at the 1% level in its effect on the dependent variable (PCI) both before and after the addition of the interaction term variable (EGDIAge). Therefore, it indicates that the adjusting variables (AgeingRate) significantly weaken the influence of the independent variable (EDGI) on the dependent variable (PCI), indicating that the population aging rate plays a significant inhibitory role in the effect of the E-Government Development Index (EGDI) on the New Generation Productive Capacity Index (PCI).
In
Table 19, the results of the moderating effect analysis of the population growth rate are demonstrated. Column (2) shows that the interaction term variable (EGDIGro, EGDIGro = EGDI * GrowthRate) is significantly positively correlated at the one percent level in the effect of the E-Government Development Index (EGDI) on the New Generation Productive Capacity Index (PCI). Moreover, columns (1) and (2) show that the EGDI, as the independent variable, is significantly and positively correlated at the 1% level in the effect of the E-Government Development Index (EGDI) on the New Generation Productive Capacity Index (PCI) before and after the addition of the interaction term variable (EGDIGro). Therefore, it indicates that the moderator variable (GrowthRate) significantly enhances the effect of the independent variable (EDGI) on the dependent variable (PCI), i.e., it shows the effect of the population growth rate in the E-Government Development Index (EGDI) on the New Generation Productive Capacity Index (PCI).
Thus, according to the results in
Table 15 and
Table 16, the role of governments’ fiscal space plays a significant contributory role in the effect of the E-Government Development Index (EGDI) on the New Generation Productive Capacity Index (PCI). A good fiscal space will promote a country’s total productive capacity and enhance the government’s ability to invest in e-government.
According to the results in
Table 17, the inflationary pressures not only hinder economic growth but also weaken the government’s e-government capacity.
According to the results in
Table 18 and
Table 19, demographics play a significant role in the impact of the E-Government Development Index (EGDI) on the New Generation Productive Capacity Index (PCI). Specifically, a good demographic not only promotes the development of production, but also enhances the ability of the state to invest in e-government; on the contrary, a bad demographic not only negatively affects the productive capacity, but also damages the ability of the state to invest in e-government.
5. Conclusions
This study designs an experiment using data published by the United Nations and the World Bank to investigate the relationship between a country’s level of e-government development and the new generation of productive capacity. First, we present the main findings of this study. This paper systematically examines the mechanism of the impact of e-government on the new generation of productive capacity and tests it using relevant data from major global economies. At the theoretical level, this paper constructs a general equilibrium model to digitize two macro things, e-government and productive capacity, and examines the impact of e-government construction on the new generation of productive capacity. At the evidence level, this paper identifies the impact of e-government on the new generation of productive capacity based on the data of 181 major economies around the world in 2003–2020. First, this paper conducts a regression analysis using a panel fixed-effects model, which shows that e-government has a positive contribution to the new generation of productive capacity. Second, this paper demonstrates the role of e-government in influencing the new generation of productive capacity by using the mean value of the E-Government Development Index (EGDI) of other economies in the same region as an instrumental variable. At the mechanism level, the development of e-government will directly reduce the time cost, procedural links, and expense cost of accessing government services for enterprises and individuals, and thus promote the development of productive capacity, which this paper finds through the cost-testing mechanism. In addition, the structure of social expenditures will undergo new changes with the development of e-government. The specific changes are as follows: the government education expenditure and general expenditure will increase, but the total government cost expenditure and household cost expenditure will not be affected by the construction of e-government, which this paper finds through the financial test mechanism. In other words, the government should introduce and vigorously promote online government services, which will help to reduce the cost of obtaining services for enterprises and individuals, so that society as a whole will have more money to invest in productive industries. In countries where e-government has not yet been vigorously developed, it is important to be bold enough to promote e-government, because the development of e-government will not significantly increase the total cost of government expenditure, but will reduce the pressure on the cost of expenditure of enterprises, and reduce the cost of time for the whole society to access the services of the government; these changes will further contribute to the internal development of a country, in particular the development of productive capacity.
Second, we present the limitations of this study and its future directions. As the work of this study is still in the preliminary stage, there are some limitations. One of them is that this paper mainly studies the impact relationship between e-government and the new generation of production capacity, but it has not studied in-depth how e-government develops and grows in developed countries, how production capacity becomes stronger gradually, and what the specific coordinating mechanism between the two is. Therefore, in the future, we can try to study in-depth the coordination mechanism between e-government construction and the new generation of production capacity, and combine it with relevant evidence, so as to provide valuable experience for underdeveloped countries or more slowly developing countries to give full play to the effectiveness of e-government construction. In the second place, how the government coordinates the processing of online government service applications submitted by enterprises or individuals and whether speeding up the processing of productive affairs contributes to the development of social productivity are both issues that are not solved in this paper, and that deserve to be studied in depth in the future. Thirdly, as each country promotes e-government, there may be a certain competitive relationship between various departments within the country as well as between governments, and it is worthwhile to study in-depth whether this relationship promotes or inhibits the development of productive capacity.
Third, we compare this paper with other published materials. For one, this paper is related to studies that examine e-government security and the factors that influence it during its use. Lee, Eun Seon et al. [
35] and Perez, Timothy J [
36] studied if web service security technology and network infrastructure determine whether government use of e-government is secure or not. Adala, Ajay [
37] and Mensah, Isaac Kofi [
7] found that the degree of connectedness among e-government actors can indicate the readiness and success or failure of e-government. Mensah, Isaac Kofi et al. [
38] studied the impact of government capacity and e-government performance on the adoption of e-government services. Rakhmanov, Elyor [
39] studied the existence of legislative barriers, administrative barriers, technological barriers, and user culture barriers in the development of e-government services. Unlike the existing literature, that focuses mainly on the factors influencing the development of e-government, this paper focuses on the impact of e-government on the new generation of productive capacity. The development of e-government can reduce the cost of accessing government services for enterprises or individuals, enhance social vitality, and affect the development of productive capacity. Secondly, this paper is related to the research on the impact of e-government development on economic development. Espinosa, Victor I [
40] examined the role of e-government in promoting economic transformation and development, arguing that e-government utilizes public sector information and communication technologies to enhance competitiveness and well-being. Kassen, Maxat [
41] analyzes blockchain developers’ perspectives on decentralized service delivery and details the unique algorithms of lifecycle ledgers, arguing that this technology can reliably and securely record e-government transactions. Tiika, Bernard John et al. [
42] found that the adoption of e-government is expected to improve the efficiency of government service delivery to citizens across economic sectors and will have a transformative impact on public administration and social governance. Unlike existing studies, this paper enriches the research on the impact of e-government development on governments, firms, and individuals by focusing on the specific impact of e-government on the next generation of productive capacity at the micro level.
Fourth, we compare the current level of research with the initial expectations of this study. The level of this study is not high enough and it is still in the preliminary stage, and as stated in the previous statement on the future direction of this study, further in-depth research is still to be conducted in the future. At the beginning of this study, it was only found that e-government can promote the development of the new generation of production capacity, which was later proven to be true by the data; in addition, it was further found that the development of e-government will reduce the cost of obtaining government services by enterprises included in the economy, but it will increase the government’s expenditure on education and general expenditure, although it will not affect the government’s total cost or household consumption expenditure. Therefore, in terms of the expectations at the beginning of this study, this study has found the expected research results, with certain reference significance and credibility.


