Article

The Spillover Effect of ESG Performance on Green Innovation—Evidence from Listed Companies in China A-Shares

Beijing Technology and Business University, Beijing 100048, China
*
Author to whom correspondence should be addressed.
Sustainability 2024, 16(8), 3238; https://doi.org/10.3390/su16083238
Submission received: 26 February 2024 / Revised: 6 April 2024 / Accepted: 8 April 2024 / Published: 12 April 2024
(This article belongs to the Special Issue Corporate Governance, Social Responsibility and Green Innovation)

Abstract

:
This research paper examines the spillover effect of ESG performance on green innovation behavior in companies within the same industry. The study specifically focuses on listed companies on the Shanghai Stock Exchange and Shenzhen Stock Exchange between 2011 and 2020. The results indicate that peer firms with superior environmental, social, and governance (ESG) performance have a notable and beneficial impact on the green innovation activities, quantities, and qualities of their counterparts. Significantly, this phenomenon is especially evident for the ecological (E) and societal (S) aspects of ESG performance when considering companies within the same industry. Additionally, according to our analysis, the association between peer firms’ improved ESG performance and subsequent gains in green innovation activities is mediated by higher R&D expenditure and increased green consciousness. The robustness of these findings persists even after resolving issues of endogeneity through thorough testing. In addition, this paper finds that the spillover effects are more significant for non-state-owned firms, small-sized firms, firms with more analyst attention, firms in non-highly polluting industries, and when external environmental regulations are stronger.

1. Introduction

ESG has emerged as a significant area of concern in both theoretical and practical circles in recent years. This is particularly evident amidst the uncertainties brought about by the COVID-19 pandemic, climate change, and other related factors. ESG has gradually gained prominence, surpassing the heat surrounding corporate social responsibility (CSR), and has become a “new blue ocean” for academic research. This response addresses numerous societal issues and represents the amalgamation and advancement of the principles of “ethical investment”, “socially responsible investment”, and “sustainable development” spanning the period from the 1950s to the 1990s. Subsequently, significant advancements have been made in the field of ESG, including the development of specialized organizations such as the Climate Disclosure Standards Board (CDSB), Sustainable Development Accounting Board (SASB), Value Reporting Foundation (VRF), and International Sustainable Development Standards Board (ISSB). ESG has emerged as one of the three criteria used by the world community to assess the sustainable development capability of economic organizations. ESG places greater emphasis on the disclosure of non-financial information in comparison to CSR. Companies that actively implement ESG principles take into account non-financial metrics alongside financial indicators like profit and growth. These non-financial indicators pertain to the environmental, social, and governance aspects of the company. Consequently, ESG can effectively encourage businesses to invest in the maximization of social value rather than their interests. Current studies on corporate ESG are primarily centered on the financial outcomes of ESG performance, including its influence on corporate performance [1,2], managerial behavior [3], firm value [4,5], and stock returns [6,7,8]. Nevertheless, there has been limited scholarly investigation into the impact of the ESG performance of companies within the same industry on target companies.
Enhancing the company’s green innovation potential is of significant importance within the framework of sustainable development. Green innovation refers to the creation of new ideas and technologies that aim to decrease resource usage, minimize pollution, enhance the availability of ecological technology, and encourage the shift towards a sustainable economy and lifestyle [9]. In contrast to typical innovation behaviors, GTI (green technology innovation) can not only diminish environmental pollution and enhance the company’s environmental governance capabilities but also significantly enhance the company’s fundamental competitiveness [10], thereby achieving a mutually beneficial outcome of economic growth and environmental protection [11]. Nevertheless, given the extended duration for returns and the elevated risk associated with GTI, organizations require substantial external assistance to execute GTI initiatives [12]. Consequently, it becomes crucial to investigate the elements that influence corporate green innovation. Objectively speaking, there are relationships such as games, comparisons, and competition between companies in the same industry. Therefore, driven by interests, companies in the same industry may generate spillover effects based on the above relationships. On the one hand, there is consistency among companies in the industry in terms of business conditions and corporate characteristics. As a result, the market, social, regulatory, and other pressures faced by the firms will force them to form an atmosphere of mutual imitation. On the other hand, the gaming and competitive relationship of firms in the industry will contribute to the stimulation and radiation of decision making among firms. Therefore, based on the above research gaps, this paper investigates whether the better ESG performance of companies in the same industry will have a spillover effect on the green innovation behavior of target companies. What is the transmission mechanism of this spillover effect? This is the question that needs to be answered in this paper.
This study examines the influence of a company’s ESG performance on its green technology innovation behavior within the same industry. It analyzes the ESG scores and green patent data of A-share listed companies in Shanghai and Shenzhen from 2010 to 2020. The study also investigates how the relationship between ESG performance and green technology innovation varies under different circumstances, such as ownership nature, scale difference, external supervision, industrial pollution, and environmental regulation intensity. In addition, the improvement of ESG performance in the industry primarily promotes the green innovation activities of the target enterprises through an increase in R&D investment and green awareness. The results indicate that the green innovation performance of target companies is positively influenced by the ESG performance of companies in the same industry, with the strongest promotion effect occurring in the environmental dimension (E). Ultimately, this study concludes that the impact of peer enterprises’ ESG performance on corporate green innovation activities is particularly pronounced in non-state-owned enterprises, small enterprises, enterprises with higher levels of external attention, enterprises in non-highly polluting industries, and enterprises subject to stronger external environmental supervision.
The primary incremental contributions of this study are as follows. Firstly, it broadens the existing studies on the spillover impact of corporate ESG conduct. This paper takes a different approach compared to previous research by examining the spillover effect of a company’s ESG behavior, analyzing the decision-making relevance among companies in a group, and investigating the influence mechanism of corporate ESG performance on GTI through R&D investment and green awareness. It rectifies the deficiencies of the current research and broadens the scope of investigation regarding the “theoretical black box” associated with the organization’s GTI. Secondly, it enhances the existing literature on the company’s green innovation behavior by examining the correlation between ESG performance and the company’s green innovation performance through theoretical research. The majority of the current research concentrates on analyzing the influence of political capital [13], legitimacy pressure, and corporate profitability [14] on the performance of green innovation. This study examines the “ESG performance of companies in the same industry—green innovation behavior” topic, contributing to the research on the factors that influence companies’ GTI behavior from a macro industry perspective in the context of “dual carbon”. Thirdly, this paper examines the practical aspect by analyzing the variation in ESG performance among firms within the same industry. Specifically, it explores how distinct company attributes—including ownership, size, analyst focus, and environmental regulation intensity—impact the ability of firms to innovate green technology. It offers more precise recommendations for achieving the “dual carbon” objective. This paper contributes to the existing theoretical research on the spillover effect of ESG performance of listed companies within the same industry and offers empirical evidence supporting the role of ESG behavior in promoting green innovation output.
The remaining sections of this paper are organized as follows. Section 2 presents a literature review; Section 3 offers a literature review and research hypotheses; Section 4 describes the research methodology, encompassing models, variables, and data; Section 5 conducts an analysis of empirical results, including benchmark regression, the robustness test, mediating effect regression, and heterogeneous effect regression; Section 6 gives the article’s conclusion along with some suggestions.

2. Literature Review

Based on the research content of this paper, this paper first focuses on organizing the research literature related to ESG, spillover effects, and corporate green innovation behavior. By systematically sorting out the research literature on the above three dimensions, it can not only help this paper clarify the research ideas, but also find the existing research gaps, and then provide a research basis for the theoretical foundation and research design of this paper.

2.1. The Impact of ESG

As ESG recognition continues to advance, a company’s ESG performance now not only indicates its impact on society and the environment but also influences how the capital market evaluates its development strategy and competitiveness. This affects the company’s capacity to attract and utilize different innovation resources. Currently, academic research on ESG has yielded significant findings, with a particular emphasis on exploring the relationship between corporate ESG performance and investor behavior, as well as company performance. From an investor’s standpoint, research has shown that ESG performance can help address the imbalance of information between investors and companies [15], decrease the difference between the bid and ask prices [16], and enhance investor trust [17]. The inclination of investors to invest is more influenced by environmental and social variables than governance issues [18]. Furthermore, companies that exhibit strong ESG performance experience reduced systemic risk [19], exhibit lower risk-taking behavior [20], achieve higher profitability and credit ratings [21], face fewer constraints when seeking financing [22], have a decreased likelihood of stock price crashes [23], and demonstrate superior corporate financial performance and market value [24]. Moreover, some scholars have discovered, from the perspective of resource dependence and stakeholders, that high-quality ESG performance will garner the interest of analysts and the media, thereby increasing the value of the company through the pressure and interest of stakeholders [25] and thus enhancing the competitive advantages of the company.

2.2. Related Research on Spillover Effects

The spillover effect is a prominent topic in the fields of economics and sociology [26]. Previous studies indicate that the behavior of companies in the same industry has an impact on various aspects of business, such as executive compensation [27], investment decision making [28], merger and acquisition activities [29], dividend policy [30], innovation behavior [31], and social responsibility performance [32]. These findings suggest that the behavior of companies within an industry influences a range of financial and non-financial decisions. Recent work has also examined the spillover effect of disclosing ESG information among organizations. These studies have discovered that ESG not only affects the company directly but also has an impact on stakeholders. ESG factors will have a cascading impact on the supply chain, where the ESG performance of customers is passed on to their suppliers [33]. Additionally, a company’s ESG performance can exert pressure on competitors and have a beneficial influence on their performance [34]. The target company will be influenced by the ESG practices of its industry peers in a dynamic competitive environment [35].

2.3. Related Research on the Green Innovation Behavior of Companies

Prior research on green innovation mostly concentrates on topics such as corporate governance, environmental conservation, technological advancement, and so forth. For instance, researchers have discovered that executives’ knowledge of ESG [36] and companies’ foreign direct investment [37] will enhance companies’ green innovation. However, the short-sighted actions of managers will impede the progress of green innovation [38]. Furthermore, certain scholars argue that the fundamental determinant of green innovation performance is the operational and investment strategy vision [39]. In addition, government subsidies and tax incentives [40], green organizations [41], the level of digitalization [42], government policies [43], and environmental regulations [44] are factors that contribute to the promotion of green innovation. Nevertheless, there is a scarcity of academic studies on the influence of companies’ behavior within the same industry on the green innovation performance of target companies.
The evaluation of a company’s sustainable development performance is conducted using ESG factors [45], with green innovation serving as a significant catalyst for an organization’s low-carbon transformation and sustainable development. Hence, investigating the potential relationship between the ESG performance of companies in the same industry and the green innovation of target companies is crucial for understanding the spillover effect of ESG performance. In view of this, the spillover effect of the ESG performance of listed companies in the same industry as the entry point was considered in this study, and the impact of the ESG performance of listed companies in the same industry on the green innovation performance of target companies was the focus of analysis so as to expand the relevant research dimensions of green innovation.

3. Theoretical Analysis and Research Hypothesis

3.1. Green Innovation Spillover Effect of Enterprises’ ESG Performance in the Same Industry

Firstly, according to the dynamic competition theory, companies in a competitive environment interact with each other, which prompts them to respond to their competitors’ actions. This helps prevent the creation of barriers by competitors and the loss of the company’s advantages [46,47]. When the adoption of ESG-related practices can generate value for a company and when companies in the same industry exhibit superior ESG performance, the target company will prioritize ESG development to prevent lagging. Consequently, the company will allocate increased financial, human, and material resources towards implementing ESG practices. Moreover, the target companies can capitalize on the value-added impact of ESG factors at a reduced expense and threat by utilizing the prospective resource information and decision-making foundation supplied by the pioneering firms. The target companies will replicate the environmental protection activities of the pioneer companies, such as enhancing the implementation of green innovation behaviors and increasing green innovation research and development to imitate their environmental performance.
Secondly, based on the extension of the game theory, this study posits that corporations, acting as rational decision-making entities, will make decisions based on distinct rules within a certain ESG disclosure environment [48,49]. On the one hand, an additional “remuneration” is the surface incentive for corporations to play the game; on the other hand, organizations with strong ESG performance can help investors receive excess profits [15]. Currently, environmental issues are escalating, and the company’s capacity to address sustainable development concerns has become the central focal point for investors. In order to achieve above-average returns, organizations must demonstrate their capacity for environmentally friendly and sustainable innovation to investors [23]. When the industry has a high degree of ESG information exposure, both corporate normative legitimacy and cognitive legitimacy increase simultaneously, leading to a stronger zero-sum game in the inter-company competition based on ESG information disclosure. While many companies engage in the game for further compensation, the actual circumstances prevent them from discontinuing their participation. As the normative legitimacy and cognitive legitimacy of listed companies in the same industry improve simultaneously, the target company will face stricter moral constraints and cognitive expectations. To gain the favor of investors and avoid being eliminated, the target company must enhance its green innovation performance [17]. Hence, to maintain their place as a “player” in this game, corporations should strategically engage in imitation and swiftly enhance their green innovation capabilities to establish balance and effectively mitigate potential harm.
Thirdly, the social comparison theory posits that individuals engage in comparisons with others to uphold a consistent and accurate self-assessment [50] and to preserve their self-esteem and self-value [51]. Typically, organizations, similar to individuals, will instinctively strive for a social performance that is above average, which means there is an inclination to compare themselves with one another [52]. Other businesses will incur “losses” due to the apprehension of being judged negatively by stakeholders when the average ESG level of firms in the same industry increases. As a result, these businesses will be compelled to undertake measures aimed at enhancing their ESG performance. That is, even though the business cannot meet the demand for ESG improvement, some businesses will nonetheless allow stakeholders to see their potential for sustainable development by “imitating” the strategies and tactics used by similar businesses to improve ESG performance. By doing this, they can prevent losses from the outside and have a greater positive impact on the performance of green innovation.
Based on the above analysis, we propose Hypothesis 1:
Hypothesis 1 (H1).
The ESG performance of listed companies in the same industry exerts a promoting effect on the company’s green innovation performance.

3.2. The Mediating Role of R&D Investment and Green Awareness

Given the unpredictable outcomes of corporate innovation efforts and the significant limitations on obtaining external funding, it has become crucial to successfully attract financial backing from outside investors to sustain ongoing corporate GCI initiatives [53]. Resource-based theory asserts that the internal components of organizations play a crucial role in facilitating the promotion of green technological innovation and the development of sustainable competitive advantages [54,55]. Simultaneously, the ability of enterprises to innovate in green technology is influenced by various factors such as financial resources, human resources, technical resources, and knowledge resources [56,57,58]. This, in turn, leads to enterprises having greater financial means for green innovation [24]. When the overall ESG level of firms in the same industry improves, the target enterprises will enhance their ESG performance. One of the methods to achieve this is by boosting investment in innovation. More precisely, according to the social comparison theory, when organizations in the same industry have superior ESG performance, the target enterprises are inclined to compare themselves with those companies. Investment in green innovation not only indicates the level of a company’s investment in environmentally friendly practices but also ensures that the company achieves more environmental benefits. Consequently, if enterprises in the same industry demonstrate superior ESG performance, the target enterprise may choose to invest more in environmentally friendly research and development (R&D) to enhance its own ESG structure and subsequently boost its yield of green innovations.
From the standpoint of external investment in firms, the ESG performance of target enterprises can alleviate the financial strain by attracting greater investment from sovereign wealth funds, thereby bolstering the capacity of enterprises to innovate in green technology. The ESG performance of a given industry has the potential to signal to the capital market a favorable outlook for development and entice greater inflows of high-quality external investment, particularly green investment, under the signaling theory [59]. A more reliable source of funding provides an organization with additional capital for R&D assurance, thereby mitigating the capital constraint encountered by the target organization. Ultimately, this encourages the organization to proactively adjust to market trends, augment investments in technological research and development, and foster advancements in technology and production efficiency [60]. According to Lee and Min (2015) [61], there is a strong correlation between R&D investment that includes both capital and manpower and the potential of firms to innovate in green technology. Increasing R&D investment can bolster the technical innovation of businesses, enhancing their innovation output performance and establishing a positive feedback loop of innovation input–output.
Based on the above analysis, we propose Hypothesis 2:
Hypothesis 2 (H2).
R&D investment plays a mediating role in the relationship between the ESG of listed companies in the same industry and the green innovation of target enterprises.
Green innovation activities at the corporate level are a lengthy process that necessitates not only consistent capital expenditures but also an enterprise-wide ecological culture and employee green awareness to generate sustainable energy. Environmental responsibility, as the primary duty of ESG, will compel firms to assume a more proactive stance in social responsibility and corporate governance responsibility. When the overall level of ESG practices in a particular industry improves, target enterprises tend to learn and emulate the methods and strategies employed by exemplary enterprises within the same group. This is carried out with the aim of enhancing their own ESG performance to gain a competitive advantage and surpass the industry average. Consequently, these enterprises will allocate more resources and attention towards environmental concerns, thereby showcasing their commitment to sustainability and ESG performance to stakeholders [62]. Enterprises internally adopt green innovation strategies across all areas of their operations, foster a green corporate culture, and externally enhance the quality and quantity of environmental information disclosure. These efforts aim to strengthen and demonstrate the green consciousness of all employees [63,64]. Meanwhile, if the ESG performance of a certain industry is superior, it becomes crucial to assess the legitimacy of a company’s operations due to the public and corporate stakeholders’ concern for environmental issues. Target firms often strive to enhance their ESG performance by cultivating a positive reputation and subsequently promoting green awareness, thus alleviating the burden of legitimacy [65]. According to Neu et al. (1998) [66], organizations could preserve their legitimacy without modifying their economic model by increasing information disclosure. In accordance with the theory of resource limitation, when enterprises’ green awareness is increased, they will allocate a greater portion of their limited resources toward green practices, thereby potentially augmenting the volume of green innovations they produce.
Based on the above analysis, we propose Hypothesis 3:
Hypothesis 3 (H3).
Green awareness plays a mediating role in the relationship between the ESG of listed companies in the same industry and the green innovation of target enterprises.
In summary, enterprises operating within the same industry encounter comparable external conditions, market dynamics, and limitations in terms of resources, as suggested by the dynamic competition theory, game theory, and social comparison theory. The target company will modify its green innovation practices based on the level of ESG information disclosure among companies in the same industry. It will emulate and acquire knowledge from the information and experience gained through the ESG disclosure process of other companies. Enhancing green innovation performance can be achieved by pursuing two approaches: increasing R&D investment and improving green awareness. These efforts ultimately result in a spillover effect of green innovation on the disclosure of ESG information.
Figure 1 illustrates the precise trigger mechanism and conduction path.

4. Research Design

4.1. Data Collection and Data Sources

This study focuses on publicly traded businesses in the Shanghai and Shenzhen stock exchanges, namely those listed on the A-share market, throughout the period from 2011 to 2020. A total of 27,725 samples were collected for research purposes. The following measures were taken to process the data to ensure the correctness and reliability of the study findings in this publication:
  • Since the accounting standards of financial companies are different from those of general companies, the sample of financial companies is excluded.
  • Since there are anomalies in the data of some companies, the sample of companies with missing data is excluded.
  • When listed companies in China have behaviors of non-compliance and continuous losses, these companies are labeled with symbols such as ST, *ST, and so on. In order to enhance the reliability of the study’s conclusions, these abnormal company samples are excluded.
  • All continuous variables were winsorized at the 1% and 99% quantile to prevent the impact of extreme values.
ESG performance data from Bloomberg’s ESG disclosure score were utilized in this study to generate rating findings. Additionally, green patent data and other financial information were sourced from the CSMAR database. Furthermore, Stata software (version 17.0) was employed in this work for the purpose of data analysis and processing.

4.2. Data Collection and Data Sources

4.2.1. Dependent Variable: Green Innovation Activity (PAT)

The process of innovation is intricate. The potential for innovation was assessed using three indicators employed in this study to gauge a company’s green innovation behavior. The quality of green innovation patents (PAT_QUA) was determined by taking the natural logarithm of the combined number of citations received by green invention patents, utility model patents, and design patents of listed enterprises in the T year and then adding 1 to the result. The number of green innovation patents (PAT_NUM) was calculated as the natural logarithm of the number of green invention patents awarded by the listed company in the T year, increased by 1. The green innovation activity (PAT) was quantified as the logarithm of the sum of the quality (PAT_QUA) and quantity (PAT_NUM) of green innovation, increased by 1.

4.2.2. Independent Variable: Average ESG Score of The Same Industry (ESG_SCORE)

The ESG rating published in the Bloomberg database was used in this study as a proxy variable for assessing the ESG performance of SG. The Bloomberg ESG disclosure score comprises sub-dimension scores for environmental (E), social (S), and governance (G) factors, ranging from 0 to 100. Higher scores indicate superior ESG performance. More precisely, the average ESG rating of other firms in the same industry (ESG_SCORE) obtained from the Bloomberg database, excluding our own company, was used in this study as the explanatory variable.

4.2.3. Intermediary Variable: R&D Investment (Inv), Green Awareness (Green)

The data on the company’s R&D investment and green awareness were obtained from the CSMAR database. Existing literature and R&D costs divided by total assets were utilized in this study to quantify the R&D investment intensity (Inv) of firms. This work assessed corporate green awareness by considering many dimensions and determining the cumulative scores of numerous indicators as a proxy variable for corporate green behavior (Green). Specific dimensions are placed in the Appendix A.

4.2.4. Control Variables

A series of economic characteristic indicators were chosen in this study as control variables to account for other factors that may influence the company’s green innovation based on the available research literature. The aim of this study was to analyze and regulate various financial and governance characteristics of a company, including its size (Size), asset/liability ratio (Lev), return on total assets (ROA), growth rate of main business income (Growth), size of the board of directors (Boardsize), size of independent directors (Indepsize), shareholding ratio of the top ten shareholders (Top10), shareholding ratio of the management (Mstock), executive compensation (Mincome), violation (Break), state-owned company (SOE) status, audit complexity (Big10), profit and loss (Loss), and audit risk (AO). Furthermore, the model incorporates year- and industry-fixed effects and accounts for clustering at the business level when adjusting the standard errors.
The specific definitions of the relevant variables are shown in Table 1.

4.3. Model Specification

Since the explanatory and interpretive variables in this paper are continuous variables and the research data are company-year panel data, this paper adopts the following OLS regression model to empirically test the impact of ESG performance of listed companies on corporate green innovation behavior. Specifically, the research model of this paper is constructed as follows:
P A T i , t = α 0 + α 1 E S G + α i C o n t r o l s i , t + I n d + Y e a r + μ i , t
To assess the mediation influence of corporate green awareness (Green) and R&D investment (Inv) between ESG performance and corporate green innovation behavior of companies in the same industry, we developed the following model:
M e d i a i , t = α 0 + α 1 E S G + α i C o n t r o l s i , t + I n d + Y e a r + μ i , t
P A T i , t = α 0 + α 1 E S G + α 2 M e d i a + α i C o n t r o l s i , t + I n d + Y e a r + μ i , t
PATi,t represents the proxy variable for the company’s green innovation behaviors, namely encompassing green innovation activity, green innovation quality, and green innovation quantity. ESG refers to the environmental, social, and governance performance of companies operating within the same industry. The term “ M e d i a ” includes the promotion of environmental consciousness and the allocation of resources towards research and development. The term “ C o n t r o l s i , t ” refers to the variable that is used to control or influence the outcome of an experiment or study. The symbol “ I n d ” represents the industry fixed effect, whereas “ Y e a r ” represents the year fixed effect. The variable “ t ” denotes distinct years, while “ μ i , t ” represents the random error term. Furthermore, cluster adjustment at the firm level was implemented in this work to mitigate the influence of the aggregation effect on the regression outcomes and ensure the strength and dependability of the study. In the robustness test section, this paper re-runs the regression using two-stage regression (2SLS), lagging the explanatory variables, continuous variables without shrinking tails, fixed-effects modeling, adding more control variables, excluding the effect of public health events, and replacing the explanatory variables and the explained variables, in order to overcome the endogeneity problem of this paper and to enhance the reliability of the results.

5. Empirical Results and Analysis

5.1. Descriptive Statistical Analysis

Table 2 reveals that the green innovation activity (PAT) ranges from a minimum of 0 to a maximum of 9484, with an average value of 26.86 and a standard deviation of 205.5. This indicates significant variation in the green innovation performance among different companies, with most companies exhibiting low levels of green innovation output. The average number of green patents granted by firms is 3.425, with a standard deviation of 23.27. The range of values for green innovation intellectual property among different companies varies from 0 to 901, demonstrating a significant disparity in output. Furthermore, the mean number of green patent citations is 23.33, with a standard deviation of 183.0. The smallest value is 0, while the greatest value is 8629. These statistics indicate that the quality of green patents varies significantly among various firms, with a noticeable disparity. Furthermore, the range of ESG scores across industries spans from 15.62 to 25.89, with an average of 20.66 and a standard deviation of 2.311. This suggests that the disparity in ESG performance among industries is quite minimal.

5.2. Basic Regression Results

The OLS model presented above primarily investigates the influence of companies’ ESG performance within the same industry on their green innovation activities, including both the amount and quality of such innovation. Columns (1), (3), and (5) of Table 3 represent the regression results obtained without including control variables, while columns (2), (4), and (6) represent the regression results obtained after including control variables. The results indicate a positive correlation between the ESG performance (ESG_SCORE) of companies in the same industry and their green innovation activities (PAT), green innovation quantity (PAT_NUM), and green innovation quality (PAT_QUA) (correlation coefficients = 0.039, 0.019, 0.036; p < 0.05, p < 0.05, p < 0.05). This correlation remains significant at the 1% or 5% level, regardless of whether only the core variables are considered or if control variables are included. It demonstrates that there is a positive correlation between a company’s ESG performance and its propensity to engage in green innovation. Specifically, organizations within the same industry that have higher ESG performance tend to see a more pronounced promotion effect on their green innovation behavior, which provides a preliminary confirmation of Hypothesis H1.

5.3. Robustness Test

5.3.1. 2SLS Regression Model

The reflection problem is the main problem in the study of spillover effects. The problem refers to the fact that when influenced by the cohort, the individual’s own behavior will also have an impact on this group, and at this time there is a reciprocal causal relationship between the independent variable and the dependent variable. Reverse causation is the most important reason for biasing or invalidating the findings of cohort effect studies. In order to overcome the possible endogeneity problem, Leary et al. chose stock idiosyncratic returns (IR) as an instrumental variable for instrumental variable regression, and this method has been widely used in subsequent studies. After calculating individual firms’ idiosyncratic returns, the peer average idiosyncratic return (IR) is calculated and used as an instrumental variable along with the lagged ESG performance of the peer firms, and then estimated using the 2SLS, and the regression results are shown in columns (1) and (2) of Table 4. The results in column (1) show that the lagged peer firms’ ESG performance level and stock-specific returns are significantly positively correlated with the average ESG disclosure level of peer firms (correlation coefficients = 0.934; p < 0.01), which fulfills the correlation requirement of instrumental variables. In addition, the results in column (2) show that the results of the two-stage regression are significantly positive at the 1% level (correlation coefficients = 0.041; p < 0.05), supporting the research hypothesis of this paper.
In this paper, a five-factor pricing model that includes trading volume is constructed as follows.
First, instrumental variables are constructed using Equation (4):
R i , j , t R f t = α i , j , t + β i , j , t I N D R ¯ i , j , t R f t + β i , j , t M M K T t + β i , j , t S M B S M B t + β i , j , t H M L H M L t + β i , j , t R U M D R U M D t + β i , j , t T U M D T U M D t + η i , j , t
where M K T t , S M B t , H M L t , R U M D t , and T U M D t , respectively, represent the factors of market, size, book-to-market ratio, turnover, and turnover rate in the five-factor model.
Second, Equation (4) is regressed at the beginning of each year using data from the previous 36 months, and the same regression coefficients are used in each month of the year to compute the expected value of excess return ( R ^ i , j , t R f t ) and stock-specific return ( μ ^ i , j , t ) for each month.
R ^ i , j , t R f t = α i , j , t + β ^ i , j , t I N D R ¯ i , j , t R f t + β ^ i , j , t M M K T t + β ^ i , j , t S M B S M B t + β ^ i , j , t H M L H M L t + β ^ i , j , t R U M D R U M D t + β ^ i , j , t T U M D T U M D t + η i , j , t
μ ^ i , j , t = R i , j , t R f t R ^ i , j , t R f t
Finally, after the individual firm stock idiosyncratic returns are computed, the peer average individual stock idiosyncratic return (IR) is computed and used as the two instrumental variables, along with the lagged one-period firm ESG disclosure level (LESG_SCORE), for estimation using the 2SLS.

5.3.2. Considering Geographic Heterogeneity

In recent years, with the deepening of scholars’ research on the cohort effect, when defining cohort firms, in addition to defining firms in the same industry as a cohort as mentioned earlier, some studies define firms in the same region as cohort firms. Therefore, on the premise of exploring the cohort effect of inter-industry firms, this paper further investigates the cohort effect of ESG disclosure of firms in the same region, which is also an important complementary validation of the main conclusions of this paper. Specifically, this paper defines ESG_SCORE2 as the mean value of ESG performance of firms in the same region, and the regression results are shown in column (3) of Table 4. The results in column (3) show that the conclusions of this paper still hold when cohort firms are categorized by province (correlation coefficients = 0.014; p < 0.05).

5.3.3. Explanatory Variables with a One-Period Lag

The green innovation behavior of a firm may be influenced by the ESG performance of other listed companies in the same industry, with a potential lag effect. Thus, to enhance the durability and dependability of the findings in this paper, the ESG performance of publicly traded companies in the same sector, with a one-period delay, was taken in this study as the independent variable, and a regression analysis was conducted. The results of this regression analysis are presented in column (1) of Table 5. The study includes the explanatory variable ESG_SCORE with a one-period lag in the model (1) for regression, as stated in column (1) of Table 5. The empirical findings demonstrate that the previous one-period ESG performance of publicly traded businesses within the same industry effectively stimulated the advancement of the company’s green innovation activities (correlation coefficients = 0.036; p < 0.05). This confirms the study conclusions presented in this paper.

5.3.4. Unshrunken Tail Method

In the basic regression analysis, the treatment excludes extreme values of the major variables that fall inside the upper and lower 1% levels. This is carried out to prevent these extreme values from impacting the total data. In order to emphasize the thoroughness and strength of the data, a new regression analysis was conducted in this study using the original variables without winsorization. The findings of this analysis are shown in column (2) of Table 5. The regression findings indicate that the correlation coefficients between ESG performance and businesses’ green innovation activities (PAT) of peer firms remain statistically significant at the 5% level (correlation coefficients = 0.040), supporting the validity of the hypotheses and demonstrating the resilience of the primary test data.

5.3.5. Fixed-Effects Model

The durability of the regression findings was examined in this research by incorporating the company-specific fixed-effects model to mitigate the impact of unaccounted factors and gain a clearer understanding of the correlation between the independent and dependent variables over a period of time. The outcomes are presented in column (3) of Table 5. Even when individual fixed effects within companies are taken into account, there is still a positive correlation between the ESG performance and green innovation performance of publicly traded companies in the same industry (correlation coefficients = 0.053; p < 0.01). This suggests that enhancing ESG performance continues to effectively stimulate green innovation behaviors, further confirming the reliability of the regression results.

5.3.6. Add More Control Variables

This study conducted a reanalysis by incorporating four more variables into the regression model to enhance the accuracy of the regression results and mitigate the impact of overlooked components. The variables consist of the existence of a leader holding two or more roles (Dual, coded as 1 for yes and 0 for no), the valuation of the firm (Tobinq), the cash flow generated from operational activities (OCF), and the gross domestic product (GDP) of the company’s location. The regression results are displayed in column (4) of Table 5. The results of this study were strong, demonstrating that the growth in ESG ratings of listed companies in the same industry has a favorable impact on a firm’s green innovation activities (PAT), even when considering other factors. This association maintains statistical significance at a significance level of 5% (correlation coefficients = 0.035).

5.3.7. Excluding the Impact of the Epidemic Year

The 2020 outbreak of the novel coronavirus substantially influenced the economy and financial markets, causing a severe downturn in the performance of listed companies. This study recalculated the remaining sample by excluding the data from 2020 to ensure reliable analytical outcomes. The findings are displayed in column (5) of Table 5. The findings demonstrate that even after accounting for the effects of the pandemic, the ESG performance of firms in the same industry continues to have a substantial positive influence on corporate green innovation behavior (correlation coefficients = 0.038; p < 0.05), thereby confirming the trustworthiness of the results.

5.3.8. Replacing the ESG Rating Indicator

The most recent industrial classification of the national economy (2017 edition) provided by the National Bureau of Statistics was employed in this study to mitigate the potential influence of measurement bias on the empirical findings. This classification was used to recalculate the average ESG score of the same industry (ESG_SCORE1), which was then utilized as the explanatory variable in the subsequent empirical analysis. The results from column (6) of Table 5 demonstrate that recalculating the average ESG score within the same industry has a significant positive effect on a company’s green innovation output. This effect is established at a significance level of 1% (correlation coefficients = 0.051). Furthermore, the study indicates that the specific industry category does not influence the positive impact of a company’s ESG performance on its green innovation performance. Thus, even when substituting the measuring technique for explanatory factors, the study conclusion remains valid, and the research findings are robust.

5.3.9. Replacing PAT Indicators

In addition, the explanatory variables were substituted in this study, and a new empirical analysis was conducted. Specifically, this analysis considered PAT1, which is the combined count of green utility models and green patents obtained independently in a given year, along with the count of green invention patent citations (excluding self-citations) and the count of green utility patent citations. The aforementioned variables were included in model (1) for re-regression, and the resulting regression outcomes are presented in column (7) of Table 5. The result indicates that the mean value of ESG scores in the same industry has a significant positive impact on the company’s green innovation output (correlation coefficients = 0.024; p < 0.01). This effect remains strong even after substituting the explanatory factors. The significance level of this finding is 1%, which confirms the reliability and consistency of the study results.

5.4. Subsample Regression

The overall ESG scores were utilized in the study, as mentioned above. These ESG scores were further classified into three distinct categories, E, S, and G, to enhance the credibility and persuasiveness of the data analysis results. This categorization allows for an examination of their influence on the company’s green innovation activities (PAT). The results are displayed in columns (1)–(3) of Table 6 and indicate that when a company’s innovation activities are considered as the explanatory variable, both the environmental performance (E_SCORE) and the social performance (S_SCORE) in the same industry have a positive impact on the company’s green innovation activities (PAT) (correlation coefficients = 0.055, 0.031; p < 0.01, p < 0.01). However, the governance performance (G_SCORE) in the same industry has a significantly negative impact on the company’s green innovation activities (PAT) (correlation coefficients = −0.094; p < 0.01). This suggests that peer firms that are more environmentally and socially responsible tend to promote greater green innovation output. This paper argues that there may be three reasons for this. First, if corporate governance is about as good as it can be, it may over-regulate a firm’s innovative activities. This may limit a firm’s freedom to innovate, making it difficult for the firm to experiment with new business models, products, or services. Second, in some cases, good corporate governance may make firms more risk-averse, since innovation is inherently uncertain and risky. Therefore, if the corporate governance structure is too conservative, it may discourage firms from trying to innovate. Finally, sometimes, the corporate governance structure may cause the company to focus too much on short-term benefits and ignore the importance of long-term innovation. This may cause the firm to miss out on opportunities to innovate that have long-term value.

5.5. Regression Results of the Mediating Effect

5.5.1. Mediating Mechanism Test of R&D Investment

The mediating effect approach was used in this study to examine whether the company’s R&D input (Inv) mediates the relationship between ESG performance and the company’s green innovation behavior in the same industry. Table 7 presents the test results on the mediating impact of ESG performance on the green innovation behavior of listed businesses in the same industry, namely through R&D input (Inv). The data in column (2) of Table 7 indicate that the initial phase of the test was successfully completed (correlation coefficients = 0.036; p < 0.1). In addition, the regression results for model (2) may be found in column (1) of Table 7. Equation (2) is the third phase in the mediating effect test, specifically the test result of model (3). The findings indicate that the inclusion of both ESG performance (ESG_SCORE) and R&D investment (Inv) of businesses in the same industry in the model simultaneously resulted in statistically significant outcomes for both variables (correlation coefficients = 0.000; p < 0.01). This supports the notion that “the higher the R&D investment—the greater the green innovation activities and quality—the better the ESG performance of companies in the same industry” is the mechanism by which corporate social responsibility influences the escalation of green innovation behavior. This result supports Hypothesis 2 (H2).

5.5.2. Mediating Mechanism Test of Green Awareness

This research used the mediating effect methodology to investigate whether corporate green awareness (Green) acts as a mediator between ESG performance and corporate green innovation activity in firms within the same industry. The findings of the study, presented in Table 8, demonstrate that the impact of ESG performance on green innovation behavior in the same industry-listed businesses is mediated by green awareness. The data in column (2) of Table 8 indicate that the initial stage of the test has been successfully completed (correlation coefficients = 0.037; p < 0.05). Further, the regression results of model (2) are shown in column (1) of Table 8, and the results show that the coefficients of ESG performance (ESG_SCORE) and green awareness (Green) of the same-industry firms are significantly positive, indicating that the better the ESG performance of the same-industry firms, the better the green awareness of the firms. Column (2) displays the third step of the mediation effect test, specifically the test results of model (3). The results indicate that when the ESG performance (ESG_SCORE) and green awareness (Green) variables of companies within the same industry are simultaneously included in the model, the coefficients of both ESG performance (ESG_SCORE) and green awareness (Green) for these same-industry companies are statistically significant (correlation coefficients = 0.455; p < 0.01). This demonstrates the mechanism of corporate social responsibility in enhancing green innovation behavior, i.e., it verifies the transmission line of “better ESG performance of companies in the same industry—increased green awareness of companies—increased green innovation behavior” as the pathway by which information is sent. This result supports Hypothesis 3 (H3).

5.6. Heterogeneity Analysis

5.6.1. Corporate Property Rights

The nature of a company’s property rights impacts the disparities in the way it distributes resources and employs technology. Considering the crucial influence of the ESG performance of firms with varied property rights on the company’s green innovation performance, this article further explores the moderating function of distinct corporate property rights features. The chosen sample firms were classified based on their property rights affiliation, specifically splitting them into two categories: non-state-owned companies and state-owned enterprises. The regression findings are displayed in Table 9. In the group of non-state-owned companies shown in column (1), the correlation coefficients of ESG performance with firms’ green innovation performance are positive and statistically significant at the 5% level (correlation coefficients = 0.039). In the sample of state-owned firms, as indicated in column (2), the correlation coefficients are positive and pass the 10% significance level test (correlation coefficients = 0.057). This implies that the impact of ESG performance on firms’ green innovation behaviors is more noticeable in non-state-owned companies compared to state-owned companies in the same industry. This paper suggests the following reasons. State-owned enterprises exhibit a significant tendency to follow established patterns and are less motivated to adopt environmentally friendly technological advancements. However, they are more compelled to fulfill their social obligations. Non-state-owned enterprises exhibit reduced dependence on the government compared to state-owned companies, resulting in limited access to funding possibilities and heightened competitive pressure within the market. Consequently, they demonstrate superior performance in ESG practices and innovation in green technology.

5.6.2. Size of Enterprise

Green innovation necessitates a greater investment scale and a longer investment cycle compared to non-green innovation. As a result, it places greater demands on the company’s internal funds and capital turnover capacity. When the company’s internal funds are insufficient to support green innovation, the company may be compelled to delay or forgo green innovation endeavors. This research examines the influence of firm size on green innovation behavior. The sample is divided into two groups, i.e., small companies and large companies, based on whether they are larger than the median of the sample. The regression findings are presented in Table 10. The correlation coefficient between the ESG performance of companies in the same industry and their green innovation behavior is significant at a 1% significance level for small companies (column (1)), correlation coefficients = 0.047; p < 0.01). In comparison, for large companies (column (2)), the correlation coefficient remains significant at a 5% significance level (correlation coefficients = 0.051). This suggests that the impact of ESG performance on green innovation behavior is more significant for small companies. This study posits the following possible cause. The enhancement of ESG performance can greatly facilitate the eco-friendly advancement of small enterprises in terms of both quantity and quality. However, the influence on the eco-friendly advancement of large enterprises is less pronounced. This could be attributed to the fact that large enterprises possess more robust internal financial resources and turnover capabilities, as well as a stronger capacity to acquire eco-friendly innovation information and resources externally, in comparison to small enterprises. Large companies face fewer financial limitations and are not required to enhance their ESG scores to gain investor favor. Conversely, small companies, constrained by limited internal financial resources and liquidity, must enhance their ESG performance to attract the interest of additional investors and financial institutions in funding green innovation endeavors.

5.6.3. Analyst Coverage

The information transfer theory posits that analysts, acting as intermediates, can effectively reduce information asymmetry. The pressure transmission concept posits that an excessive amount of attention from analysts might lead to increased pressure on firm management to provide short-term results. If analysts possess significant sway over management and unduly prioritize the firm’s immediate performance, it will result in myopic decision making by the management, hence discouraging enterprises from engaging in innovation. This study examines the impact of analyst attention on the performance of green innovation. It recognizes that a company’s ESG performance can be influenced by external media reports and the attention of analysts. To investigate this, the sample companies were divided into two groups based on the level of analyst attention they received. The division was made by comparing the number of analysts who have followed and analyzed the listed company within one year to the median amount of analyst research in the sample. A regression analysis was then conducted.
The regression findings are displayed in Table 11. The information in column (1) shows that ESG performance does not have a statistically significant effect on how peer businesses act when it comes to green innovation in the sample companies, to which analysts do not pay much attention (correlation coefficients = 0.019; p > 0.1). In column (2), it is seen that the beneficial impact of the ESG performance of peer businesses on the green innovation behaviors of firms is more significant and effective among firms that receive greater attention from analysts (correlation coefficients = 0.060; p < 0.01). This paper argues that the main reason for these results is that both analyst and peer spillovers are soft constraints for firms. Under the dual role, the two mechanisms will form a complementary effect, and both can increase the green innovation behavior of listed companies. Therefore, the spillover effect is more obvious when there is more analyst attention.

5.6.4. Industry Classification

Various domestic and international studies have indicated that the specific industries in which companies operate significantly influence their ESG performance and overall company performance. In this study, we utilized the “Listed Companies Environmental Verification Industry Classification and Management Directory” to categorize the selected sample into highly polluting industries and non-highly polluting industries. The objective was to examine the extent to which companies with varying pollution levels positively affect their ESG performance and green innovation performance. The regression results in Table 12 show that ESG performance has a positive effect on a company’s green innovation behavior. This effect is statistically significant at the 1% level for companies in industries with relatively low pollution levels, as shown in column (2) (correlation coefficients = 0.054; p < 0.01). However, in industries with high pollution levels, as shown in column (1), this influence is not statistically significant (correlation coefficients = −0.001; p > 0.1). This suggests that the impact of ESG performance on a company’s green innovation behavior is more pronounced in industries with low pollution levels.
Stakeholders tend to attribute negative externalities to the production and operation activities of heavily polluting companies due to the characteristics of heavy pollution. Despite the fact that improving environmental performance is an inherent responsibility of heavily polluting companies, this perception causes stakeholders to pay less attention to the ESG performance of heavily polluting companies. In contrast, the production and operational activities of publicly traded companies in environmentally friendly industries align more closely with the principles of ecological and sustainable development. These companies receive greater policy support, and their disclosed ESG information is highly valued and acknowledged by stakeholders. As a result, investors show greater enthusiasm for investing in these companies. Hence, the proactive dissemination of top-notch ESG data by publicly traded firms in environmentally friendly sectors can enhance their visibility, garner greater backing from stakeholders, mitigate funding limitations, and stimulate investment in technological advancements, thereby fostering the enhancement of green innovation performance.

5.6.5. Environmental Regulation

Environmental regulation has a crucial role in promoting the development of green technology innovation, serving as a significant component of social regulation. Government regulations of environmental matters compel companies to discontinue energy-intensive products, driving them to enhance their production methods and practices through intensified technological R&D investment endeavors and sustained implementation of eco-friendly technological advancements. However, it is said that strict environmental rules also lead to high pollution control expenses in enterprises, which greatly decrease their operational earnings, and the absence of R&D money hinders the invention process of green technology. In particular, some scholars have pointed out that the relationship between environmental regulation and regional green innovation shows a “U”-shaped or inverted “U”-shaped relationship and that the performance of green innovation is greatly affected by the intensity and duration of environmental regulation.
The aim of this study was to examine the influence of environmental regulation on enterprises’ green innovation performance. Regression analysis was employed, with GDP/coal consumption (measured in tons) serving as an indicator of environmental regulation. The findings from Table 13 indicate a significant positive relationship between environmental regulation (ER) and the ESG performance of companies within the same industry (correlation coefficients = 0.042; p < 0.05). This suggests that as environmental regulation improves, the ESG performance of companies in the same industry can effectively enhance the company’s green innovation performance.

6. Conclusions and Implications

6.1. Conclusions and Discussion

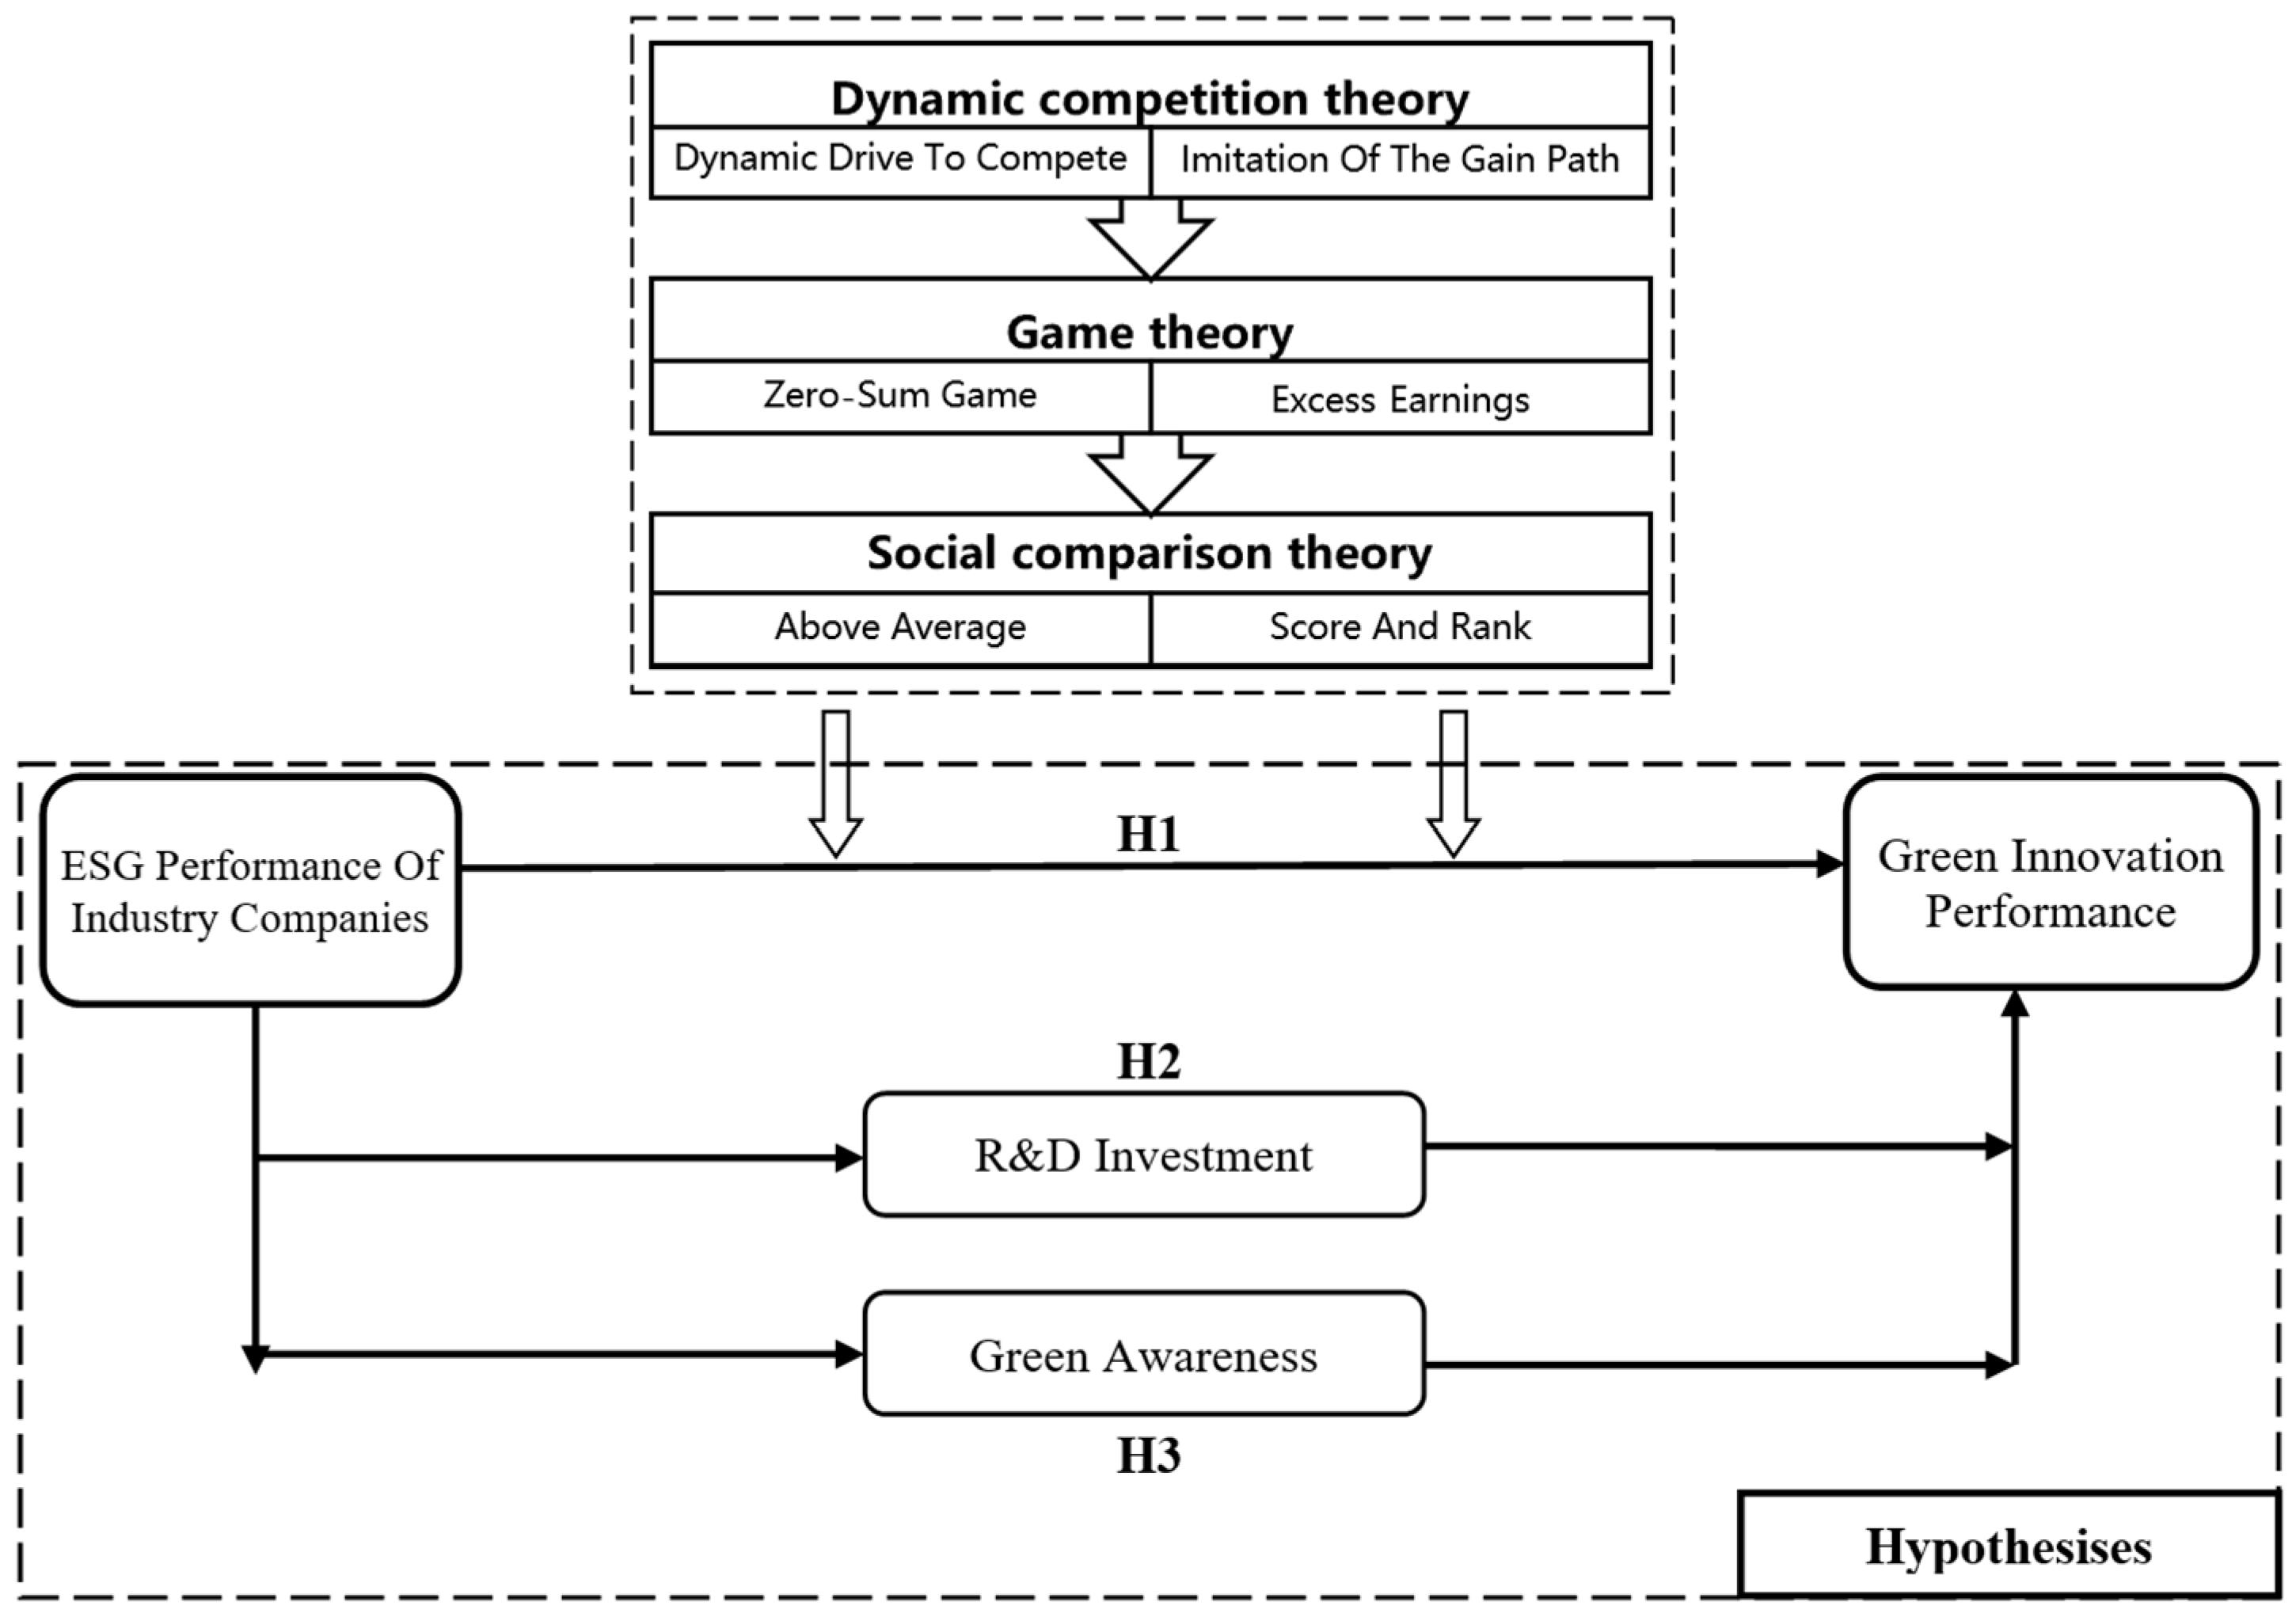
This study utilized dynamic competition theory, game theory, social comparison theory, resource base theory, and competitive strategy theory to examine and verify the spillover effects of companies’ ESG performance within the same industry. Additionally, it investigated the impact of these spillover effects on the green innovation performance of target companies. Furthermore, the study explored the mediating role of companies’ R&D investment and green awareness in this relationship. This research further analyzed the green innovation effect of ESG performance on various sub-scores. It also examined the heterogeneity of the green innovation effect of ESG performance from various property rights, sizes, levels of external monitoring, industries, and environmental regulations. The findings of this paper are based on the Chinese institutional context, which provides empirical evidence not only for the Chinese institutional environment on the one hand, but also can provide lessons for other developing countries. The findings of the research are as follows.
Firstly, the benchmark regression findings of this research (Table 3) indicate that when the ESG performance of publicly traded firms in the same industry improves, the target company will allocate greater attention towards enhancing its own ESG performance due to competitive pressure and above-average incentives. ESG promotes the idea of environmentally friendly conservation and enhances social accountability. Green innovation refers to the company’s efforts to modify its goods, technology, and manufacturing methods with the aim of safeguarding the environment. Hence, in order to enhance ESG performance, the firm should prioritize the advancement of green innovation initiatives and implement tangible measures by committing resources to foster its own green innovation performance.
Secondly, further analysis of this study (Table 6) reveals that the environmental (E) and social (S) performance of the average level of listed companies in the same industry can have a positive impact on the green innovation performance of the target companies. Notably, the impact of corporate environmental (E) performance is more pronounced and statistically significant in this regard. Nevertheless, the effectiveness of corporate governance (G) has a negative impact on the firm’s green innovation behavior. A company that actively embraces environmental responsibility will enhance its investment in environmental management and innovation in environmental technology. This will not only drive green technology innovation but also confer a competitive edge to the company in the realm of green innovation. Active corporate social responsibility entails the company receiving recognition from stakeholders and gaining a competitive advantage in terms of reputation. It also helps address the issue of information asymmetry with stakeholders and promotes the advancement of green technology research, development, and innovation. When companies take on the duty of stakeholders, the need for environmental management and environmentally friendly technology can directly encourage them to engage in research and development for green innovation. This, in turn, leads to an increased emphasis on and investment in green innovation practices. Once a satisfactory level of corporate governance performance is achieved, managers may develop a myopic inclination, prioritizing management inputs to optimize the organizational structure and enhance the system while being reluctant to allocate additional funds towards green research and development. This hinders the progress of green innovation performance to some extent and diminishes or decelerates green innovation activities.
Thirdly, based on the results of the mediation mechanism test (Table 7), this study comes to the conclusion that improving a company’s ESG performance makes it easier to share non-financial information with outside stakeholders, evens out the distribution of information, promotes a responsible and positive corporate image, and leads to higher-quality investment from outside the company. Consequently, the firm may acquire additional cash to allocate towards technological research and development. This will facilitate the advancement of green technology and enhance production efficiency, ultimately leading to improved performance in the company’s green innovation output. This creates a positive feedback loop of green innovation called “input–output.” According to the findings of the mediation mechanism test in this study (Table 8), it can be concluded that in order to enhance their ESG performance and achieve sustainable development, target firms within the same industry should adopt a range of environmentally friendly strategies and integrate green awareness into all aspects of their operations. When the leadership, administration, and workers at all levels of an organization possess a robust understanding and commitment to environmental sustainability, organizations will prioritize internal initiatives for green innovation and actively promote research and development in this area. Consequently, this will lead to enhanced performance in green innovation.
Lastly, according to the analysis of diversity in this research (Table 9, Table 10, Table 11, Table 12 and Table 13), it is observed that non-state-owned companies, in comparison to state-owned companies, have weaker connections with the government, encounter more intense competition in the market, experience greater limitations in obtaining financial resources, and possess greater motivations to engage in green technological innovation endeavors with the aim of enhancing their corporate competitiveness. Small firms, in contrast to large firms, have limited internal financial strength and turnover capacity, resulting in weaker external access to green innovation information and resources. Consequently, small firms have a greater need to enhance their ESG performance in order to attract the attention of investment entities and financial institutions. As a result, the impact of ESG performance on green innovation performance is more pronounced for small firms. As the focus from external analysts increases, the firm’s management conduct is subjected to more rigorous scrutiny. This compels the corporation to govern its own behavior and engage in green innovation initiatives more actively. The ESG performance of companies in heavily polluting industries has a lesser impact on the investment enthusiasm of stakeholders, who generally believe that improving environmental performance is the inherent responsibility of such companies. Conversely, the production and operation activities of publicly traded companies in non-heavily polluting industries are more consistent with the principles of green and sustainable development. Consequently, stakeholders are more attentive to the disclosed ESG information pertaining to such companies. Environmental rules have enhanced the oversight and control of local governments in environmental matters, compelling firms to fulfill obligatory environmental criteria solely by means of heightened technical research and development and ongoing green technology innovation.

6.2. Inspiration and Suggestions

In order to encourage the overall improvement of green innovation performance of companies in the same industry, government regulatory agencies should establish and improve the ESG information disclosure system and reward and punishment system to guide companies in various industries to support each other, encourage benign competition, and stimulate the implementation of green innovation behavior. Increased support from government functional departments for businesses with excellent ESG performance is needed. Examples of this support include integrating ESG evaluation into procurement policies and encouraging financial institutions to offer credit support, tax relief, financial subsidies, and other benefits. By assisting businesses in lowering the cost of environmental protection and green innovation, these departments will help the industry perform better overall in terms of green innovation. Businesses should also be encouraged and directed to conform more closely with the ESG standards of the top businesses in the same sector, use the spillover effect’s transmission mechanism to establish a variety of demonstration businesses, use the power of example to persuade other businesses in the same sector to follow suit, fully utilize the spillover effect’s positive incentive role, and support businesses in their ongoing efforts to develop competitive advantages through green innovation. Subsequently, the ecological, sustainable, and low-carbon progress of Chinese enterprises as a whole must be encouraged.
In addition to considering a company’s production and operations, investors should also factor environmental and social responsibility into the evaluation process when selecting investment targets. This will force the company to reorient its green innovation strategy system and fulfill its environmental and social obligations. Investors should keep up with external supervision intelligence and urge companies to prioritize ESG concepts. The amount of money should also be considered to boost long-term investment returns and environmental benefits. Investors and investment institutions should raise their own awareness of ESG issues when making investments and push businesses to implement green innovation, inspiring a variety of market participants to get involved in the development of green, low-carbon, and recycling projects.
Companies should create ESG and green innovation strategies, incorporate green ESG concepts into their daily operations, company strategies, and culture, and apply these concepts to management systems at all levels. This is especially important for listed businesses in high-pollution industries and those with less external oversight. Additionally, businesses should pay more attention to the development of ESG, raise awareness of their obligations under ESG, and encourage the methodical advancement of green innovation. Businesses should also improve their corporate governance, make ESG and green innovation decisions that are more scientific and logical, invest more in management and R&D, and set aside a range of resources, such as money and people, for related activities. They could look at the number of patents on green innovation and the ESG practices of companies in the same industry and figure out how to make more ethical and environmentally friendly decisions. This would help businesses quickly adjust to changing environmental conditions, forge hard-to-replicate competitive advantages, and start down the path of long-term, excellent green development.

6.3. Research Limitations and Future Prospects

This paper innovatively investigates the spillover effect of ESG performance of companies in the same industry based on the data of Chinese listed companies. However, the study still has the following limitations. On the one hand, the ESG performance of listed companies is made by third-party intermediaries. Therefore, the ESG performance made by different organizations is divergent, and whether this divergence affects the results of this paper is yet to be tested. In the future, we can focus on the role of ESG divergence in spillover effects. On the other hand, the research data in this paper are based on the Chinese institutional context. Therefore, whether the conclusions of this paper hold in developed countries is yet to be tested. Therefore, future research can be conducted based on the data of listed companies in Europe, the United States, and other regions to verify the generalizability of this paper’s conclusions.

Author Contributions

Conceptualization, H.-L.Z.; methodology, H.-L.Z.; software, H.-L.Z.; validation, H.-L.Z.; formal analysis, H.-L.Z.; investigation, H.-L.Z.; resources, H.-L.Z.; data curation, H.-L.Z.; writing—original draft preparation, H.-L.Z.; writing—review and editing, H.-L.Z.; visualization, H.-L.Z.; supervision, H.-L.Z. and K.-Z.Y. All authors have read and agreed to the published version of the manuscript.

Funding

This research received no external funding.

Institutional Review Board Statement

Not applicable.

Informed Consent Statement

Informed consent was obtained from all subjects involved in the study.

Data Availability Statement

The data presented in this study are available from a public dataset.

Conflicts of Interest

The authors declare no conflicts of interest.

Appendix A

The indicators to measure the company’s green awareness include whether to disclose the concept of environmental protection, whether to disclose the environmental protection target, whether to disclose the environmental protection management system, whether to disclose the environmental protection education and training, whether to have the environmental protection special action, whether to have the environmental incident emergency mechanism, whether to have the environmental protection honor or reward, whether to have the three simultaneous systems, whether to disclose the waste gas emission reduction and treatment, whether to disclose the waste water emission reduction control, whether to disclose dust and smoke control, whether to disclose solid waste utilization and disposal, whether to disclose noise and light pollution radiation control, whether to disclose the implementation of clean production, whether to disclose environmental information in the annual report of the listed company, whether to disclose the social responsibility report, whether to disclose the key pollution monitoring unit, whether to disclose the environmental report, whether to disclose pollutant discharge standard status, whether there are sudden environmental accidents, whether there are illegal environmental incidents, whether there are environmental petition cases, whether to pass ISO14001 certification [67], whether to pass ISO9001 certification [68], whether to disclose wastewater emissions, whether to disclose COD emissions, whether to disclose SO2 emissions, whether to disclose CO2 emissions, whether to disclose soot and dust emission amount, and whether to disclose the amount of industrial solid waste production. If the above events have been disclosed or exist, the value is 1; otherwise, it is 0.

References

  1. Aqabna, S.M.; Aga, M.; Jabari, H.N. Firm Performance, Corporate Social Responsibility and the Impact of Earnings Management during COVID-19: Evidence from MENA Region. Sustainability 2023, 15, 1485. [Google Scholar] [CrossRef]
  2. Zhao, C.; Guo, Y.; Yuan, J.; Wu, M.; Li, D.; Zhou, Y.; Kang, J. ESG and Corporate Financial Performance: Empirical Evidence from China’s Listed Power Generation Companies. Sustainability 2018, 10, 2607. [Google Scholar] [CrossRef]
  3. Avramov, D.; Cheng, S.; Lioui, A.; Tarelli, A. Sustainable investing with ESG rating uncertainty. J. Financ. Econ. 2022, 145, 642–664. [Google Scholar] [CrossRef]
  4. Fatemi, A.; Glaum, M.; Kaiser, S. ESG performance and firm value: The moderating role of disclosure. Glob. Financ. J. 2018, 38, 45–64. [Google Scholar] [CrossRef]
  5. Wong, W.C.; Batten, J.A.; Ahmad, A.H.; Mohamed-Arshad, S.B.; Nordin, S.; Adzis, A.A. Does ESG certification add firm value? Financ. Res. Lett. 2021, 39, 101593. [Google Scholar] [CrossRef]
  6. Auer, B.R.; Schuhmacher, F. Do socially (ir) responsible investments pay? New evidence from international ESG data. Q. Rev. Econ. Financ. 2016, 59, 51–62. [Google Scholar] [CrossRef]
  7. Takahashi, H.; Yamada, K. When the Japanese stock market meets COVID-19: Impact of ownership, China and US exposure, and ESG channels. Int. Rev. Financ. Anal. 2021, 74, 101670. [Google Scholar] [CrossRef]
  8. Pedersen, L.H.; Fitzgibbons, S.; Pomorski, L. Responsible investing: The ESG-efficient frontier. J. Financ. Econ. 2021, 142, 572–597. [Google Scholar] [CrossRef]
  9. Yin, J.; Gong, L.; Wang, S. Large-scale assessment of global green innovation research trends from 1981 to 2016: A bibliometric study. J. Clean. Prod. 2018, 197, 827–841. [Google Scholar] [CrossRef]
  10. Tu, Y.; Wu, W. How does green innovation improve enterprises’ competitive advantage? The role of organizational learning. Sustain. Prod. Consum. 2021, 26, 504–516. [Google Scholar] [CrossRef]
  11. Peng, W.; Yin, Y.; Kuang, C.; Wen, Z.; Kuang, J. Spatial spillover effect of green innovation on economic development quality in China: Evidence from a panel data of 270 prefecture-level and above cities. Sustain. Cities Soc. 2021, 69, 102863. [Google Scholar] [CrossRef]
  12. Yu, C.H.; Wu, X.; Zhang, D.; Chen, S.; Zhao, J. Demand for green finance: Resolving financing constraints on green innovation in China. Energy Policy 2021, 153, 112255. [Google Scholar] [CrossRef]
  13. Lin, H.; Zeng, S.X.; Ma, H.Y.; Qi, G.Y.; Tam, V.W. Can political capital drive corporate green innovation? Lessons from China. J. Clean. Prod. 2014, 64, 63–72. [Google Scholar] [CrossRef]
  14. Li, D.; Zheng, M.; Cao, C.; Chen, X.; Ren, S.; Huang, M. The impact of legitimacy pressure and corporate profitability on green innovation: Evidence from China top 100. J. Clean. Prod. 2017, 141, 41–49. [Google Scholar] [CrossRef]
  15. Sugianto, N.A.; Riandy, C.N.; Zainavy, S.F.; Hartikasari, A.I. The Contribution of Environmental, Social, and Governance (ESG) Disclosure to Reduce Investor Asymmetry Information. Proc. Ser. Soc. Sci. Humanit. 2022, 7, 56–61. [Google Scholar] [CrossRef]
  16. He, F.; Feng, Y.; Hao, J. Corporate ESG rating and stock market liquidity: Evidence from China. Econ. Model. 2023, 129, 106511. [Google Scholar] [CrossRef]
  17. Tang, H.; Xiong, L.; Peng, R. The mediating role of investor confidence on ESG performance and firm value: Evidence from Chinese listed firms. Financ. Res. Lett. 2024, 61, 104988. [Google Scholar] [CrossRef]
  18. Sultana, S.; Zulkifli, N.; Zainal, D. Environmental, social and governance (ESG) and investment decision in Bangladesh. Sustainability 2018, 10, 1831. [Google Scholar] [CrossRef]
  19. Aevoae, G.M.; Andrieș, A.M.; Ongena, S.; Sprincean, N. ESG and systemic risk. Appl. Econ. 2023, 55, 3085–3109. [Google Scholar] [CrossRef]
  20. Shakil, M.H. Environmental, social and governance performance and financial risk: Moderating role of ESG controversies and board gender diversity. Resour. Policy 2021, 72, 102144. [Google Scholar] [CrossRef]
  21. Kim, S.; Li, Z. Understanding the impact of ESG practices in corporate finance. Sustainability 2021, 13, 3746. [Google Scholar] [CrossRef]
  22. Ma, D.; Li, L.; Song, Y.; Wang, M.; Han, Q. Corporate Sustainability: The Impact of Environmental, Social, and Governance Performance on Corporate Development and Innovation. Sustainability 2023, 15, 14086. [Google Scholar] [CrossRef]
  23. Feng, J.; Goodell, J.W.; Shen, D. ESG rating and stock price crash risk: Evidence from China. Financ. Res. Lett. 2022, 46, 102476. [Google Scholar] [CrossRef]
  24. Zhou, G.; Liu, L.; Luo, S. Sustainable development, ESG performance and company market value: Mediating effect of financial performance. Bus. Strategy Environ. 2022, 31, 3371–3387. [Google Scholar] [CrossRef]
  25. Zhang, C.; Wu, X. Analyst Coverage and Corporate ESG Performance. Sustainability 2013, 15, 12763. [Google Scholar] [CrossRef]
  26. Li, F.; Li, G. Agglomeration and spatial spillover effects of regional economic growth in China. Sustainability 2018, 10, 4695. [Google Scholar] [CrossRef]
  27. Noja, G.G.; Cristea, M.; Jurcut, C.N.; Buglea, A.; Lala Popa, I. Management financial incentives and firm performance in a sustainable development framework: Empirical evidence from European companies. Sustainability 2020, 12, 7247. [Google Scholar] [CrossRef]
  28. Yuan, D.; Shang, D.; Ma, Y.; Li, D. The spillover effects of peer annual report tone for firm innovation investment: Evidence from China. Technol. Forecast. Soc. Chang. 2022, 177, 121518. [Google Scholar] [CrossRef]
  29. Tunyi, A.A. Revisiting acquirer returns: Evidence from unanticipated deals. J. Corp. Financ. 2021, 66, 101789. [Google Scholar] [CrossRef]
  30. Holder, M.E.; Langrehr, F.W.; Hexter, J.L. Dividend policy determinants: An investigation of the influences of stakeholder theory. Financ. Manag. 1998, 27, 73–82. [Google Scholar] [CrossRef]
  31. Cheung, K.-Y.; Lin, P. Spillover effects of FDI on innovation in China: Evidence from the provincial data. China Econ. Rev. 2004, 15, 25–44. [Google Scholar] [CrossRef]
  32. Tang, P.; Fu, S.; Yang, S. Do peer firms affect corporate social performance? J. Clean. Prod. 2019, 239, 118080. [Google Scholar] [CrossRef]
  33. Dai, R.; Liang, H.; Ng, L. Socially responsible corporate customers. J. Financ. Econ. 2021, 142, 598–626. [Google Scholar] [CrossRef]
  34. Guntuka, L. Inter-Firm ESG Rivalry: A Competitive Dynamics View. Sustainability 2022, 14, 13665. [Google Scholar] [CrossRef]
  35. Gu, J. Digitalization, Spillover and Environmental, Social, and Governance Performance: Evidence from China. J. Environ. Dev. 2024. [Google Scholar] [CrossRef]
  36. Wang, D.; Luo, Y.; Hu, S.; Yang, Q. Executives’ ESG cognition and enterprise green innovation: Evidence based on executives’ personal microblogs. Front. Psychol. 2022, 13, 1053105. [Google Scholar] [CrossRef] [PubMed]
  37. Zhang, W.; Zhang, S.; Chen, F.; Wang, Y.; Zhang, Y. Does Chinese companies’ OFDI enhance their own green technology innovation? Financ. Res. Lett. 2023, 15, 104113. [Google Scholar] [CrossRef]
  38. Zhang, X.; Jiang, F.; Liu, H.; Liu, R. Green finance, managerial myopia and corporate green innovation: Evidence from Chinese manufacturing listed companies. Financ. Res. Lett. 2023, 58, 104383. [Google Scholar] [CrossRef]
  39. Wan, X.; Wang, Y.; Qiu, L.; Zhang, K.; Zuo, J. Executive green investment vision, stakeholders’ green innovation concerns and enterprise green innovation performance. Front. Environ. Sci. 2022, 10, 997865. [Google Scholar] [CrossRef]
  40. Xu, J.; Ng, C.P.; Sam, T.H.; Vasudevan, A.; Tee, P.K.; Ng, A.H.; Hoo, W.C. Fiscal and tax policies, access to external financing and green innovation efficiency: An evaluation of chinese listed firms. Sustainability 2023, 15, 11567. [Google Scholar] [CrossRef]
  41. Cheng, Z.; Wu, B.; Deng, X.; Li, W. The impact of employees’ pro-environmental behaviors on corporate green innovation performance: The mediating effect of green organizational identity. Front. Psychol. 2022, 13, 984856. [Google Scholar] [CrossRef] [PubMed]
  42. Xu, Q.; Li, X.; Dong, Y.; Guo, F. Digitization and green innovation: How does digitization affect enterprises’ green technology innovation? J. Environ. Plan. Manag. 2023, 18, 1–30. [Google Scholar] [CrossRef]
  43. Shen, C.; Li, S.; Wang, X.; Liao, Z. The effect of environmental policy tools on regional green innovation: Evidence from China. J. Clean. Prod. 2020, 254, 120122. [Google Scholar] [CrossRef]
  44. Zhang, M.; Yan, T.; Gao, W.; Xie, W.; Yu, Z. How does environmental regulation affect real green technology innovation and strategic green technology innovation? Sci. Total Environ. 2023, 872, 162221. [Google Scholar] [CrossRef] [PubMed]
  45. Rajesh, R. Exploring the sustainability performances of firms using environmental, social, and governance scores. J. Clean. Prod. 2020, 247, 119600. [Google Scholar] [CrossRef]
  46. McGrath, R.G.; Chen, M.-J.; MacMillan, I.C. Multimarket maneuvering in uncertain spheres of influence: Resource diversion strategies. Acad. Manag. Rev. 1998, 23, 724–740. [Google Scholar] [CrossRef]
  47. Peteraf, M.A.; Bergen, M.E. Scanning dynamic competitive landscapes: A market-based and resource-based framework. Strateg. Manag. J. 2003, 24, 1027–1041. [Google Scholar] [CrossRef]
  48. Camerer, C.F. Progress in behavioral game theory. J. Econ. Perspect. 1997, 11, 167–188. [Google Scholar] [CrossRef]
  49. Hales, J.; Matsumura, E.M.; Moser, D.V.; Payne, R. Becoming sustainable: A rational decision based on sound information and effective processes? J. Manag. Account. Res. 2016, 28, 13–28. [Google Scholar] [CrossRef]
  50. Zell, E.; Alicke, M.D. Comparisons over time: Temporal trajectories, social comparison, and self-evaluation. Eur. J. Soc. Psychol. 2010, 40, 375–382. [Google Scholar] [CrossRef]
  51. Wood, J.V. Theory and research concerning social comparisons of personal attributes. Psychol. Bull. 1989, 106, 231. [Google Scholar] [CrossRef]
  52. Verdi, S.; Marquand, A.F.; Schott, J.M.; Cole, J.H. Beyond the average patient: How neuroimaging models can address heterogeneity in dementia. Brain 2021, 144, 2946–2953. [Google Scholar] [CrossRef] [PubMed]
  53. Kahn, K.B. Understanding innovation. Bus. Horiz. 2018, 61, 453–460. [Google Scholar] [CrossRef]
  54. Cohen, L.; Diether, K.; Malloy, C. Misvaluing innovation. Rev. Financ. Stud. 2013, 26, 635–666. [Google Scholar] [CrossRef]
  55. Drucker, P.F. The discipline of innovation. Harv. Bus. Rev. 1998, 76, 149–157. [Google Scholar] [CrossRef]
  56. Ames, E. Research, invention, development and innovation. Am. Econ. Rev. 1961, 51, 370–381. [Google Scholar]
  57. Wilden, R.; Lin, N.; Hohberger, J.; Randhawa, K. Selecting innovation projects: Do middle and senior managers differ when it comes to radical innovation? J. Manag. Stud. 2023, 60, 1720–1751. [Google Scholar] [CrossRef]
  58. Hofstra, B.; Kulkarni, V.V.; Munoz-Najar Galvez, S.; He, B.; Jurafsky, D.; McFarland, D.A. The diversity–innovation paradox in science. Proc. Natl. Acad. Sci. USA 2020, 117, 9284–9291. [Google Scholar] [CrossRef]
  59. Leins, S. ‘Responsible investment’: ESG and the post-crisis ethical order. Econ. Soc. 2020, 49, 71–91. [Google Scholar] [CrossRef]
  60. Hao, Y.; Guo, Y.; Guo, Y.; Wu, H.; Ren, S. Does outward foreign direct investment (OFDI) affect the home country’s environmental quality? The case of China. Struct. Chang. Econ. Dyn. 2020, 52, 109–119. [Google Scholar] [CrossRef]
  61. Lee, K.-H.; Min, B. Green R&D for eco-innovation and its impact on carbon emissions and firm performance. J. Clean. Prod. 2015, 108, 534–542. [Google Scholar]
  62. Kirchner, K.A.; Cassar, D.R.; Zanotto, E.D.; Ono, M.; Kim, S.H.; Doss, K.; Bødker, M.L.; Smedskjaer, M.M.; Kohara, S.; Tang, L.; et al. Beyond the average: Spatial and temporal fluctuations in oxide glass-forming systems. Chem. Rev. 2022, 123, 1774–1840. [Google Scholar] [CrossRef] [PubMed]
  63. Qu, X.; Khan, A.; Yahya, S.; Zafar, A.U.; Shahzad, M. Green core competencies to prompt green absorptive capacity and bolster green innovation: The moderating role of organization’s green culture. J. Environ. Plan. Manag. 2022, 65, 536–561. [Google Scholar] [CrossRef]
  64. Shang, Y.; Pu, Y.; Yu, Y.; Gao, N.; Lu, Y. Role of the e-exhibition industry in the green growth of businesses and recovery. Econ. Chang. Restruct. 2023, 56, 2003–2020. [Google Scholar] [CrossRef]
  65. Frare, A.B.; Beuren, I.M. The role of green process innovation translating green entrepreneurial orientation and proactive sustainability strategy into environmental performance. J. Small Bus. Enterp. Dev. 2022, 29, 789–806. [Google Scholar] [CrossRef]
  66. Neu, D.; Warsame, H.; Pedwell, K. Managing public impressions: Environmental disclosures in annual reports. Account. Organ. Soc. 1998, 23, 265–282. [Google Scholar] [CrossRef]
  67. Whitelaw, K. ISO 14001 Environmental Systems Handbook; Routledge: London, UK, 2012. [Google Scholar]
  68. Natarajan, D. ISO 9001 Quality Management Systems; Springer International Publishing: Cham, Switzerland, 2017. [Google Scholar]
Figure 1. Conceptual model.
Sustainability 16 03238 g001
Table 1. Definition of major variables.
Variable TypeVariable NameVariable SymbolMeasurement of Variable
Interpreted variablesThe green innovation activityPATNatural logarithm of (the quality of green innovation + the number of green innovation patents + 1)
The quality of green innovationPAT_QUANatural logarithm of (the number of green invention patent citations of listed companies in year T + the number of green utility patent citations of listed companies in year T + 1)
The number of green innovation patentsPAT_NUMNatural logarithm of (the number of green invention patents granted by listed companies in year T + 1)
Explanatory variableAverage ESG score of the same industryESG_SCOREAverage ESG score of other companies in the same industry except our company in the Bloomberg database
Mediator variablesR&D investmentInvTotal R&D expenses/assets of the enterprise in year T
Green awarenessGreenThe total amount of environmental information disclosed by the enterprise in year T. If the information is disclosed or exists, the value equals 1, otherwise 0
Control variablesFirm sizeSizeNatural logarithm of (the total assets + 1)
Asset liability ratioLevTotal liability/total assets
Return on total assetsROANet profit/total assets
Growth rate of main business incomeGrowthCurrent year’s sales revenue/previous year’s sales revenue − 1
Size of the board of directorsBoardsizeNatural logarithm of the board member count
Size of independent directorsIndepsizeNumber of independent directors/total number of directors
Equity concentrationTop10Shareholding ratio of the top ten shareholders
Percentage of management holdingsMstockNumber of management shares/total shares
Executive remunerationMincomeNatural logarithm of the total remuneration of directors, supervisors, and senior management plus 1
Violation of rulesBreakIf there is a violation in the current year, the value equals 1, otherwise 0
State ownershipSOEState-owned firms equal 1, otherwise 0
Characteristics of auditBig10If the listed company is audited by the top ten accounting firms in the current year, the value equals 1, otherwise 0
Profit at a lossLossIf the listed company recorded a loss in the current year, the value equals 1, otherwise 0
Opinion of the auditorAOIf the accounting firm issued a standard unqualified audit opinion in the current year, the value equals 1, otherwise 0
Firm ageAgeThe difference between the years of observation
Table 2. Descriptive statistical results.
VariableObsMeanStd. Dev.MinMax
PAT27,72526.86205.509484
PAT_NUM27,7253.42523.270901
PAT_QUA27,72523.33183.008629
ESG_SCORE27,72520.662.31115.6225.89
Size27,7251.1222.6520.03418.60
Lev27,7250.4180.2080.0520.896
ROA27,7250.0530.066−0.2460.235
Growth27,7250.3981.048−0.7517.485
Boardsize27,7252.2400.1761.7922.773
Indepsize27,7250.3750.0540.2730.571
Top1027,7250.5930.1520.2330.917
Mstock27,72514.4320.44069.09
Mincome27,72514.450.776016.38
Break27,7250.1060.30801
SOE27,7250.3370.47301
Big1027,7250.5770.49401
Loss27,7250.1010.30101
AO27,7250.9670.17901
Age27,7259.7347.495026
Table 3. Basic regression results.
Variable(1)(2)(3)(4)(5)(6)
PATPAT_NUMPAT_QUA
ESG_SCORE0.064 ***0.039 **0.033 ***0.019 **0.061 ***0.036 **
(3.721)(2.462)(3.600)(2.316)(3.671)(2.394)
Size 0.188 *** 0.118 *** 0.183 ***
(16.448) (15.472) (16.156)
Lev 0.713 *** 0.388 *** 0.646 ***
(7.275) (7.237) (6.847)
ROA −0.731 ** −0.364 ** −0.670 **
(−2.562) (−2.397) (−2.436)
Growth 0.063 *** 0.034 *** 0.060 ***
(5.067) (4.966) (5.129)
Boardsize 0.323 ** 0.140 * 0.311 **
(2.397) (1.827) (2.379)
Indepsize 0.555 0.288 0.566
(1.431) (1.308) (1.514)
Top10 −0.565 *** −0.326 *** −0.517 ***
(−4.118) (−4.224) (−3.923)
Mstock −0.000 −0.000 0.000
(−0.032) (−0.114) (0.013)
Mincome 0.217 *** 0.111 *** 0.204 ***
(4.823) (5.022) (4.745)
Break −0.026 −0.019 −0.027
(−0.833) (−1.150) (−0.901)
SOE 0.219 *** 0.113 *** 0.211 ***
(4.088) (3.760) (4.094)
Big10 0.018 0.010 0.019
(0.547) (0.591) (0.626)
Loss −0.261 *** −0.137 *** −0.247 ***
(−5.711) (−5.565) (−5.559)
AO 0.350 *** 0.186 *** 0.316 ***
(5.956) (5.871) (5.655)
Age −0.003 −0.001 −0.003
(−0.842) (−0.447) (−0.741)
_cons−0.834 ***−4.735 ***−0.483 ***−2.408 ***−0.776 ***−4.464 ***
(−2.656)(−6.320)(−2.879)(−6.099)(−2.601)(−6.212)
IndYesYesYesYesYesYes
YearYesYesYesYesYesYes
adj. R20.0530.2060.0630.2420.0450.197
N27,72527,72527,72527,72527,72527,725
Notes: ***, **, and * denote significance at the 1%, 5%, and 10% level, respectively. T-statistics are reported in parentheses. Robust standard errors are adjusted for clustering at the firm level (the same notation is used for the following tables).
Table 4. Endogeneity check results.
Variable(1)(2)(3)
ESG_SCOREPAT_ALLPAT_ALL
LESG_SCORE0.934 ***
(127.380)
IR0.576 ***
(7.953)
ESG_SCORE 0.041 **
(2.199)
ESG_SCORE2 0.014 **
(2.264)
size0.0010.206 ***0.204 ***
(1.387)(14.553)(14.667)
lev−0.029 **0.764 ***0.724 ***
(−1.980)(6.926)(6.842)
roa0.121 **−0.619 **−0.759 **
(2.341)(−1.961)(−2.475)
growth−0.0000.068 ***0.064 ***
(−0.001)(4.818)(4.919)
boardsize0.038 **0.348 **0.335 **
(2.102)(2.295)(2.321)
indepsize0.0180.6120.547
(0.350)(1.392)(1.310)
top10−0.013−0.593 ***−0.603 ***
(−0.778)(−3.892)(−4.092)
mstock−0.0000.000−0.000
(−1.000)(0.412)(−0.073)
mincome0.0010.242 ***0.207 ***
(0.142)(5.327)(4.432)
break0.024 ***−0.033−0.026
(2.704)(−0.978)(−0.790)
soe0.023 ***0.251 ***0.228 ***
(3.687)(4.250)(3.941)
big10−0.0020.0100.014
(−0.379)(0.269)(0.404)
loss0.013−0.246 ***−0.254 ***
(1.155)(−4.935)(−5.159)
ao0.0130.332 ***0.378 ***
(0.741)(5.203)(5.946)
age−0.002 ***−0.005−0.004
(−4.734)(−1.360)(−0.984)
_cons1.968 ***−5.138 ***−4.147 ***
(14.056)(−5.958)(−5.502)
IndYesYesYes
YearYesYesYes
adj. R20.9710.2190.223
N23,14023,14025,817
***, ** denote significance at the 1%, 5% level, respectively.
Table 5. Robustness check results.
Variable(1)(2)(3)(4)(5)(6)(7)
PATPATPATPATPATPATPAT1
LESG_SCORE0.036 **
(2.152)
ESG_SCORE 0.040 **0.053 ***0.035 **0.038 ** 0.024 ***
(2.509)(4.146)(2.076)(2.300) (2.609)
ESG_SCORE1 0.051 ***
(3.417)
Size0.199 ***0.207 ***0.113 ***0.202 ***0.208 ***0.207 ***0.079 ***
(15.446)(14.990)(15.106)(14.473)(14.077)(14.988)(6.470)
Lev0.763 ***0.694 ***0.203 ***0.746 ***0.670 ***0.693 ***0.369 ***
(7.415)(6.944)(3.025)(7.093)(6.412)(6.924)(5.616)
ROA−0.686 **−0.748 **−0.117−0.194−0.634 **−0.753 ***−0.589 ***
(−2.391)(−2.559)(−0.701)(−0.635)(−1.993)(−2.577)(−3.466)
Growth0.066 ***0.065 ***−0.0020.059 ***0.066 ***0.065 ***0.019 ***
(4.860)(5.115)(−0.219)(4.389)(5.114)(5.114)(2.826)
Boardsize0.311 **0.330 **0.248 ***0.431 ***0.344 **0.331 **0.115
(2.178)(2.367)(2.910)(2.964)(2.365)(2.377)(1.226)
Indepsize0.5360.5970.3170.721 *0.6410.6090.078
(1.293)(1.493)(1.387)(1.700)(1.546)(1.524)(0.312)
Top10−0.531 ***−0.585 ***−0.012−0.621 ***−0.599 ***−0.590 ***−0.434 ***
(−3.729)(−4.161)(−0.125)(−4.202)(−4.094)(−4.205)(−4.852)
Mstock0.0010.000−0.003 ***−0.001−0.0000.0000.000
(0.716)(0.002)(−3.226)(−1.028)(−0.237)(0.005)(0.172)
Mincome0.238 ***0.219 ***0.070 ***0.187 ***0.212 ***0.218 ***0.078 ***
(5.629)(4.814)(4.668)(4.142)(4.382)(4.805)(3.813)
Break−0.039−0.0280.002−0.029−0.026−0.028−0.015
(−1.247)(−0.873)(0.092)(−0.888)(−0.780)(−0.876)(−0.851)
SOE0.256 ***0.219 ***0.0460.185 ***0.204 ***0.218 ***0.087 ***
(4.601)(3.968)(0.855)(3.174)(3.581)(3.976)(2.678)
Big100.0190.017−0.015−0.0030.0100.0160.025
(0.564)(0.503)(−0.736)(−0.086)(0.273)(0.495)(1.262)
Loss−0.247 ***−0.262 ***−0.061 **−0.222 ***−0.258 ***−0.259 ***−0.110 ***
(−5.438)(−5.626)(−2.030)(−4.583)(−5.237)(−5.544)(−4.068)
AO0.348 ***0.353 ***0.192 ***0.340 ***0.319 ***0.350 ***0.123 ***
(6.016)(5.917)(4.580)(5.269)(4.960)(5.866)(3.416)
Age−0.003−0.0030.037 ***−0.002−0.005−0.003−0.006 ***
(−0.945)(−0.846)(4.250)(−0.622)(−1.311)(−0.872)(−2.877)
Dual 0.050
(1.286)
Tobinq −0.034 ***
(−2.736)
Ocf −0.499 ***
(−2.673)
GDP 0.160 ***
(7.683)
_cons−4.902 ***−4.809 ***−2.344 ***−5.674 ***−4.673 ***−4.983 ***−1.794 ***
(−6.580)(−6.316)(−5.315)(−7.299)(−5.825)(−6.538)(−4.307)
IndYesYesYesYesYesYesYes
YearYesYesYesYesYesYesYes
adj. R20.2240.218−0.0790.2320.2130.2190.140
N26,66527,72527,72524,96324,10427,71627,725
***, **, and * denote significance at the 1%, 5%, and 10% level, respectively.
Table 6. Regression results of sub-samples.
Variable(1)(2)(3)(4)
PATPATPATPAT
E_SCORE0.055 *** 0.064 ***
(3.913) (4.339)
S_SCORE 0.031 *** 0.013
(2.906) (1.154)
G_SCORE −0.094 ***−0.109 ***
(−4.931)(−5.630)
Size0.207 ***0.207 ***0.208 ***0.208 ***
(15.040)(14.984)(15.103)(15.194)
Lev0.703 ***0.692 ***0.706 ***0.712 ***
(7.031)(6.912)(7.054)(7.113)
ROA−0.773 ***−0.732 **−0.757 ***−0.809 ***
(−2.639)(−2.504)(−2.590)(−2.769)
Growth0.065 ***0.064 ***0.063 ***0.064 ***
(5.142)(5.086)(4.994)(5.122)
Boardsize0.331 **0.330 **0.329 **0.324 **
(2.376)(2.370)(2.371)(2.339)
Indepsize0.6020.5970.5800.578
(1.503)(1.495)(1.452)(1.448)
Top10−0.581 ***−0.585 ***−0.560 ***−0.550 ***
(−4.132)(−4.163)(−3.985)(−3.911)
Mstock0.000−0.000−0.000−0.000
(0.016)(−0.009)(−0.025)(−0.013)
Mincome0.219 ***0.219 ***0.217 ***0.216 ***
(4.813)(4.814)(4.798)(4.780)
Break−0.028−0.028−0.026−0.027
(−0.893)(−0.873)(−0.827)(−0.862)
SOE0.219 ***0.220 ***0.224 ***0.214 ***
(3.993)(3.981)(4.074)(3.894)
Big100.0160.0170.0140.012
(0.471)(0.508)(0.421)(0.365)
Loss−0.266 ***−0.260 ***−0.260 ***−0.257 ***
(−5.705)(−5.568)(−5.593)(−5.534)
AO0.360 ***0.347 ***0.332 ***0.325 ***
(6.036)(5.801)(5.568)(5.449)
Age−0.003−0.003−0.003−0.002
(−0.840)(−0.847)(−0.845)(−0.572)
_cons−4.626 ***−4.774 ***0.040−0.067
(−6.281)(−6.415)(0.034)(−0.058)
IndYesYesYesYes
YearYesYesYesYes
adj. R20.2190.2180.2190.221
N27,70227,72527,72527,702
***, ** denote significance at the 1%, 5% level, respectively.
Table 7. Regression results of the mediating effect test of R&D investment.
Variable(1)(2)
InvPAT
ESG_SCORE0.000 ***0.036 *
(4.396)(1.698)
Inv 8.188 **
(2.432)
Size−0.000 **0.233 ***
(−2.137)(14.429)
Lev−0.003 ***0.691 ***
(−3.422)(5.731)
ROA−0.002−0.756 *
(−0.776)(−1.891)
Growth0.000 ***0.084 ***
(2.986)(5.782)
Boardsize0.0010.374 **
(1.086)(2.104)
Indepsize0.005 *0.688
(1.840)(1.411)
Top10−0.004 ***−0.523 ***
(−3.886)(−3.118)
Mstock0.000−0.000
(0.929)(−0.093)
Mincome0.001 ***0.173 ***
(3.430)(3.708)
Break0.000−0.039
(0.506)(−0.941)
SOE0.0000.270 ***
(0.434)(4.076)
Big100.0000.024
(1.107)(0.577)
Loss0.000−0.325 ***
(0.541)(−5.480)
AO0.0010.282 ***
(1.630)(3.141)
Age−0.000−0.010 **
(−1.258)(−2.018)
_cons−0.017 ***−4.128 ***
(−3.901)(−4.733)
IndYesYes
YearYesYes
adj. R20.1690.261
N15,08015,080
***, **, and * denote significance at the 1%, 5%, and 10% level, respectively.
Table 8. Regression results of the mediating effect test of Green Awareness.
Variable(1)(2)
GreenPAT
ESG_SCORE0.455 ***0.037 **
(7.747)(2.286)
Green 0.007 **
(2.141)
Size0.561 ***0.203 ***
(15.285)(14.545)
Lev1.372 ***0.684 ***
(3.418)(6.837)
ROA8.031 ***−0.813 ***
(7.013)(−2.810)
Growth−0.283 ***0.067 ***
(−6.790)(5.297)
Boardsize3.184 ***0.308 **
(6.212)(2.211)
Indepsize2.1290.587
(1.441)(1.468)
Top101.083 *−0.594 ***
(1.910)(−4.232)
Mstock−0.020 ***0.000
(−5.099)(0.144)
Mincome0.404 ***0.216 ***
(2.677)(4.809)
Break−0.022−0.026
(−0.185)(−0.826)
SOE1.168 ***0.211 ***
(5.540)(3.798)
Big100.248 *0.015
(1.879)(0.454)
Loss0.154−0.264 ***
(0.825)(−5.679)
AO0.4890.350 ***
(1.390)(5.885)
Age0.054 ***−0.003
(3.775)(−0.958)
_cons−20.808 ***−4.661 ***
(−7.840)(−6.090)
IndYesYes
YearYesYes
adj. R20.2700.219
N27,70627,706
***, **, and * denote significance at the 1%, 5%, and 10% level, respectively.
Table 9. Heterogeneity regression results of corporate property rights.
Variable(1)(2)
Non-State-OwnedState-Owned
PATPAT
ESG_SCORE0.039 **0.057 *
(2.361)(1.735)
Size0.221 ***0.191 ***
(7.297)(12.084)
Lev0.741 ***0.554 ***
(6.351)(2.986)
ROA−0.178−1.323 *
(−0.566)(−1.905)
Growth0.063 ***0.064 ***
(4.585)(2.927)
Boardsize0.1300.473 *
(0.846)(1.878)
Indepsize−0.2031.592 **
(−0.461)(2.232)
Top10−0.956 ***−0.070
(−5.698)(−0.282)
Mstock0.001−0.007
(0.924)(−0.666)
Mincome0.196 ***0.264 ***
(3.164)(5.027)
Break0.020−0.127 **
(0.543)(−2.076)
Big10−0.0070.052
(−0.176)(0.881)
Loss−0.138 **−0.356 ***
(−2.466)(−4.317)
AO0.306 ***0.495 ***
(4.692)(4.143)
Age−0.008 *−0.002
(−1.664)(−0.385)
_cons−3.396 ***−6.673 ***
(−3.674)(−5.705)
IndYesYes
YearYesYes
adj. R20.1370.323
N18,3889337
***, **, and * denote significance at the 1%, 5%, and 10% level, respectively.
Table 10. Heterogeneity regression results in the size of the enterprise.
Variable(1)(2)
SmallLarge
PATPAT
ESG_SCORE0.047 ***0.051 **
(3.060)(2.142)
Size0.477 ***0.196 ***
(4.010)(14.124)
Lev0.0610.804 ***
(0.633)(5.103)
ROA−0.841 ***−1.359 ***
(−3.059)(−2.941)
Growth0.055 ***0.083 ***
(4.130)(4.598)
Boardsize0.0180.500 **
(0.115)(2.535)
Indepsize0.0960.969 *
(0.228)(1.701)
Top10−0.570 ***−0.477 **
(−3.978)(−2.511)
Mstock0.000−0.000
(0.229)(−0.121)
Mincome0.119 ***0.178 ***
(4.776)(2.973)
Break−0.015−0.101 **
(−0.387)(−2.200)
Big10−0.0390.067
(−1.213)(1.352)
Loss−0.181 ***−0.306 ***
(−3.698)(−4.444)
AO0.115 *0.549 ***
(1.776)(6.275)
Age−0.010 ***−0.005
(−2.962)(−0.930)
_cons−1.934 ***−5.182 ***
(−2.946)(−4.724)
IndYesYes
YearYesYes
adj. R20.0510.227
N12,22815,497
***, **, and * denote significance at the 1%, 5%, and 10% level, respectively.
Table 11. Heterogeneity regression results of analyst coverage.
Variable(1)(2)
LowHigh
PATPAT
ESG_SCORE0.0190.060 ***
(0.934)(3.096)
Size0.227 ***0.204 ***
(8.645)(14.009)
Lev0.714 ***0.719 ***
(5.719)(6.279)
ROA−1.735 ***−0.668 *
(−4.343)(−1.839)
Growth0.082 ***0.061 ***
(4.626)(3.922)
Boardsize0.1100.542 ***
(0.624)(3.345)
Indepsize0.2650.773
(0.546)(1.606)
Top10−0.435 **−0.559 ***
(−2.471)(−3.452)
Mstock−0.001−0.002
(−0.743)(−1.448)
Mincome0.159 ***0.230 ***
(4.867)(3.556)
Break0.018−0.066
(0.342)(−1.638)
Big100.0010.030
(0.016)(0.748)
Loss−0.298 ***−0.290 ***
(−4.258)(−4.842)
AO0.323 ***0.399 ***
(3.113)(5.886)
Age0.005−0.001
(1.202)(−0.247)
_cons−3.109 ***−5.707 ***
(−4.007)(−5.706)
IndYesYes
YearYesYes
adj. R20.1610.239
N902417,570
***, **, and * denote significance at the 1%, 5%, and 10% level, respectively.
Table 12. Heterogeneity regression results of industry classification.
Variable(1)(2)
YesNo
PATPAT
ESG_SCORE−0.0010.054 ***
(−0.030)(3.342)
Size0.240 ***0.196 ***
(10.966)(11.412)
Lev0.778 ***0.716 ***
(4.016)(6.271)
ROA−1.313 **−0.638 *
(−2.348)(−1.874)
Growth0.129 ***0.055 ***
(3.276)(4.325)
Boardsize0.627 **0.363 **
(2.387)(2.202)
Indepsize0.1451.008 **
(0.195)(2.150)
Top10−0.549 **−0.516 ***
(−2.166)(−3.175)
Mstock−0.002−0.001
(−0.863)(−0.821)
Mincome0.291 ***0.184 ***
(5.178)(3.262)
Break−0.031−0.050
(−0.522)(−1.350)
Big100.0500.016
(0.772)(0.418)
Loss−0.375 ***−0.220 ***
(−4.477)(−3.861)
AO0.440 ***0.390 ***
(4.136)(5.511)
Age−0.0070.005
(−1.130)(1.149)
_cons−5.546 ***−4.795 ***
(−4.129)(−5.308)
IndYesYes
YearYesYes
adj. R20.2210.213
N803819,687
***, **, and * denote significance at the 1%, 5%, and 10% level, respectively.
Table 13. Heterogeneity regression results of environmental regulation.
Variable(1)
PAT
ESG_SCORE0.042 **
(2.416)
ER−0.011 **
(−2.034)
ESG_SCORE×ER0.001 **
(2.483)
Size0.208 ***
(13.991)
Lev0.724 ***
(6.690)
ROA−0.750 **
(−2.278)
Growth0.066 ***
(4.853)
Boardsize0.468 ***
(3.108)
Indepsize0.824 *
(1.901)
Top10−0.549 ***
(−3.629)
Mstock−0.001
(−1.271)
Mincome0.207 ***
(4.174)
Break−0.049
(−1.435)
Big100.005
(0.140)
Loss−0.276 ***
(−5.402)
AO0.371 ***
(5.604)
Age−0.001
(−0.196)
_cons−4.946 ***
(−5.915)
IndYes
YearYes
adj. R20.217
N22,556
***, **, and * denote significance at the 1%, 5%, and 10% level, respectively.
Disclaimer/Publisher’s Note: The statements, opinions and data contained in all publications are solely those of the individual author(s) and contributor(s) and not of MDPI and/or the editor(s). MDPI and/or the editor(s) disclaim responsibility for any injury to people or property resulting from any ideas, methods, instructions or products referred to in the content.

