Article

Effects of Land-Use Type and Salinity on Soil Carbon Mineralization in Coastal Areas of Northern Jiangsu Province

1
Co-Innovation Center for the Sustainable Forestry in Southern China, Nanjing Forestry University, Nanjing 210037, China
2
National Positional Observatory for the Changjiang River Delta Forest Ecosystem, Nanjing 210037, China
3
Dafeng District Forestry Farm, Yangcheng 224100, China
*
Author to whom correspondence should be addressed.
Sustainability 2024, 16(8), 3285; https://doi.org/10.3390/su16083285
Submission received: 27 February 2024 / Revised: 6 April 2024 / Accepted: 12 April 2024 / Published: 15 April 2024

Abstract

:
Sea level rise due to glacier melting caused by climate warming is a major global challenge, but the mechanism of the effect of salinity on soil carbon (C) mineralization in different land types is not clear. The pathways by which salinity indirectly affects soil carbon mineralization rates need to be investigated. Whether or not the response mode is consistent among different land-use types, as well as the intrinsic links and interactions between soil microbial resource limitation, environmental stress, microbial extracellular enzyme activity, and soil carbon mineralization, remain to be demonstrated. In this paper, three typical land-use types (wetland, forest, and agroforestry) were selected, and different salinity levels (0‰, 3‰, 6‰, and 32‰) were designed to conduct a 125-day laboratory incubation experiment to determine the soil CO2 release rate, soil physicochemical properties, and soil enzyme activities, and to correlate C mineralization with biotic and abiotic factors. A correlation analysis of soil physical and chemical properties, extracellular enzyme activities, and carbon mineralization rates was conducted to investigate their intrinsic linkages, and a multiple linear regression of C mineralization at different sites was performed to explore the variability of mineralization among different site types. Structural equation models were established in the pre- and post-incubation stages to study the pathways of soil C mineralization at different incubation times, and the mechanism of mineralization was further verified by enzyme stoichiometry. The results showed that, at the end of 125 days of incubation, the 32‰ salinity addition reduced the cumulative mineralization of forest and agroforestry types by 28.41% and 34.35%, respectively, compared to the 0‰ salinity addition. Soil C mineralization in the three different land-use types was highly correlated with the active C fractions of readily oxidizable C (ROC), dissolved organic C, and microbial biomass C (MBC) in the soil, with the standardized coefficients of multivariate linear regression reaching 0.67 for MBC in the wetland and −0.843 for ROC in the forest. Under long-term salinity additions, increased salinity would reduce the microbial respiratory quotient value by inhibiting β-glucosidase activity, thus indirectly affecting the rate of CO2 release. With added salinity, the mineralization of non-saline soil was more susceptible to the inhibitory effect of salinity, whereas the mineralization of salinized soil was more controlled by soil C pools.

1. Introduction

Soil is the largest carbon (C) pool in terrestrial ecosystems, and its C stock exceeds the sum of plant and atmospheric C [1]. The soil C stock is determined by the relative magnitude of soil C sequestration and mineralization capacities [2]. In this context, soil C mineralization is the process by which organic C is decomposed by microorganisms, emitting C to the atmosphere as CO2 and CH4 [3]. Soil respiration, which globally releases 75–100 Pg of C per year [4], is an important pathway of soil C emission to the atmosphere [5]. Soil C mineralization not only has far-reaching impacts on global climate change and ground cover, but is also important for soil fertility assessment and crop production [6]. In coastal areas, soil has saline and alkaline characteristics and an anaerobic environment, so C mineralization is prone to release CH4, which has 25 times the global warming potential of CO2 and is the second largest greenhouse gas after CO2 [7]. Therefore, the release of CH4 is an important link in the change in the C pool, attracting many scholars to carry out anaerobic mineralization incubation research in coastal wetlands or submerged rice paddies [8].
Soil C mineralization is not only affected by abiotic factors such as soil salinity [9], temperature [10,11], moisture [12], substrate quantity and quality [13], and oxygen availability [14], but also intrinsically linked and interacting with biotic factors such as soil extracellular enzymes, microbial biomass [15], growth [16], community structure [17], and C use efficiency. The exploration of multifactorial interactions, especially those related to biotic factors, has been an ongoing research priority [18,19,20]. Among them, soil extracellular enzymes are important drivers of microbial-mediated C cycling processes, degrading organic matter into water-soluble small-molecule organic matter for microbial use and playing a rate-limiting role in soil mineralization [21]. Microbial regulation of enzyme activity determines the microbial response to factors such as nutrients and substrates [22]. When microbial activity is limited by environmental factors or nutrient conditions, extracellular enzymes are released to satisfy metabolic demands, allowing some extracellular enzymes to also be used to characterize information about the soil C quality as well as nutrients [13]. For example, Morrison et al. found that elevated elemental phosphorus (P) inhibits phosphatase activity [23], and that the addition of a single nutrient leads to the limitation of other nutrients, with microorganisms adapting to resource constraints by adjusting their community structure and elemental cycling [24].
Ghorbani et al. found that changes in land-use patterns can lead to large differences in soil respiration, with anthropogenically disturbed land types (e.g., farmland and orchards) having higher levels of carbon mineralization than natural land types (e.g., grasslands and forests) [25]. On the one hand, this may be due to the fact that changes in land-use practices can disrupt soil aggregates and deprive soil organic carbon of physical protection [26]. It has been found that large aggregates (>0.25 mm) have a lower rate of carbon mineralization, which may be due to their lower carbon mass, which is difficult for microorganisms to use to decompose them [27]. Moreover, the shift from evergreen forest land to agricultural land can lead to increased soil disturbance and greater susceptibility to soil erosion, resulting in a decrease in the soil carbon pool, which has an impact on the rate of carbon mineralization by changing the substrate availability [28]. On the other hand, different land-use types may affect the plant root systems, soil porosity, and water content, which, in turn, affect the activities of soil microbial communities [29]. Different land-use types may differ in their inputs of litter, which may affect the composition of the soil between stabilized and activated carbon pools, and may lead to differences in substrate availability and utilization efficiency. A review study found that coniferous and broadleaf forests differ in their lignin molecular structure, and that higher proportions of cellulose are usually observed in the litter of deciduous species [30], which would directly relate to the composition of the different stable carbon pools in the soil and therefore affect the rate of mineralization. Changes in land use will also directly affect the storage and stability of soil carbon pools, e.g., the shift from natural grassland to plantation forests will result in a 44% reduction in carbon storage in 0–10 cm soils, and the stability of SOC is shown to be in the descending order of natural secondary forests > plantation forests > natural degraded grasslands [31]. And the soil respiration of pastureland is higher than that of paddy fields, orchards, and uncultivated land [32], which may be due to the fact that animals affect the soil physicochemical properties through excreta, trampling, etc. At the same time, feces can be decomposed by microorganisms and revert back to the soil, which contributes to the enhancement of nutrients such as nitrogen and phosphorus in the soil [33], and provides sufficient resources for the growth activities of microorganisms, which leads to the rate of soil mineralization being at a high level. It is also possible that the high-density root system of the grassland makes the soil porosity larger, accelerating the oxidation process of organic matter [34].
In the era of global warming and sea level rise, coastal areas are at risk of groundwater intrusion by seawater, which may lead to increased soil salinization. Seawater intrusion alters the quantity and quality of organic matter, thereby affecting soil CO2 emission processes [35]. Rath et al. found that soil microbial respiration is inhibited by high salt concentrations [36], but the effect on enzymes has not shown a consistent pattern across different studies. Salinity can affect the ability of microorganisms to decompose organic matter by influencing their activity. On the one hand, an increase in salinity can alter the osmotic potential of cells and expose them to dehydration, and ionic toxicity may cause the death of microorganisms or the synthesis of osmotic pressure modifiers to adapt to changes in salinity by breaking down effective C for energy [37]. On the other hand, in arid and semi-arid areas, due to the use of brackish water for irrigation, water evaporation leads to an increase in soil surface salinity [36] and a decrease in the soil matrix potential, resulting in water being adsorbed on aggregates and a decrease in water availability [38], and significantly affects the long-term stability of aggregates, leading to a significant increase in the mineralization rate [39]. A salinity of 3 ‰ does not have a significant effect on the structure of the microbial community, but a salinity of more than 5 ‰ will significantly change the community structure of soil microorganisms [40]. Neubauer, Franklin, and Berrier [35] found that long-term seawater intrusion reduced soil CO2 and CH4 release rates by affecting C inputs, C pool stability, and extracellular enzyme activity, and that wetlands that have developed salt-tolerant plant and microbial communities are unable to respond to high salinity in the short term.
Although a large number of relevant studies have been carried out on soil C mineralization [41,42], the complex interactions between soil C pools and factors such as soil salinity and extracellular enzyme activities, pathways, and mechanisms affecting C mineralization remain unclear [43]. The aim of this study is to investigate the mechanisms by which groundwater in coastal areas subjected to seawater intrusion [44] affect organic C mineralization in the soils of different land-use types under aerobic conditions. Since the presence of O2 inhibits methanogenic bacterial activity [45], the release of CH4 was not included in the consideration of C mineralization. We hypothesized that (1) soil mineralization would be inhibited with increasing salinity and (2) the wetland would be differently affected by salinity than the other two sites (the forest and agroforestry) due to its long-term immersion in seawater, which may have produced adaptive mechanisms.

2. Materials and Methods

2.1. Study Site and Sampling

Dafeng District, Yancheng City (33°3′ N, 120°51′ E), is located in the eastern region of China, neighboring the Yellow Sea to the east, with an average annual temperature of 14.1 °C, an average annual precipitation of 1042.2 mm, and an average elevation of 5 m. It is in the transition zone between the subtropical and warm temperate zones. In March 2023, surface soil (0–20 cm) was collected from the following three representative land-use types along the coast: the wetland (W), forest (F), and agroforestry (A). The vegetation type for site F is Taxodium hybrid ‘zhongshanshan’, for site A is Ligustrum lucidum and Cucurbita moschata, and for site W is Spartina alterniflora. Site W is located in the intertidal zone of the ocean; sites F and A are 8 km from the coastline. The soil is classified as a sandy loam belonging to the sub-category of coastal solonchak. For sample sites W, F, and A, we set up 6 sample plots (2 m × 2 m), respectively, totaling 18 sampling plots. Within the same land-use type, we made sure that the distance between each sample plot was more than 15 m to make our samples representative of a specific land-use type. After bringing the soil samples back to the laboratory, the six soil samples from the same land-use type were mixed and divided into three portions, and used as three replications of one specific land-use type for subsequent experiments. And it was ensured that at least 10 kg of fresh soil was collected from each site type for laboratory incubation. Samples were collected as far away from the plants as possible (1.5 m–2 m) to prevent the effects caused by plant root secretions, and were sieved on site through a 2 mm sieve to remove visible stones and plant residues. Part of the soil was transported on dry ice and stored at −20 °C for laboratory incubation and the determination of enzyme activities, while the other portion of the soil was brought back to the laboratory under ambient conditions, air-dried, ground, and sieved for the determination of soil physicochemical properties (Table 1).
The salinity and pH of site W were significantly higher than those of sites F and A. The salinity of site W reached 5.6‰, which was 9.28 and 18.57 times higher than those of sites F and A, respectively. Site W had higher soluble organic C content (129.12 ± 1.55 mg kg−1), which was 22.55% and 9.31% higher than for sites F and A, respectively. The bulk density for site F was 1.36 ± 0.01 g cm−3, significantly lower than for sites W and A. Among the three land types, site A had the lowest ROC content of 1.41 ± 0.32 mg kg−1.

2.2. Laboratory Incubation

In the incubation experiments, we set up 4 salinity treatments (0‰, 3‰, 6‰, and 32‰) for each of the three site types (W, F, and A), and 12 replicates were set up for each of these 12 treatments (a total of 144 incubation bottles) because four destructive samplings were required during the subsequent 125 days of incubation to determine the soil physicochemical properties at different times. NaCl solution was used to configure three different salinity concentrations (3‰, moderate salinization; 6‰, intense salinization; 32‰, seawater intrusion) and a control group of 0‰ (non-salinized) to simulate the effects of soil C mineralization in coastal areas subjected to different degrees of seawater intrusion. The incubation procedure was as follows: 150 g dry soil equivalent of fresh soil was transferred to 500 mL conical flasks and pre-incubated for 14 days at 25 °C in darkness to minimize the disturbance caused by sampling and transportation. During the pre-incubation period, if the soil moisture content exceeded 60% of the water-holding capacity of the field, the bottle was left open to allow natural evaporation; if it was lower than that, the moisture content was stabilized at 60% by adding deionized water, and the mouth of the bottle was sealed with a porous plastic film to ensure the flow of gases inside the bottle so to avoid CO2 enrichment and reduce the rate of water evaporation—the maximum loss of water was less than 2% during the period. During the formal incubation period, the evaporation of soil water was calculated by weighing, and different concentrations of saline water were supplemented to the incubation bottles every 4 days, for a total of 125 days of incubation, and also to ensure that the loss of soil water did not exceed 2% during the whole incubation period.

2.3. Gas Sampling and Analysis

Before gas collection, three samples of different treatments were randomly taken and opened for ventilation for 30 min to make the gas concentration in the bottles consistent with the external environment. After the end of ventilation, all conical bottles were sealed with rubber plugs (the plugs were equipped with three-way valves as well as puncture needles to facilitate gas collection), and three samples were randomly selected to collect 40 mL of gas with a syringe connected to the three-way valves as the background concentration value (A). Subsequently, all soil samples were sealed and continued to be incubated for 12 h. After the incubation was completed, the incubation bottles were shaken sufficiently to make the gas distribution in the bottles even, 40 mL of gas was collected (B), and the difference between A and B was used to quantify the rate of C mineralization. Gas was sampled on days 1, 4, 8, 13, 20, 45, 65, 95, and 125 of formal incubation. The reason why we measured more frequently at the beginning is because the soil has sufficient readily decomposable carbon, which can change significantly in a short period of time. In the later stages of incubation, carbon mineralization is dominated by the decomposition of stable carbon pools, which is a slower process, so the measurement was less frequent. And the CO2 concentration was determined using an Agilent 7890B gas chromatograph (Agilent Technologies, Santa Clara, CA, USA) with a FID detector.

2.4. Soil Physical and Chemical Properties

Soil physicochemical indexes were measured after sampling was completed, and on days 4, 20, 45, and 125 of incubation, as follows. The electrical conductivity (EC) of the soil was determined by a conductivity meter and the soil pH was determined by a pH meter (both water/soil = 5:1). Soil organic C (SOC) content was determined by potassium dichromate oxidation spectrophotometry. Soil dissolved organic C (DOC) was extracted by 0.5 M K2SO4 and determined using a TOC analyzer [46]. Soil readily oxidizable C (ROC) was determined by potassium permanganate oxidation spectrophotometry. The total C (TC) and total nitrogen (TN) content of the soil were determined using an elemental analyzer (Model CN, Elementar Analysen Systeme Gmbh, Langenselbold, Germany).

2.5. Soil Microbial Biomass and Extracellular Enzyme Activity

Microbial biomass and enzyme activities were determined on soils incubated for days 4, 20, 45, and 125, as follows. Microbial biomass C (MBC) was measured by fumigating 10 g of fresh soil samples with chloroform for 24 h. The extracts were extracted using 0.5 mol L−1 K2SO4 with the soil samples at a ratio of 1:4, and then filtered after 1 h of shaking and measured using a TOC analyzer (Shimadzu Model TOC-500, Shimadzu, Kyoto, Japan) [47]. Microbial biomass N (MBN) was determined in the same way as MBC and calculated by the difference between fumigated and unfumigated extracts, with the proportionality coefficients (KEC = 0.45 [48] and KEP = 0.54) used to adjust for the calculation of MBC and MBN, respectively.
Sample extracts, L-DOPA, and H2O2 were added to 96-well microtiter plates using the method of German et al. [49]. The assay was repeated six times for each sample and incubated in darkness for 18 h. Absorbance was measured at wavelength of 450 nm using an enzyme meter, and polyphenol oxidase (PPO) and peroxidase (POD) activities were calculated based on the sample microtiter wells, the negative control, and the blank control. The β-glucosidase (βG) and alkaline phosphatase (ALP) activities were determined according to fluorometric protocols [50]. The βG activity was expressed as the amount of p-nitrophenol generated using p-nitrophenyl-β-D glucoside as a substrate. Using p-nitrophenyl disodium phosphate as a substrate, the amount of p-nitrophenol generated was used to quantify the ALP activity. Activities of N-acetyl-glucosaminidase and L-leucine aminopeptidase were determined using the methods of Ai et al. [51] and Cui, Zhang, Wang, Xu, Ai, Liang, Zhu, and Zhou [24] using 4-MUB-N-acetyl-β-D-glucosaminide and L-leucine-7-amino-4-methylcoumarin as substrates. Units of enzyme activity were expressed as micromoles of the substrate released per hour per gram of soil (μmol g−1 h−1).

2.6. Calculations

2.6.1. CO2 Emission Rate and Cumulative Release

The emission rate and cumulative release of CO2 were calculated [52] as follows:
CO 2 - emission = c × V × 12 / 22.4 × m × 273 / 273 + 25
where CO2-emission is in mg C kg−1 d−1, c (μL mL−1 d−1) is the change in the CO2 concentration per unit time, V (L) is the volume at the top of the incubation flask, and m (kg) is the dry soil equivalent in the incubation flask.
CO2-accumulaion = CO2-emission × t
where t is the time interval (d) between two samples.

2.6.2. First-Order Kinetic Model for Soil C Mineralization

The cumulative release of CO2 was nonlinearly fitted using the SOC mineralization first-order kinetic model [53], as follows:
C t = C 0 1 e k t
where Ct (g kg−1) is cumulative respiration after t days (d) of incubation, C0 (g kg−1) is mineralization potential of the soil, and k is the turnover rate constant of the organic C pool.

2.6.3. Microbial Respiratory Quotient (qCO2)

The ratio of soil respiration to MBC is defined as qCO2 [54]. It reflects not only the response of microorganisms to external disturbances, but also the efficiency of C utilization, and is calculated as follows:
q C O 2 = B R / M B C
where BR (mg C kg−1 d−1) is the basal respiration of the soil and MBC is in mg C kg−1.

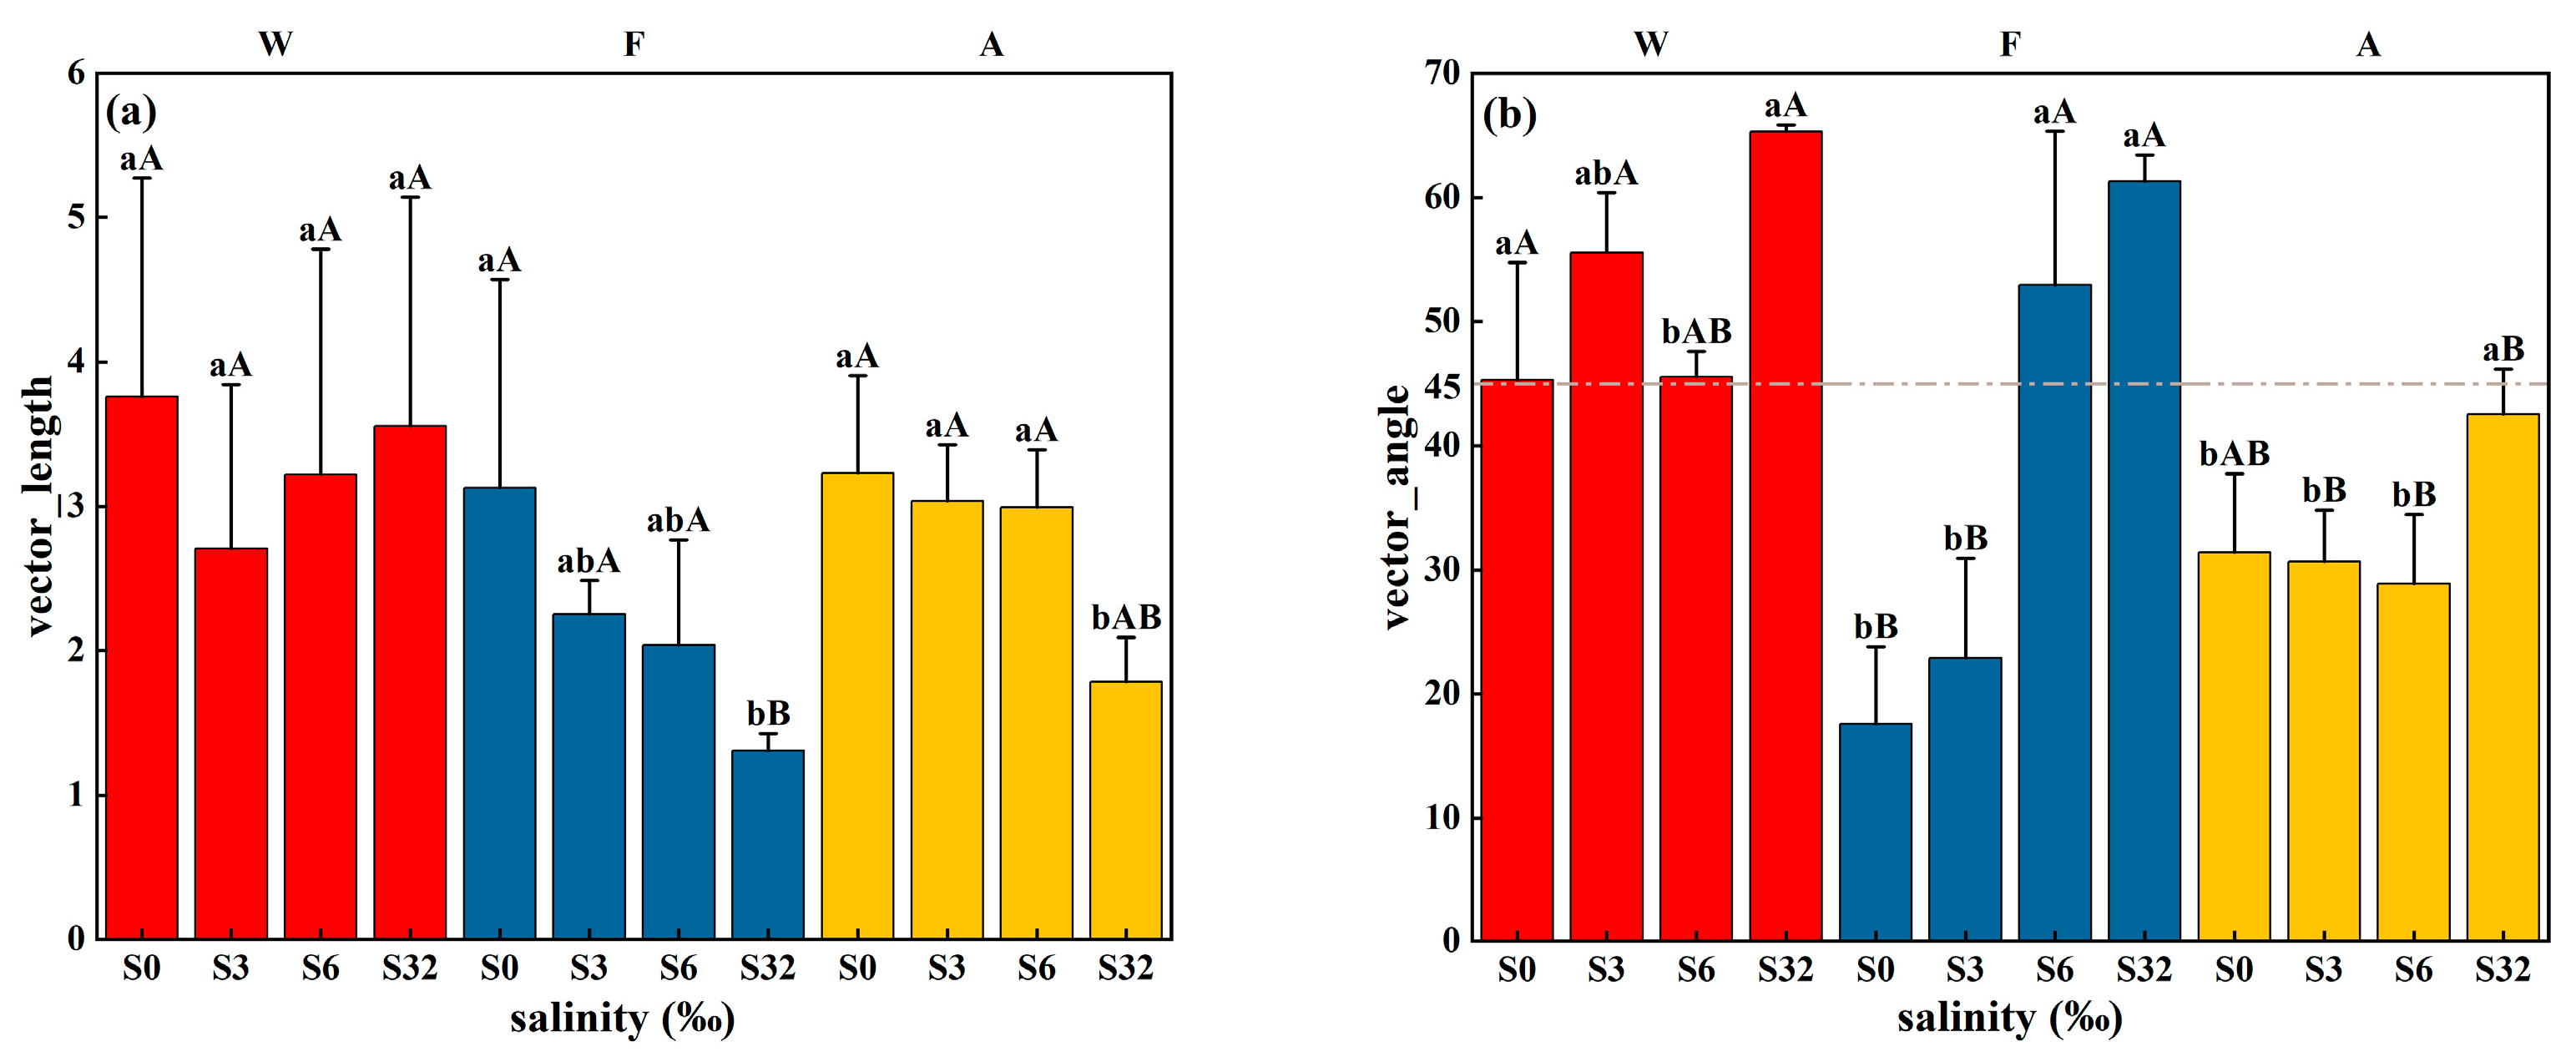
2.6.4. Enzyme Stoichiometry

Tapia-Torres et al. [55] found that changes in the ratio of C:N:P-acquiring enzymes can reflect the limiting effect of nutrients on microorganisms, and that microorganisms secrete enzymes to acquire nutrients when they are deficient in C, N, or P, resulting in a change in the 1:1:1 ratio of C:N:P-acquiring enzymes [24]. Based on the above empirical evidence, enzyme stoichiometry was calculated using the theory proposed by Moorhead et al. [56] to calculate the vector length and vector angle. A greater vector length indicates that the microorganism is more C limited, and the vector angle indicates that the microorganism is limited by N and P; a vector angle < 45° indicates N limitation and >45° indicates P limitation. The calculation formula is as follows:
V e c t o r   l e n g t h = l n B G l n A L P 2 + l n B G l n N A G + L A P 2 V e c t o r   a n g l e = d e g r e e s A T A N   2 l n B G l n A L P , l n B G l n N A G + L A P

2.7. Data Analysis

The distribution of the data was tested for normality by the Kolmogorov–Smirnov (K–S) test, kurtosis, and skewness, and Levene’s test was used for the homogeneity of variance. One-way ANOVA was used to determine the significant effects of different salinity treatments and different types of land use on the rate of CO2 emission and extracellular enzyme activity. Correlations between soil physical and chemical properties, extracellular enzyme activities, and soil respiration rates were analyzed using the Pearson chi-square test. Multiple linear regression was used to quantify the factors influencing mineralization in different land-use types. Structural equation modeling (SEM) using the least-squares method was used to explore the potential drivers and pathways of soil CO2 release during the pre-incubation (day 20) and post-incubation (day 125) periods. All data analyses were performed in SPSS (Version 23.0), SEM was plotted using AMOS (Version 24.0) software, and the remaining graphs were plotted using Origin 2021.

3. Results

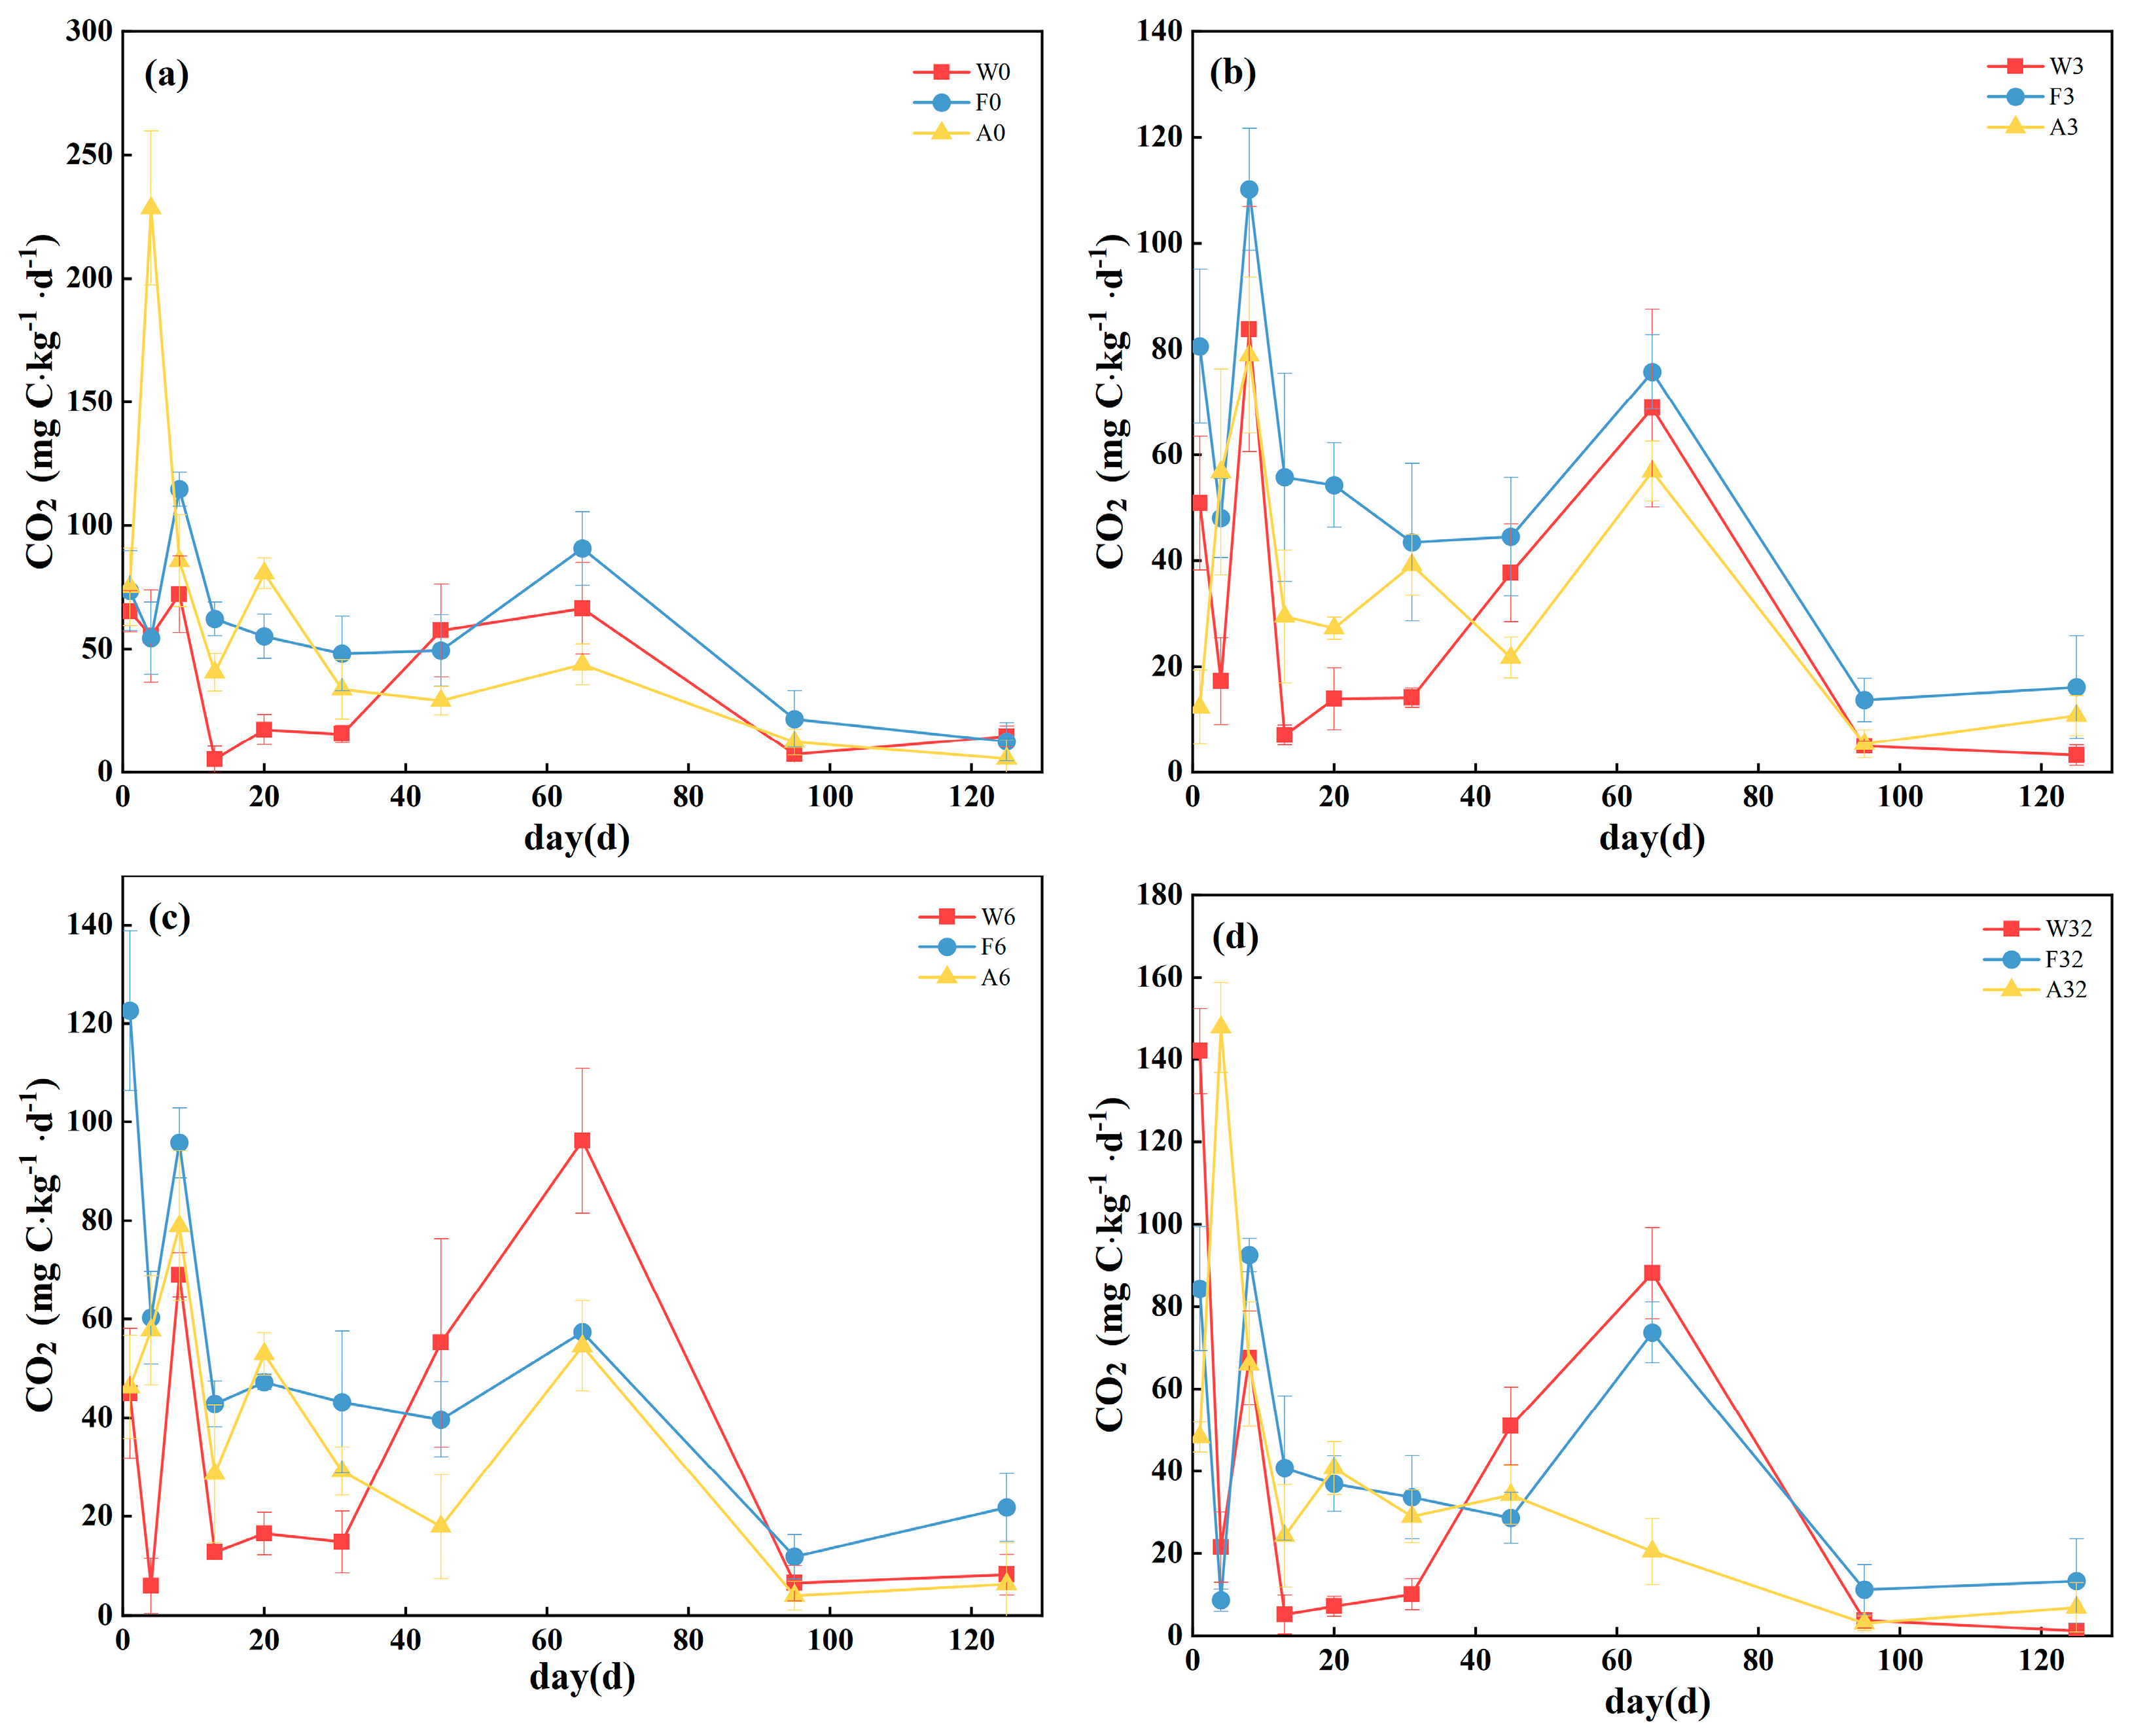
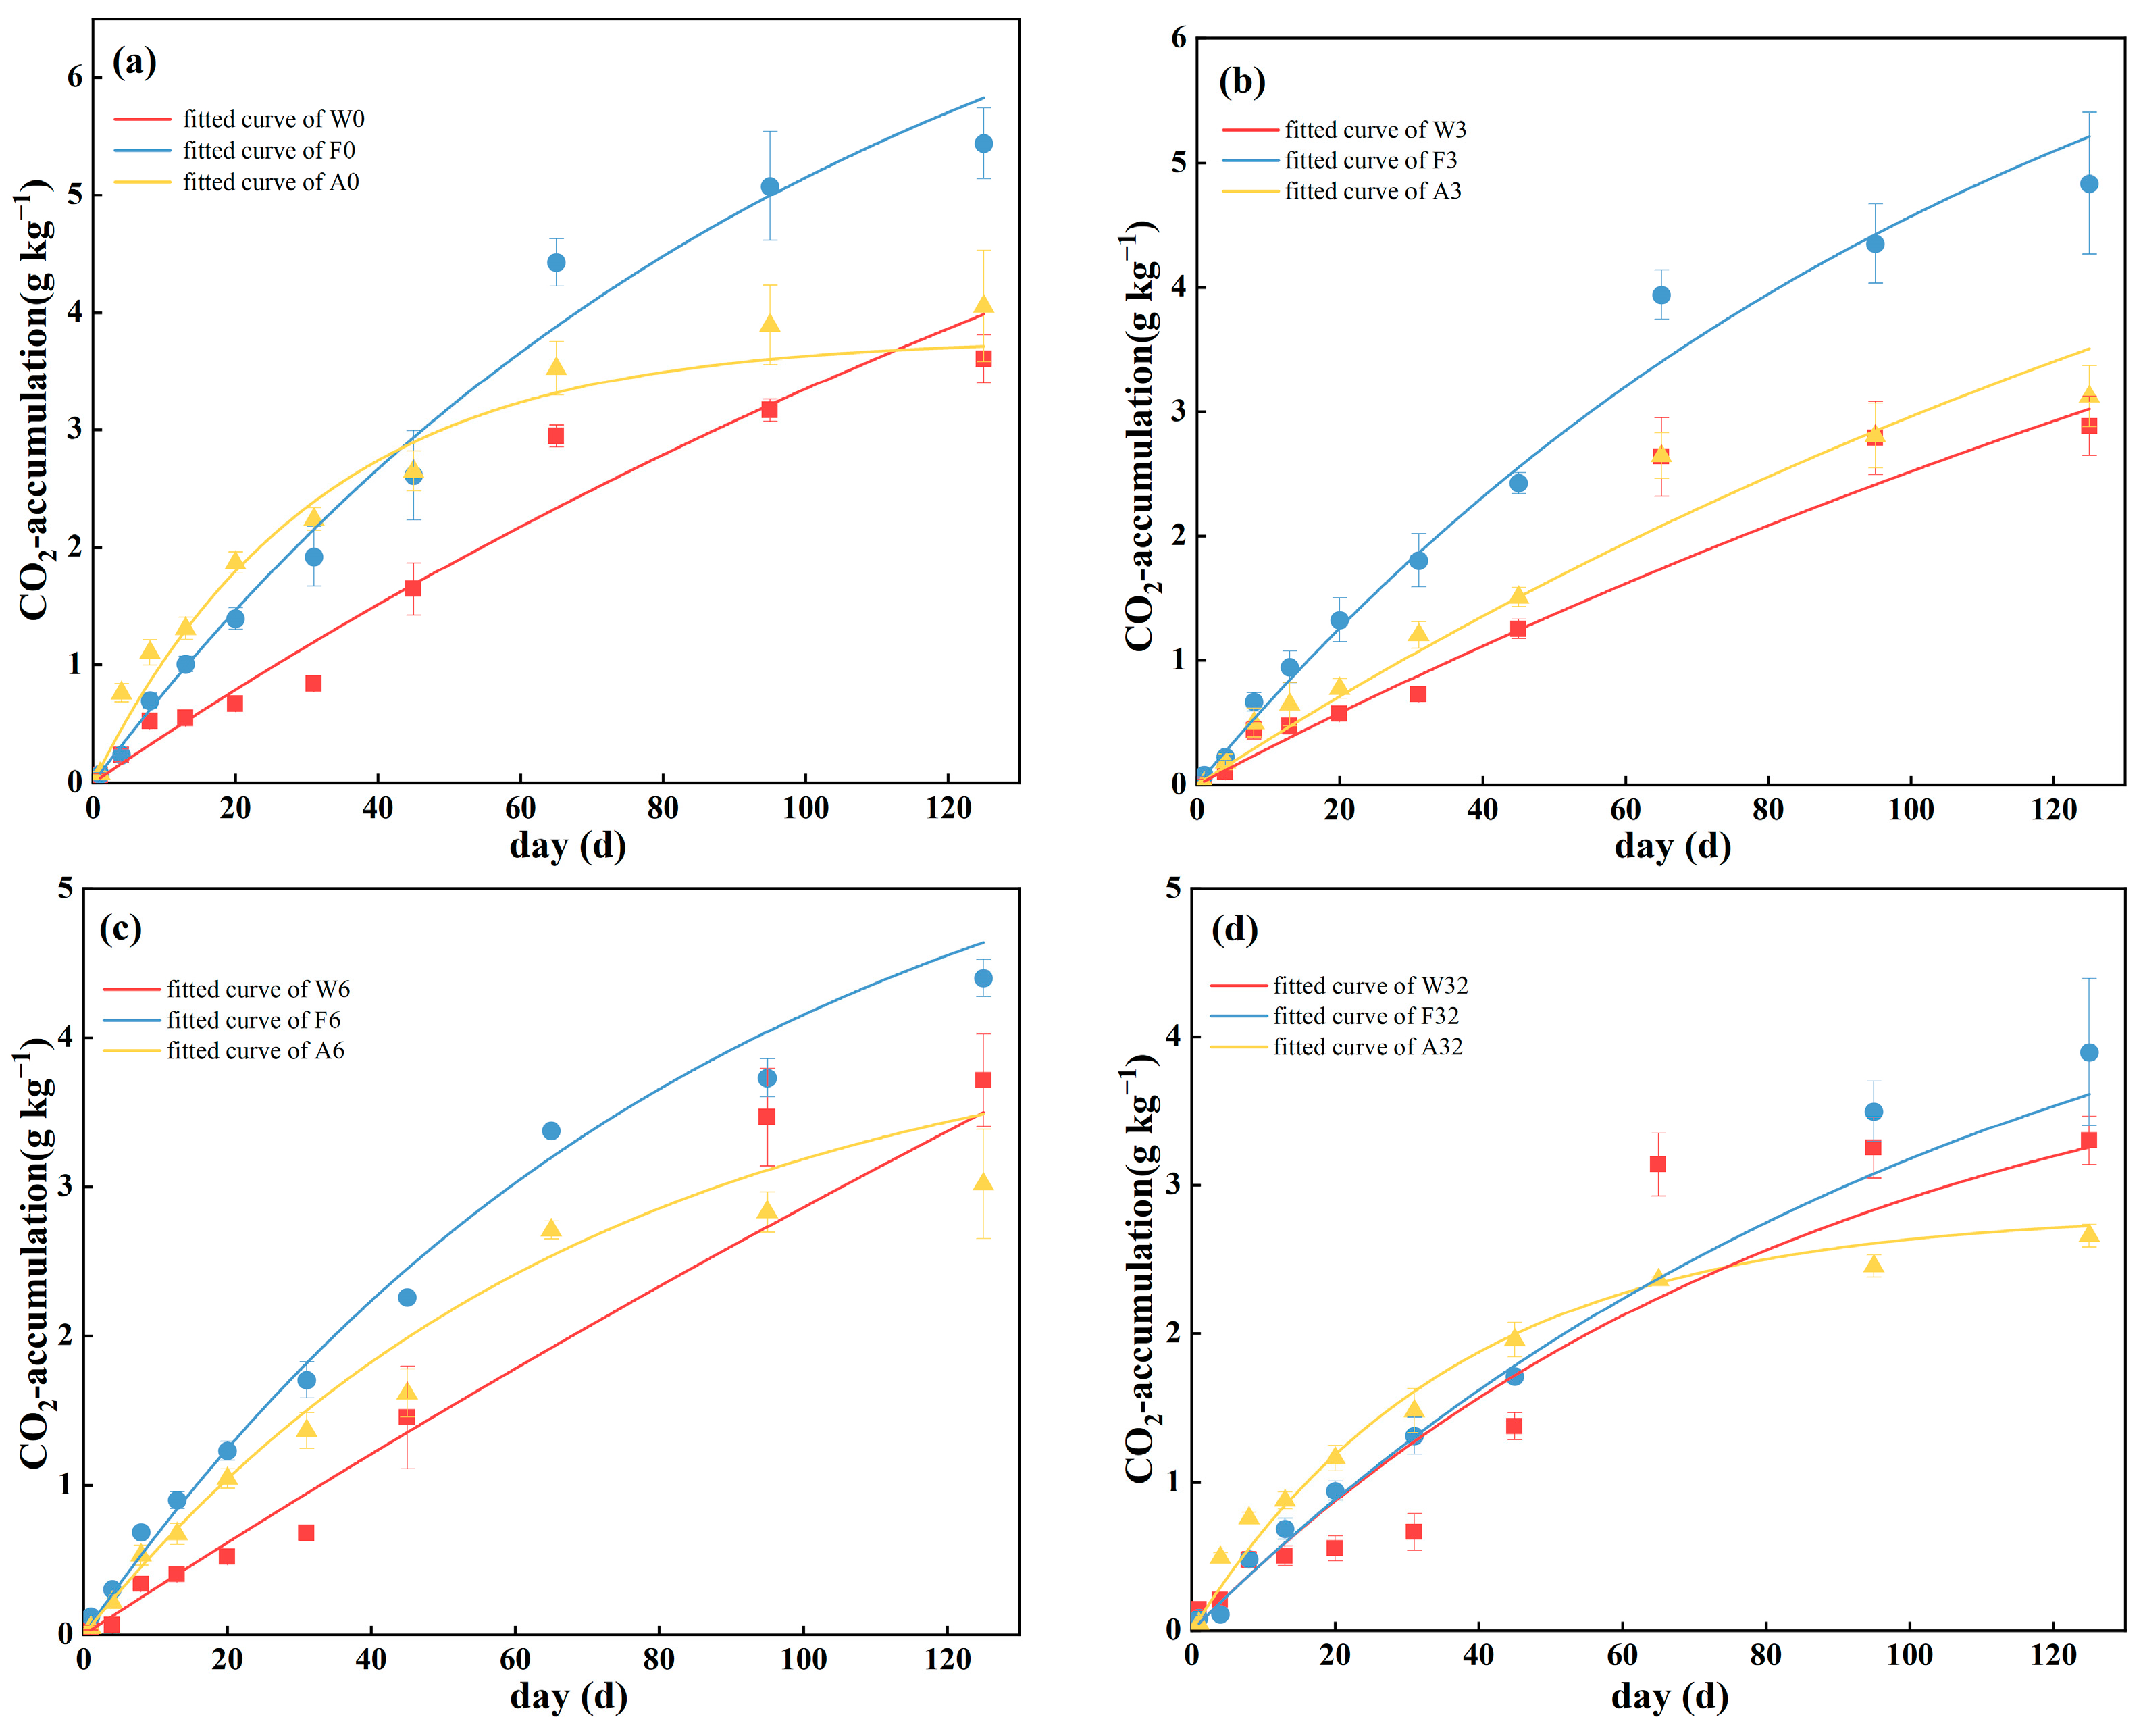
3.1. Mineralization Rate and First-Order Kinetic Model of Cumulative Mineralization

Soil mineralization rates were generally similar among the treatments, with an overall fluctuating downward trend over the 125-day incubation period, with CO2 release rates fluctuating sharply during days 1–8, declining rapidly on day 13, and essentially reaching a minimum and stabilizing on day 125, dropping below 10 mg C kg−1 d−1 on day 125. Notably, there was a strong pulse in soil mineralization on day 65 in both sites W and F, with no such pulse observed in site A. The average CO2 emission rate was higher in site A than sites W and F (Figure 1).
The cumulative CO2 release of all soil samples reflected a rapid increase in the early stage and a gradual stabilization in the later stage (Figure 2). After 125 days of incubation, the cumulative mineralization under each treatment in site W was ranked in descending order as 6‰, 0‰, 32‰, and 3‰. The 6‰ and 3‰ treatments corresponded to the highest and lowest cumulative mineralization of 3.712 ± 0.311 and 2.883 ± 0.239 g kg−1, respectively. Cumulative mineralization in site F decreased with increased salinity, and there was no significant difference in the cumulative mineralization of site A for treatments 3‰ and 6‰. Compared to the 0‰ treatment, high salinity suppressed the cumulative CO2 release in sites F and A, and resulted in the highest cumulative mineralization under the 0‰ treatment (5.441 ± 0.300 and 4.052 ± 0.474 g kg−1 for sites F and A, respectively), while the 32‰ treatment resulted in the lowest cumulative mineralization (3.895 ± 0.495 and 2.660 ± 0.076 g kg−1 for sites F and A, respectively), and the 32‰ treatment reduced the cumulative CO2 release by 28.41% and 34.35% for sites F and A, respectively, compared with the control.
The simulation of soil mineralization first-order kinetic equations for the cumulative CO2 release over 125 days (Table 2) showed a poor fit for site W, with an R2 of 0.90–0.96, and a better fit for sites F and A, with an R2 > 0.95. The 32‰ treatment reduced the C mineralization potential C0 and the turnover rate constant k of organic C pools compared to the 0‰ control; the 3‰ treatment reduced the C0 values of sites W and F and increased the C0 value of site A; the 6‰ treatment increased the C0 values of sites W and A while reducing that for site F. The 32‰ salinity treatment had an inhibitory effect on the soil C mineralization potential C0 and the rate of mineralization k of various land-use types. Compared with the 0‰ control, the 32‰ treatment reduced the C0 values of sites W, F, and A by 3.18%, 35.64%, and 25.41%, respectively, and, correspondingly, the k values by 0.40%, 6.89%, and 15.25%.

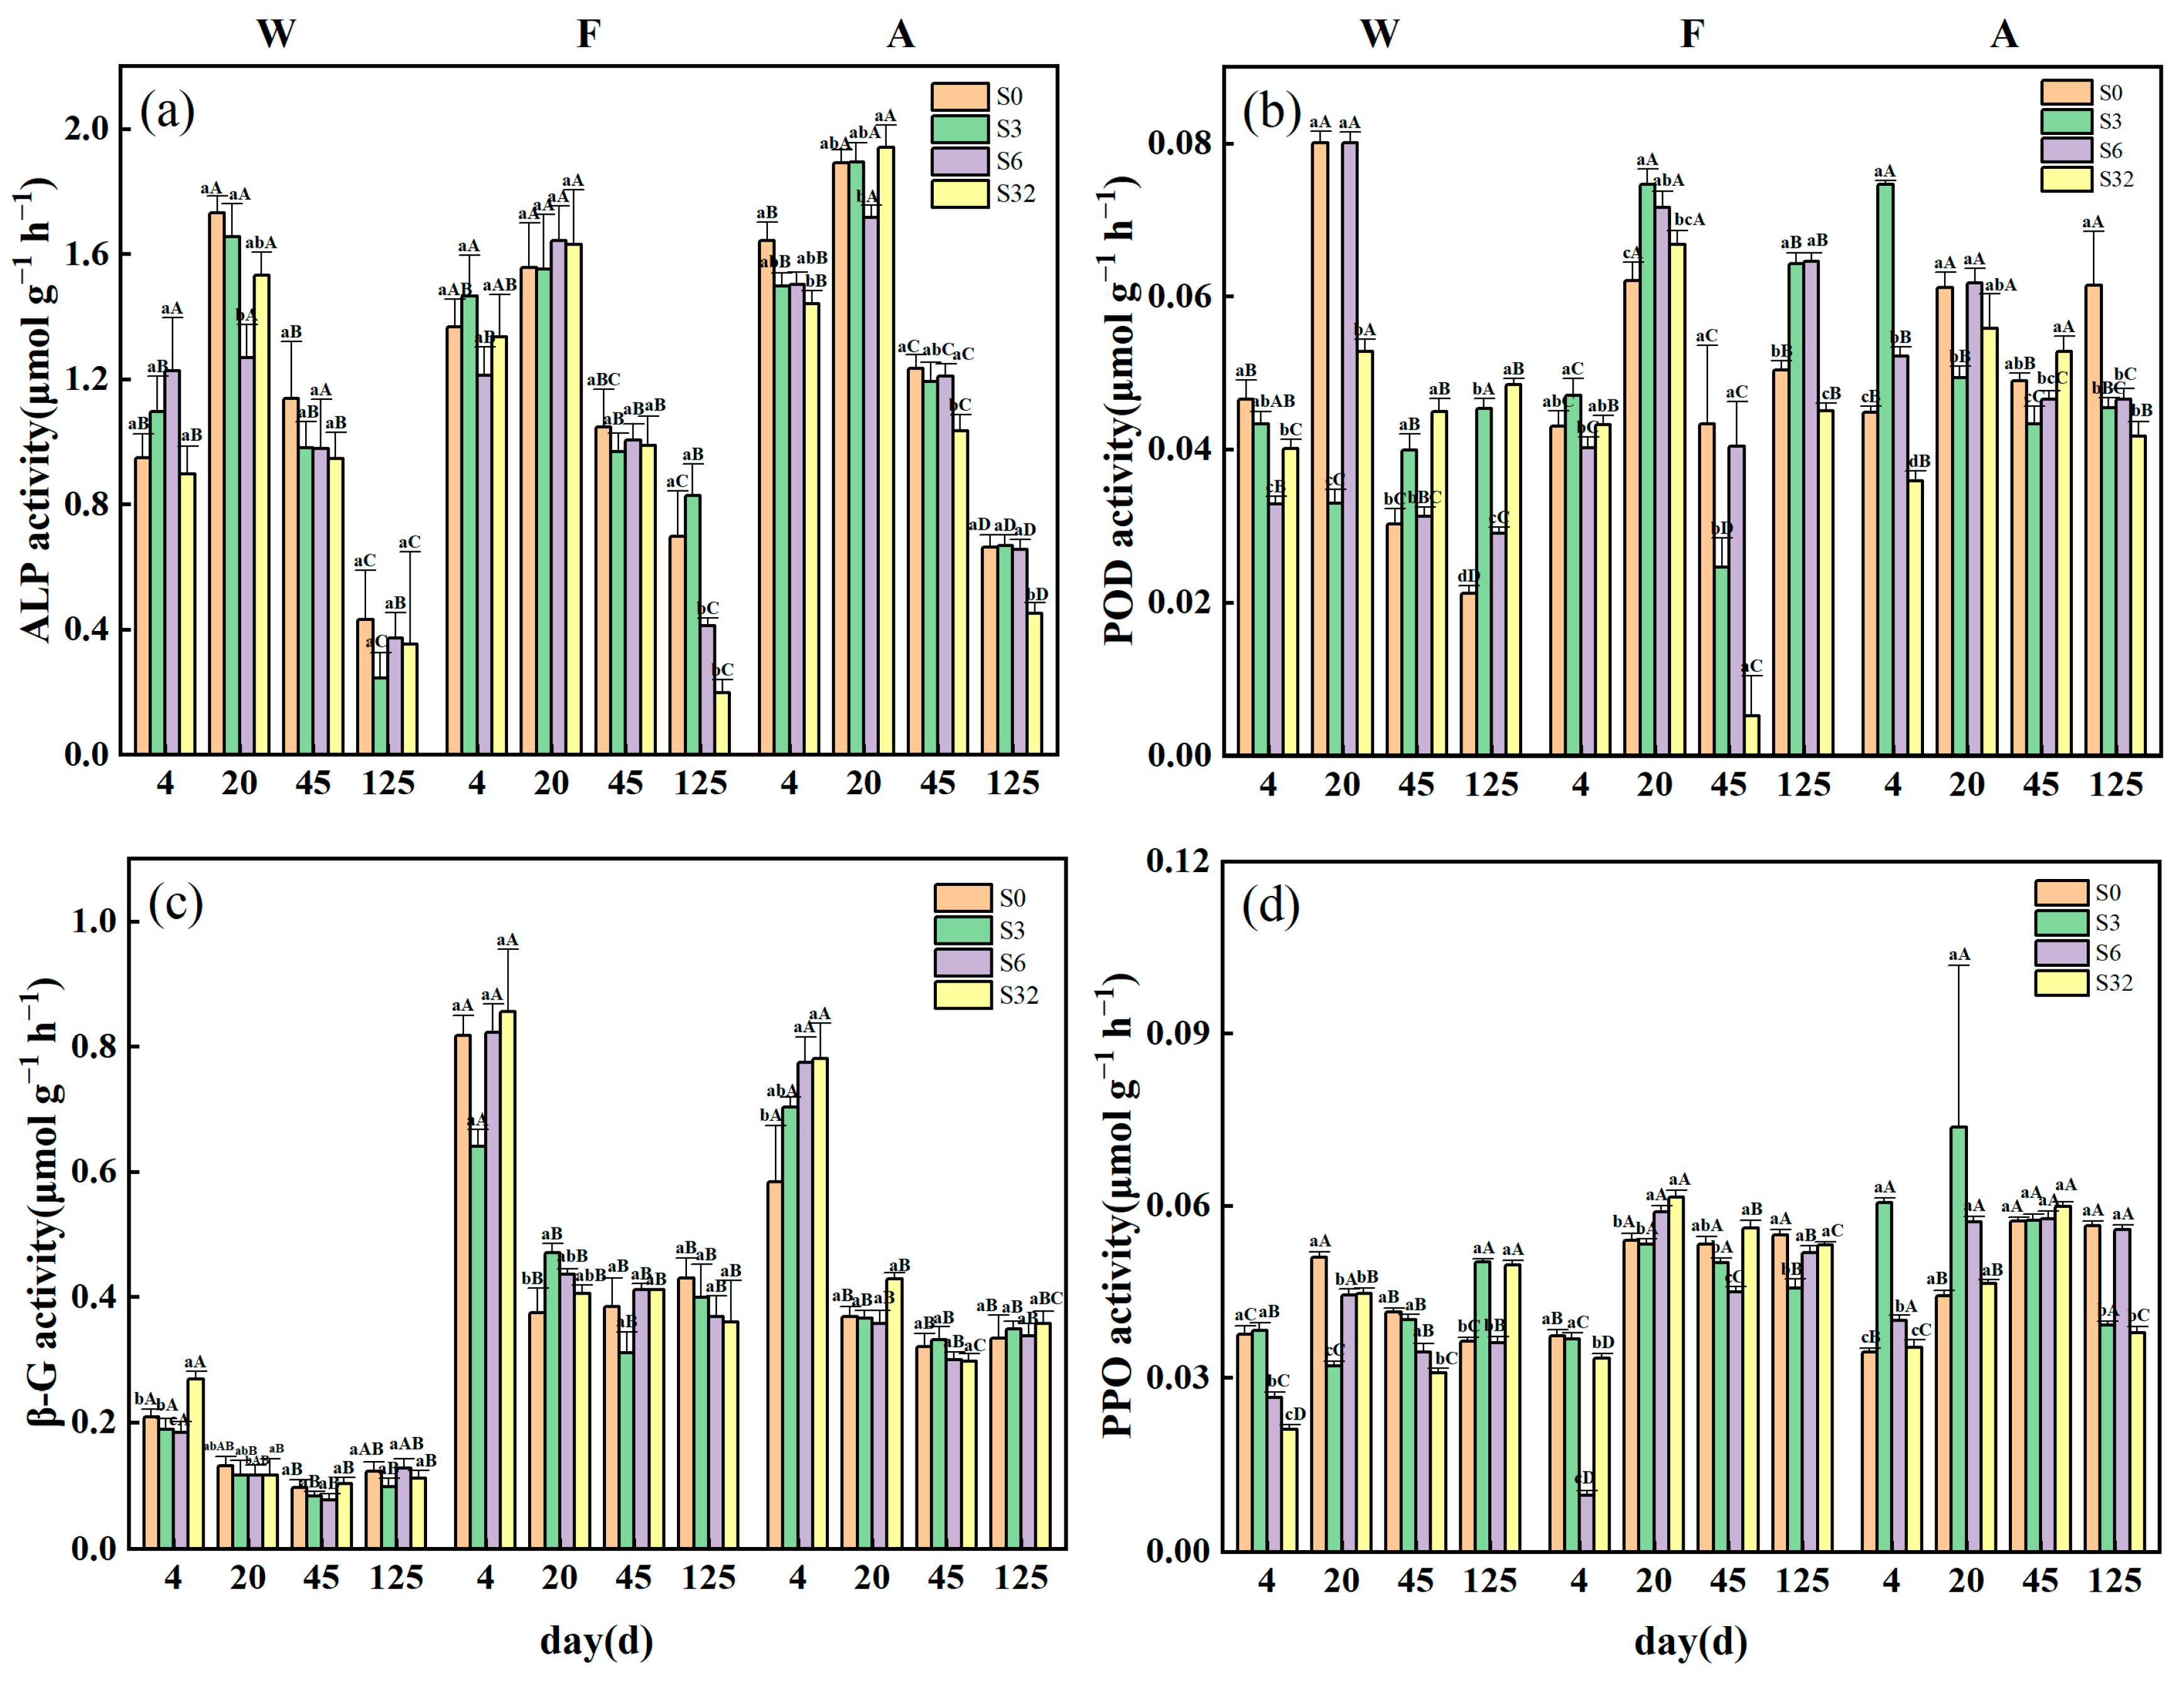
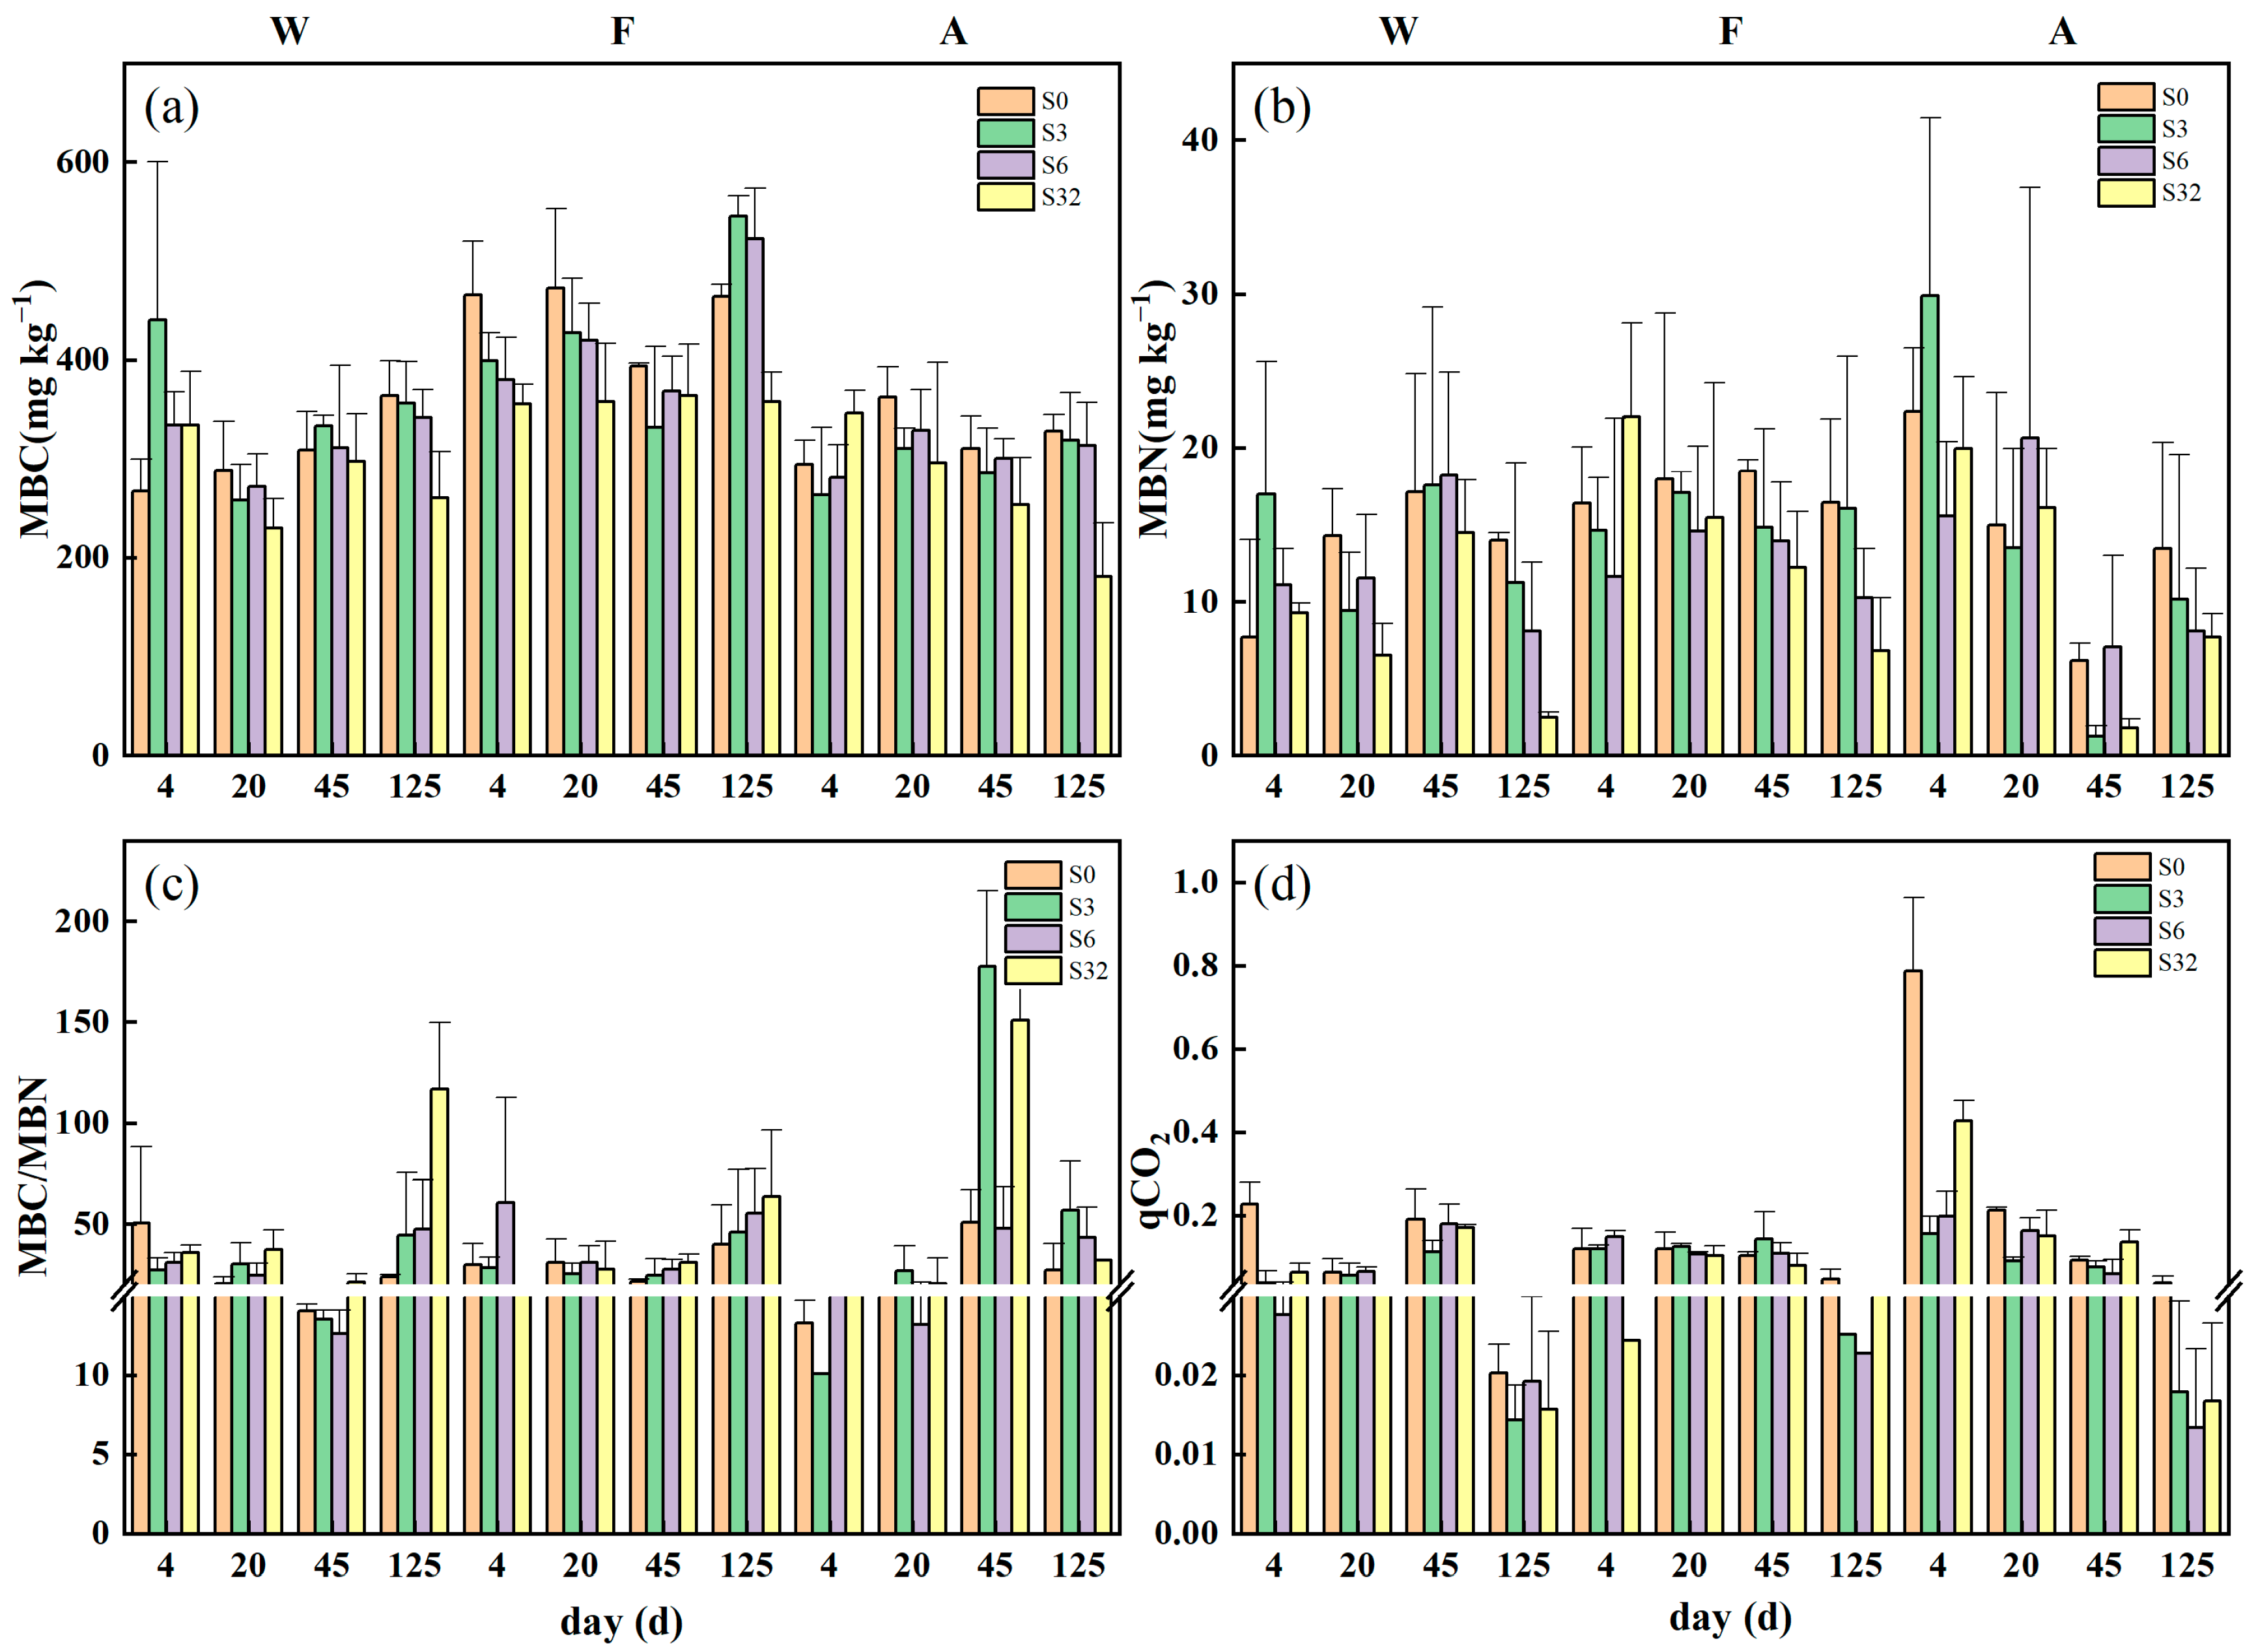
3.2. Changes in Soil Extracellular Enzyme Activities, Microbial Biomass, and qCO2 during Incubation

Soil extracellular enzyme activities varied significantly with time during incubation (Figure 3). The activity of ALP decreased continuously with time from day 20 and reached the lowest at day 125, with the lowest values of 0.244, 0.198, and 0.451 μmol g−1 h−1 for the three sample plots, respectively. The βG activities of W samples were basically lower than 0.2 μmol g−1 h−1, which was significantly lower than those of F and A samples. All samples had higher activities at the beginning of the incubation period (day 4), and the activities were significantly lower in the middle and late stages of the period (days 20–125). The differences in the βG activities were not significant among the salinity treatments in different periods of the incubation. In sites W and F, the POD activity was high at day 20, reaching a maximum of 0.08 and 0.075 μmol g−1 h−1, respectively. In sample F, the POD activity was greatly inhibited by the 32‰ treatment at day 45 (0.005 μmol g−1 h−1). The PPO activity at the initial incubation was significantly lower under the 32‰ treatment than at the middle and late stages of incubation (days 20–125). At the end of the incubation, the 32‰ treatment had no significant effect on the PPO activity in site F compared with the control, and elevated the enzyme activity in site W by 19.5% and reduced it in site F by 33.2%.
In general, the 32‰ treatment reduced the amount of MBC and MBN in the soil compared to the control and other low-salinity treatments (Figure 4). At the end of the incubation, salinity-treated samples in both sites W and A had a lower MBC content, whereas in site A, both the 3‰ and 6‰ treatments had a higher MBC content than the control. On day 125, additional salinity reduced the MBN content in all samples, and the higher the salinity added, the lower the MBN content. For sites W and F, the salinity treatments increased the MBC/MBN values, and these increased with increasing salinity.
The soil qCO2 of all treatments was at a maximum at the beginning of incubation and reached a minimum on day 125, with the lowest value of 0.014 ± 0.004 mg C mg−1 MBC d−1 for site W, which was only 6.31% of the maximum value (0.227 ± 0.052 mg C mg−1 MBC d−1). For site A, the qCO2 of the soil samples of all treatments decreased during the incubation, with lower qCO2 values in the salinity-treated samples. Overall, all samples showed little change at days 4, 20, and 45, but all showed a significant decrease on day 125.

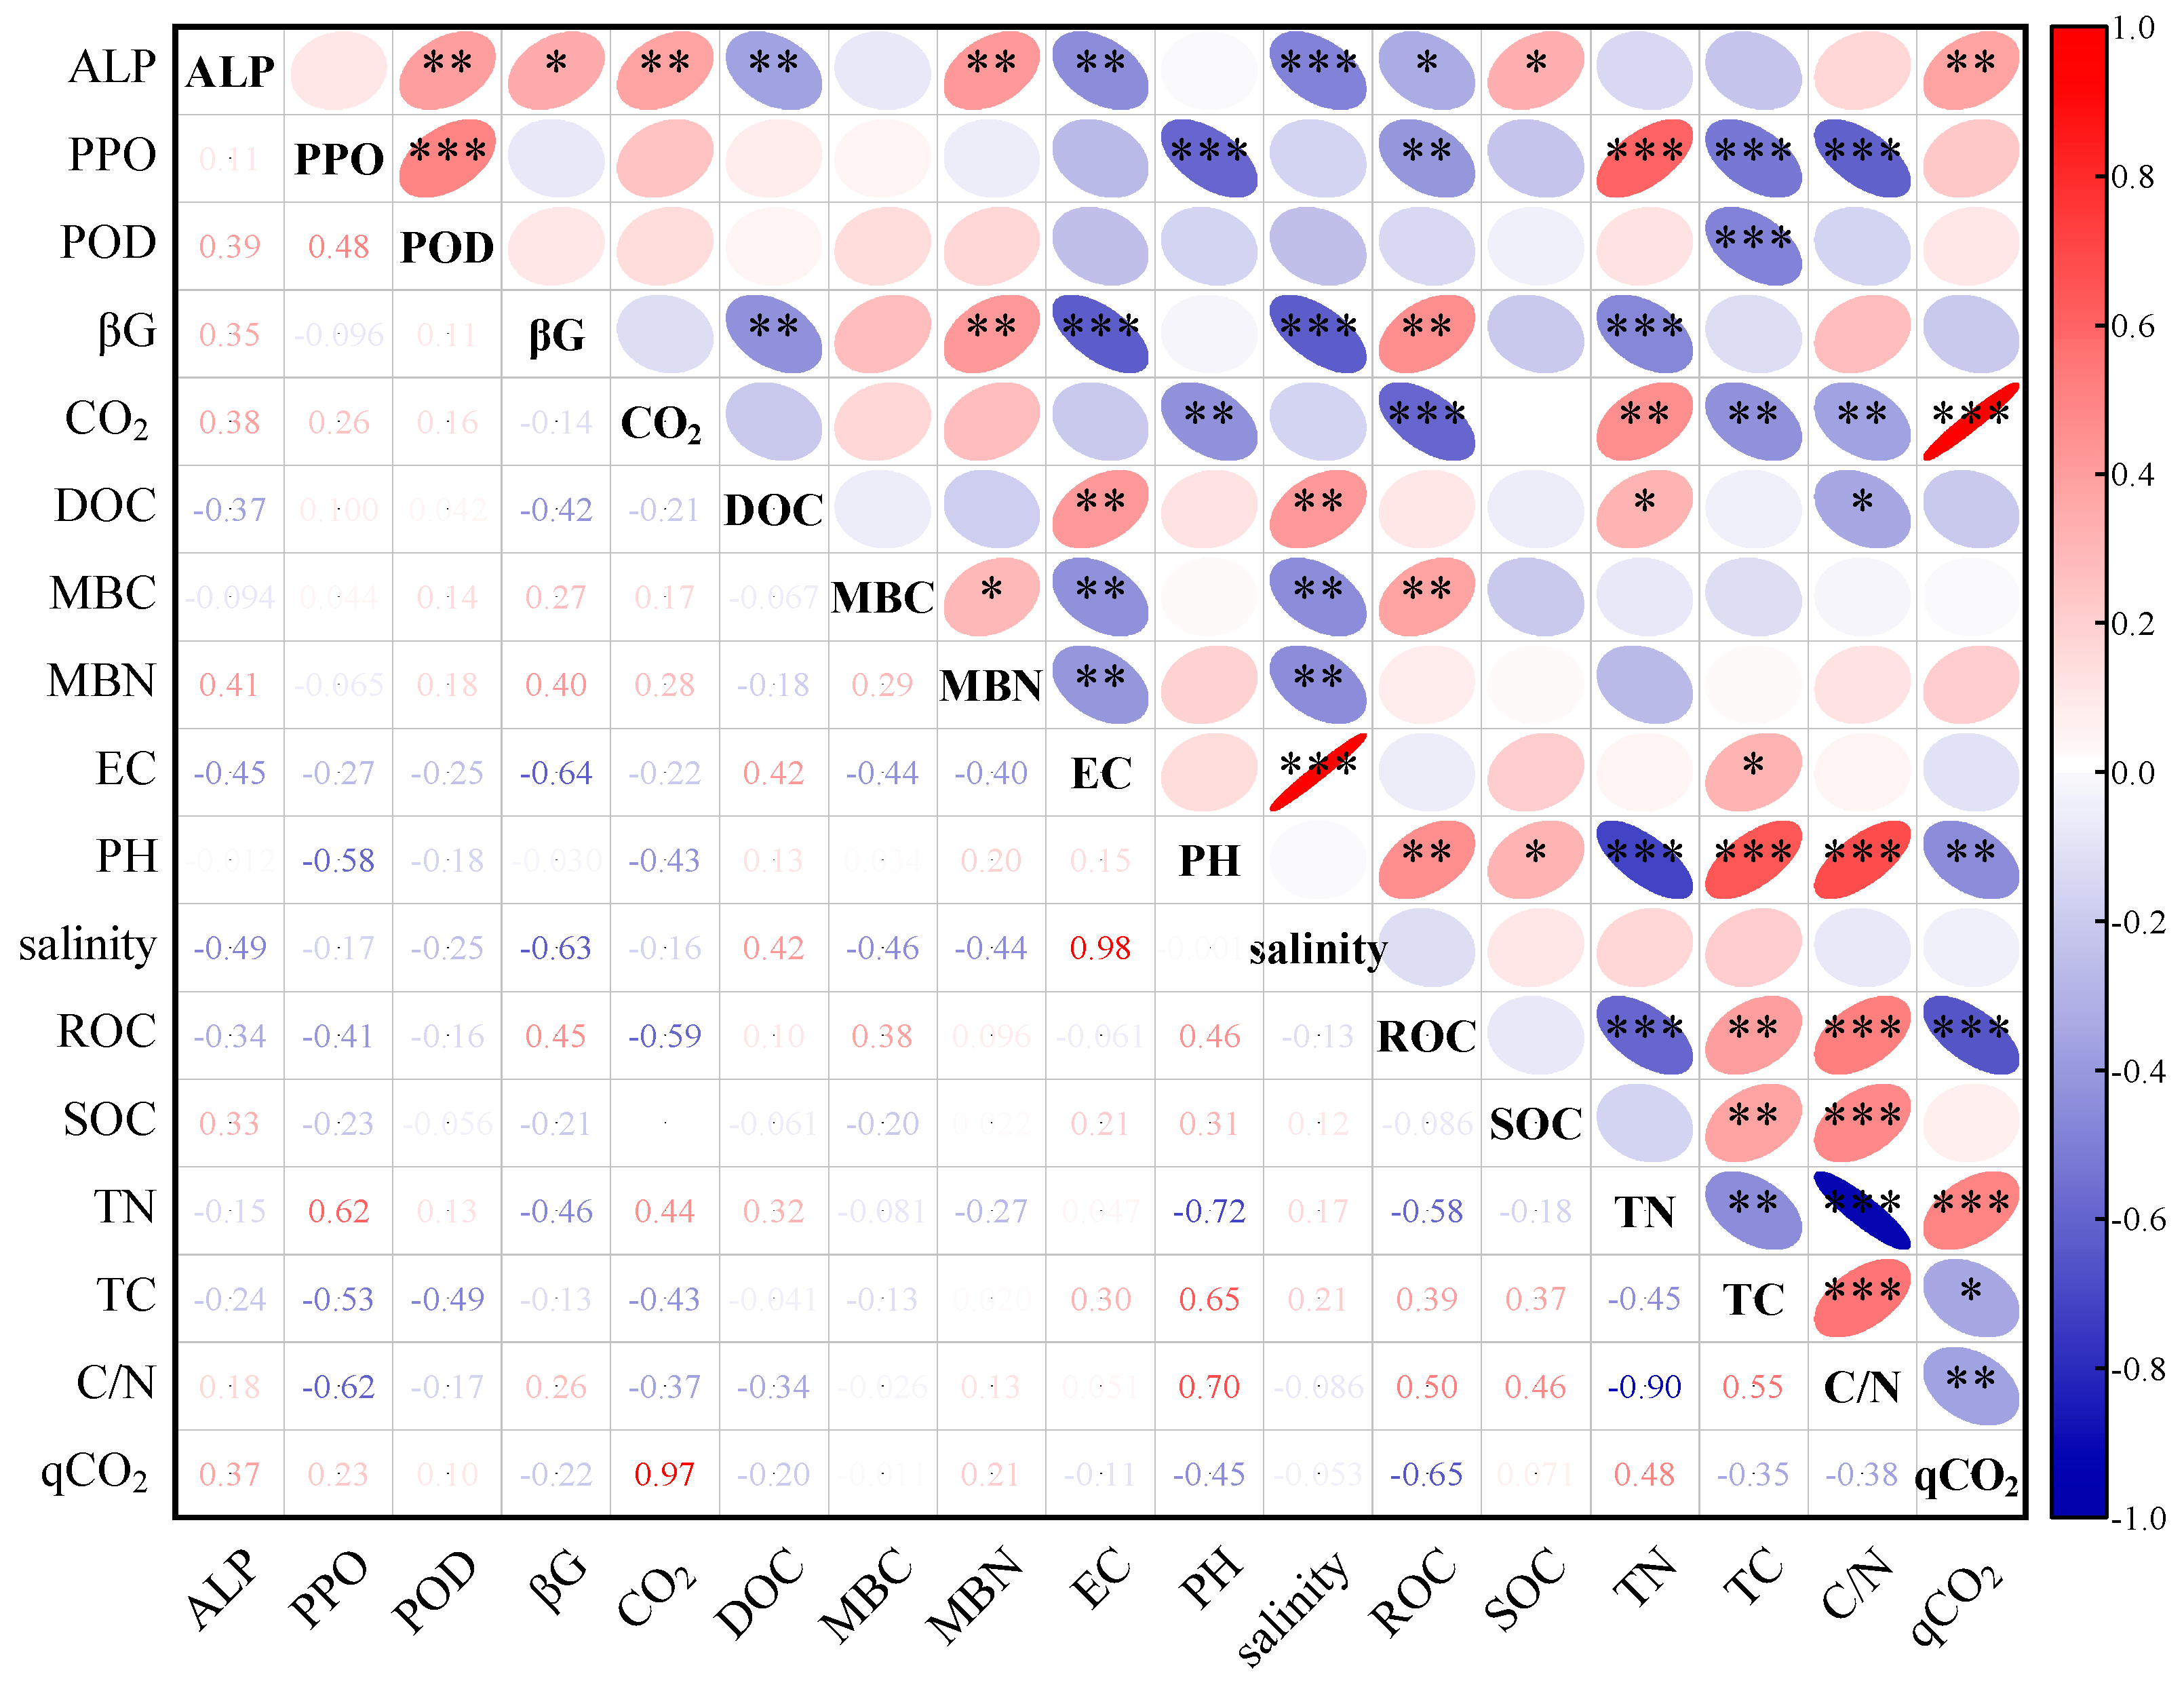
3.3. Relationships between Soil C Mineralization and Soil Physical and Chemical Properties, Extracellular Enzymes, and Microbial Biomass in Different Land-Use Types

For site W, the mineralization process could be explained by the microbial biomass, pH, and TC (p < 0.001), explaining 88% of the variance (Table 3). Among them, MBC and MBN had the greatest effect, with standardized regression coefficients of 0.67 (p < 0.01) and 0.765 (p < 0.001), respectively. The C mineralization in site F, however, was highly correlated (p < 0.001) with ROC and salinity, with standardized regression coefficients of −0.843 (p < 0.001) and −0.333 (p < 0.05), respectively, explaining 75% of the variance. The ALP and βG could explain soil C mineralization (p < 0.001) in site A, with regression coefficients of 0.778 (p < 0.001) and −0.641 (p < 0.01), respectively, explaining 69% of the variance. According to enzyme stoichiometry, we found that the samples under different salinity treatments exhibited differences in C, N, and P limitation (Figure 5). Since the ALP activity was closely related to the P content, the influences on mineralization in the three land-use types can be attributed to the following three dimensions: soil C fractions (TC, MBC, and ROC), salinity, and nutrients. Among them, C fractions and nutrients responded to the C, N, and P limitation of microorganisms through enzyme stoichiometry. At the end of 125 days of incubation, the addition of salinity reduced the C limitation of microorganisms for both the F and A sites, and the 32‰ treatment significantly reduced the C limitation of microorganisms (p < 0.05) by 58.15% and 44.83%, respectively (compared with 0‰), but the 32 ‰ treatment did not significantly reduce the C limitation of site W. Site F was P-limited for the 6‰ and 32‰ treatments, whereas it was N-limited at 0‰ and 3‰; site A always reflected N limitation, regardless of the treatment; site W reflected P limitation at the 3‰ and 32‰ treatments.

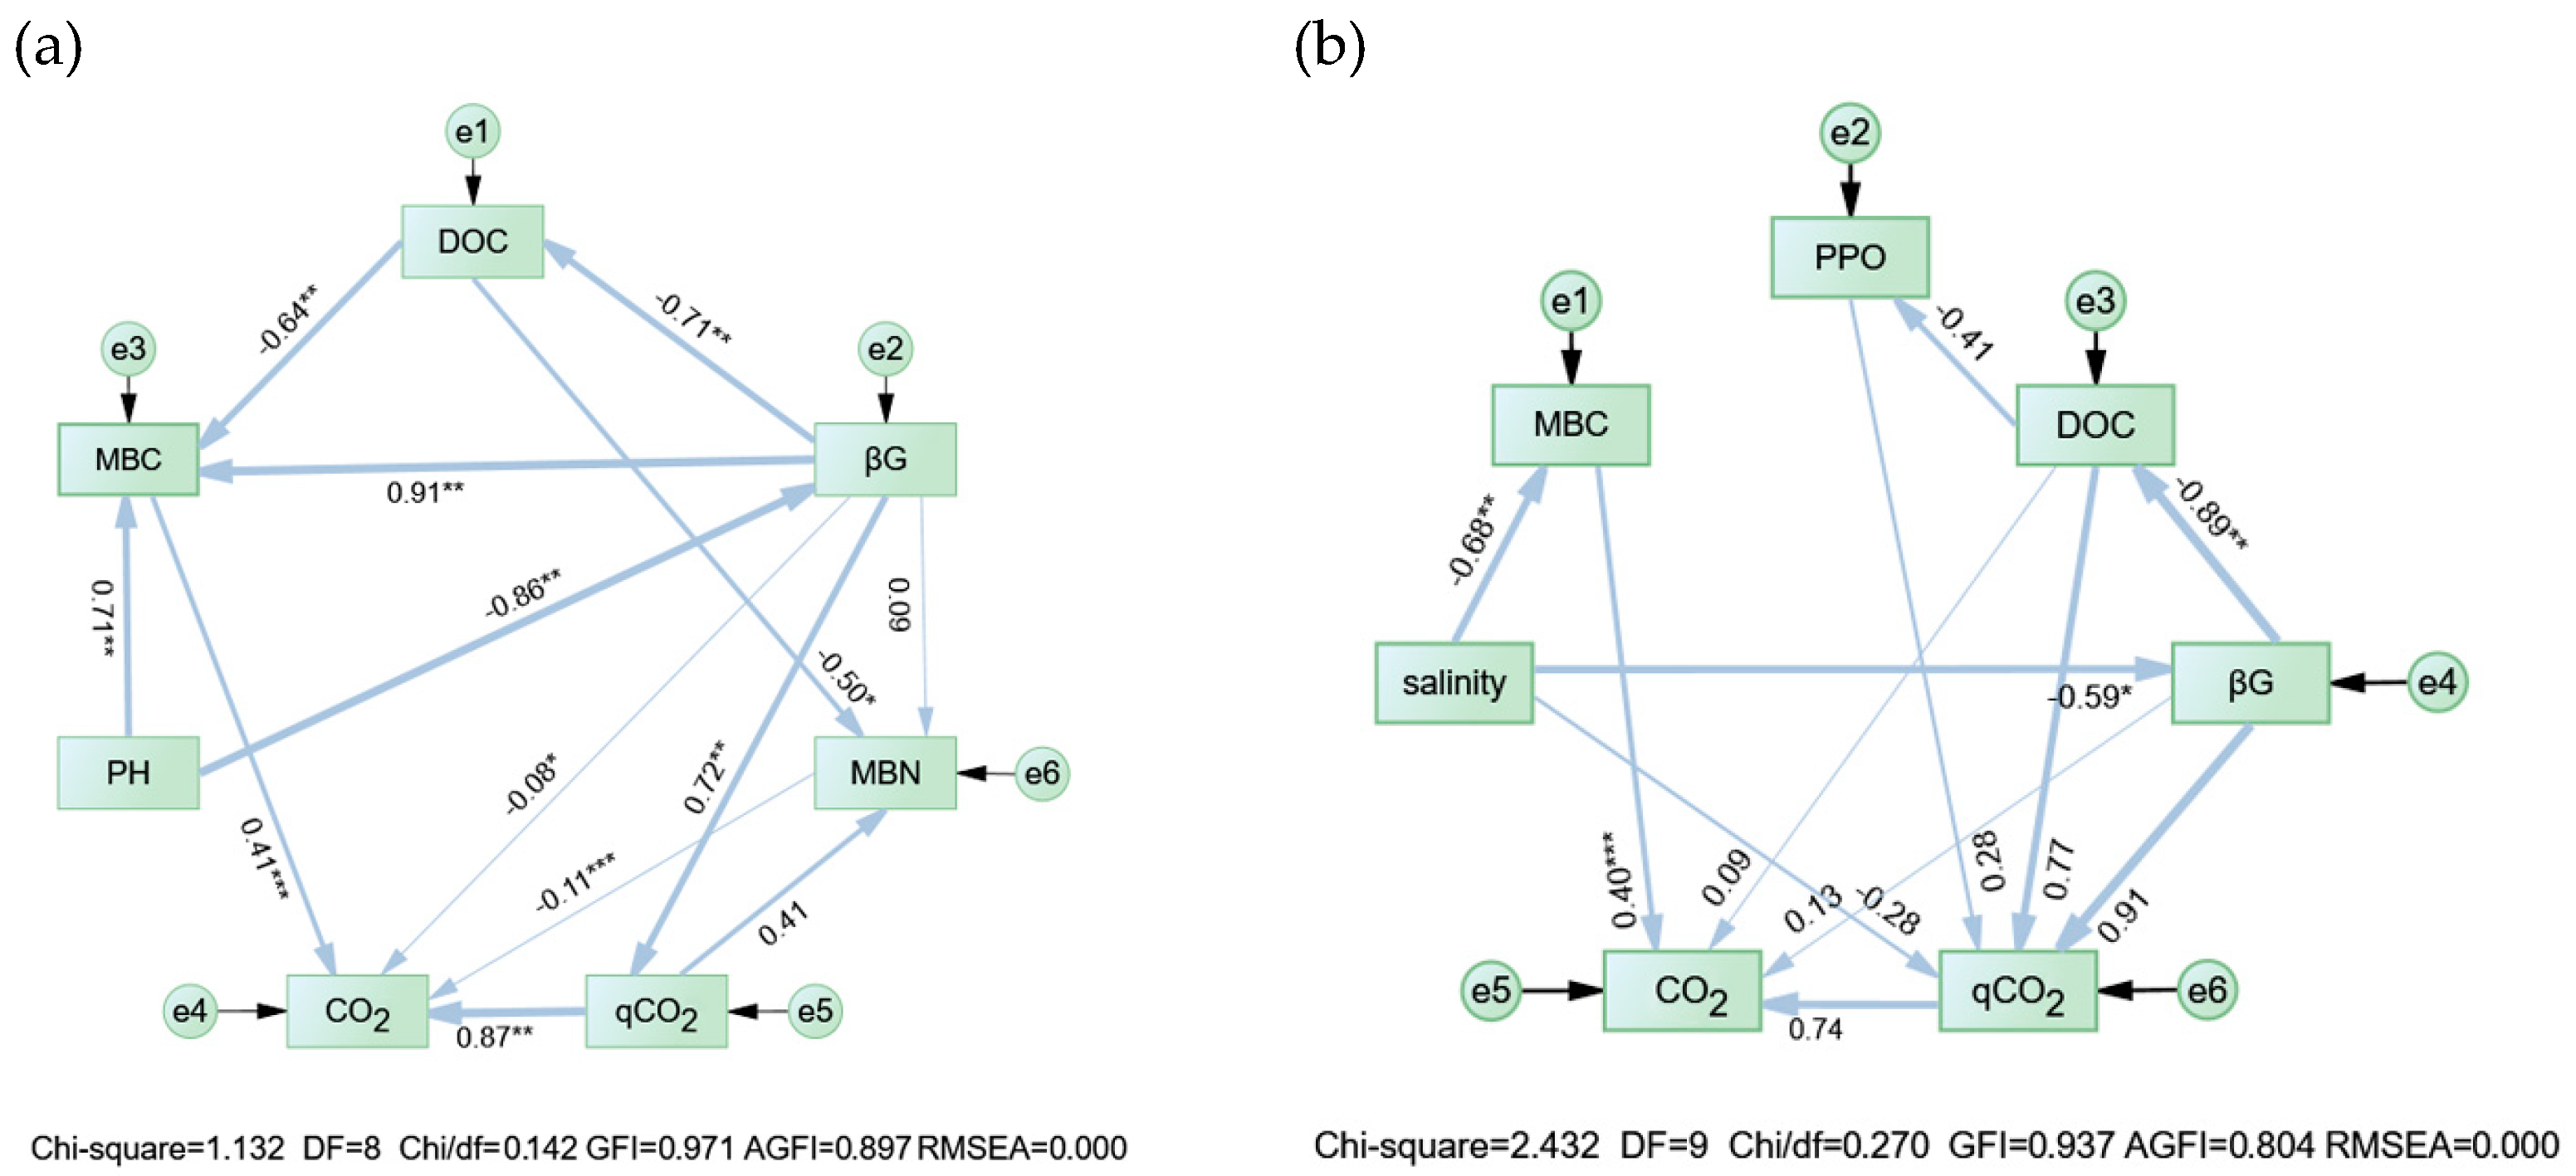
3.4. Possible Pathways Driving Soil C Mineralization

During 125 days of incubation, the CO2 release rate showed significant positive correlations with the ALP and TN (both p < 0.01), significant negative correlations with the pH, TC, and C/N (all p < 0.01), and highly significant negative and positive correlations with the ROC (−0.59) and qCO2 (0.97), respectively (both p < 0.001) (Figure 6).
The C mineralization pathways in the pre-incubation (day 20) and post-incubation (day 125) stages differed (Figure 7). In the pre-incubation stage, the increase in the pH inhibited the βG activity, which affected DOC and MBC, and qCO2 had a positive effect on CO2 release as a mediating variable. In the later stages of incubation, salinity and PPO were introduced into the model, with salinity directly affecting βG and MBC, and qCO2 remaining as an important mediating variable controlling the rate of CO2 release. Both in the early and late stages, βG had an important driving effect on soil C fractions and microbial biomass; the two active C fractions, DOC and MBC, were indispensable for modeling; MBC had a large direct positive effect on CO2 release (p < 0.001), with path coefficients of 0.41 and 0.40, respectively. The important function of MBC has been previously reported [57,58].

4. Discussion

4.1. Effect of Salinity on Soil C Mineralization

In our study, the significant difference between salinity and land-use type on the CO2 release rate was not reflected due to the large fluctuation of the CO2 release rate change in different incubation periods and the small difference among treatments in the same period. At the beginning of incubation, the CO2 release rate was at a higher level due to the more adequate C and nutrient sources and higher microbial activity. As the incubation time increased, the quality of C decreased and became less effective, limiting microbial activity [53]. In the multiple linear regression, it can be found (Table 3) that the variation in salinity was directly introduced into the regression equation of the mineralization rate of the forest land, which was significantly negatively correlated with the mineralization rate (p < 0.05), indicating that salinity had a direct inhibitory effect on the process of carbon mineralization in the forest land. The carbon mineralization rate of the wetland site was positively correlated with MBC (p < 0.01) and TC (p < 0.05), while the mineralization rate of the forest site was highly correlated with ROC. Although no carbon component was directly introduced into the regression equation of the mineralization rate in the agroforestry land, βG is an important extracellular enzyme involved in the degradation of reactive carbon components (e.g., cellulose, hemicellulose, etc.), and it has been demonstrated that βG enzyme activity decreases exponentially in the absence of available resources [59]. Thus, the dependence of soil carbon mineralization processes on carbon pools was evident in the three sites. In sites W and F, we observed a strong pulse on day 65 of incubation (Figure 1), similar to phenomena found in other studies [60]. This may be due to changes in C effectiveness or the mineralization of moderately labile C pools [61].
Cumulative mineralization showed significant differences among treatments (Figure 2), and the cumulative release of CO2 in site A basically stabilized on day 45. At the end of 125 days of incubation, the salinity treatments reduced the cumulative release of CO2—the inhibition of soil respiration by salinity has previously been demonstrated [62]. Similarly, under 32‰ salinity, the cumulative releases of CO2 in sites F and A were lower than for other treatments, indicating that high salinity had an inhibitory effect on the cumulative release of CO2. On the one hand, this may be because high salinity leads to water loss or the ionic toxicity of microbial cells and reduces microbial activity, lowering their ability to decompose organic C [37]. On the other hand, microorganisms use the energy gained from decomposing substrates more for the synthesis of osmotic pressure regulators than for respiration. In addition, salinity was significantly and negatively correlated (p < 0.01) with MBC and MBN (Figure 6), suggesting that increased salinity may lead to microbial growth stress, which ultimately appears as a decrease in microbial biomass. It has been shown that, in non-salinized soils and mildly salinized soils, an increase in salinity leads to changes in the bacterial community composition, whereas salinity input into heavily salinized soils does not change the bacterial community composition [63], which explains why high salinity concentrations inhibited soil carbon mineralization in agroforestry and forests but had no significant effect on mineralization in wetlands in this study.

4.2. Differences in Factors Influencing Soil C Mineralization for Different Land-Use Types

In site W, the 3‰ treatment instead had a lower cumulative mineralization than the 32‰ treatment, differing from sites F and A. In addition, the simulation results of soil mineralization with a first-order kinetic equation (Table 2) showed that the 32‰ treatment had the least weakening effect on the mineralization potential C0 and mineralization rate constant K of site W compared to the 0‰ treatment, which may be due to site W being subjected to tidal submersion for a long period, and so soil microorganisms developed adaptations to salinity [35]. However, the mere fact that the high-salinity treatment would inhibit soil respiration and decrease the mineralization potential phenomenon does not lead to the conclusion that saline soils favor soil C sequestration. It has been shown that the effect of substrate quality on soil respiration is greater than that of salinity in coastal wetlands [57], and that the ratio of fungal–bacterial growth is lower when the soil C quality is higher [18], which improves the microbial C use efficiency. The results of enzyme stoichiometry (Figure 5) also showed that site W was significantly more C-limited than the other two sites under the 32‰ treatment, which is one point of evidence that soil C mineralization was limited by the substrate. In addition, MBC and TC were introduced into the regression equation for site W mineralization, with regression coefficients of 0.67 and 0.378, respectively, suggesting that the C quality may be the determining factor for C mineralization in wetlands.
With the addition of salinity, the C quality was not dominant for soil C mineralization in sites F and A, but rather salinity dominated the mineralization rate. This was reflected in the following two ways: (1) enzyme stoichiometry (Figure 5) showed that the C limitation for sites F and A decreased with increasing salinity treatments, suggesting that the effect of the soil C quality on mineralization was weakening with increasing salinity; (2) in multiple linear regressions, the salinity variable was introduced into the mineralization of site F, and the ALP and βG variables were introduced for site A, which were highly significantly negatively correlated with salinity (Figure 6). Salinity can alter the composition and size of soil C pools by affecting extracellular enzyme activities (Figure 7), and thus mineralization for sites F and A was essentially affected by the salinity. Both sites W and A were significantly P-limited under the high-salinity treatments (Figure 5), thus inhibiting the synthesis of key P-containing compounds, such as ATP and DNA [64]. This resulted in a reduction in the ability of microorganisms to metabolize C and slow the release of CO2 by reducing qCO2 [58]. Site A, however, was N-limited, probably because it was affected by anthropogenic fertilizers and resulting in a higher level of P.

4.3. Factors Influencing Soil C Mineralization

SEM (Figure 7) was used to investigate the different pathways of soil C mineralization in the pre- and post-incubation periods. At day 20 of incubation, the negative pathway of the pH on βG was significant (p < 0.01), while DOC and βG, in turn, had an indirect effect on CO2 through MBC or qCO2. In addition, we found that the pH was significantly correlated with the PPO, ROC, SOC, and TC (Figure 6), in which PPO is one of the major extracellular enzymes for degrading stable carbon pools (e.g., lignin, chitin, etc.), which reflects the size of the labile carbon pools, and thus the pH was strongly correlated with the total, active, and labile carbon pools of the soil. In addition, it has been reported that the pH can indirectly affect microbial biomass carbon MBC and microbial respiratory quotient qCO2 by influencing the quality of soil organic matter [65], which suggests that the pathway by which the pH affects carbon mineralization may be through influencing the quality of carbon pools to affect microbial respiration.
Compared with day 20, the model for day 125 introduced two variables, salinity and PPO, possibly because the salinity accumulated with the incubation time, and the high concentration of salts gradually gained a controlling position in the process of C mineralization, while the effect of the pH on microbial extracellular enzymes (βG) gradually diminished, as evidenced by the lack of the significant correlation between them during the overall incubation process (Figure 6). In addition, PPO and POD are enzymes involved in lignin (stable C fraction) decomposition, and βG is an enzyme involved in cellulose decomposition (unstable C fraction) [21]. Both in the pre- and post-incubation periods, βG was involved in multiple explanatory pathways for soil C mineralization, suggesting that unstable C fractions, such as MBC, DOC, and ROC, which were mentioned in the correlation and regression analyses, were critical for soil C mineralization. The fact that PPO failed to explain soil C mineralization in the pre-incubation period but was introduced into the SEM in the post-incubation period may be caused by the decomposition of stable C pools (e.g., lignin and chitin). A global meta-analysis study found that salinization reduces the activity of hydrolytic enzymes and increases the activity of oxidative enzymes [66]. This is mainly because hydrolytic enzymes utilize unstable carbon pools, which are mainly derived from plant litter and root secretions, and salinity stress may inhibit plant growth, which reduces the production of plant litter and roots, resulting in an inadequate supply of unstable carbon pools, and thus soil microorganisms generate more oxidases to degrade macromolecules in the stable carbon pools [67]. A highly significant negative correlation between β-glucosidase and salinity was likewise found in this study, which is consistent with previous findings. In the present study, we did not find a direct relationship between salinity and oxidative enzymes (PPO and POD), but in the structural equation model of D125, we observed a negative correlation between DOC and PPO, which, to a certain extent, explains the inevitable link between the reduction in unstable carbon pools and the increase in oxidative enzyme activities. This is further evidence of the absolute dominance of soil C pools for the CO2 release process and the differences in the contributions of different stabilizing C pools at different incubation stages [68].
Overall, different land-use types have variations in soil physicochemical properties, carbon pool composition, and nutrient status due to different management practices and habitats. Throughout the incubation process, we observed highly significant and strong correlations of the CO2 release rate with ROC and qCO2 (Figure 6). In turn, qCO2 and ROC were significantly correlated with soil carbon pools (βG, MBC, TC, and PPO), the soil environment (pH and salinity), and the nutrient status (ALP and TN). Combined with the structural equation model, it can be found that soil environmental limitations (pH and salinity) and soil nutrients (N and P) alter the rate of soil mineralization by affecting carbon degradation-related extracellular enzyme activity (βG), which varies the rate of degradation of differently stabilized carbon pools.

5. Conclusions

The cumulative soil C mineralization of different land-use types showed different response characteristics to different salinity treatments. For the forest and agroforestry composite soils, the mineralization was more sensitive to high salinity, because salinity, by affecting the activity of the extracellular enzymes of the microorganisms, determines their ability to decompose the C source and makes the energy gained from decomposition less available for respiration, which can be reflected by qCO2. However, wetland mineralization was not sensitive to high salinity and was more affected by the soil C pool and P limitation, likely because the microorganisms in wetlands have built up salt-tolerance mechanisms over a long period, and so the salinity was not a major factor. Accordingly, we predict that seawater intrusion into groundwater in coastal areas will greatly affect the mineralization process of non-saline soils in the future, but the kind of stable influence pattern of seawater intrusion for the mineralization of different land types over longer periods needs further exploration, and whether the response of wetland mineralization to high salinity will be revealed with extended study duration is unknown. Meanwhile, whether such a mineralization pattern is applicable to other land-use types at a larger spatial scale requires greater effort to better predict the possible impacts of seawater intrusion on soil C mineralization.

Author Contributions

Conceptualization, X.Y. and H.H.; methodology, X.Y., H.H. and D.C.; software, X.Y.; validation, X.Y., H.H. and W.D.; formal analysis, X.Y.; investigation, X.Y., D.C., J.C. and S.G.; resources, X.Y.; data curation, X.Y.; writing—original draft preparation, X.Y.; writing—review and editing, X.Y., H.H., J.C. and W.D.; visualization, X.Y.; supervision, X.Y.; project administration, X.Y. and H.H.; funding acquisition, H.H. All authors have read and agreed to the published version of the manuscript.

Funding

This research was funded by the Special Fund Project for Technology Innovation on Carbon Peak Carbon-Neutral in Jiangsu Province in 2021: “Key technology research on energy crops and tree cultivation of agroforestry system and promotion of ecological carbon sequestration capacity in coastal areas” (BE2022305).

Institutional Review Board Statement

Not applicable.

Informed Consent Statement

Not applicable.

Data Availability Statement

Data are contained within the article.

Acknowledgments

We thank Yudong Yang, Dafeng District Forestry Farm, Yangcheng city, for his help during the sampling process.

Conflicts of Interest

The authors declare no conflicts of interest.

References

  1. Feng, J.; Song, Y.; Zhu, B. Ecosystem-dependent responses of soil carbon storage to phosphorus enrichment. New Phytol. 2023, 238, 2363–2374. [Google Scholar] [CrossRef] [PubMed]
  2. Elbasiouny, H.; El-Ramady, H.; Elbehiry, F.; Rajput, V.D.; Minkina, T.; Mandzhieva, S. Plant Nutrition under Climate Change and Soil Carbon Sequestration. Sustainability 2022, 14, 914. [Google Scholar] [CrossRef]
  3. Yang, M.; Hou, Z.; Guo, N.; Yang, E.; Sun, D.; Fang, Y. Effects of enhanced-efficiency nitrogen fertilizers on CH4 and CO2 emissions in a global perspective. Field Crops Res. 2022, 288, 108694. [Google Scholar] [CrossRef]
  4. Bond-Lamberty, B.; Thomson, A. Temperature-associated increases in the global soil respiration record. Nature 2010, 464, 579–582. [Google Scholar] [CrossRef] [PubMed]
  5. Bossio, D.A.; Cook-Patton, S.C.; Ellis, P.W.; Fargione, J.; Sanderman, J.; Smith, P.; Wood, S.; Zomer, R.J.; von Unger, M.; Emmer, I.M.; et al. The role of soil carbon in natural climate solutions. Nat. Sustain. 2020, 3, 391–398. [Google Scholar] [CrossRef]
  6. Yu, H.; Sui, Y.; Chen, Y.; Bao, T.; Jiao, X. Soil Organic Carbon Mineralization and Its Temperature Sensitivity under Different Substrate Levels in the Mollisols of Northeast China. Life 2022, 12, 712. [Google Scholar] [CrossRef] [PubMed]
  7. Forster, P.; Ramaswamy, V.; Artaxo, P.; Berntsen, T.; Betts, R.; Fahey, D.W.; Haywood, J.; Lean, J.; Lowe, D.C.; Myhre, G.; et al. Changes in Atmospheric Constituents and in Radiative Forcing. In Climate Change 2007: The Physical Science Basis. Contribution of Working Group I to the 4th Assessment Report of the Intergovernmental Panel on Climate Change; Solomon, S., Qin, D., Manning, M., Chen, Z., Marquis, M., Averyt, K.B., Tignor, M., Miller, H.L., Eds.; Cambridge University Press: Cambridge, UK; New York, NY, USA, 2007. [Google Scholar]
  8. Bridgham, S.D.; Cadillo-Quiroz, H.; Keller, J.K.; Zhuang, Q. Methane emissions from wetlands: Biogeochemical, microbial, and modeling perspectives from local to global scales. Glob. Change Biol. 2013, 19, 1325–1346. [Google Scholar] [CrossRef]
  9. Servais, S.; Kominoski, J.S.; Charles, S.P.; Gaiser, E.E.; Mazzei, V.; Troxler, T.G.; Wilson, B.J. Saltwater intrusion and soil carbon loss: Testing effects of salinity and phosphorus loading on microbial functions in experimental freshwater wetlands. Geoderma 2019, 337, 1291–1300. [Google Scholar] [CrossRef]
  10. Liáng, L.L.; Kirschbaum, M.U.F.; Arcus, V.L.; Schipper, L.A. The carbon-quality temperature hypothesis: Fact or artefact? Glob. Change Biol. 2023, 29, 935–942. [Google Scholar] [CrossRef] [PubMed]
  11. Fang, C.; Smith, P.; Moncrieff, J.B.; Smith, J.U. Similar response of labile and resistant soil organic matter pools to changes in temperature. Nature 2005, 433, 57–59. [Google Scholar] [CrossRef]
  12. Chen, H.; Zou, J.; Cui, J.; Nie, M.; Fang, C. Wetland drying increases the temperature sensitivity of soil respiration. Soil Biol. Biochem. 2018, 120, 24–27. [Google Scholar] [CrossRef]
  13. Reynolds, L.L.; Lajtha, K.; Bowden, R.D.; Johnson, B.R.; Bridgham, S.D. The carbon quality-temperature hypothesis does not consistently predict temperature sensitivity of soil organic matter mineralization in soils from two manipulative ecosystem experiments. Biogeochemistry 2017, 136, 249–260. [Google Scholar] [CrossRef]
  14. Chapman, S.K.; Hayes, M.A.; Kelly, B.; Langley, J.A. Exploring the oxygen sensitivity of wetland soil carbon mineralization. Biol. Lett. 2019, 15, 20180407. [Google Scholar] [CrossRef] [PubMed]
  15. Yang, X.; Meng, J.; Lan, Y.; Chen, W.; Yang, T.; Yuan, J.; Liu, S.; Han, J. Effects of maize stover and its biochar on soil CO2 emissions and labile organic carbon fractions in Northeast China. Agric. Ecosyst. Environ. 2017, 240, 24–31. [Google Scholar] [CrossRef]
  16. Liu, Q.; Wu, C.; Wei, L.; Wang, S.; Deng, Y.; Ling, W.; Xiang, W.; Kuzyakov, Y.; Zhu, Z.; Ge, T. Microbial mechanisms of organic matter mineralization induced by straw in biochar-amended paddy soil. Biochar 2024, 6, 1–13. [Google Scholar] [CrossRef]
  17. Morrissey, E.M.; Berrier, D.J.; Neubauer, S.C.; Franklin, R.B. Using microbial communities and extracellular enzymes to link soil organic matter characteristics to greenhouse gas production in a tidal freshwater wetland. Biogeochemistry 2014, 117, 473–490. [Google Scholar] [CrossRef]
  18. Soares, M.; Rousk, J. Microbial growth and carbon use efficiency in soil: Links to fungal-bacterial dominance, SOC-quality and stoichiometry. Soil Biol. Biochem. 2019, 131, 195–205. [Google Scholar] [CrossRef]
  19. Feng, S.; Huang, Y.; Ge, Y.; Su, Y.; Xu, X.; Wang, Y.; He, X. Variations in the patterns of soil organic carbon mineralization and microbial communities in response to exogenous application of rice straw and calcium carbonate. Sci. Total Environ. 2016, 571, 615–623. [Google Scholar] [CrossRef] [PubMed]
  20. Yang, C.; Lv, D.; Jiang, S.; Lin, H.; Sun, J.; Li, K.; Sun, J. Soil salinity regulation of soil microbial carbon metabolic function in the Yellow River Delta, China. Sci. Total Environ. 2021, 790, 148258. [Google Scholar] [CrossRef] [PubMed]
  21. Sinsabaugh, R.S. Enzymic analysis of microbial pattern and process. Biol. Fertil. Soils 1994, 17, 69–74. [Google Scholar] [CrossRef]
  22. Allison, S.D.; Wallenstein, M.D.; Bradford, M.A. Soil-carbon response to warming dependent on microbial physiology. Nat. Geosci. 2010, 3, 336–340. [Google Scholar] [CrossRef]
  23. Morrison, E.; Newman, S.; Bae, H.S.; He, Z.; Zhou, J.; Reddy, K.R.; Ogram, A. Microbial genetic and enzymatic responses to an anthropogenic phosphorus gradient within a subtropical peatland. Geoderma 2016, 268, 119–127. [Google Scholar] [CrossRef]
  24. Cui, J.; Zhang, S.; Wang, X.; Xu, X.; Ai, C.; Liang, G.; Zhu, P.; Zhou, W. Enzymatic stoichiometry reveals phosphorus limitation-induced changes in the soil bacterial communities and element cycling: Evidence from a long-term field experiment. Geoderma 2022, 426, 116124. [Google Scholar] [CrossRef]
  25. Ghorbani, M.; Amirahmadi, E.; Konvalina, P.; Moudry, J.; Kopecky, M.; Hoang, T.N. Carbon Pool Dynamic and Soil Microbial Respiration Affected by Land Use Alteration: A Case Study in Humid Subtropical Area. Land 2023, 12, 459. [Google Scholar] [CrossRef]
  26. Barto, E.K.; Alt, F.; Oelmann, Y.; Wilcke, W.; Rillig, M.C. Contributions of biotic and abiotic factors to soil aggregation across a land use gradient. Soil Biol. Biochem. 2010, 42, 2316–2324. [Google Scholar] [CrossRef]
  27. Liu, X.; Li, Q.; Tan, S.; Wu, X.; Song, X.; Gao, H.; Han, Z.; Jia, A.; Liang, G.; Li, S. Evaluation of carbon mineralization and its temperature sensitivity in different soil aggregates and moisture regimes: A 21-year tillage experiment. Sci. Total Environ. 2022, 837, 155566. [Google Scholar] [CrossRef] [PubMed]
  28. Mongil-Manso, J.; Navarro-Hevia, J.; San Martín, R. Impact of Land Use Change and Afforestation on Soil Properties in a Mediterranean Mountain Area of Central Spain. Land 2022, 11, 1043. [Google Scholar] [CrossRef]
  29. Kara, O.; Baykara, M. Changes in soil microbial biomass and aggregate stability under different land uses in the northeastern Turkey. Environ. Monit. Assess. 2014, 186, 3801–3808. [Google Scholar] [CrossRef]
  30. Krishna, M.P.; Mohan, M. Litter decomposition in forest ecosystems: A review. Energy Ecol. Environ. 2017, 2, 236–249. [Google Scholar] [CrossRef]
  31. Dube, F.; Zagal, E.; Stolpe, N.; Espinosa, M. The influence of land-use change on the organic carbon distribution and microbial respiration in a volcanic soil of the Chilean Patagonia. For. Ecol. Manag. 2009, 257, 1695–1704. [Google Scholar] [CrossRef]
  32. Peng, L.; Tang, C.; Zhang, X.; Duan, J.; Yang, L.; Liu, S. Quantifying the Effects of Root and Soil Properties on Soil Detachment Capacity in Agricultural Land Use of Southern China. Forests 2022, 13, 1788. [Google Scholar] [CrossRef]
  33. Yangjian, Z.; Juntao, Z.; Ruonan, S.; Li, W. Research progress on the effects of grazing on grassland ecosystem. Chin. J. Plant Ecol. 2020, 44, 553–564. [Google Scholar]
  34. Wang, B.; Liu, J.; Li, Z.; Morreale, S.J.; Schneider, R.L.; Xu, D.; Lin, X. The contributions of root morphological characteristics and soil property to soil infiltration in a reseeded desert steppe. Catena 2023, 225, 107020. [Google Scholar] [CrossRef]
  35. Neubauer, S.C.; Franklin, R.B.; Berrier, D.J. Saltwater intrusion into tidal freshwater marshes alters the biogeochemical processing of organic carbon. Biogeosciences 2013, 10, 8171–8183. [Google Scholar] [CrossRef]
  36. Rath, K.M.; Rousk, J. Salt effects on the soil microbial decomposer community and their role in organic carbon cycling: A review. Soil Biol. Biochem. 2015, 81, 108–123. [Google Scholar] [CrossRef]
  37. Kempf, B.; Bremer, E. Uptake and synthesis of compatible solutes as microbial stress responses to high-osmolality environments. Arch. Microbiol. 1998, 170, 319–330. [Google Scholar] [CrossRef]
  38. Plaza-Bonilla, D.; Mary, B.; Valé, M.; Justes, E. The sensitivity of C and N mineralization to soil water potential varies with soil characteristics: Experimental evidences to fine-tune models. Geoderma 2022, 409, 115644. [Google Scholar] [CrossRef]
  39. Xu, C.; Ruan, H.; Wu, X.; Xie, Y.; Yang, Y. Progress in drought stress on the accumulation and turnover of soil organic carbon in forests. J. Nanjing For. Univ. (Nat. Sci. Ed.) 2022, 46, 195–206. [Google Scholar]
  40. Yang, J.; Zhan, C.; Li, Y.; Zhou, D.; Yu, Y.; Yu, J. Effect of salinity on soil respiration in relation to dissolved organic carbon and microbial characteristics of a wetland in the Liaohe River estuary, Northeast China. Sci. Total Environ. 2018, 642, 946–953. [Google Scholar] [CrossRef] [PubMed]
  41. Kittredge, H.A.; Cannone, T.; Funk, J.; Chapman, S.K. Soil respiration and extracellular enzyme production respond differently across seasons to elevated temperatures. Plant Soil 2018, 425, 351–361. [Google Scholar] [CrossRef]
  42. Zhang, G.; Bai, J.; Jia, J.; Wang, W.; Wang, D.; Zhao, Q.; Wang, C.; Chen, G. Soil microbial communities regulate the threshold effect of salinity stress on SOM decomposition in coastal salt marshes. Fundam. Res. 2023, 3, 868–879. [Google Scholar] [CrossRef]
  43. Ding, J.; Chen, L.; Zhang, B.; Liu, L.; Yang, G.; Fang, K.; Chen, Y.; Li, F.; Kou, D.; Ji, C.; et al. Linking temperature sensitivity of soil CO2 release to substrate, environmental, and microbial properties across alpine ecosystems: Microbial Decomposition in Alpine Soils. Glob. Biogeochem. Cycles 2016, 30, 1310–1323. [Google Scholar] [CrossRef]
  44. Chandrajith, R.; Chaturangani, D.; Abeykoon, S.; Barth, J.A.C.; Van Geldern, R.; Edirisinghe, E.A.N.V.; Dissanayake, C.B. Quantification of groundwater–seawater interaction in a coastal sandy aquifer system: A study from Panama, Sri Lanka. Environ. Earth Sci. 2013, 72, 867–877. [Google Scholar] [CrossRef]
  45. Wilmoth, J.L.; Schaefer, J.K.; Schlesinger, D.R.; Roth, S.W.; Hatcher, P.G.; Shoemaker, J.K.; Zhang, X. The role of oxygen in stimulating methane production in wetlands. Glob. Chang. Biol. 2021, 27, 5831–5847. [Google Scholar] [CrossRef] [PubMed]
  46. Jones, D.; Willett, V. Experimental evaluation of methods to quantify dissolved organic nitrogen (DON) and dissolved organic carbon (DOC) in soil. Soil Biol. Biochem. 2006, 38, 991–999. [Google Scholar] [CrossRef]
  47. WU, J.; Joergensen, R.G.; Chaussod, R.; Brookes, P.C. Measurement of soil microbial biomass C by fumigation-extraction—An automated procedure. Soil Biol. Biochem. 1990, 22, 1167–1169. [Google Scholar] [CrossRef]
  48. Joergensen, R.G.; Mueller, T. The fumigation-extraction method to estimate soil microbial biomass: Calibration of the kEN value. Soil Biol. Biochem. 1996, 28, 33–37. [Google Scholar] [CrossRef]
  49. German, D.P.; Weintraub, M.N.; Grandy, A.S.; Lauber, C.L.; Rinkes, Z.L.; Allison, S.D. Optimization of hydrolytic and oxidative enzyme methods for ecosystem studies. Soil Biol. Biochem. 2011, 43, 1387–1397. [Google Scholar] [CrossRef]
  50. Allison, S.D.; Chacon, S.S.; German, D.P. Substrate concentration constraints on microbial decomposition. Soil Biol. Biochem. 2014, 79, 43–49. [Google Scholar] [CrossRef]
  51. Ai, C.; Liang, G.; Sun, J.; Wang, X.; Zhou, W. Responses of extracellular enzyme activities and microbial community in both the rhizosphere and bulk soil to long-term fertilization practices in a fluvo-aquic soil. Geoderma 2012, 173–174, 330–338. [Google Scholar] [CrossRef]
  52. Yu, J.; Miao, S.; Qiao, Y.; Li, T.; Wang, X.; Zhao, Y. Effects of straw addition on organic carbon mineralization in different types of soils. J. Agro-Environ. Sci. 2024, 1–12. Available online: https://kns.cnki.net/kcms2/article/abstract?v=9CXCstbk-tsjb7FiwltxYDVFxafFzMaWBWenZO15U1RfeA2XEpSkhyL5smzbGbSwamEvEJsHarDbeiSveNVwIBOU_yhy-NYAN6sYLB0vr3ptmZmR7-mQWQ==&uniplatform=NZKPT&language=gb (accessed on 26 February 2024).
  53. Wang, S.; Tang, J.; Li, Z.; Liu, Y.; Zhou, Z.; Wang, J.; Qu, Y.; Dai, Z. Carbon Mineralization under Different Saline—Alkali Stress Conditions in Paddy Fields of Northeast China. Sustainability 2020, 12, 2921. [Google Scholar] [CrossRef]
  54. Anderson, T.H.; Domsch, K.H. The metabolic quotient for CO2 (qCO2) as a specific activity parameter to assess the effects of environmental conditions, such as ph, on the microbial biomass of forest soils. Soil Biol. Biochem. 1993, 25, 393–395. [Google Scholar] [CrossRef]
  55. Tapia-Torres, Y.; Elser, J.J.; Souza, V.; García-Oliva, F. Ecoenzymatic stoichiometry at the extremes: How microbes cope in an ultra-oligotrophic desert soil. Soil Biol. Biochem. 2015, 87, 34–42. [Google Scholar] [CrossRef]
  56. Moorhead, D.L.; Sinsabaugh, R.L.; Hill, B.H.; Weintraub, M.N. Vector analysis of ecoenzyme activities reveal constraints on coupled C, N and P dynamics. Soil Biol. Biochem. 2016, 93, 1–7. [Google Scholar] [CrossRef]
  57. Li, Q.; Song, Z.; Xia, S.; Guo, L.; Singh, B.P.; Shi, Y.; Wang, W.; Luo, Y.; Li, Y.; Chen, J.; et al. Substrate quality overrides soil salinity in mediating microbial respiration in coastal wetlands. Land Degrad. Dev. 2023, 34, 4546–4560. [Google Scholar] [CrossRef]
  58. Cui, Y.; Moorhead, D.L.; Wang, X.; Xu, M.; Wang, X.; Wei, X.; Zhu, Z.; Ge, T.; Peng, S.; Zhu, B.; et al. Decreasing microbial phosphorus limitation increases soil carbon release. Geoderma 2022, 419, 115868. [Google Scholar] [CrossRef]
  59. Moreno-de las Heras, M. Development of soil physical structure and biological functionality in mining spoils affected by soil erosion in a Mediterranean-Continental environment. Geoderma 2009, 149, 249–256. [Google Scholar] [CrossRef]
  60. Liu, Y. Effects of Salt on the Temperature Sensitivity of Soil Organic Carbon to Anaerobic Mineralization in Wetland of the Yellow River Estuary. Master’s Thesis, Ludong University, Yantai, China, 2021. [Google Scholar]
  61. Yang, S. Temperature Sensitivity of Soil Organic Carbon Mineralization in Temperate Forests in Northeast China. Ph.D. Dissertation, Shenyang Agricultural University, Shenyang, China, 2019. [Google Scholar]
  62. Yan, N.; Marschner, P. Response of microbial activity and biomass to increasing salinity depends on the final salinity, not the original salinity. Soil Biol. Biochem. 2012, 53, 50–55. [Google Scholar] [CrossRef]
  63. Rath, K.M.; Fierer, N.; Murphy, D.V.; Rousk, J. Linking bacterial community composition to soil salinity along environmental gradients. ISME J. 2019, 13, 836–846. [Google Scholar] [CrossRef]
  64. Mooshammer, M.; Wanek, W.; Zechmeister-Boltenstern, S.; Richter, A. Stoichiometric imbalances between terrestrial decomposer communities and their resources: Mechanisms and implications of microbial adaptations to their resources. Front. Microbiol. 2014, 5, 22. [Google Scholar] [CrossRef] [PubMed]
  65. Sawada, K.; Funakawa, S.; Kosaki, T. Different effects of pH on microbial biomass carbon and metabolic quotients by fumigation–extraction and substrate-induced respiration methods in soils under different climatic conditions. Soil Sci. Plant Nutr. 2009, 55, 363–374. [Google Scholar] [CrossRef]
  66. Yang, Y.; Moorhead, D.L.; Craig, H.; Luo, M.; Chen, X.; Huang, J.; Olesen, J.E.; Chen, J. Differential Responses of Soil Extracellular Enzyme Activities to Salinization: Implications for Soil Carbon Cycling in Tidal Wetlands. Glob. Biogeochem. Cycles 2022, 36, e2021GB007285. [Google Scholar] [CrossRef]
  67. Mueller, P.; Granse, D.; Nolte, S.; Weingartner, M.; Hoth, S.; Jensen, K. Unrecognized controls on microbial functioning in Blue Carbon ecosystems: The role of mineral enzyme stabilization and allochthonous substrate supply. Ecol. Evol. 2020, 10, 998–1011. [Google Scholar] [CrossRef] [PubMed]
  68. Tziperman, E.; Gildor, H. On the mid-Pleistocene transition to 100-kyr glacial cycles and the asymmetry between glaciation and deglaciation times. Paleoceanography 2003, 18, 1-1–1-8. [Google Scholar] [CrossRef]
Figure 1. Mineralization rates for three land-use types under (a) 0‰, (b) 3‰, (c) 6‰ and (d) 32‰ salinity treatments. Values are means ± standard error (n = 3). W0, W3, W6, and W32 represent 0‰, 3‰, 6‰, and 32‰ salinity additions to wetlands, respectively. F0, F3, F6, and F32 represent 0‰, 3‰, 6‰, and 32‰ salinity additions to forests, respectively. A0, A3, A6, and A32 represent 0‰, 3‰, 6‰, and 32‰ salinity additions to agroforestry, respectively.
Sustainability 16 03285 g001
Figure 2. Fitting of first-order kinetic equation for cumulative soil mineralization at (a) 0‰, (b) 3‰, (c) 6‰ and (d) 32‰ salinity treatments. Values are means ± standard error (n = 3). W0, W3, W6, and W32 represent 0‰, 3‰, 6‰, and 32‰ salinity additions to wetlands, respectively. F0, F3, F6, and F32 represent 0‰, 3‰, 6‰, and 32‰ salinity additions to forests, respectively. A0, A3, A6, and A32 represent 0‰, 3‰, 6‰, and 32‰ salinity additions to agroforestry, respectively.
Sustainability 16 03285 g002
Figure 3. Characterization of dynamic changes in activities of extracellular enzymes: (a) soil alkaline phosphatase (ALP), (b) peroxidase (POD), (c) β-glucosidase (βG), and (d) polyphenol oxidase (PPO) during the incubation period. Values are means ± standard error (n = 3). W, F, and A represent wetland, forest, and agroforestry, respectively. S0, S3, S6, and S32 represent the four salinity treatments of 0‰, 3‰, 6‰, and 32‰, respectively. Different lowercase letters indicate significant differences between treatments, and different uppercase letters indicate significant differences between incubation times (both p < 0.05).
Sustainability 16 03285 g003
Figure 4. Changes in (a) MBC, (b) MBN, (c) MBC/MBN, and (d) qCO2 during incubation. Values are means ± standard error (n = 3). W, F, and A represent wetland, forest, and agroforestry, respectively. S0, S3, S6, and S32 represent the four salinity treatments of 0‰, 3‰, 6‰, and 32‰, respectively.
Sustainability 16 03285 g004
Figure 5. (a) Vector length and (b) vector angle under different land-use types and different salinity treatments. W, F, and A represent wetland, forest, and agroforestry, respectively. S0, S3, S6, and S32 represent the four salinity treatments, 0‰, 3‰, 6‰, and 32‰, respectively. Different lowercase letters indicate significant differences between different salinity treatments under the same land type, and different uppercase letters indicate significant differences between different land-use types under the same salinity treatment (both p < 0.05).
Sustainability 16 03285 g005
Figure 6. Correlation analysis of various indicators during incubation. ALP, alkaline phosphatase; PPO, polyphenol oxidase; POD, peroxidase; βG, β-glucosidase; CO2, rate of CO2 release; DOC, dissolved organic carbon; MBC, microbial biomass carbon; MBN, microbial biomass nitrogen; EC, electrical conductivity; ROC, readily oxidized organic carbon; SOC, soil organic carbon; TN, total nitrogen; TC, total carbon; qCO2, microbial respiratory quotient. *, **, *** indicate significant correlation at p < 0.05, p < 0.01, p < 0.001, respectively.
Sustainability 16 03285 g006
Figure 7. Structural equation modeling reveals the major pathways of soil CO2 release rates in the (a) pre-incubation stage (day 20) and (b) post-incubation stage (day 125). PPO, polyphenol oxidase; βG, β-glucosidase; CO2, CO2 release rate; DOC, dissolved organic carbon; MBC, microbial biomass carbon; MBN, microbial biomass nitrogen; qCO2, microbial respiratory quotient. Thicker arrows in the figure indicate larger impacts, and thinner arrows indicate smaller impacts. Numbers on the arrows are standardized pathway coefficients. *, **, and *** indicate the significance of unstandardized coefficients at p < 0.05, p < 0.01, and p < 0.001, respectively.
Sustainability 16 03285 g007
Table 1. Basic physical and chemical properties of soil.
ParametersWFA
EC (μS cm−1)2133 ± 287.24 a117.72 ± 25.39 b116.23 ± 2.53 b
pH9.21 ± 0.12 a8.74 ± 0.03 b8.62 ± 0.03 b
ROC (mg kg−1)1.75 ± 0.24 a1.89 ± 0.18 a1.41 ± 0.32 a
SOC (g kg−1)6.0 ± 0.5 a5.0 ± 1.3 a4.4 ± 0.2 a
TN (g kg−1)0.36 ± 0.1 a0.34 ± 0.1 a0.41 ± 0.01 a
C/N17.22 ± 1.25 a15.6 ± 1.39 a10.83 ± 0.71 b
TC (g kg−1)17.7 ± 0.7 a16.3 ± 1.4 a16.3 ± 0.2 a
Salinity (‰)5.57 ± 0.7 a0.6 ± 0.26 b0.3 ± 0.06 b
DOC (mg kg−1)129.12 ± 1.55 a105.36 ± 5.68 ab118.12 ± 4.81 b
SWC (%)20.32 ± 0.12 c24.1 ± 0.54 a22.56 ± 0.13 b
BD (g cm−3)1.54 ± 0.06 a1.36 ± 0.01 b1.51 ± 0.01 a
W, F, and A indicate wetland, forest, and agroforestry, respectively. EC, electrical conductivity; ROC, readily oxidized carbon; SOC, soil organic carbon; TN, total nitrogen; TC, total carbon; DOC, dissolved organic carbon; SWC, soil water content; BD, bulk density. Different lowercase letters indicate significant differences between different land-use types (p < 0.05). Values are means ± standard error (n = 3).
Table 2. Results of the first-order kinetic model fit for cumulative C mineralization.
SiteSampleC0kR2
WW06.21171 ± 2.066640.00741 ± 0.003480.96105
W34.77821 ± 1.744860.00845 ± 0.004550.93871
W68.77711 ± 6.817970.00490 ± 0.002810.92998
W326.01388 ± 3.132040.00738 ± 0.005420.91233
FF08.28744 ± 1.322450.00972 ± 0.001990.98852
F37.82512 ± 2.148330.00878 ± 0.003010.98874
F66.10313 ± 1.242280.01142 ± 0.00330.99130
F325.33381 ± 2.655490.00905 ± 0.005440.97176
AA03.78004 ± 0.496810.03226 ± 0.007010.97868
A37.79639 ± 5.955860.00478 ± 0.004220.95960
A64.18488 ± 0.586640.01433 ± 0.003070.99102
A322.81944 ± 0.219860.02734 ± 0.005310.99174
C0 and k are the fitting parameters. R2 is coefficient of determination. W0, W3, W6, and W32 represent 0‰, 3‰, 6‰, and 32‰ salinity additions to wetlands, respectively. F0, F3, F6, and F32 represent 0‰, 3‰, 6‰, and 32‰ salinity additions to forests, respectively. A0, A3, A6, and A32 represent 0‰, 3‰, 6‰, and 32‰ salinity additions to agroforestry, respectively.
Table 3. Stepwise multiple linear regression between the CO2 release rate and pH, microbial biomass nitrogen (MBN), microbial biomass carbon (MBC), total carbon (TC), readily oxidizable carbon (ROC), salinity, alkaline phosphatase (ALP), and β-glucosidase (βG).
BBetatpVIFFR2
Site W(constant)244.09 1.8450.092 19.647 ***0.877
pH−49.438−0.476−3.8060.0031.404
MBN3.2320.7655.37<0.0011.818
MBC−0.2550.67−3.5780.0043.144
TC150.3940.3782.330.042.356
Site F(constant)48.487 12.307<0.001 19.522 ***0.75
ROC−3.173−0.843−6.03<0.0011.016
salinity−2.02−0.333−2.3810.0331.016
Site A(constant)6.191 0.5130.616
ALP38.8460.7784.771<0.0011.11914.534 ***0.691
βG−0.586−0.641−3.9290.0021.119
*** significant difference at p < 0.001.
Disclaimer/Publisher’s Note: The statements, opinions and data contained in all publications are solely those of the individual author(s) and contributor(s) and not of MDPI and/or the editor(s). MDPI and/or the editor(s) disclaim responsibility for any injury to people or property resulting from any ideas, methods, instructions or products referred to in the content.

