
Identifying the Optimal Valuation Model for Maritime Data Assets with the Analytic Hierarchy Process (AHP)


Abstract
:1. Introduction
1.1. Background
1.2. Aim of the Study
2. Literature Review
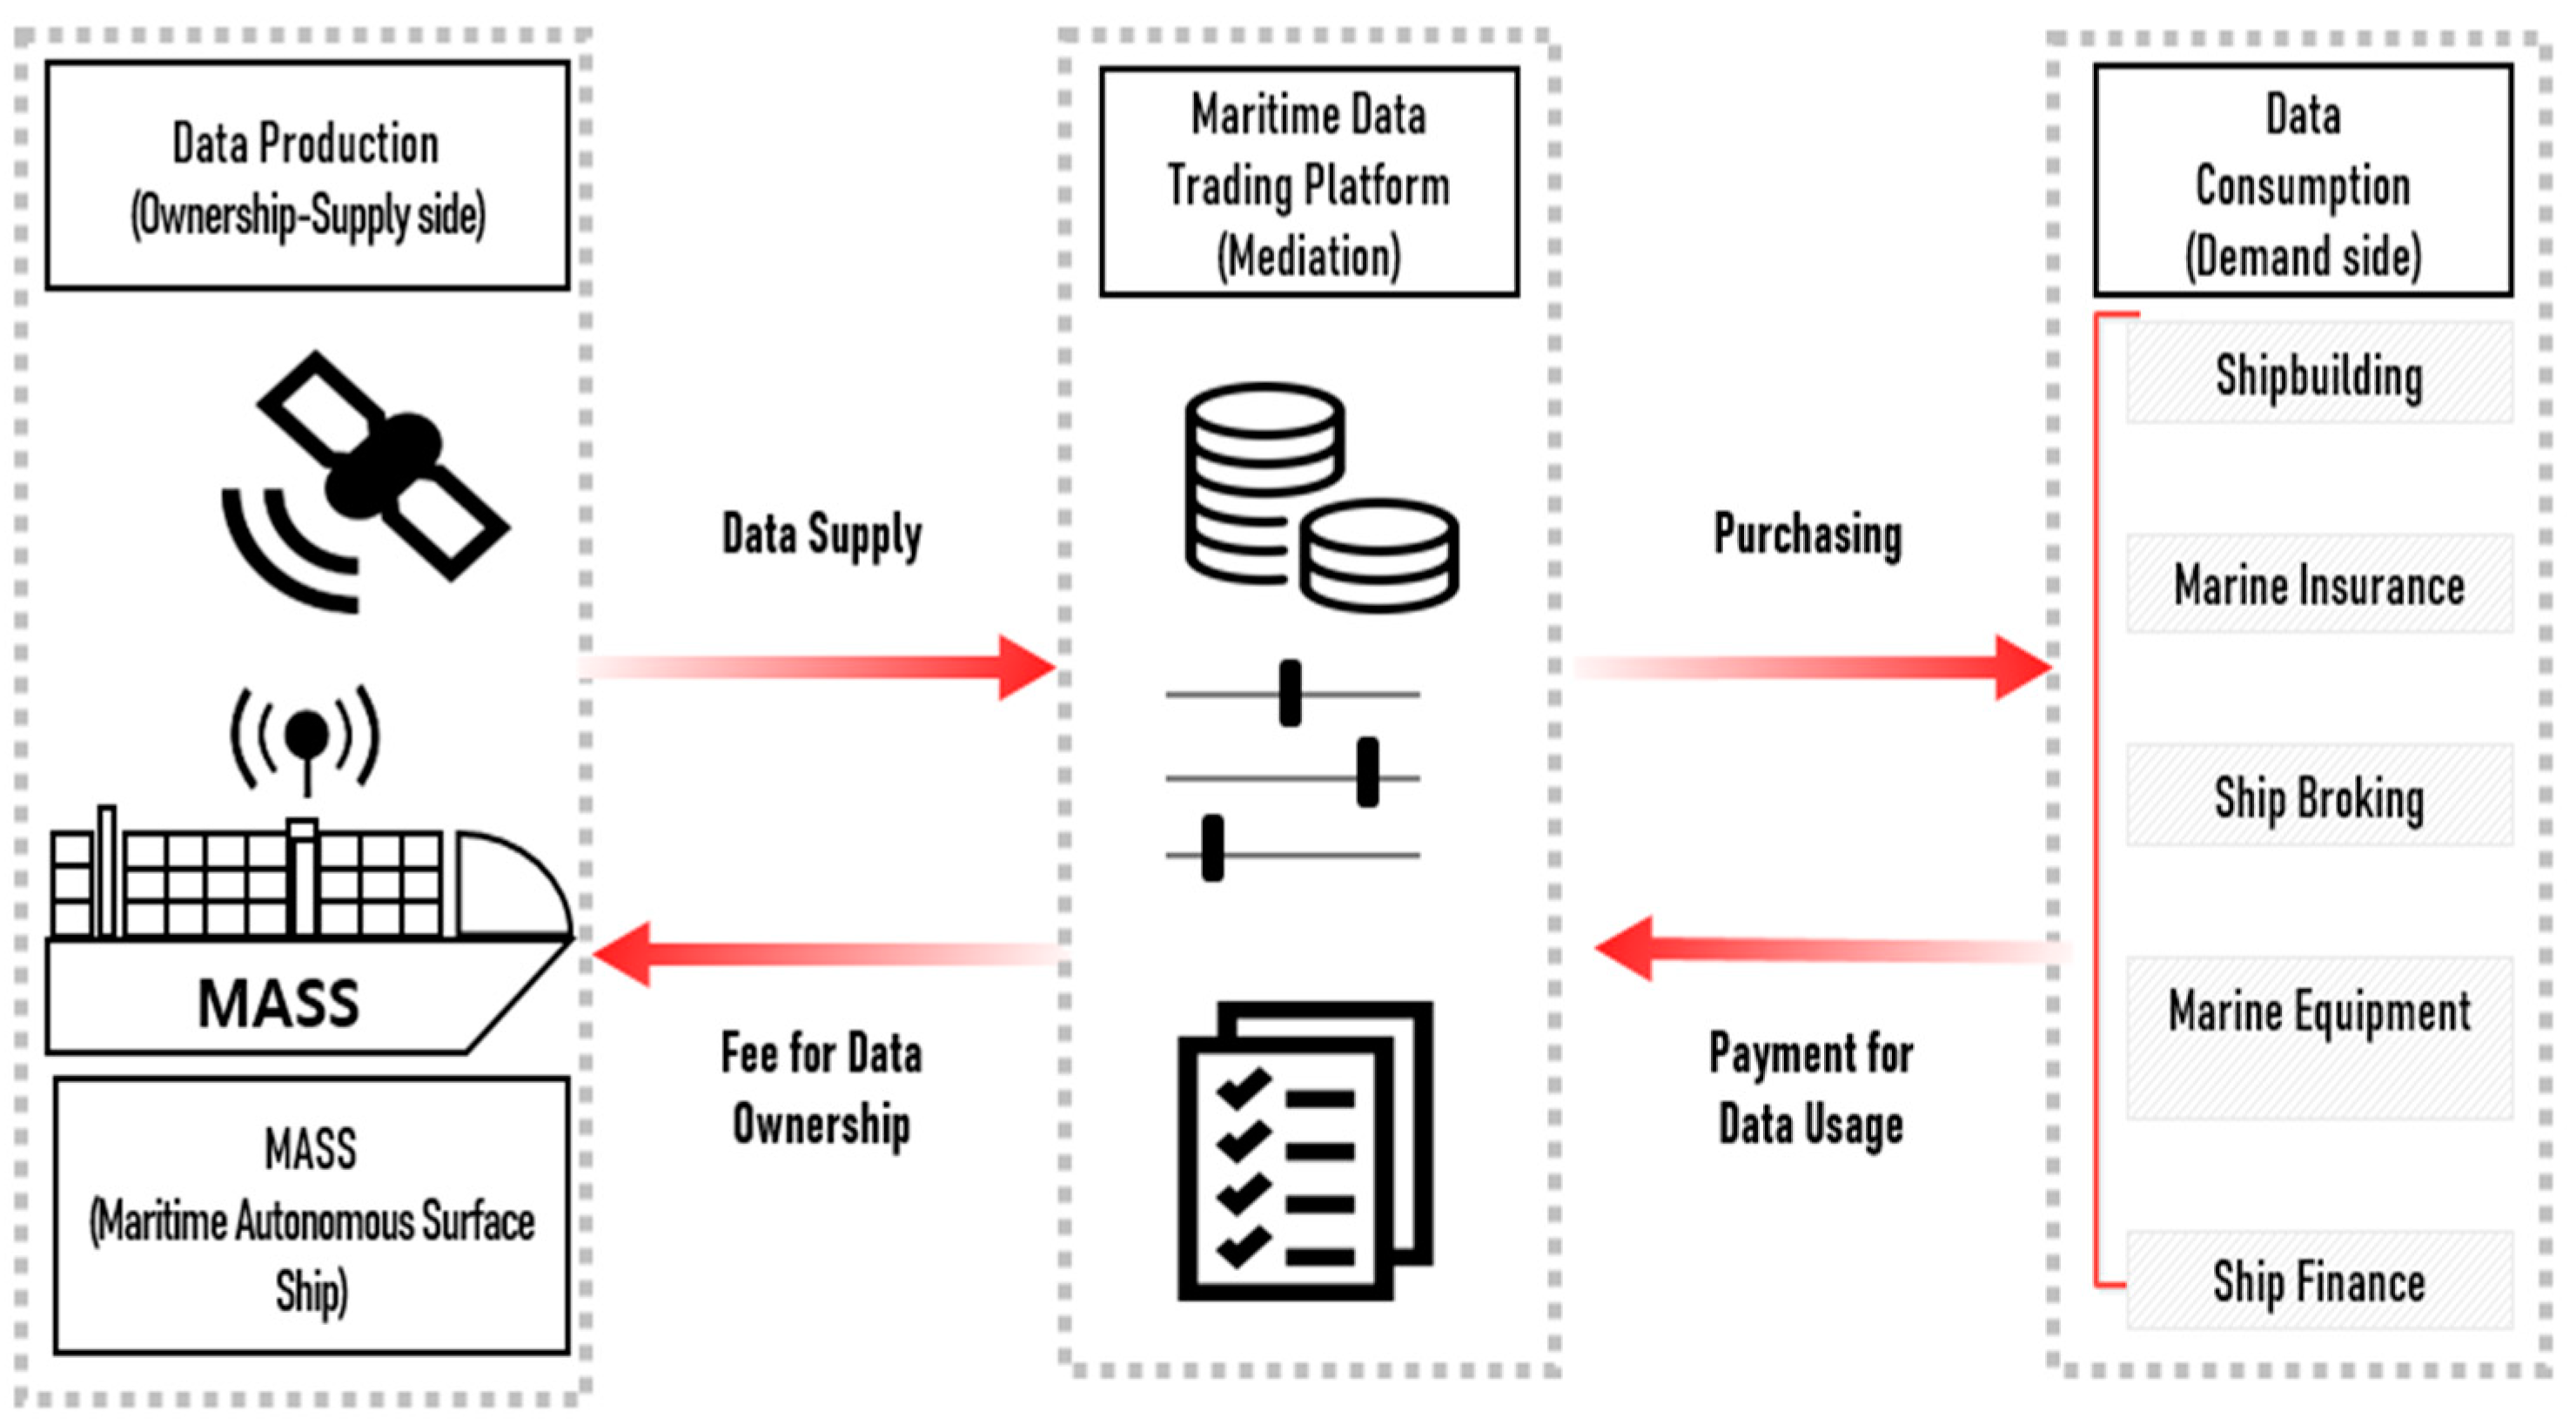
2.1. Definition of Maritime Data
2.2. Literature Review
2.3. Data Valuation Model
2.4. Factors for Maritime Data Valuation
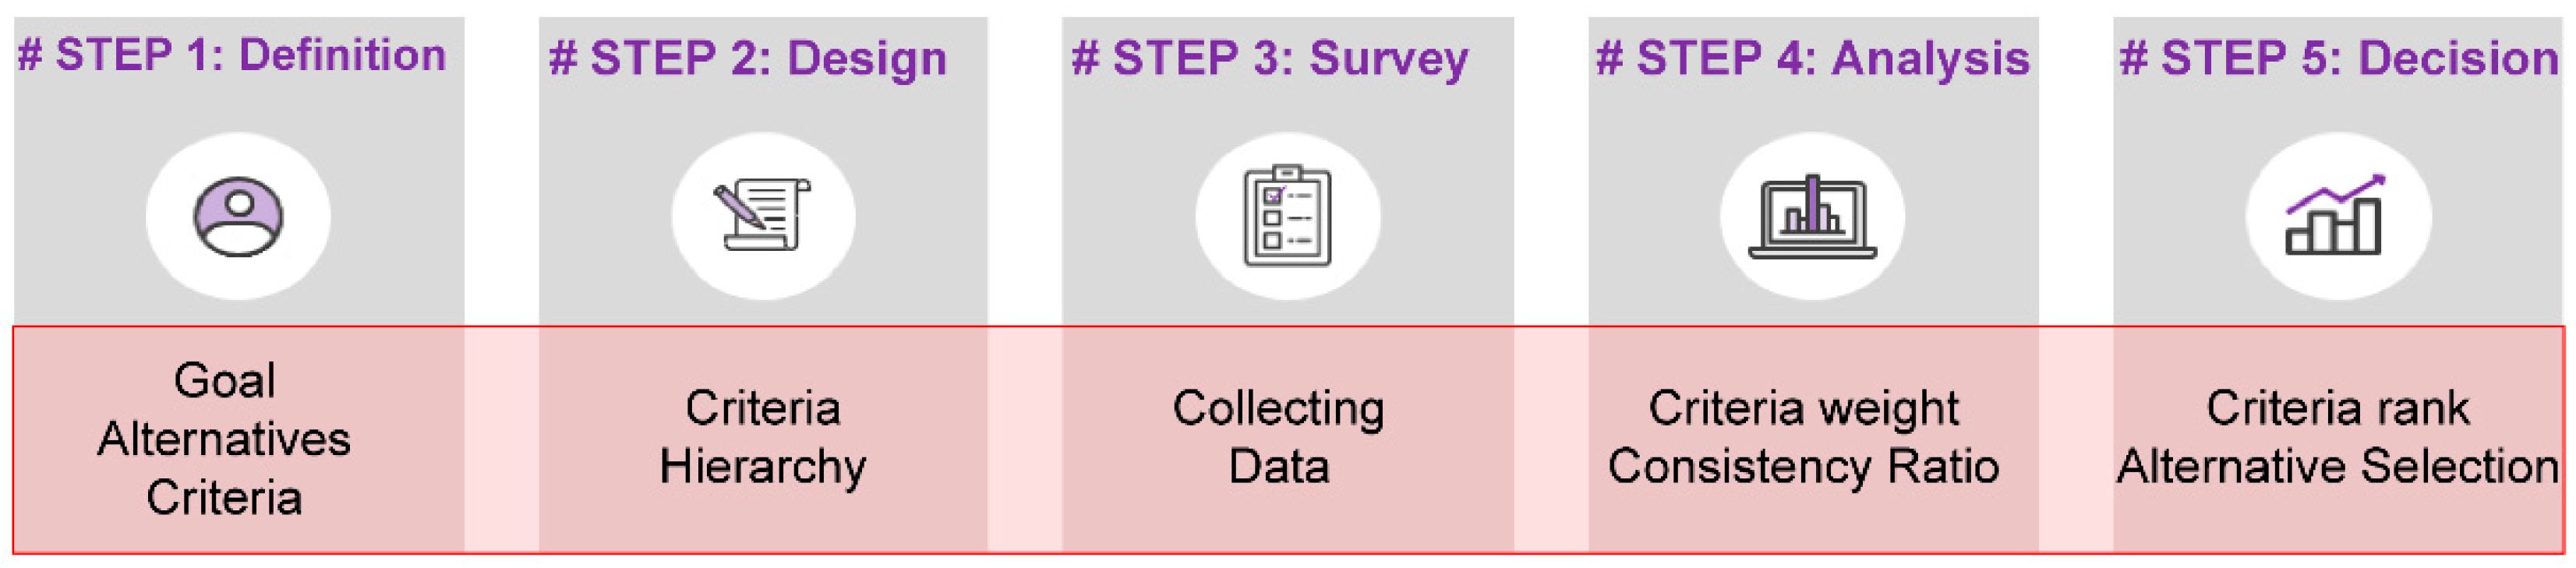
3. Theory and Method
3.1. Theory
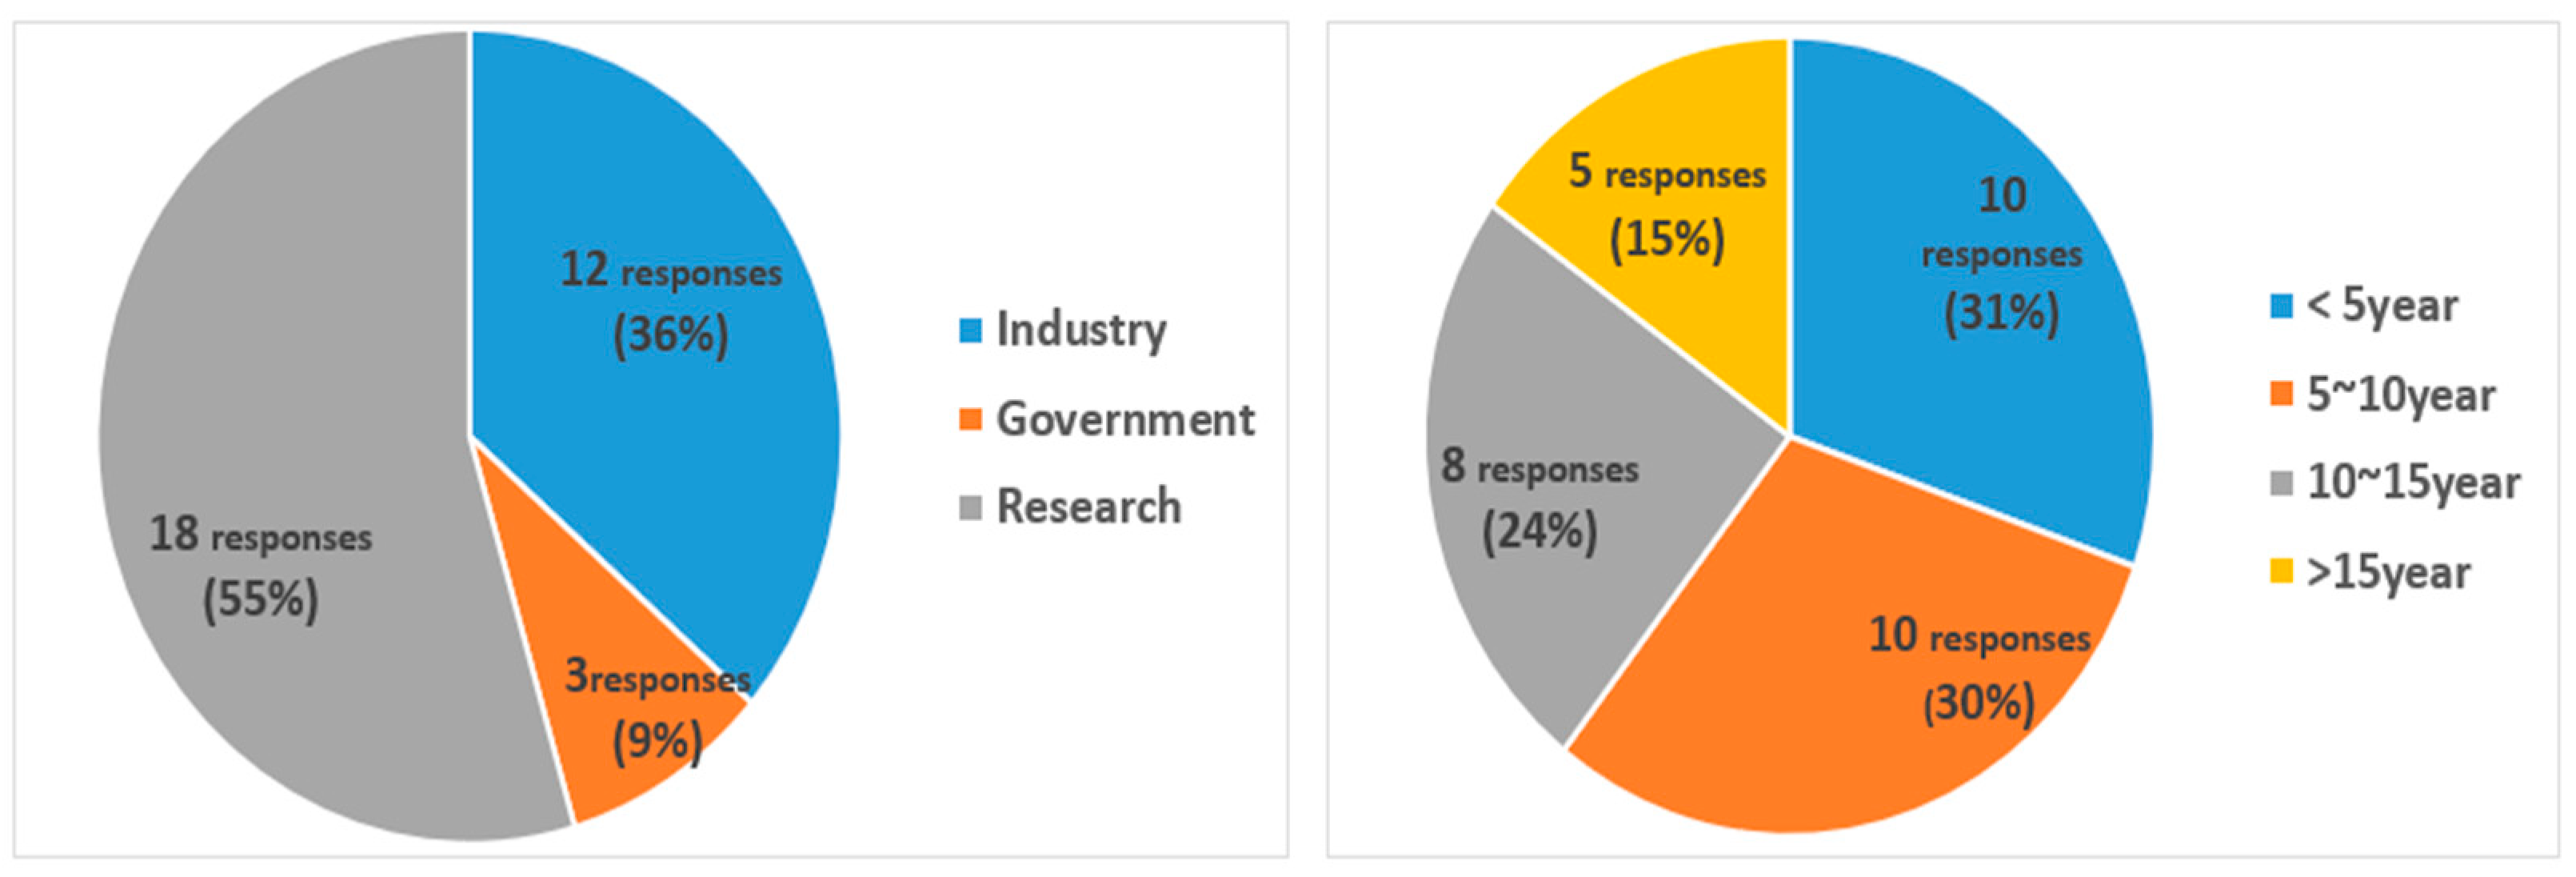
3.2. Data Collection and Method
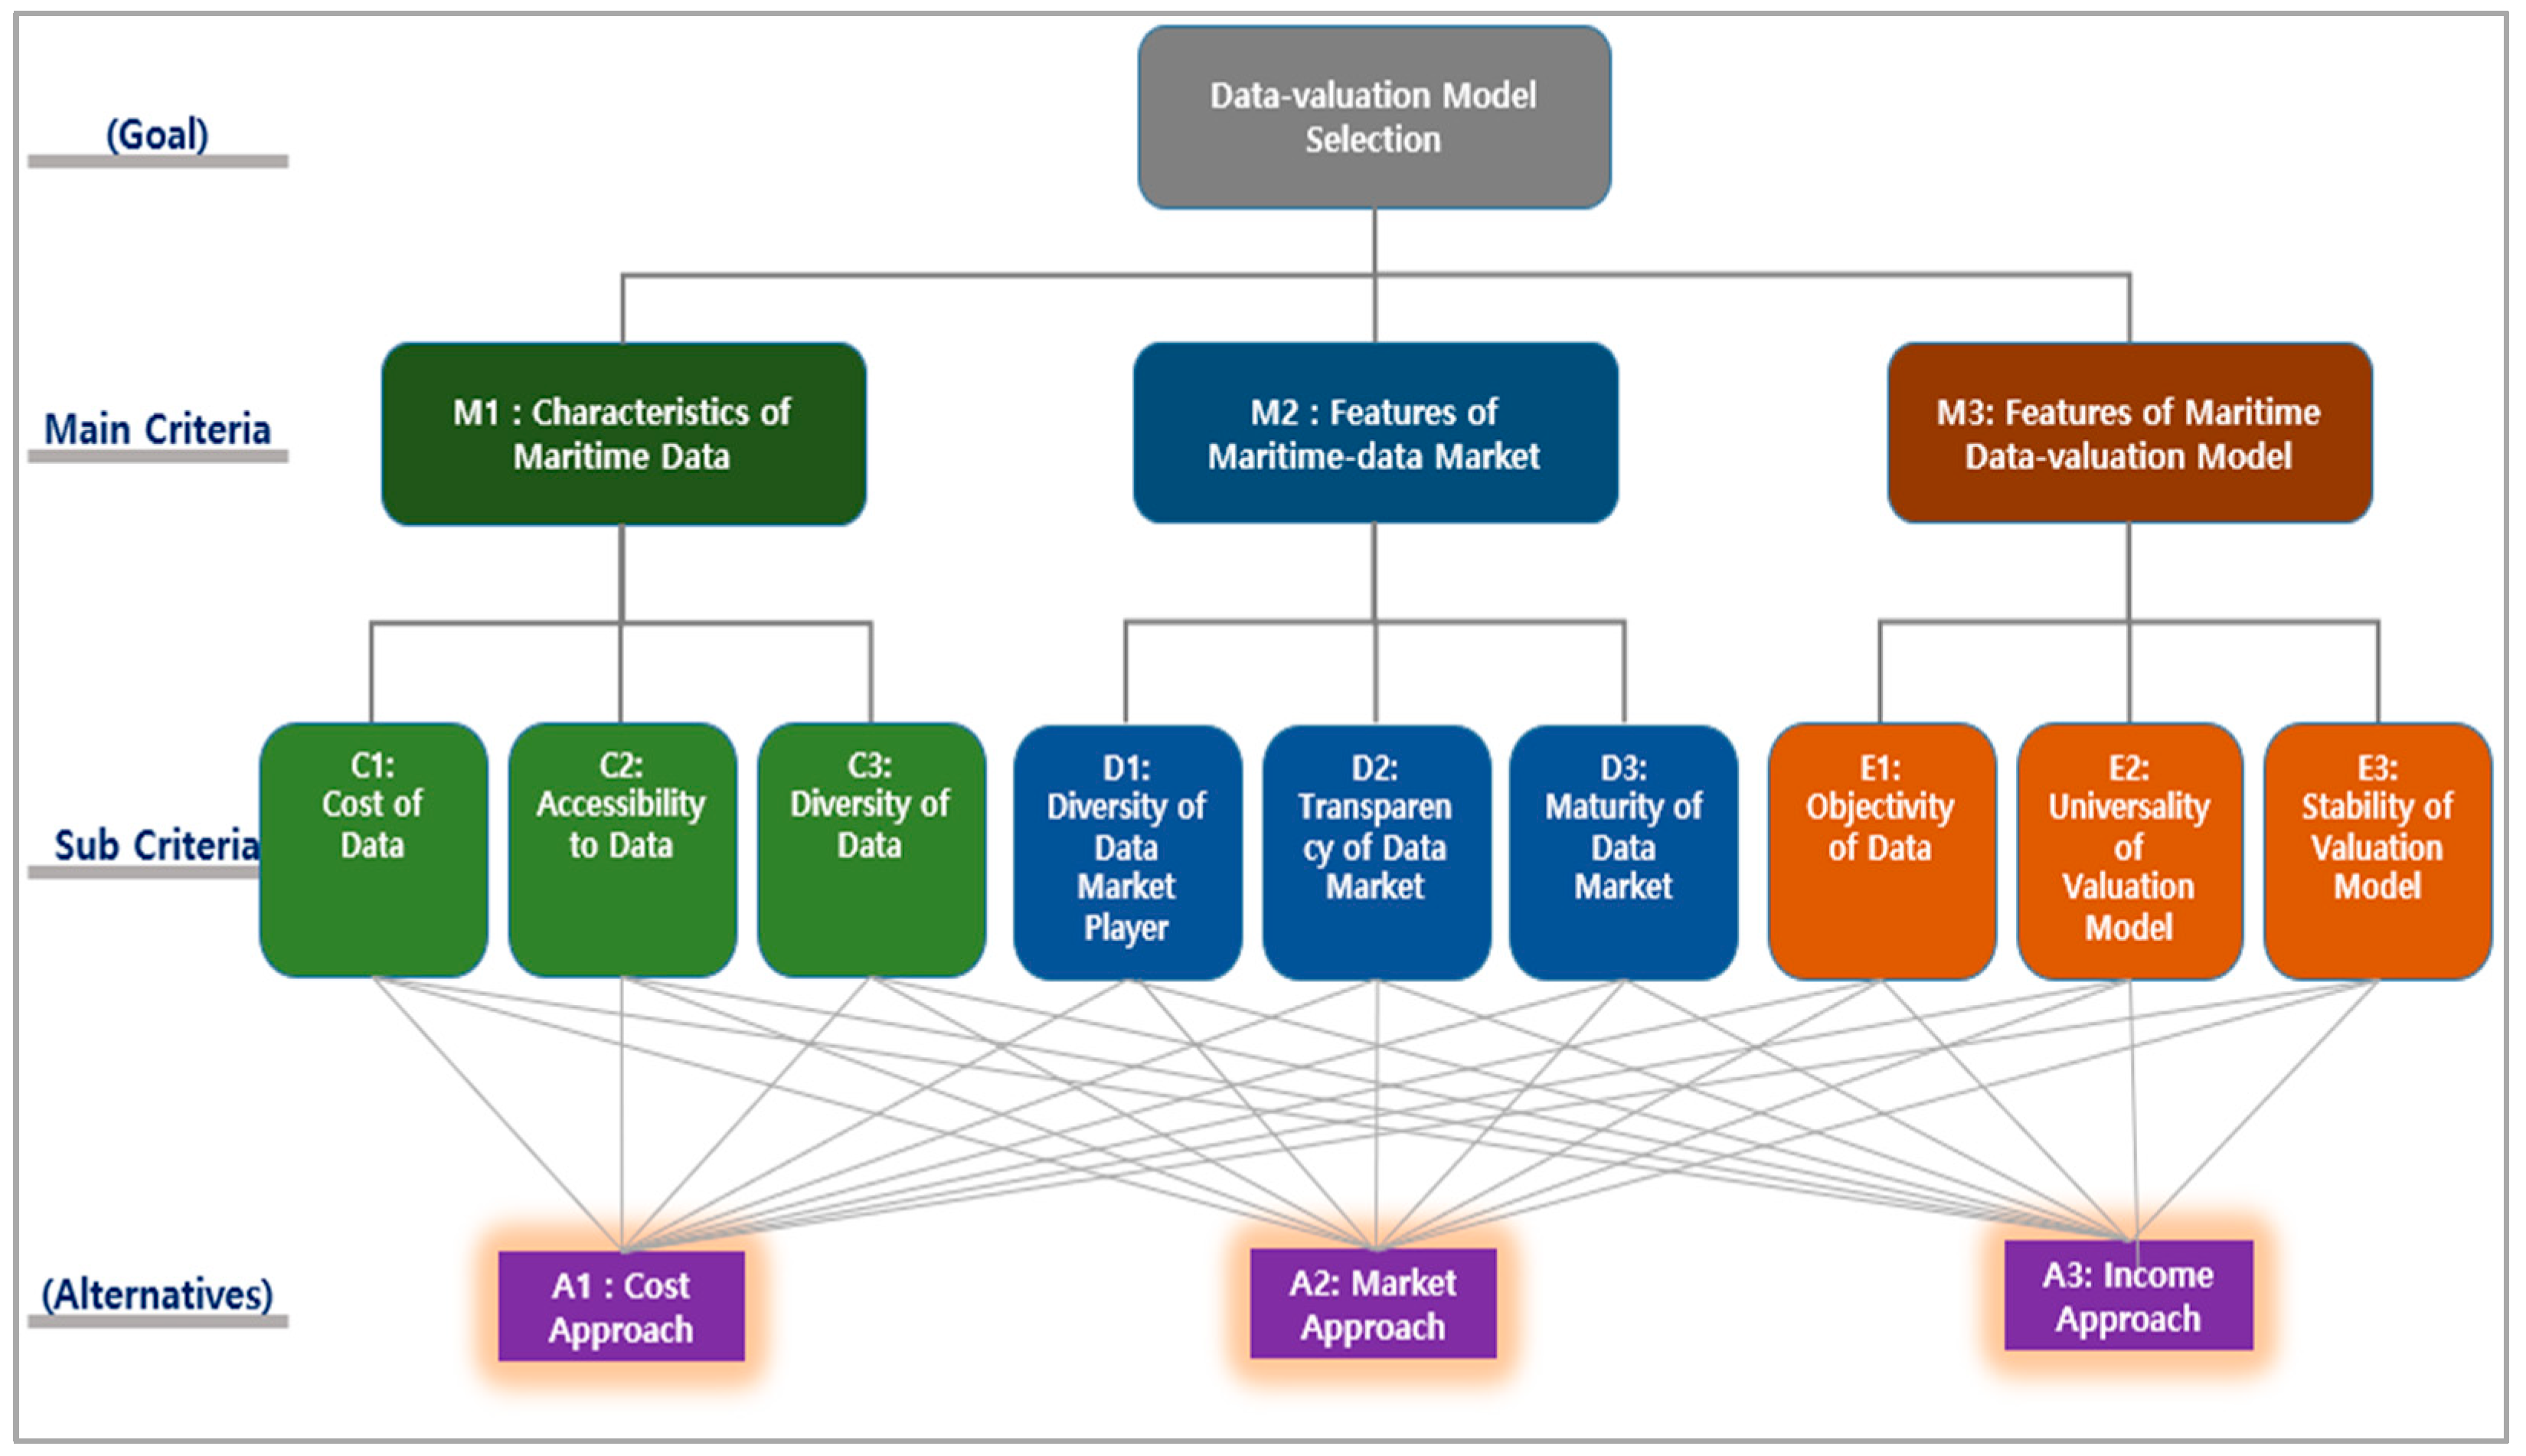
3.3. AHP Research Model
4. Empirical Analysis
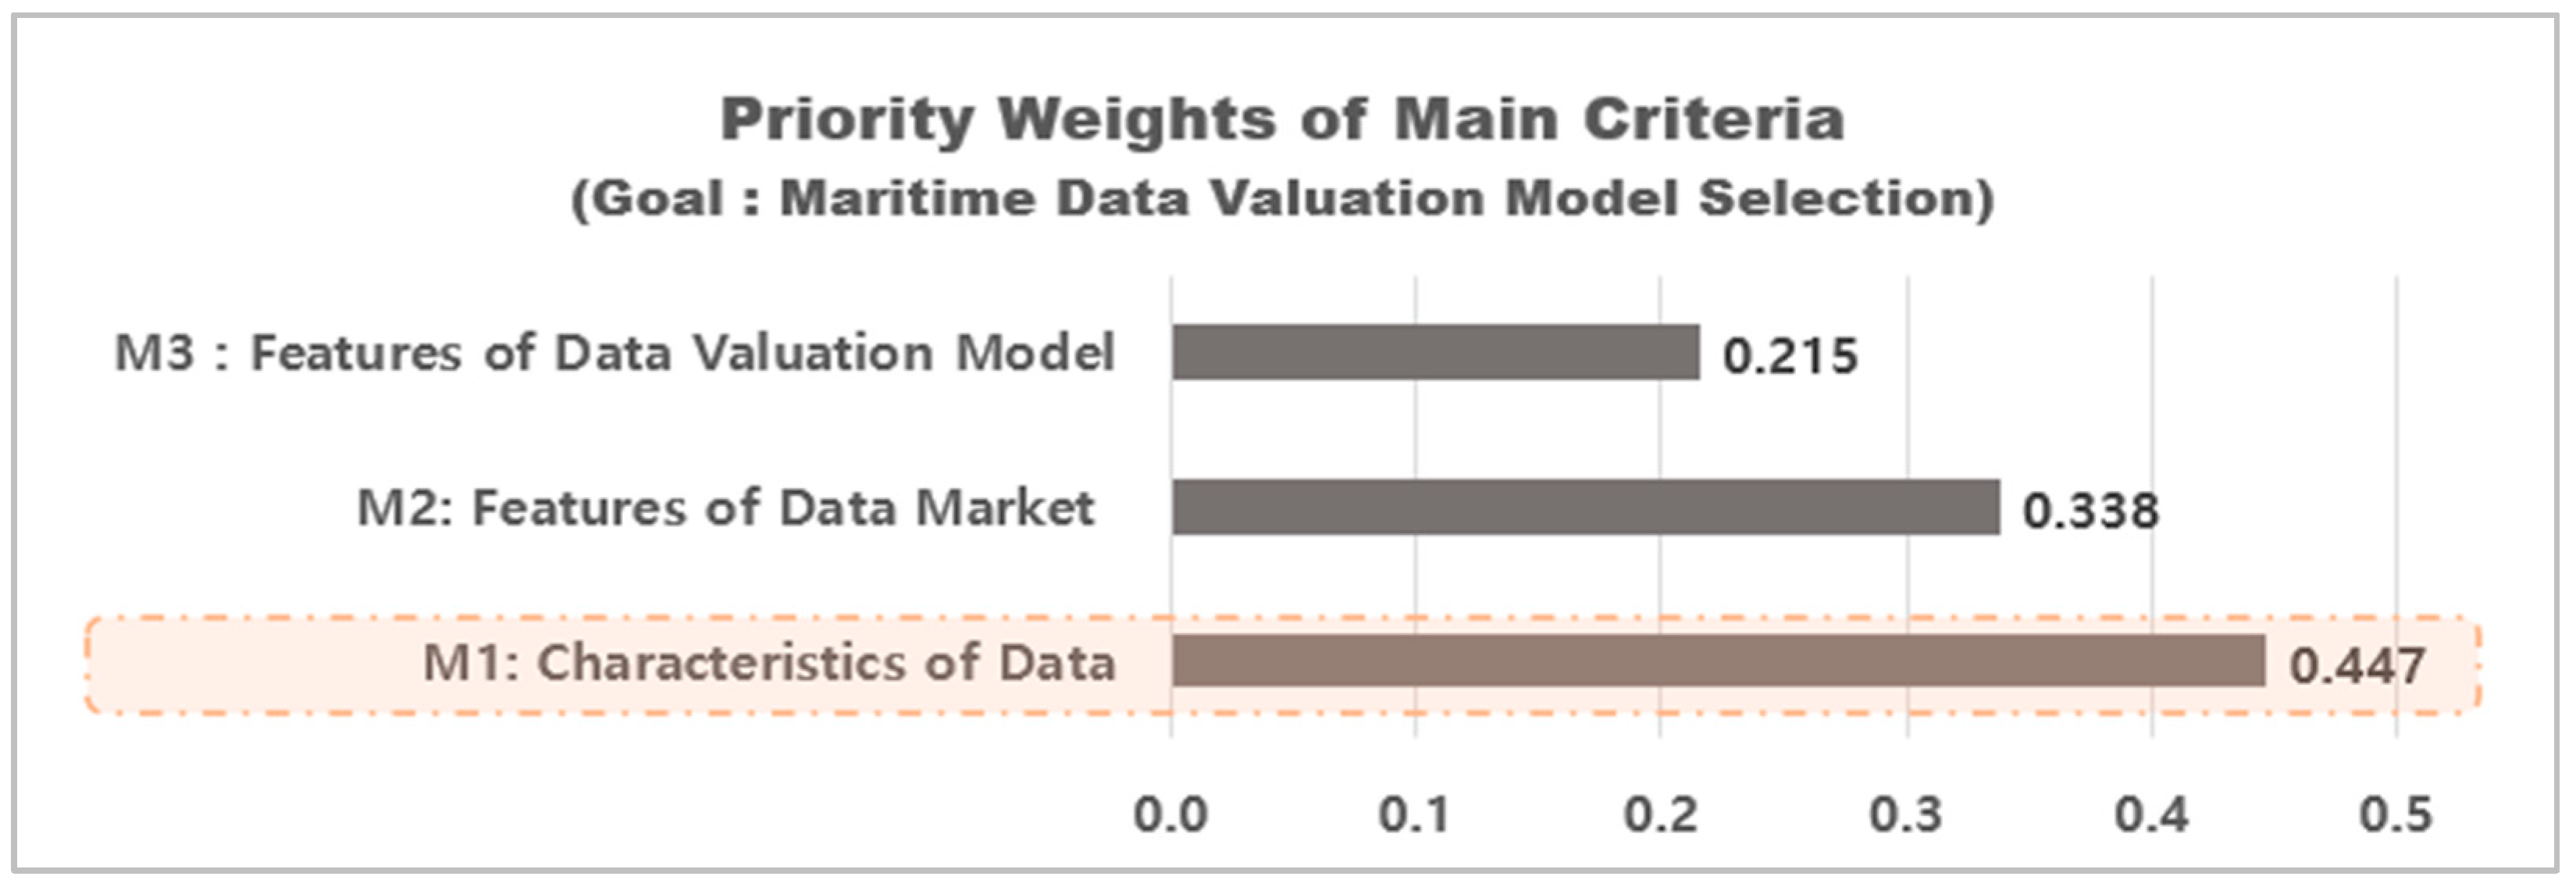
4.1. Main Criteria
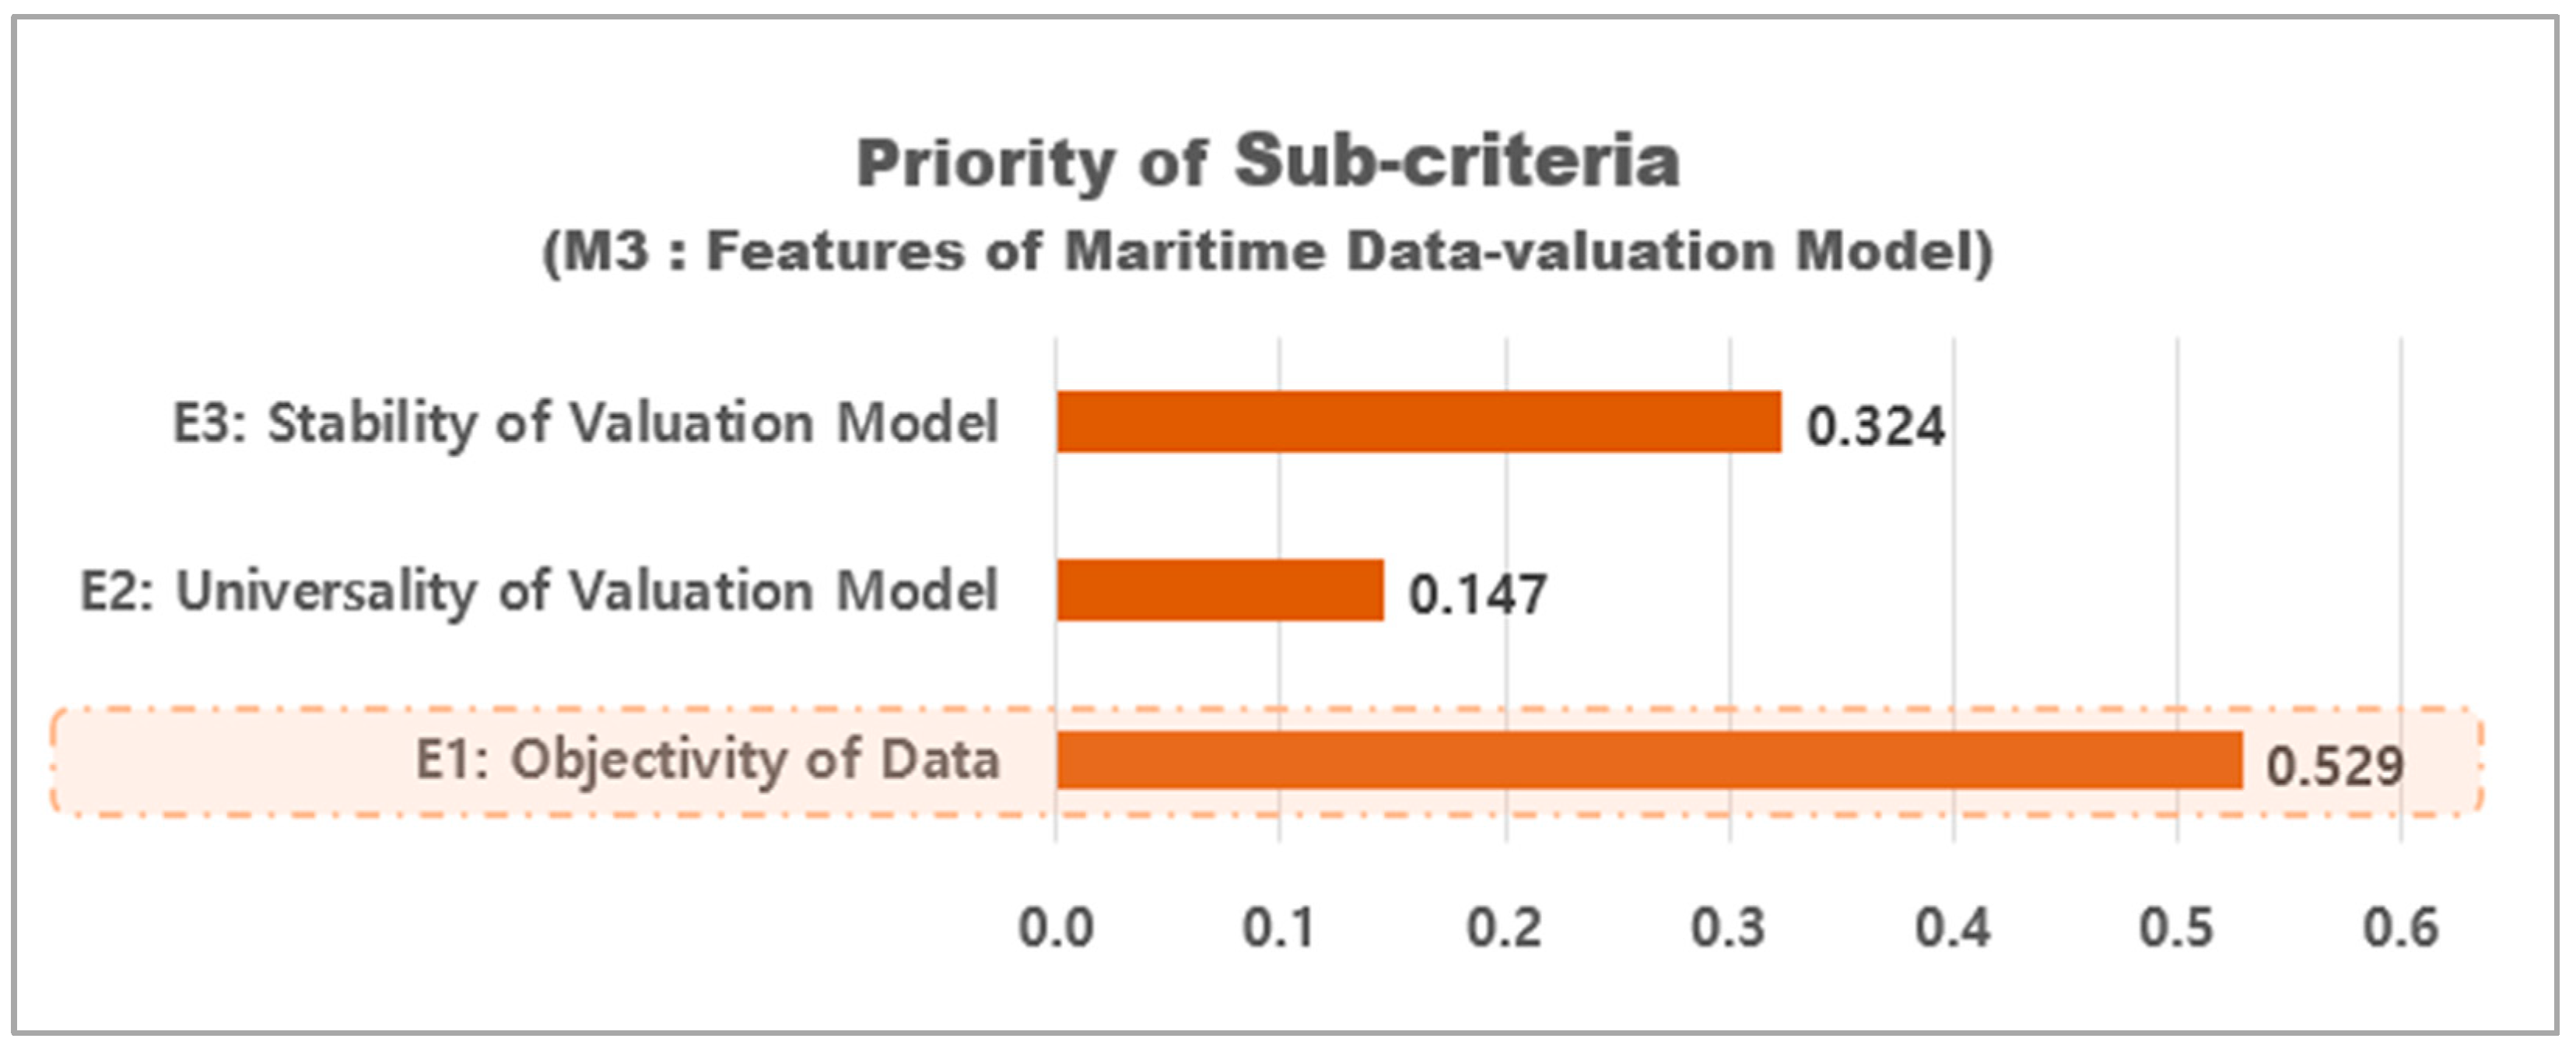
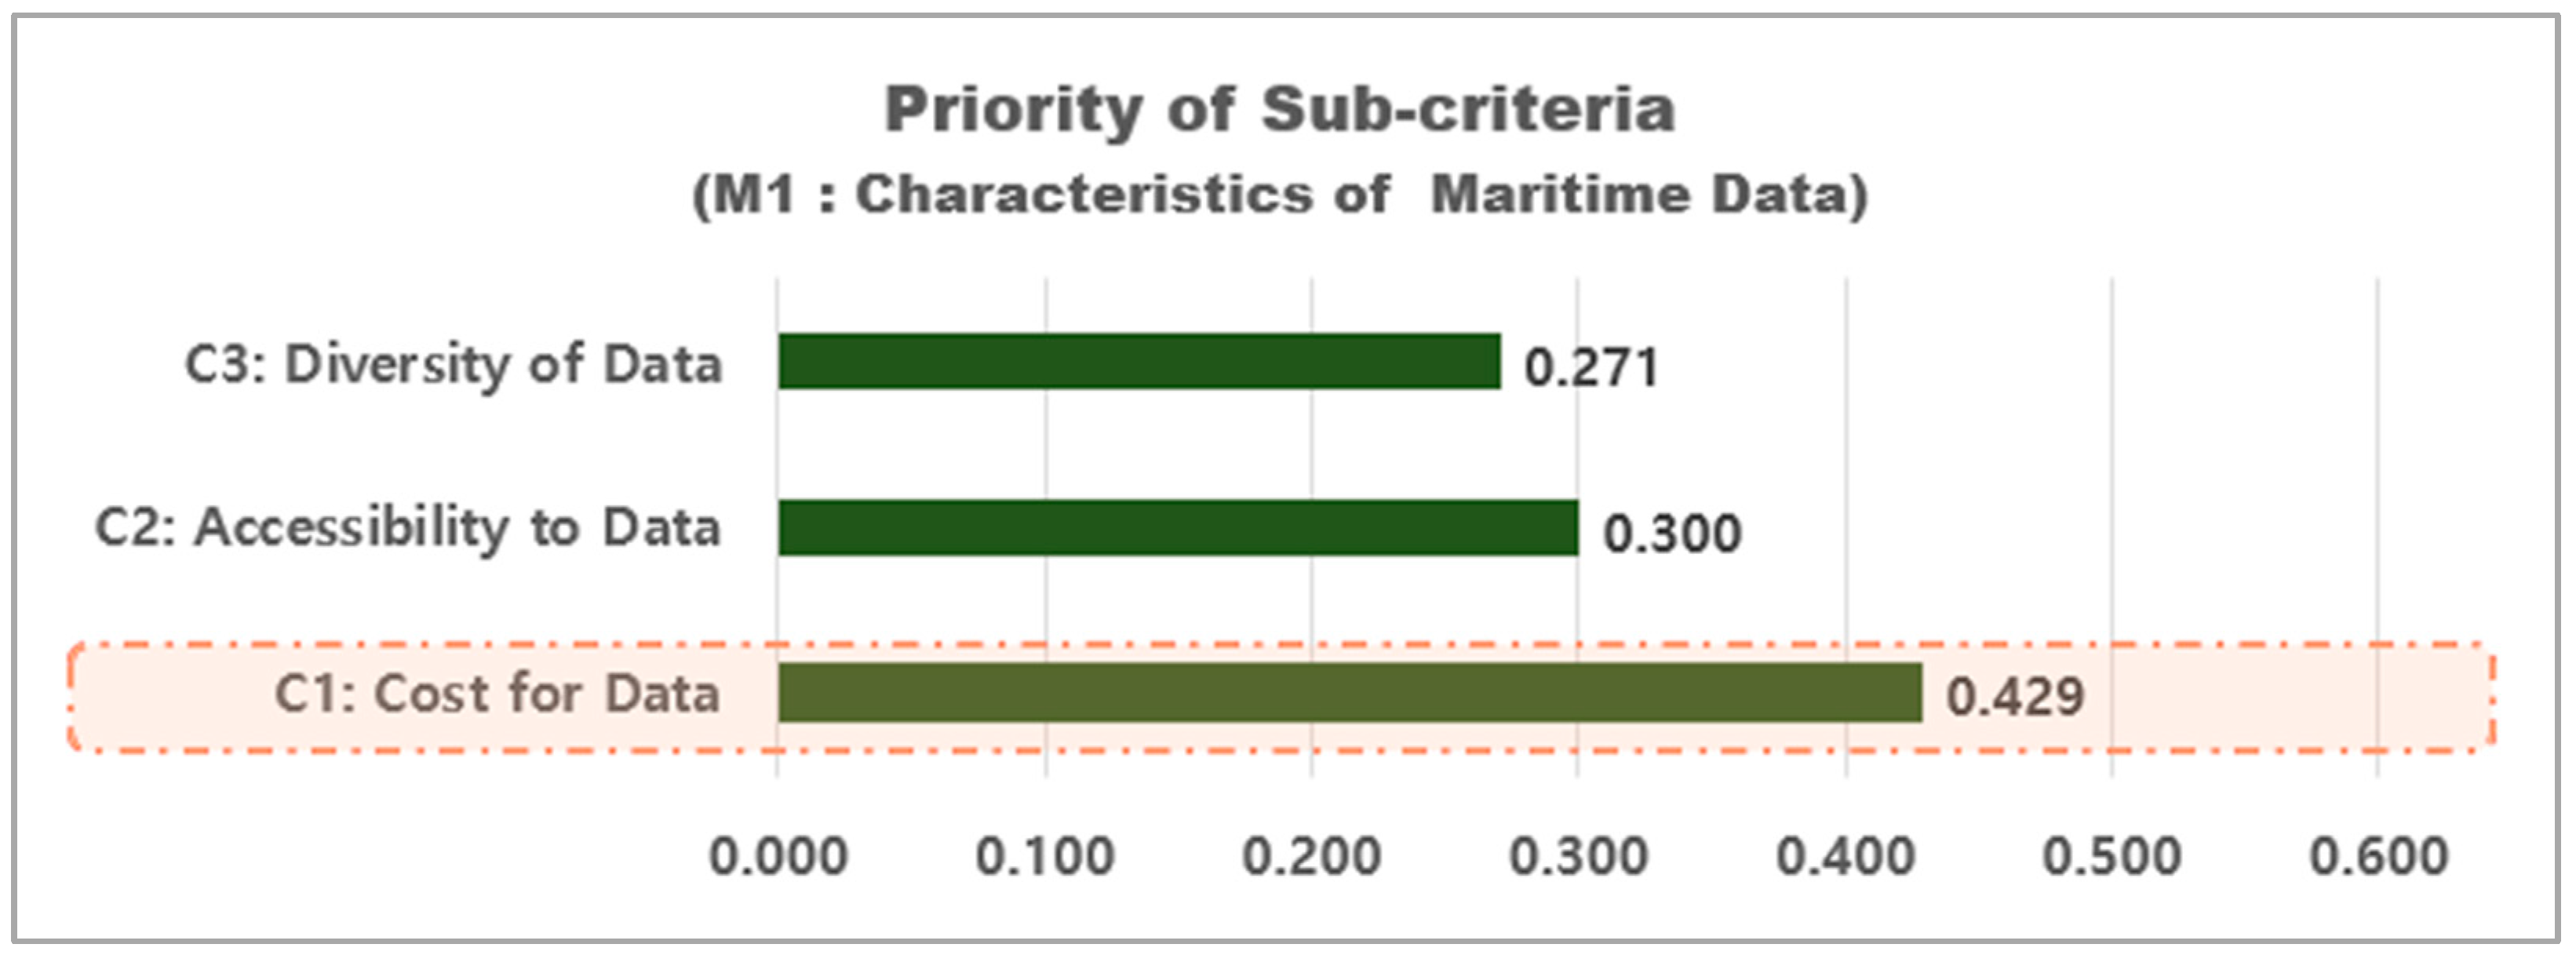
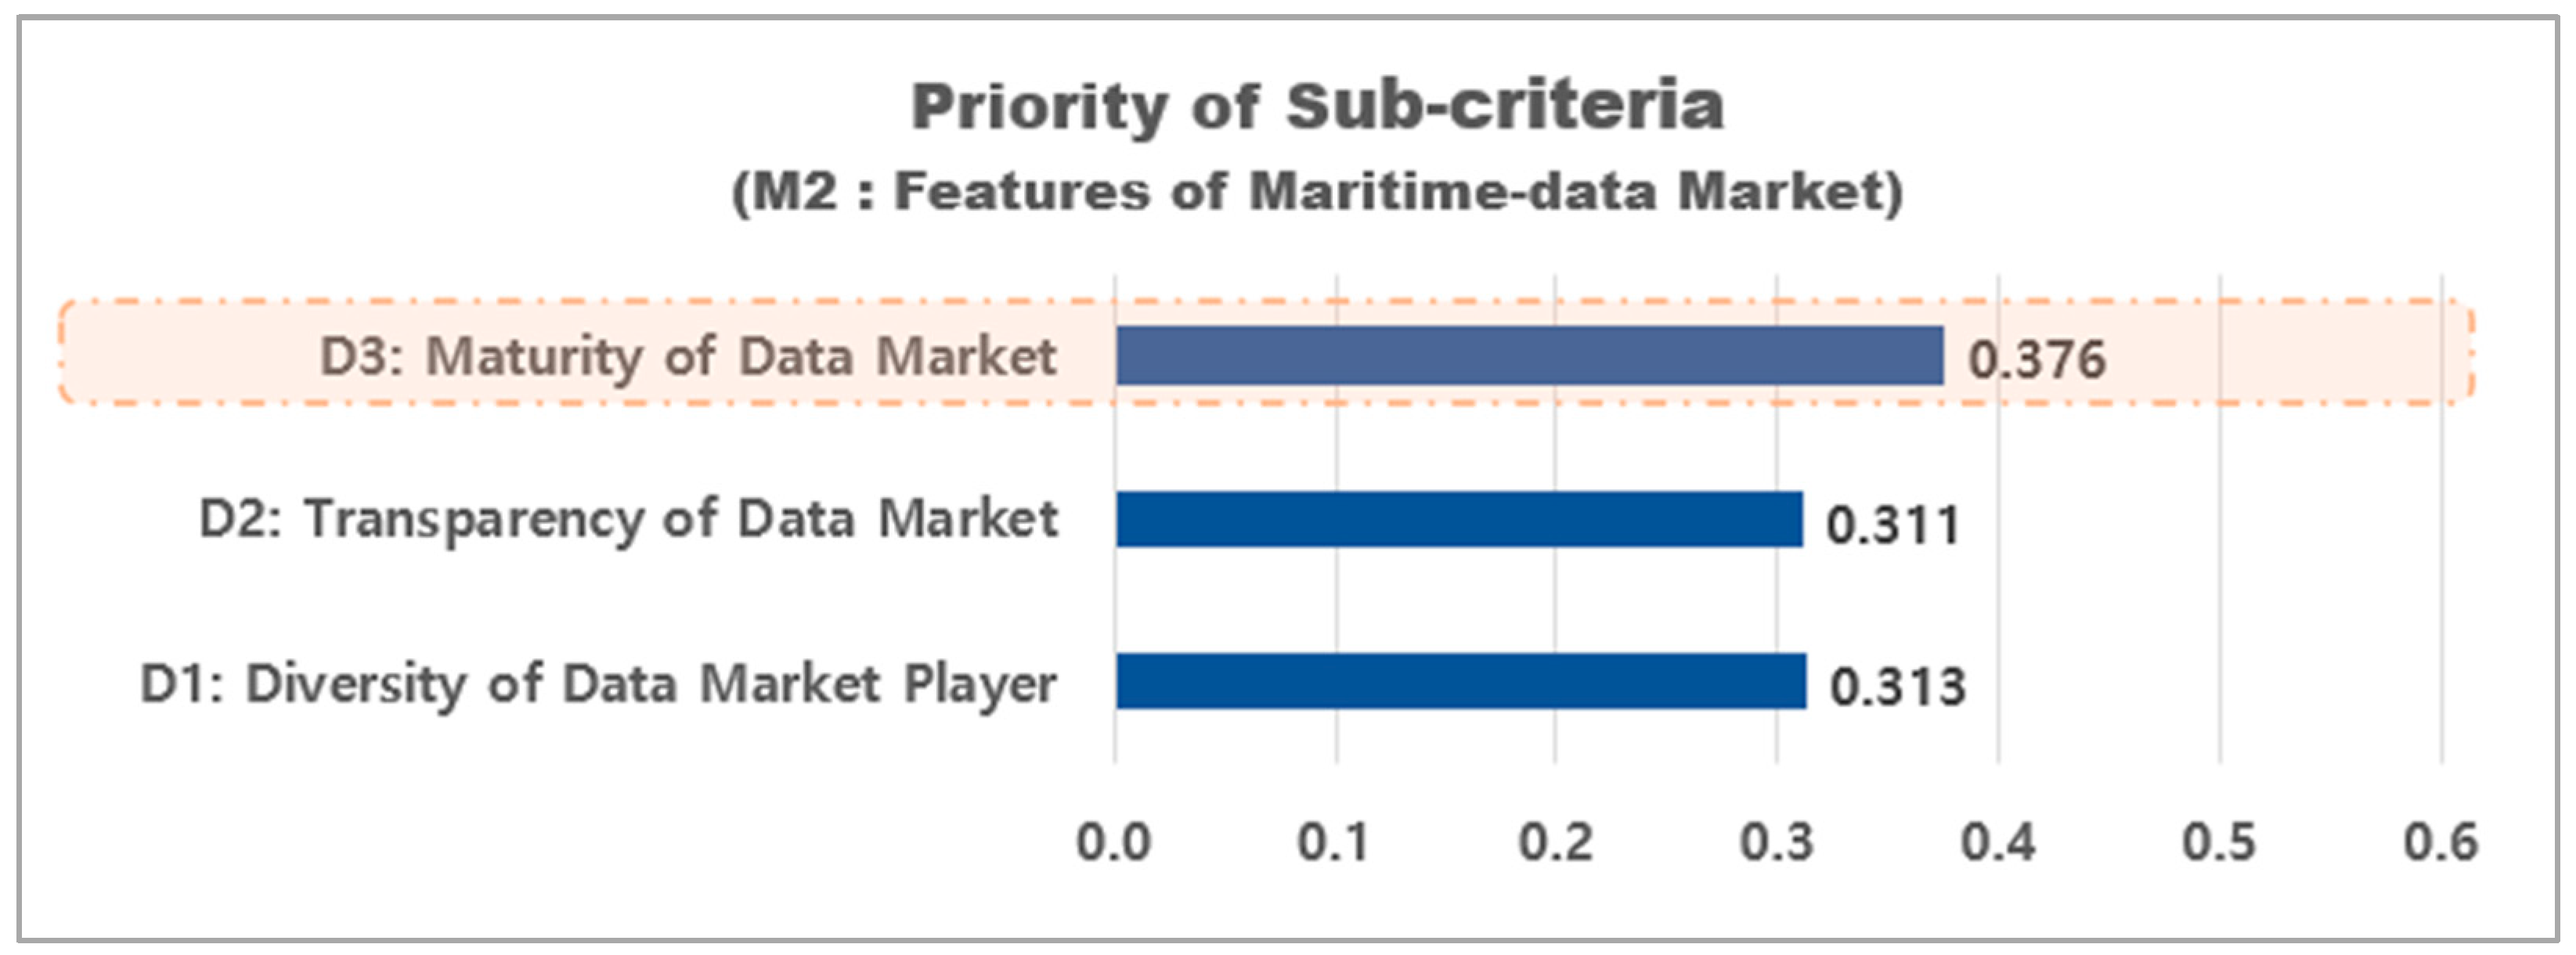
4.2. Sub-Criteria
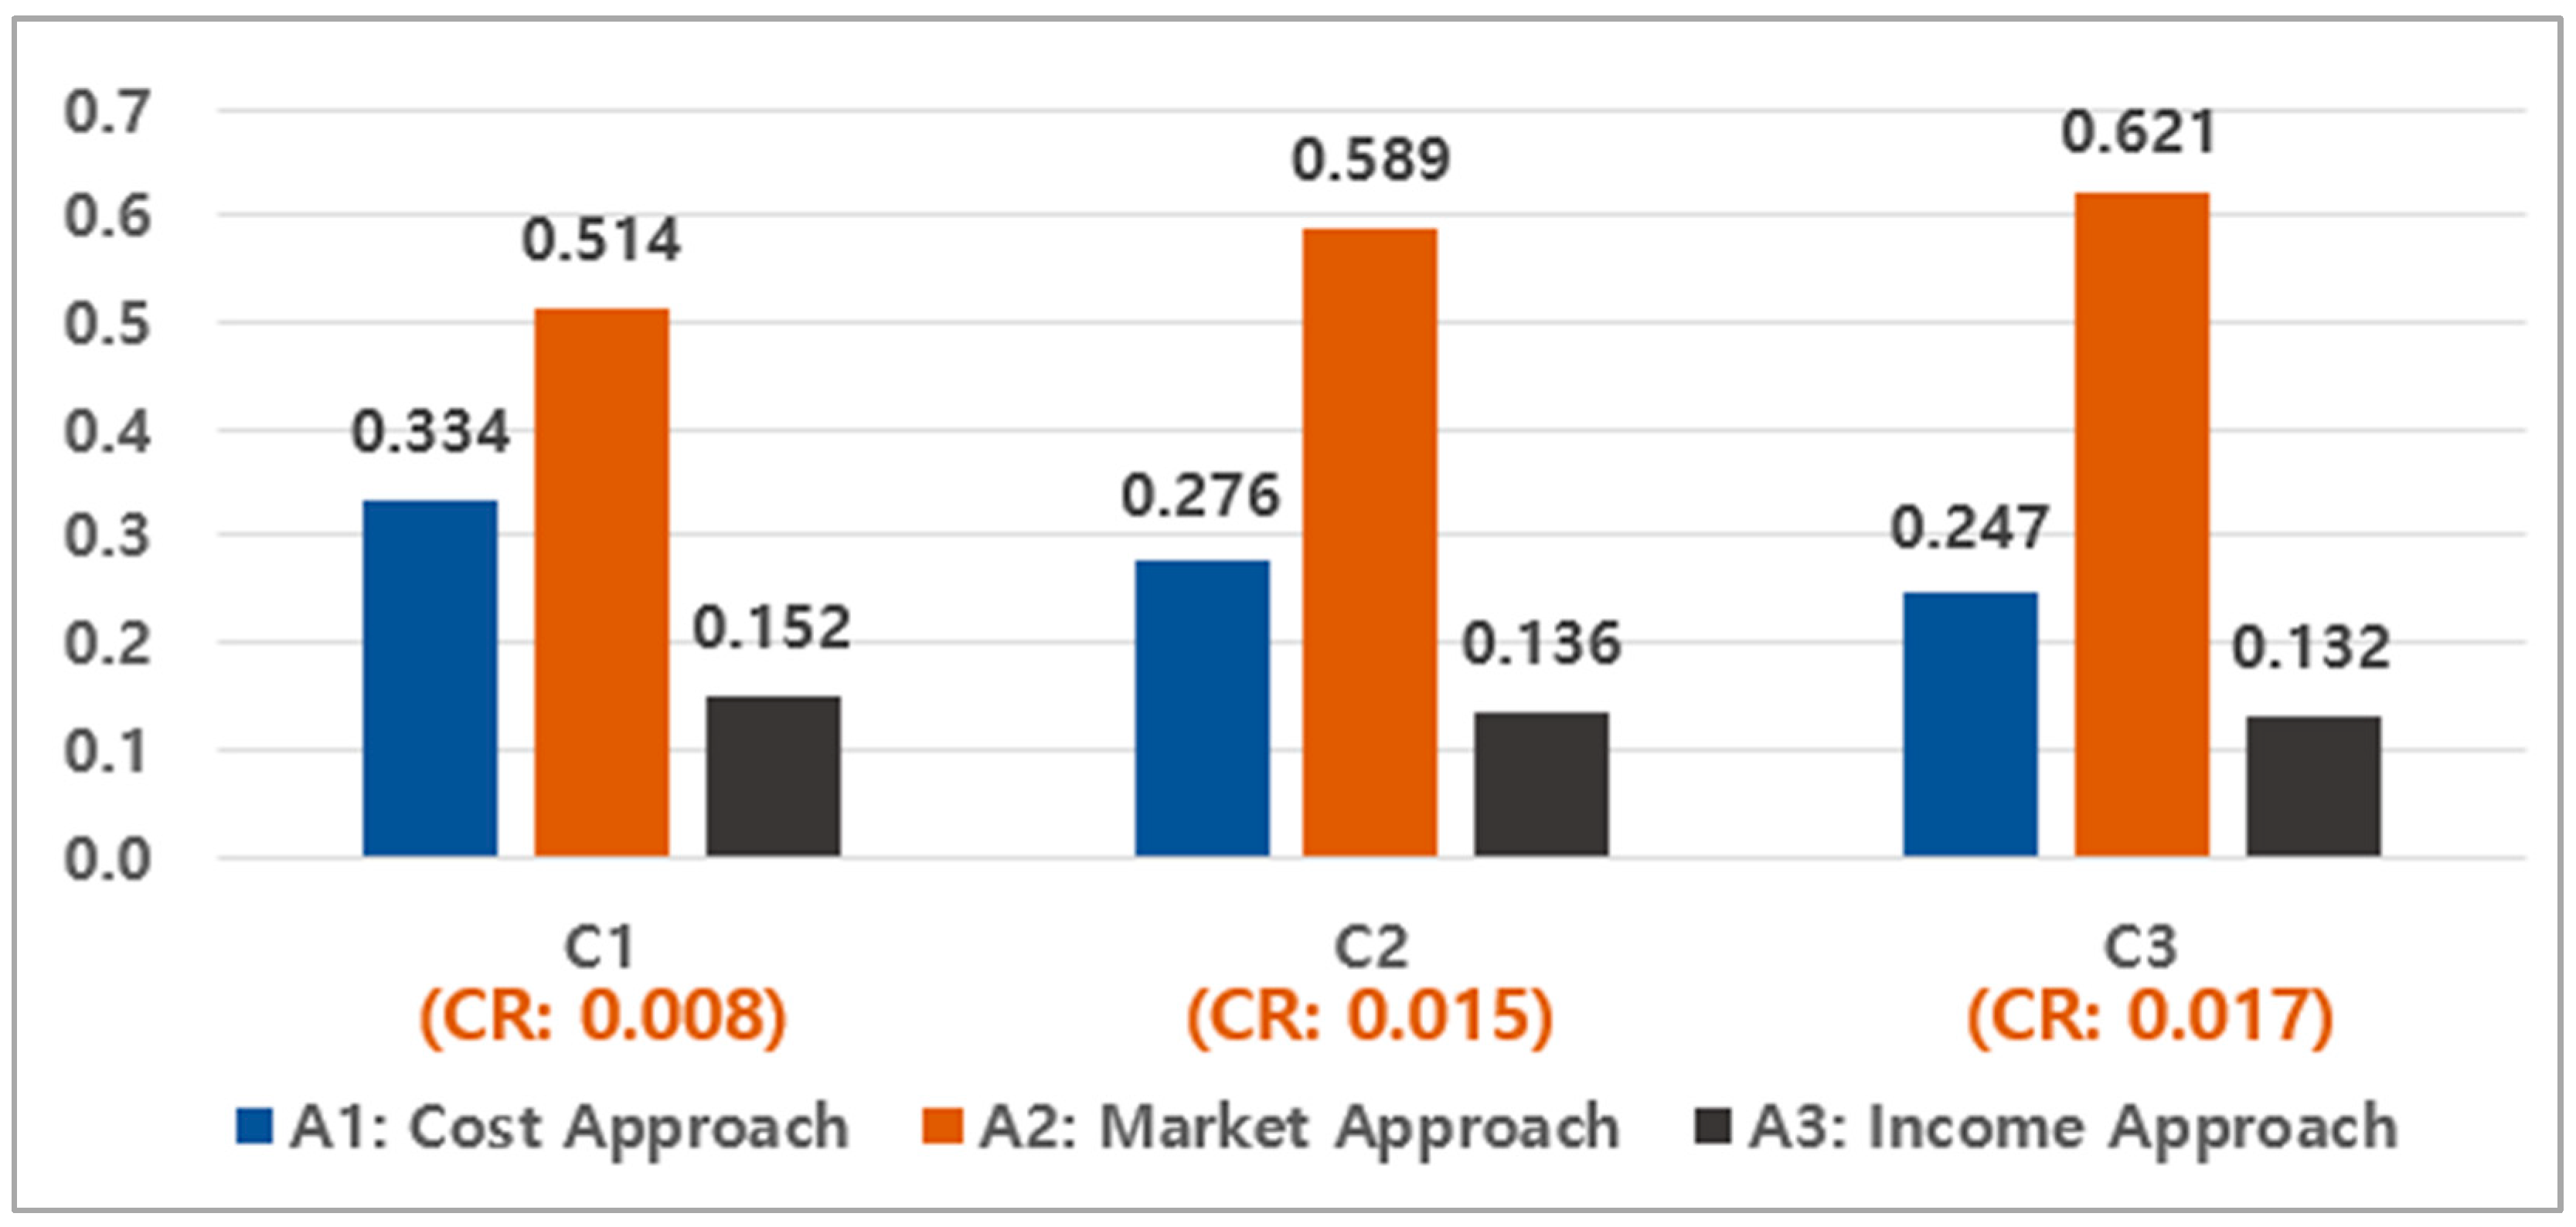
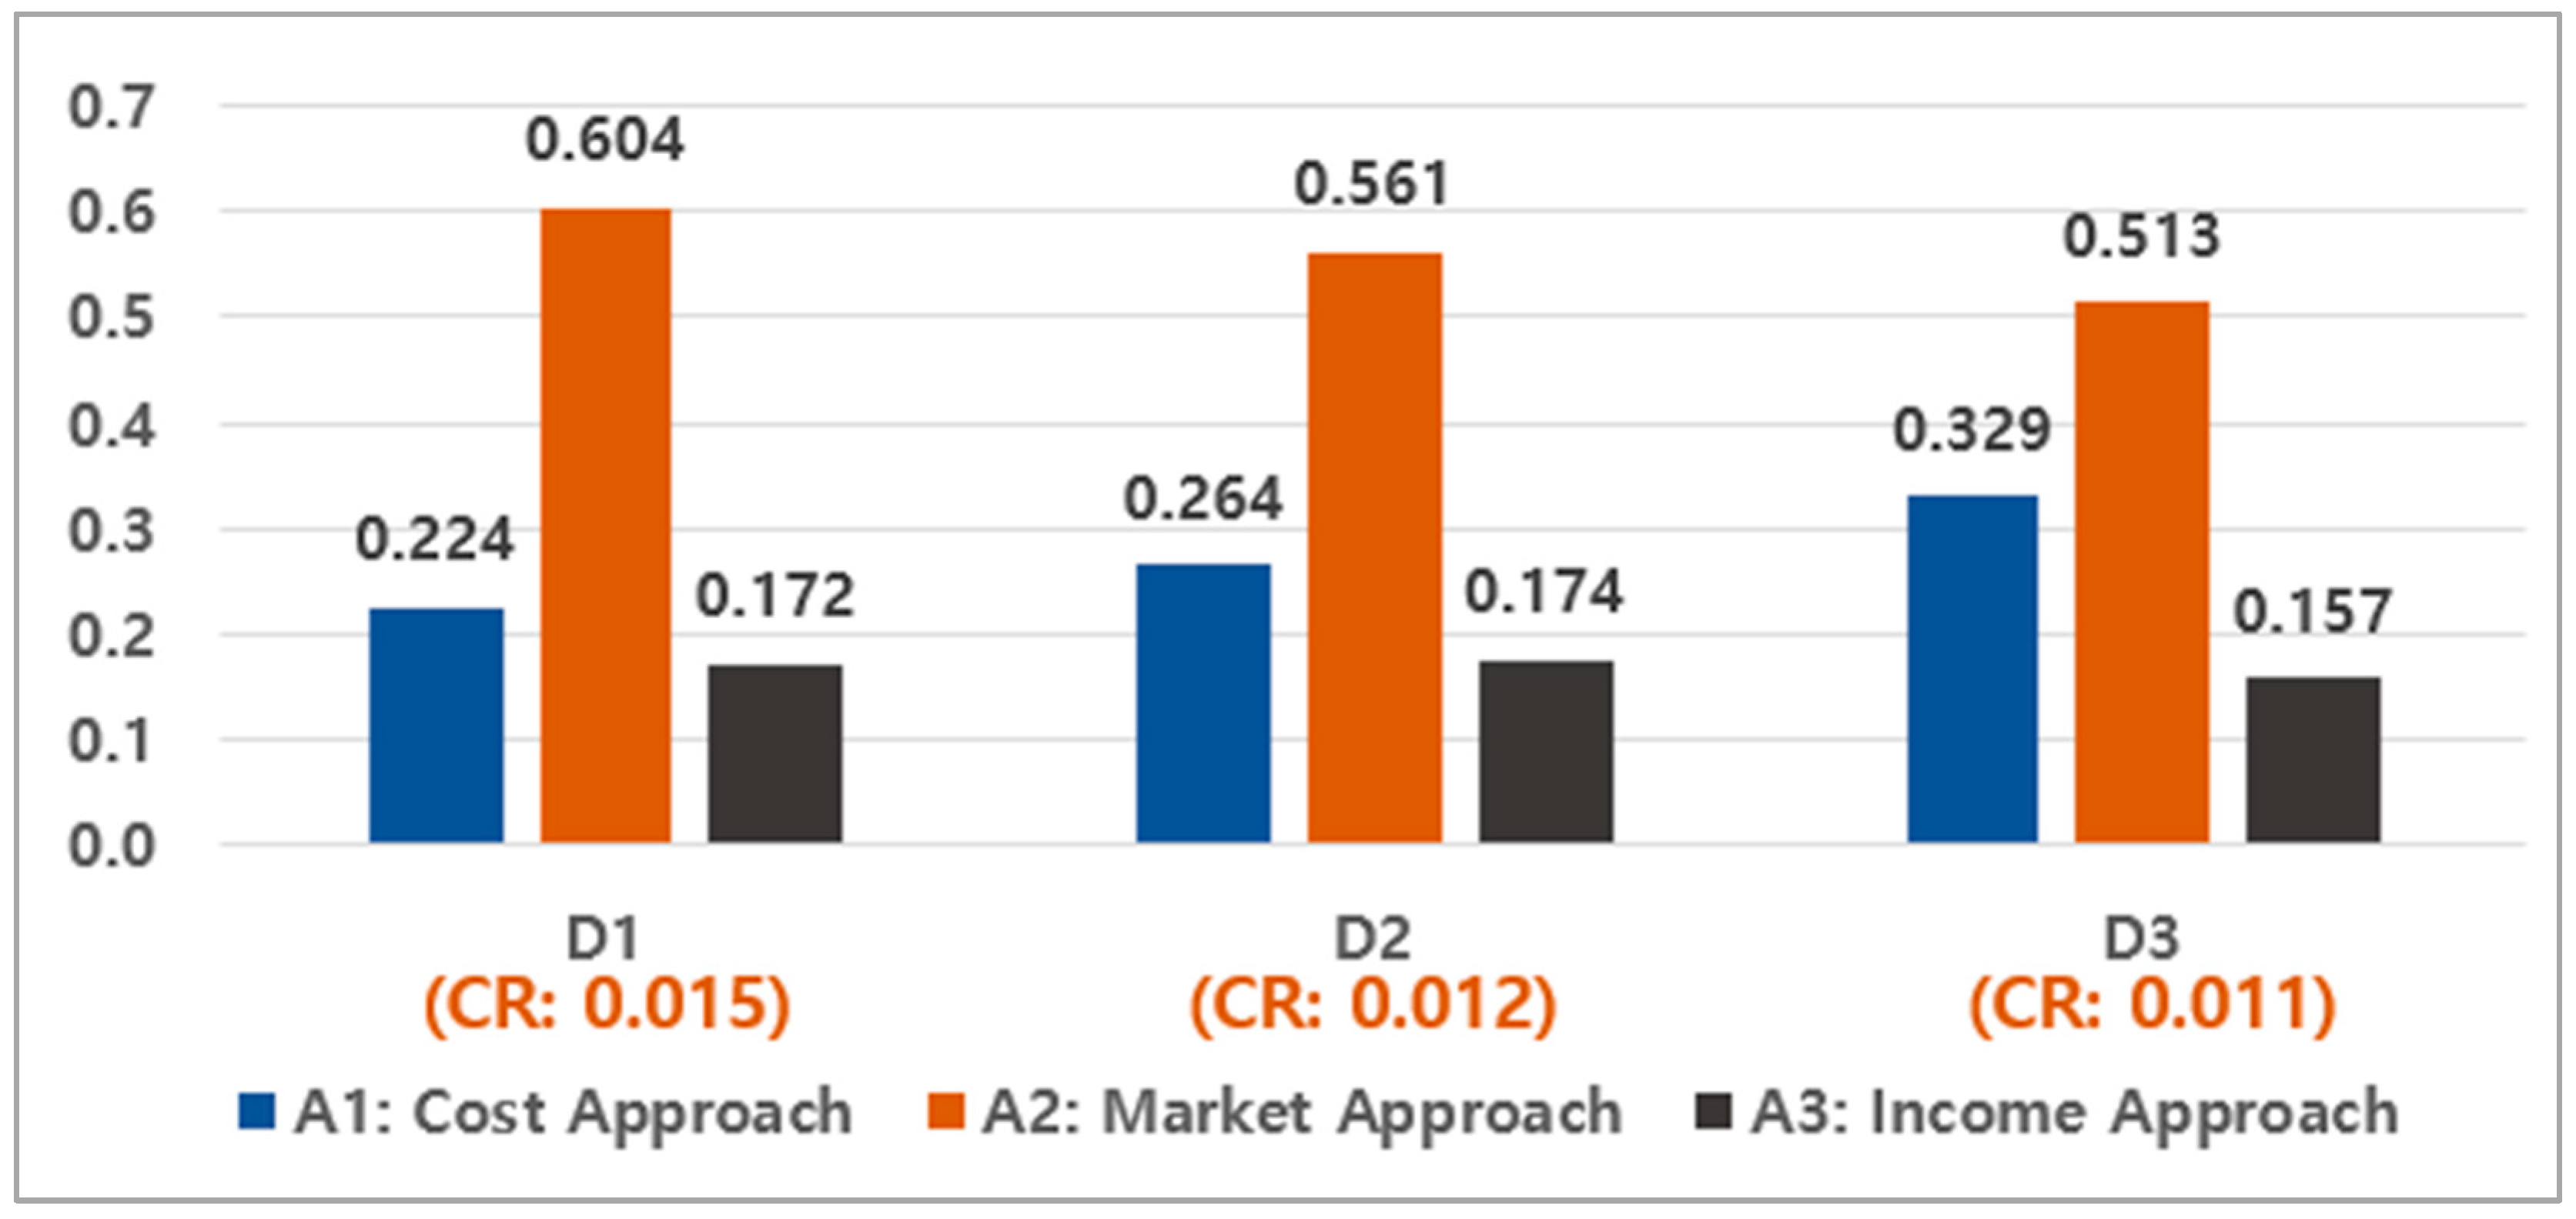
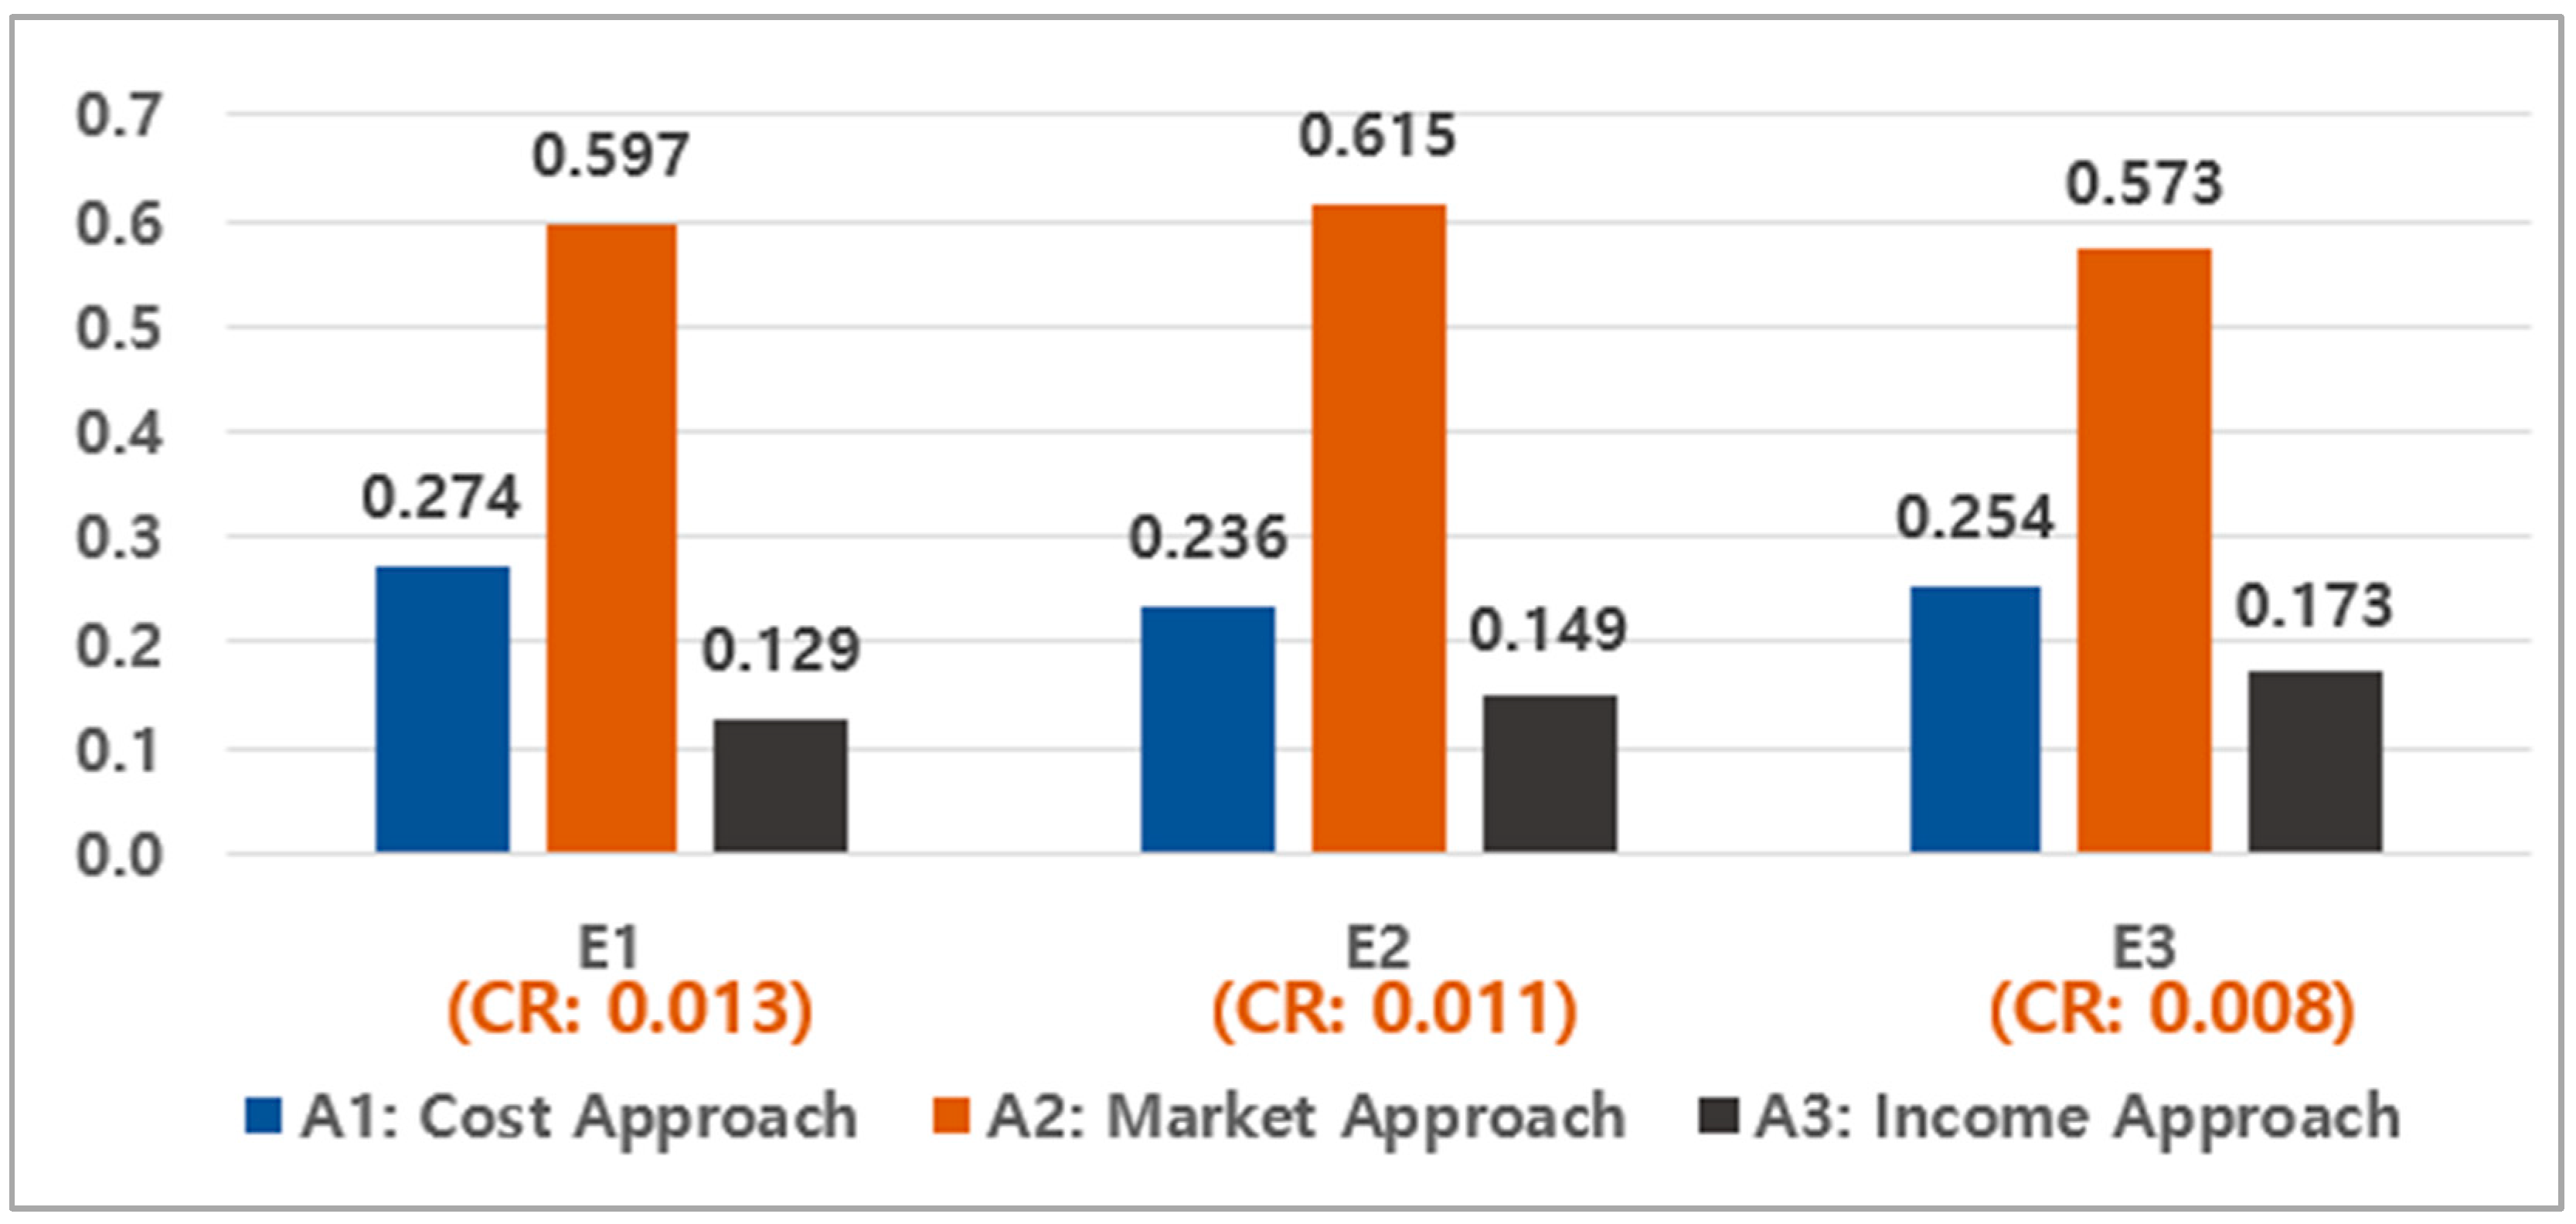
4.3. Selection of Alternative
5. Conclusions
Author Contributions
Funding
Institutional Review Board Statement
Informed Consent Statement
Data Availability Statement
Conflicts of Interest
References
- Statista. Volume of Data/Information Created, Captured, Copied, and Consumed Worldwide from 2010 to 2025. 2021. Available online: https://www.statista.com/statistics/871513/worldwide-data-created/ (accessed on 1 January 2024).
- The Economist. The World’s Most Valuable Resource Is No Longer Oil, But Data. 2017. Available online: https://www.economist.com/leaders/2017/05/06/the-worlds-most-valuable-resource-is-no-longer-oil-but-data (accessed on 1 January 2024).
- Coyle, D.; Diepeveen, S.; Wdowin, J.; Kay, L.; Tennison, J. The Value of Data—Policy Implications. The Bennett Institute for Public Policy, Cambridge, and the Open Data Institute. 2020. Available online: https://www.bennettinstitute.cam.ac.uk/publications/value-data-policy-implications/ (accessed on 1 January 2024).
- Yeo, G.; Lim, S.H.; Wynter, L.; Hassan, H. MPA-IBM Project SAFER: Sense-making analytics for maritime event recognition. INFORMS J. Appl. Anal. 2019, 49, 269–280. [Google Scholar] [CrossRef]
- Heilig, L.; Voilig, S. A cloud-based SOA for enhancing information exchange and decision support in ITT operations. In ICCL 2014: Computational Logistics, Proceedings of the International Conference on Computational Logistics, Valparaíso, Chile, 24–26 September 2014; Springer: Cham, Switzerland, 2014; pp. 112–131. [Google Scholar] [CrossRef]
- Sadowski, J. When Data Is Capital: Datafication, Accumulation, and Extraction. Big Data Soc. 2019, 6, 2053951718820549. [Google Scholar] [CrossRef]
- Hu, D.; Li, Y.; Pan, L.; Li, M.; Zheng, S. A blockchain-based trading system for big data. Comput. Netw. 2021, 191, 107994. [Google Scholar] [CrossRef]
- Forbes. Why Your Company Doesn’t Measure the Value of Its Data Assets. 2021. Available online: https://www.forbes.com/sites/douglaslaney/2021/03/26/why-your-company-doesnt-measure-the-value-of-its-data-assets (accessed on 1 January 2024).
- Muschalle, A.; Stahl, F.; Ltahl, F.; Vossen, G. Pricing approaches for data markets. In BIRTE 2012: Enabling Real-Time Business Intelligence; Castellanos, M., Dayal, U., Rundensteiner, E.A., Eds.; Lecture Notes in Business Information Processing; Springer: Berlin/Heidelberg, Germany, 2013; Volume 154. [Google Scholar] [CrossRef]
- Baum-Talmor, P.; Kitada, M. Industry 4.0 in shipping: Implications to seafarers’ skills and training. Transp. Res. Interdiscip. Perspect. 2022, 13, 100542. [Google Scholar] [CrossRef]
- PwC. Putting a Value on Data. 2019. Available online: https://www.pwc.co.uk/data-analytics/documents/putting-value-on-data.pdf (accessed on 1 January 2024).
- Mihet, R.; Philippon, T. The economics of Big Data and artificial intelligence. In Disruptive Innovation in Business and Finance in the Digital World (International Finance Review, Vol. 20); Choi, J.J., Ozkan, B., Eds.; Emerald Publishing Limited: Bingley, UK, 2019; pp. 29–43. [Google Scholar]
- AT&T. Investor Profile. Available online: https://investors.att.com/investor-profile (accessed on 1 January 2024).
- UNCTAD. Digital Economy Report. 2021. Available online: https://unctad.org/webflyer/digital-economy-report-2021 (accessed on 1 January 2024).
- Jovic, M.; Tijan, E.; Marx, R.; Gebhard, B. Big data management in maritime transport. Pomorski Zbornik 2019, 57, 123–141. [Google Scholar]
- Lee, C.; Kim, Y.; Shin, Y. Data usage and the legal stability of transactions for the commercial operation of autonomous vessels based on digital ownership in Korean civil law. Sustainability 2021, 13, 8134. [Google Scholar] [CrossRef]
- HM Treasury. The Economic Value of Data: A Discussion Paper. 2018. Available online: https://www.gov.uk/government/publications/the-economic-value-of-data-discussion-paper (accessed on 1 January 2024).
- Transport Systems Catapult. The Case for Government Involvement to Incentivise Data Sharing in the UK Intelligent Mobility Sector, Briefing Paper. 2017. Available online: https://cp.catapult.org.uk/wp-content/uploads/2021/07/Transport_Data_Sharing_in_the_UK_Report.pdf (accessed on 1 January 2024).
- Bourreau, M.; Cailaud, B.; De Nijs, R. The value of consumer data in online advertising. Rev. Netw. Econ. 2017, 16, 269–289. [Google Scholar] [CrossRef]
- Fontana, G.; Ghafur, S.; Torne, L.; Goodman, J.; Darzi, A. Ensuring that the NHS realises fair financial value from its data. Lancet Digit. Health 2020, 2, e10–e12. [Google Scholar] [CrossRef] [PubMed]
- Jang, W.-J.; Lee, S.-T.; Kim, J.-B.; Gim, G.-Y. A Study on data profiling: Focusing on attribute value quality index. Appl. Sci. 2019, 9, 5054. [Google Scholar] [CrossRef]
- Liang, F.; Yu, W.; An, D.; Yang, Q.; Fu, X.; Zhao, W. A Survey on Big Data Market: Pricing, Trading and Protection. IEEE Access 2018, 6, 15132–15154. [Google Scholar] [CrossRef]
- Reed, D. Database valuation: Putting a price on your prime asset. J. Database Mark. Cust. Strategy Manag. 2007, 14, 104–110. [Google Scholar] [CrossRef]
- Birch, K.; Cochrane, D.; Ward, C. Data as asset? The measurement, governance, and valuation of digital personal data by Big Tech. Big Data Soc. 2021, 8, 20539517211017308. [Google Scholar] [CrossRef]
- Kim, M.-S.; Lee, C.-H.; Choi, J.-H.; Jang, Y.-J.; Lee, J.-H.; Lee, J.; Sung, T.-E. A study on intelligent technology valuation system: Introduction of KIBO patent appraisal system II. Sustainability 2021, 13, 12666. [Google Scholar] [CrossRef]
- OECD. Exploring the Economics of Personal Data: A Survey of Methodologies for Measuring Monetary Value. OECD Digital Economy Papers, No. 220 (2 April 2013), OECD Publishing, Paris. Available online: https://www.oecd-ilibrary.org/science-and-technology/exploring-the-economics-of-personal-data_5k486qtxldmq-en (accessed on 1 January 2024).
- Langley, D.J. Digital product-service systems: The role of data in the transition to servitization business models. Sustainability 2022, 14, 1303. [Google Scholar] [CrossRef]
- Koltay, T. Quality of open research data: Values, convergences and governance. Information 2020, 11, 175. [Google Scholar] [CrossRef]
- OECD. Vectors of Digital Transformation; OECD Digital Economy Papers No. 273; OECD Publishing: Paris, France, 2019; Available online: https://www.sipotra.it/wp-content/uploads/2019/03/VECTORS-OF-DIGITAL-TRANSFORMATION.pdf (accessed on 1 January 2024).
- IMDA; PDPC. Guide to Data Valuation for Data Sharing. 2019. Available online: https://www.imda.gov.sg/-/media/Imda/Files/Programme/AI-Data-Innovation/Guide-to-Data-Valuation-for-Data-Sharing.pdf (accessed on 1 January 2024).
- Slotin, J. What Do We Know about the Value of Data? Global Partnership for Sustainable Development. 2018. Available online: https://www.data4sdgs.org/blog/what-do-we-know-about-value-data (accessed on 1 January 2024).
- Sałabun, W.; Ziemba, P.; Wątróbski, J. The rank reversals paradox in management decisions: The comparison of the AHP and COMET methods. In Intelligent Decision Technologies; Springer International Publishing: Cham, Switzerland, 2016; pp. 181–191. [Google Scholar]
- MTS Market. Market Participants Need Both Quantity and Quality of Data. 2021. Available online: https://www.mtsmarkets.com/news/insights/market-participants-need-both-quantity-and-quality-data (accessed on 1 January 2024).
- Morey, T.; Forbath, T.; Schoop, A. Customer data: Designing for transparency and trust. Harv. Bus. Rev. 2015, 93, 96–105. [Google Scholar]
- Mawer, C. Valuing Data Is Hard. Silicon Valley Data Science Blog Post. 2015. Available online: https://www.svds.com/valuing-data-is-hard/ (accessed on 1 January 2024).
- Kut, P.; Pietrucha-Urbanik, K. Most Searched Topics in the Scientific Literature on Failures in Photovoltaic Installations. Energies 2022, 15, 8108. [Google Scholar] [CrossRef]
- Saaty, T.L. A scaling method for priorities in hierarchical structures. J. Math. Psychol. 1977, 15, 234–281. [Google Scholar] [CrossRef]
- Saaty, T.L. Decision making with the analytic hierarchy process. J. Serv. Sci. 2008, 1, 83–98. [Google Scholar] [CrossRef]
- Vaidya, O.S.; Kumar, S. Analytic hierarchy process: An overview of applications. Eur. J. Oper. Res. 2006, 169, 1–29. [Google Scholar] [CrossRef]
- Torres-Lozada, P.; Manyoma-Velásquez, P.; Gaviria-Cuevas, J.F. Prioritization of Waste-to-Energy Technologies Associated with the Utilization of Food Waste. Sustainability 2023, 15, 5857. [Google Scholar] [CrossRef]
- Zeng, X.; Yang, X.; Zhong, S.; Wang, Z.; Ding, Y.; Meng, D.; Gao, K. Comprehensive Evaluation of Resource and Environmental Carrying Capacity at a National Scale: A Case Study of Southeast Asia. Sustainability 2023, 15, 5791. [Google Scholar] [CrossRef]
- Gupta, S.; Raj, S.; Gupta, S.; Sharma, A. Prioritising crowdfunding benefits: A fuzzy-AHP approach. Qual. Quant. 2023, 57, 379–403. [Google Scholar] [CrossRef] [PubMed]
- Costa, W.S.; Pinheiro, P.R.; dos Santos, N.M.; Cabral, L.d.A.F. Aligning the Goals Hybrid Model for the Diagnosis of Mental Health Quality. Sustainability 2023, 15, 5938. [Google Scholar] [CrossRef]
- Ordu, M.; Der, O. Polymeric Materials Selection for Flexible Pulsating Heat Pipe Manufacturing Using a Comparative Hybrid MCDM Approach. Polymers 2023, 15, 2933. [Google Scholar] [CrossRef] [PubMed]
- Patnaik, P.K.; Swain, P.T.R.; Mishra, S.K.; Purohit, A.; Biswas, S. Composite material selection for structural applications based on AHP-MOORA approach. Mater. Today: Proc. 2020, 33, 5659–5663. [Google Scholar] [CrossRef]
- Tian, G.; Zhang, H.; Zhou, M.; Li, Z. AHP, gray correlation, and TOPSIS combined approach to green performance evaluation of design alternatives. IEEE Trans. Syst. Man Cybern. Syst. 2017, 48, 1093–1105. [Google Scholar] [CrossRef]
- Miller, G.A. The Magical Number Seven, Plus or Minus Two: Some Limits on Our Capacity for Processing Information. Psychol. Rev. 1956, 101, 343–352. [Google Scholar] [CrossRef]
- Moslem, S.; Farooq, D.; Ghorbanzadeh, O.; Blaschke, T. Application of the AHP-BWM Model for Evaluating Driver Behavior Factors Related to Road Safety: A Case Study for Budapest. Symmetry 2020, 12, 243. [Google Scholar] [CrossRef]
- Misran, M.F.R.; Roslin, E.N.; Mohd Nur, N. AHP-consensus judgement on transitional decision-making: With a discussion on the relation towards open innovation. J. Open Innov. Technol. Mark. Complex. 2020, 6, 63. [Google Scholar] [CrossRef]
- Aguaron, J.; Moreno-Jimenez, J.M. The geometric consistency index: Approximated thresholds. Eur. J. Oper. Res. 2003, 147, 137–145. [Google Scholar] [CrossRef]
- Wu, Y.; Zhang, J.; Yuan, J.; Geng, S.; Zhang, H. Study of decision framework of offshore wind power station site selection based on ELECTRE-III under intuitionistic fuzzy environment: A case of China. Energy Convers. Manag. 2016, 113, 66–81. [Google Scholar] [CrossRef]
- Abduh, M.; Omar, M.A. Islamic-bank selection criteria in Malaysia: An AHP approach. Bus. Intell. J. 2012, 5, 271–281. [Google Scholar]
- Shen, L.; Mathiyazhagan, K.; Kannan, D.; Ying, W. Study on analysing the criteria’s for selection of shipping carriers in Chinese shipping market using analytical hierarchy process. Int. J. Shipp. Transp. Logist. 2015, 7, 742–757. [Google Scholar] [CrossRef]


| Criteria | Description | Sources | |
|---|---|---|---|
| Main | Sub | ||
| M1: Characteristics of Maritime Data | C1: Cost of Data | Construction and maintenance cost of maritime data | Coyle et al. (2020) [3], PWC (2019) [11] Langley (2022) [27] |
| C2: Accessibility to Data | Disclosure and security characteristics of maritime data | UNCTAD (2021) [14] Coyle et al. (2020) [3] PWC (2019) [11] Langley (2022) [27] OECD (2019) [29] | |
| C3: Diversity of Data | Types and utilization diversity of maritime data | UNCTAD (2021) [14] Coyle et al. (2020) [3] PWC (2019) [11] Langley (2022) [27] IMDA and PDPC (2019) [30] MTS market (2021) [33] | |
| M2: Features of Maritime Data Market | D1: Diversity of Data Market Player | Diversity of demand for maritime data | PWC (2019) [11] IMDA and PDPC (2019) [30] MTS market (2021) [33] |
| D2: Transparency of Data Market | Transparency of maritime data market | PWC (2019) [11] Morey et al. (2015) [34] | |
| D3: Maturity of Data Market | Activation and maturity of maritime data market | PWC (2019) [11] | |
| M3: Features of Maritime Data Valuation Model | E1: Objectivity of Data | Objectivity of data required by the model | PWC (2019) [11] Mawer (2015) [35] |
| E2: Universality of Valuation Model | Universal availability at a level that allows the model to be used by market players | PWC (2019) [11] | |
| E3: Stability of Valuation Model | Stability of the values derived from the model | PWC (2019) [11] Koltay (2020) [28] | |
| Alternatives | A1: Cost Approach | Valuation method based on the cost of maritime-data construction | PWC (2019) [11] |
| A2: Market Approach | Valuation method based on trading cases similar to maritime data trading | PWC (2019) [11] | |
| A3: Income Approach | Valuation method based on expected profit that can be generated using maritime data | PWC (2019) [11] Mawer (2015) [35] Slotin (2018) [31] | |
| Score Value | Meaning |
|---|---|
| 1 | Equally important |
| 3 | A little more important |
| 5 | More important |
| 7 | Strongly important |
| 9 | Extremely important |
| 2, 4, 6, 8 | Intermediate values |
| n | 1 | 2 | 3 | 4 | 5 | 6 | 7 | 8 | 9 | 10 |
|---|---|---|---|---|---|---|---|---|---|---|
| RI | 0 | 0 | 0.58 | 0.90 | 1.12 | 1.24 | 1.32 | 1.41 | 1.45 | 1.49 |
| Main Criteria | Sub-Criteria | |||||
|---|---|---|---|---|---|---|
| Main Factors | Weight | Ranking | Sub-Factors | Weight | Adjusted Weight | Ranking |
| M1 | 0.447 | 1 | C1 | 0.429 | 0.192 | 1 |
| C2 | 0.300 | 0.134 | 2 | |||
| C3 | 0.271 | 0.121 | 4 | |||
| M2 | 0.338 | 2 | D1 | 0.313 | 0.106 | 6 |
| D2 | 0.311 | 0.105 | 7 | |||
| D3 | 0.376 | 0.127 | 3 | |||
| M3 | 0.215 | 3 | E1 | 0.529 | 0.114 | 5 |
| E2 | 0.147 | 0.032 | 9 | |||
| E3 | 0.324 | 0.070 | 8 | |||
| Alternatives | Weight | Ranking |
|---|---|---|
| A1: Cost Approach | 0.281 | 2 |
| A2: Market Approach | 0.568 | 1 |
| A3: Income Approach | 0.515 | 3 |
Disclaimer/Publisher’s Note: The statements, opinions and data contained in all publications are solely those of the individual author(s) and contributor(s) and not of MDPI and/or the editor(s). MDPI and/or the editor(s) disclaim responsibility for any injury to people or property resulting from any ideas, methods, instructions or products referred to in the content. |
© 2024 by the authors. Licensee MDPI, Basel, Switzerland. This article is an open access article distributed under the terms and conditions of the Creative Commons Attribution (CC BY) license (https://creativecommons.org/licenses/by/4.0/).
Share and Cite
Lim, S.; Lee, C.-H.; Bae, J.-H.; Jeon, Y.-H. Identifying the Optimal Valuation Model for Maritime Data Assets with the Analytic Hierarchy Process (AHP). Sustainability 2024, 16, 3284. https://doi.org/10.3390/su16083284
Lim S, Lee C-H, Bae J-H, Jeon Y-H. Identifying the Optimal Valuation Model for Maritime Data Assets with the Analytic Hierarchy Process (AHP). Sustainability. 2024; 16(8):3284. https://doi.org/10.3390/su16083284
Chicago/Turabian StyleLim, Sangseop, Chang-Hee Lee, Jae-Hwan Bae, and Young-Hun Jeon. 2024. "Identifying the Optimal Valuation Model for Maritime Data Assets with the Analytic Hierarchy Process (AHP)" Sustainability 16, no. 8: 3284. https://doi.org/10.3390/su16083284
APA StyleLim, S., Lee, C.-H., Bae, J.-H., & Jeon, Y.-H. (2024). Identifying the Optimal Valuation Model for Maritime Data Assets with the Analytic Hierarchy Process (AHP). Sustainability, 16(8), 3284. https://doi.org/10.3390/su16083284