Article

Construction of the Ecological Security Pattern in Xishuangbanna Tropical Rainforest Based on Circuit Theory

1
School of Earth Sciences, East China University of Technology, Nanchang 330013, China
2
College of Engineering, Tibet University, Lhasa 850000, China
3
School of Safety Engineering, China University of Mining and Technology, Xuzhou 221116, China
*
Author to whom correspondence should be addressed.
Sustainability 2024, 16(8), 3290; https://doi.org/10.3390/su16083290
Submission received: 24 January 2024 / Revised: 18 February 2024 / Accepted: 21 February 2024 / Published: 15 April 2024

Abstract

:
Urban modernization and economic globalization have led to significant changes in traditional natural landscapes. The unregulated and large-scale expansion of rubber plantations in Xishuangbanna has resulted in water and scenic forests being replaced by rubber forests and the complex rainforest ecosystem being replaced by simple artificial forests. This has resulted in increasingly prominent ecological problems such as soil erosion, regional microclimate changes, and sharp declines in biodiversity. The ecological security pattern is an important way to protect regional ecological sustainability. Taking the tropical rainforest in Xishuangbanna as an example, this study identified ecological sources through the evaluation of the importance of ecosystem services, constructed resistance surfaces through ecological sensitivity evaluation, and used circuit theory to simulate ecological processes in heterogeneous landscapes by calculating “electricity” or “resistance”, thereby identifying ecological corridors and key ecological nodes. The results identified 31 ecological source areas, 65 key ecological corridors, 7 potential ecological corridors, 37 ecological pinch points, and 99 ecological barriers. The overall distribution of ecological sources was scattered, with higher density in the northwest and southeast regions. Ecological corridors were distributed along high mountains, and both ecological sources and corridors were mainly composed of forest land. Based on circuit theory, this study filled the gap in the MCR model’s inability to identify the true width of corridors due to ignoring the randomness of biological migration. It determined the spatial range of ecological corridors and the specific locations of ecological nodes and barriers, providing a reference for solving ecological problems in Xishuangbanna, such as “rainforest fragmentation”.

1. Introduction

Xishuangbanna Tropical Rainforest is currently the most well-preserved high-latitude and high-altitude tropical rainforest in the world. It is also the most complete, largest, and most unique ecosystem in China [1,2,3]. As the region with the richest biodiversity in terrestrial ecosystems, it plays an important role in the protection of biodiversity in Yunnan, China, and even globally. It is unique, irreplaceable, and has attracted wide attention both domestically and internationally. However, with the increasing human disturbances such as economic forests, farmland, road networks, and water networks, the tropical forests within the protected areas have been gradually fragmented and surrounded. The fragmentation phenomena have become increasingly evident, and isolated forest islands have lost their connections with each other [1]. The ability of the tropical rainforest ecosystem to maintain material cycling, energy balance [4], and species gene exchange has gradually decreased, further exacerbating the degradation of the tropical rainforest ecosystem [5,6], posing a serious threat to the ecological security pattern of Xishuangbanna [6,7,8]
The concept of ecological security aims to ensure the safety, health, and sustainable development of resources, environment, and ecosystem services. It seeks to strengthen beneficial ecological processes and control harmful ecological processes in order to explore pathways for ecological security [9]. The introduction of the concept of ecological security pattern is in line with the theoretical pursuit of reasonable regulation of ecological processes in ecological security research [5]. By constructing a regional ecological security pattern, effective regulation of ecological processes can be achieved, ensuring the full play of ecological functions and realizing the effective and rational allocation of regional natural resources and green infrastructure, thus guaranteeing the ecological and material well-being of necessary natural resources and ultimately achieving ecological security. Currently, it has become one of the important spatial approaches to alleviate the contradiction between ecological protection and economic development. The ecological security pattern of a region mainly concerns the stability of ecological source areas and landscape connectivity [10]. The Minimum Cumulative Resistance (MCR) model is the main method used to reflect the potential corridors for species migration. It can intuitively reflect the integrity and systemic characteristics of an ecosystem [11]. However, this method ignores the random walk of species and cannot specify the specific range and key nodes of corridors.
Currently, international research on ecological security patterns mainly focuses on aspects such as ecological networks and green infrastructure, and their protection systems are relatively complete and mature and are developing toward diversified objectives [12]. The study of ecological security patterns in China can be traced back to the 1990s [13]. In the early stages of the research, the regions studied for ecological security patterns were mainly nature reserves and scenic spots, with a relatively single objective of protecting biodiversity [14]. In recent years, research on ecological security patterns has gradually increased for economically rapidly developing areas [15,16], important water conservation areas [5], and ecologically fragile areas [17]. The research scope has shifted from a single species protection target to the construction of regional comprehensive ecological security patterns that simultaneously cover multiple objectives such as biodiversity protection, climate regulation, and cultural heritage. The spatial scale of research has also tended toward diversification, which has greatly enriched the connotation of ecological security patterns and promoted the further expansion of this research field, whether it is macro planning for various types of natural resources or micro-control of ecological processes specific to local and administrative units’ geographic conditions.
In 2007, the circuit theory, which originated from physics, was applied to the study of gene flow in different landscapes by [18]. According to the circuit theory, we can analogize ecological flow to electric current due to their shared characteristics of random walk. Therefore, ecological flow can be utilized to predict movement patterns in complex landscapes, assess the isolation between habitat patches, and identify significant landscape patches. Currently, circuit theory has been widely employed in ecological conservation analysis [19,20,21]. In this case, circuit theory provides a suitable research method for constructing the ecological security pattern [22]. Currently, research related to the ecological security pattern mainly focuses on the administrative space of counties, cities, or watersheds [23,24,25]. The scale of spatial ecological restoration has shifted from improving the health of local ecosystems to shaping multi-scale ecological security patterns [26], incorporating all important ecological functional and fragile sensitive areas that need to be protected and reasonably utilized into the scope of natural ecological spaces, enabling effective inter-regional connections of natural ecological spaces. From the perspective of maintaining regional ecosystem security and quality, identifying natural ecological spaces, clarifying the layout of ecological spaces that need protection at all levels, and implementing differentiated management and control have become inevitable requirements for ecological civilization construction.
As an important part of China’s forests, the tropical rainforests in Xishuangbanna are often investigated from a single perspective, such as land use and forestry. Research institutions tend to focus on specific research objectives, conducting “point” work, thus lacking comprehensive planning for the structural layout of conservation spaces. In addition, compared to the extensive research on ecological security patterns in areas with intense human activities [27,28,29], there is relatively less research on the conservation security patterns of biological species in natural regions such as forests and grasslands [5]. This study combines the natural environmental characteristics of the Xishuangbanna tropical rainforest, evaluates the ecological importance of selecting ecological source areas, adjusts resistance values using ecological sensitivity results, extracts ecological corridors using circuit theory models, and constructs an ecological security pattern. This pattern strengthens the identification and protection of key areas, adhering to the concept that “mountains, rivers, forests, farmlands, lakes, and grasslands form a community of life,” providing a scientific basis for further promoting the authenticity, integrity, and diversity of the tropical rainforest ecosystem’s protection.

2. Data and Methods

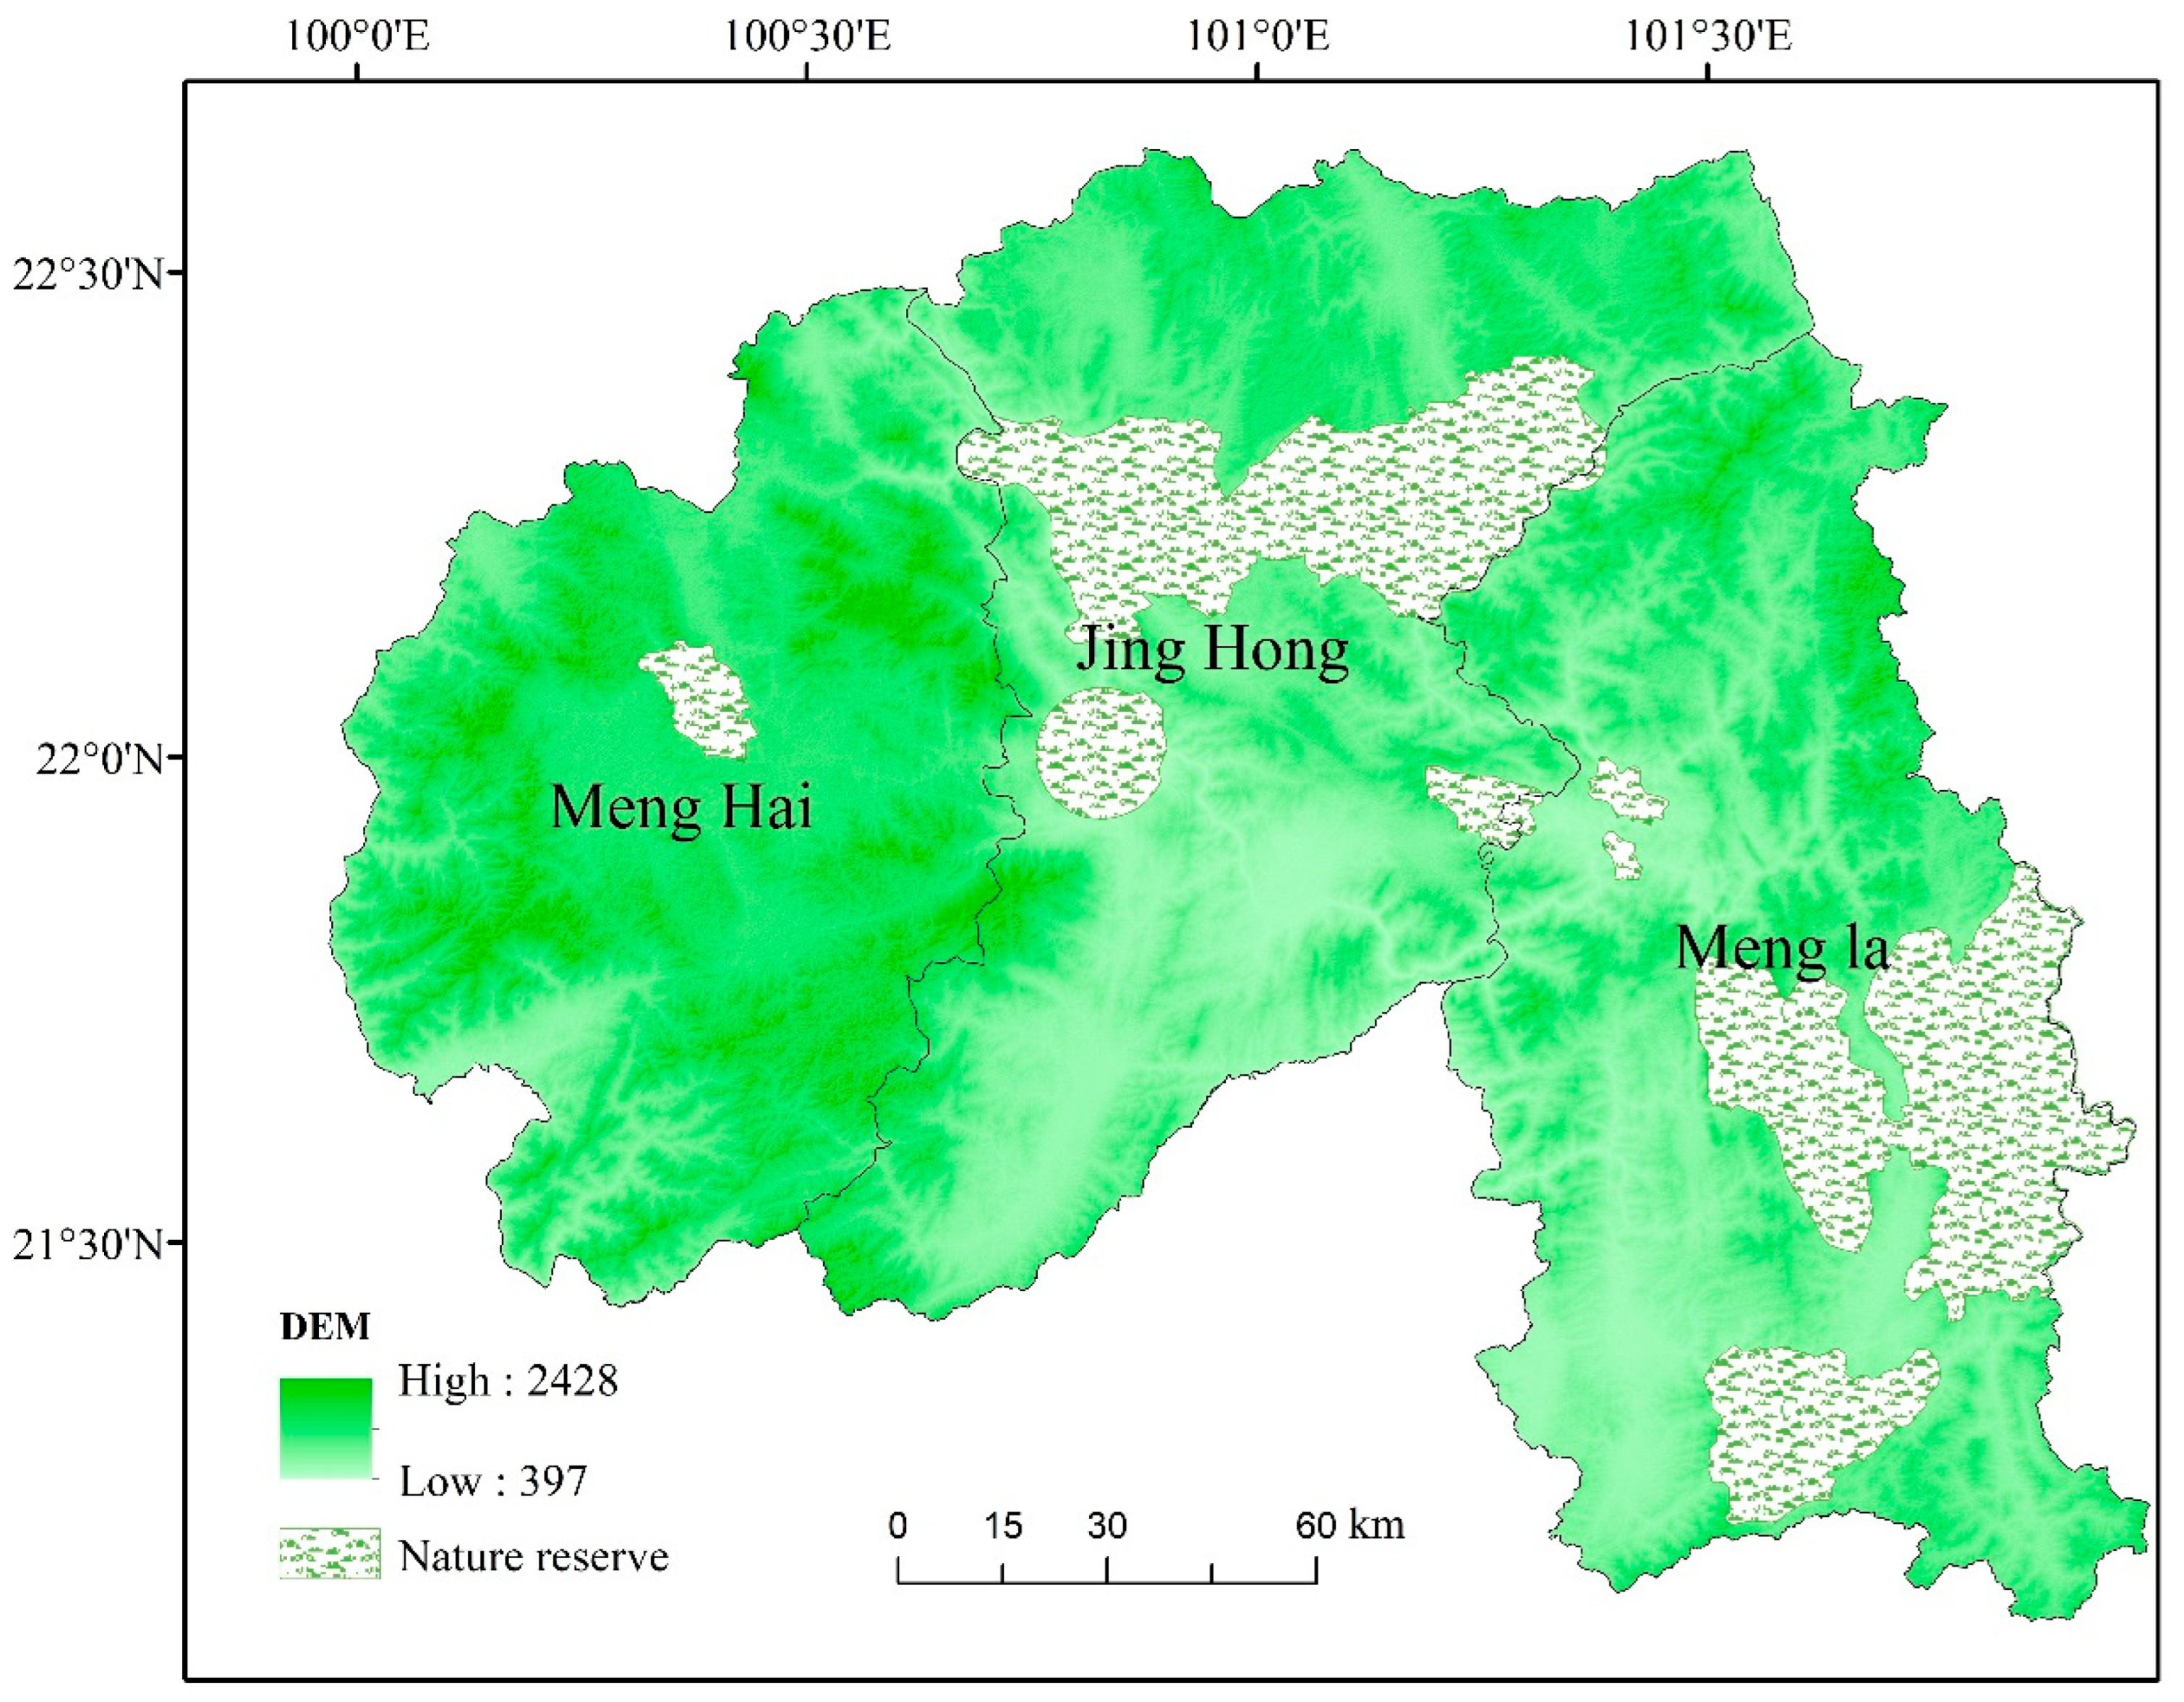
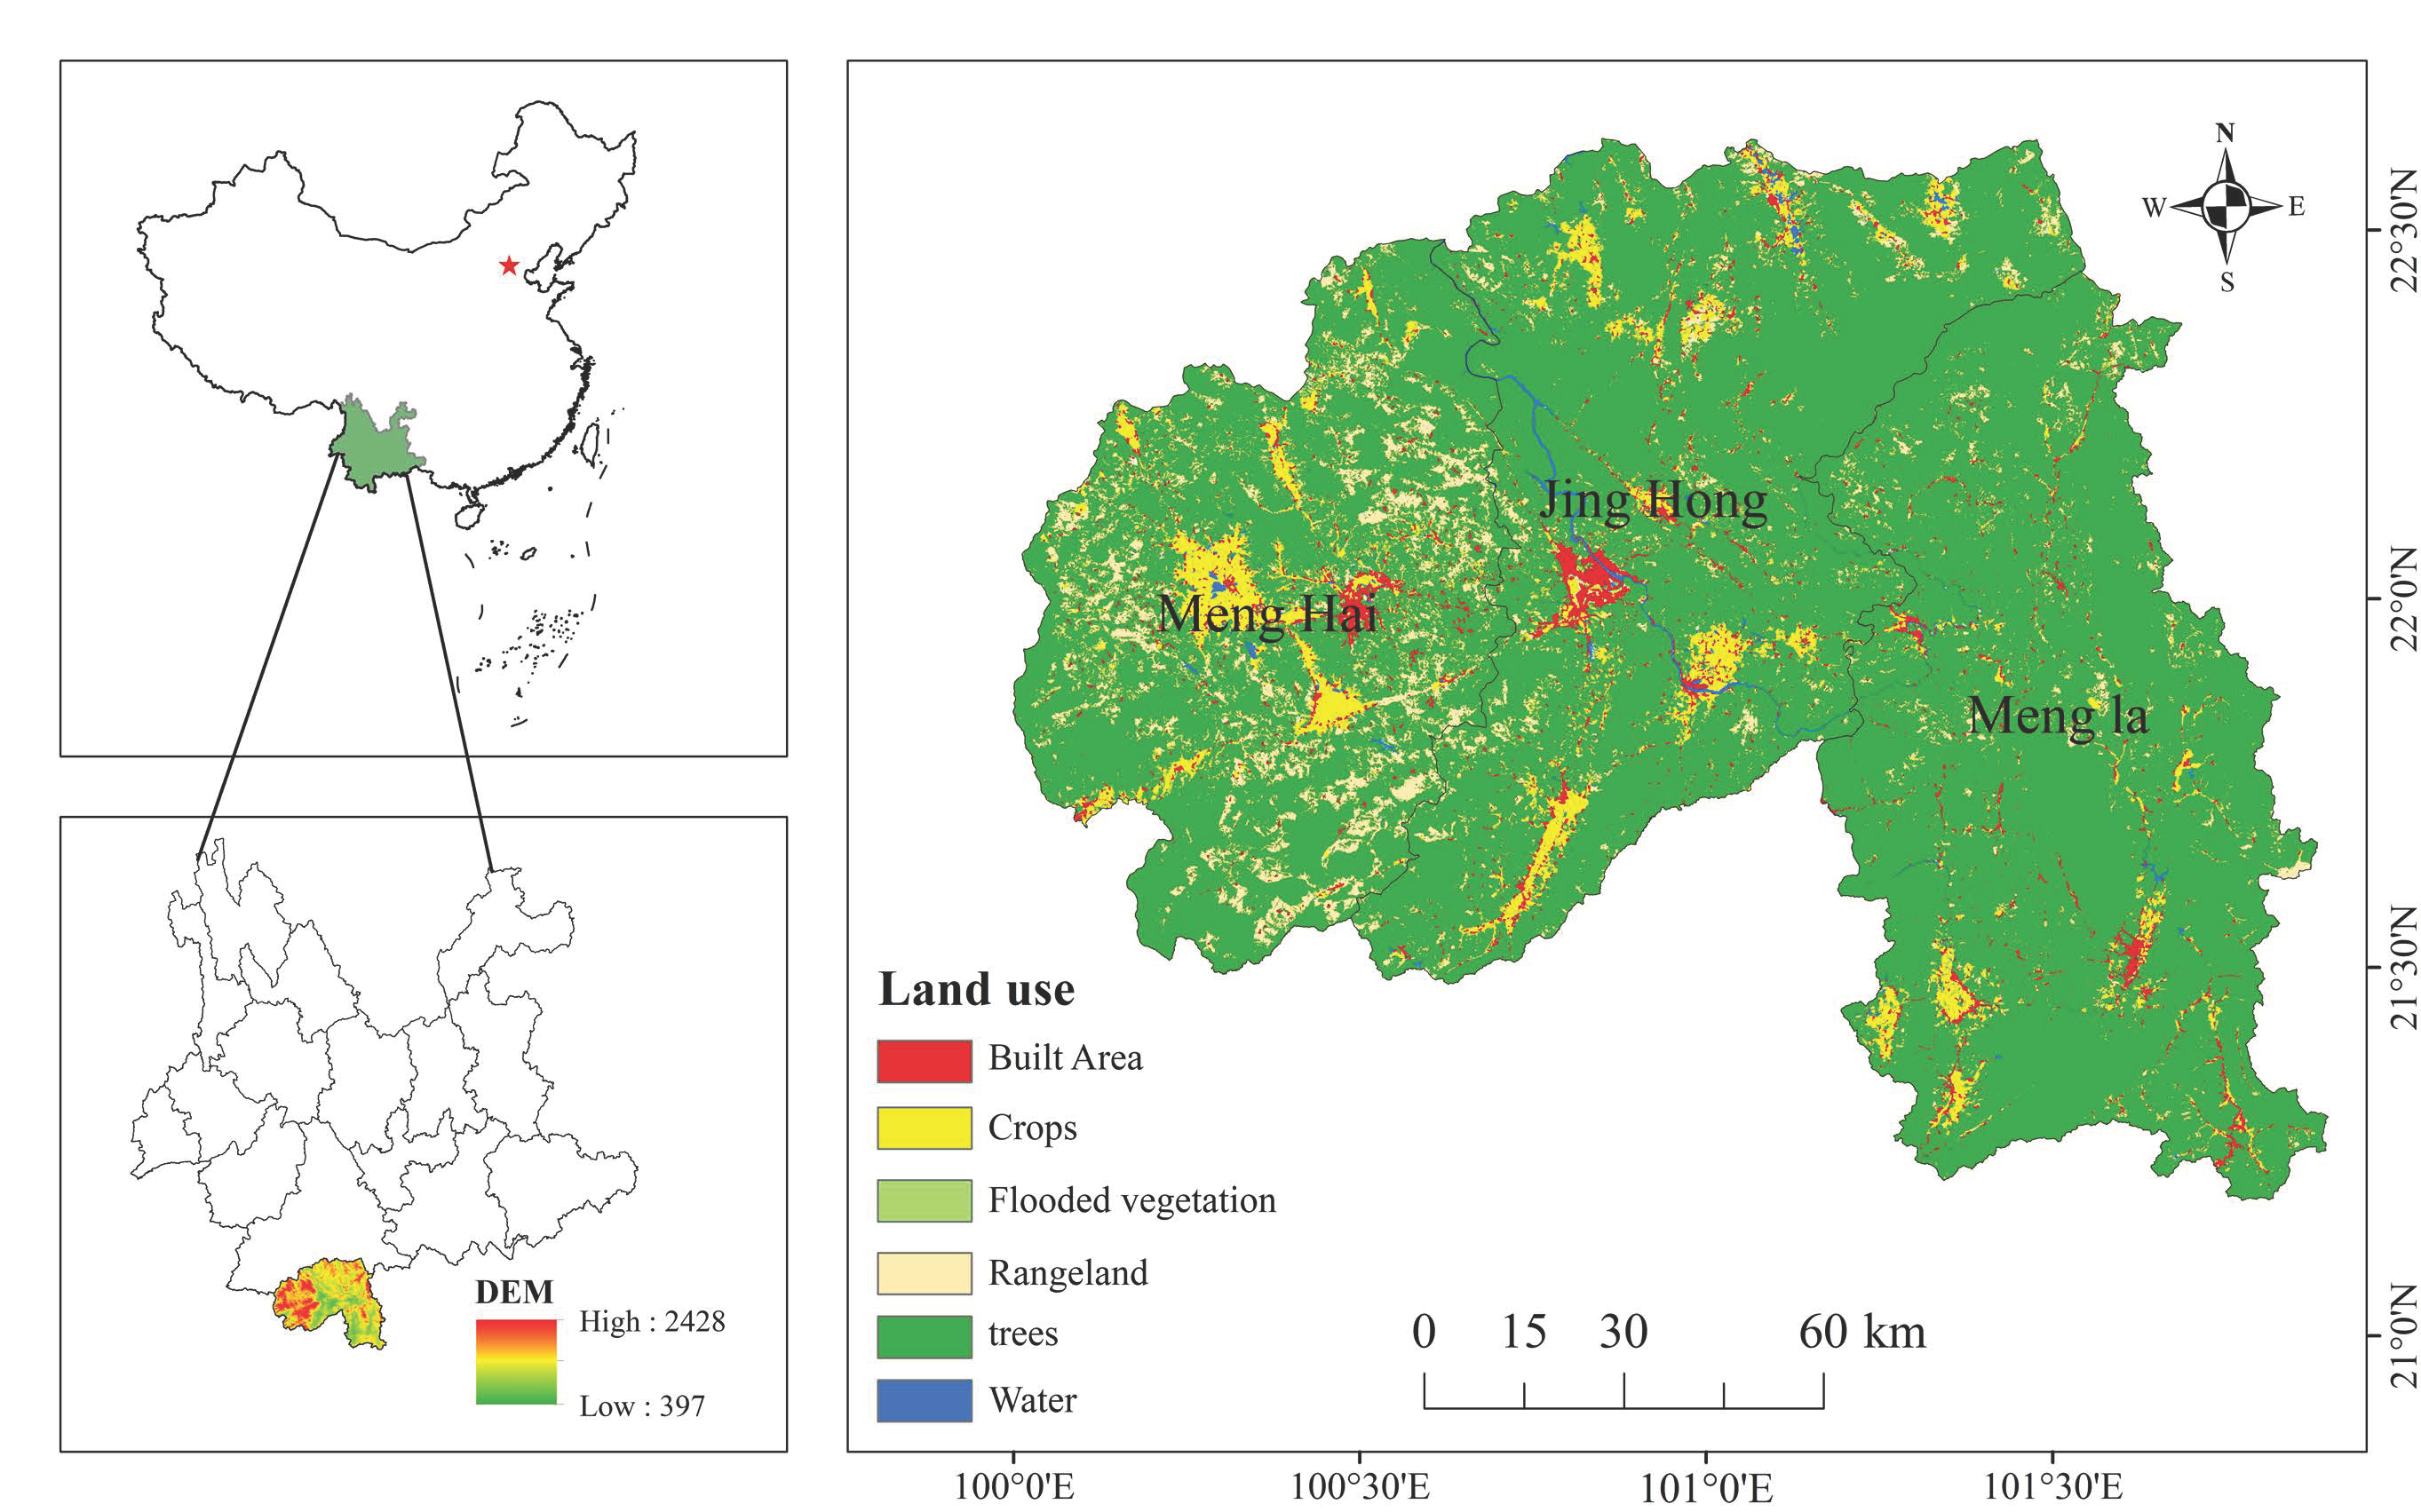
2.1. Overview of the Research Area

The Xishuangbanna region is located on the southern edge of Yunnan Province, China (21°08′–22°36′ N, 99°56′–101°50′ E), bordering Laos and Myanmar and neighboring Thailand and Vietnam. The total area is approximately 19,674 km2 (Figure 1). Xishuangbanna boasts the largest preserved tropical rainforest in China, which is also the northernmost distribution of tropical rainforests on Earth. It is also the region with the most diverse tropical forest ecosystem types in China (Zhu et al., 2006 [6]; Li et al., 2008 [7]; Liu et al., 2002 [8]). The terrain in the area varies greatly, with a relative height difference of about 2000 m. The topography is generally divided by the Lancang River, with mountainous, hilly, and plain landscapes to the east of the river and wide valleys and plateaus to the west. Xishuangbanna belongs to the tropical humid zone south of the Tropic of Cancer, with an average annual temperature above 20 °C and an average annual rainfall of 1500–2000 mm. The relative humidity of the air is mostly over 80%, and the warm, humid, and windless climate is conducive to the growth of tropical vegetation. It is a national-level nature reserve for tropical rainforests in China and the second-largest natural rubber production base and Pu’er tea origin in China.

2.2. Data Source

This study involves five key types of data: ① NPP data are sourced from the MOD17A2 observation product on the official website of NASA (https://wwwnasa.gov accessed on 20 August 2023), with a time scale from 2019 to 2022 and a spatial resolution of 500 m; ② Temperature and precipitation data are sourced from the China Meteorological Science Data Sharing Service Network (http://data.cma.cn/ accessed on 20 September 2023), using hourly observation data from meteorological stations, with a time scale from 2010 to 2020; ③ Land use/land cover data are sourced from Sentinel-2 Land Cover Explorer (https://livingatlas.arcgis.com/landcoverexplorer accessed on 20 August 2023) with a spatial resolution of 10 m.; ④ Digital elevation data are sourced from the Geographic Spatial Data Cloud (http://www.gscloud.cn accessed on 1 July 2023), with a spatial resolution of 30 m and a time scale of 2022. ⑤ Basic geographic data, including administrative boundaries and hydrological data, are sourced from the National Basic Geographic Information Center (https://www.ngcc.cn/ngcc accessed on 1 July 2023). All data are processed using ArcMap 10.8, with coordinates unified as WGS_1984 and projected as WGS_1984_UTM_Zone_47N. The spatial resolution is uniformly set to 30 m.

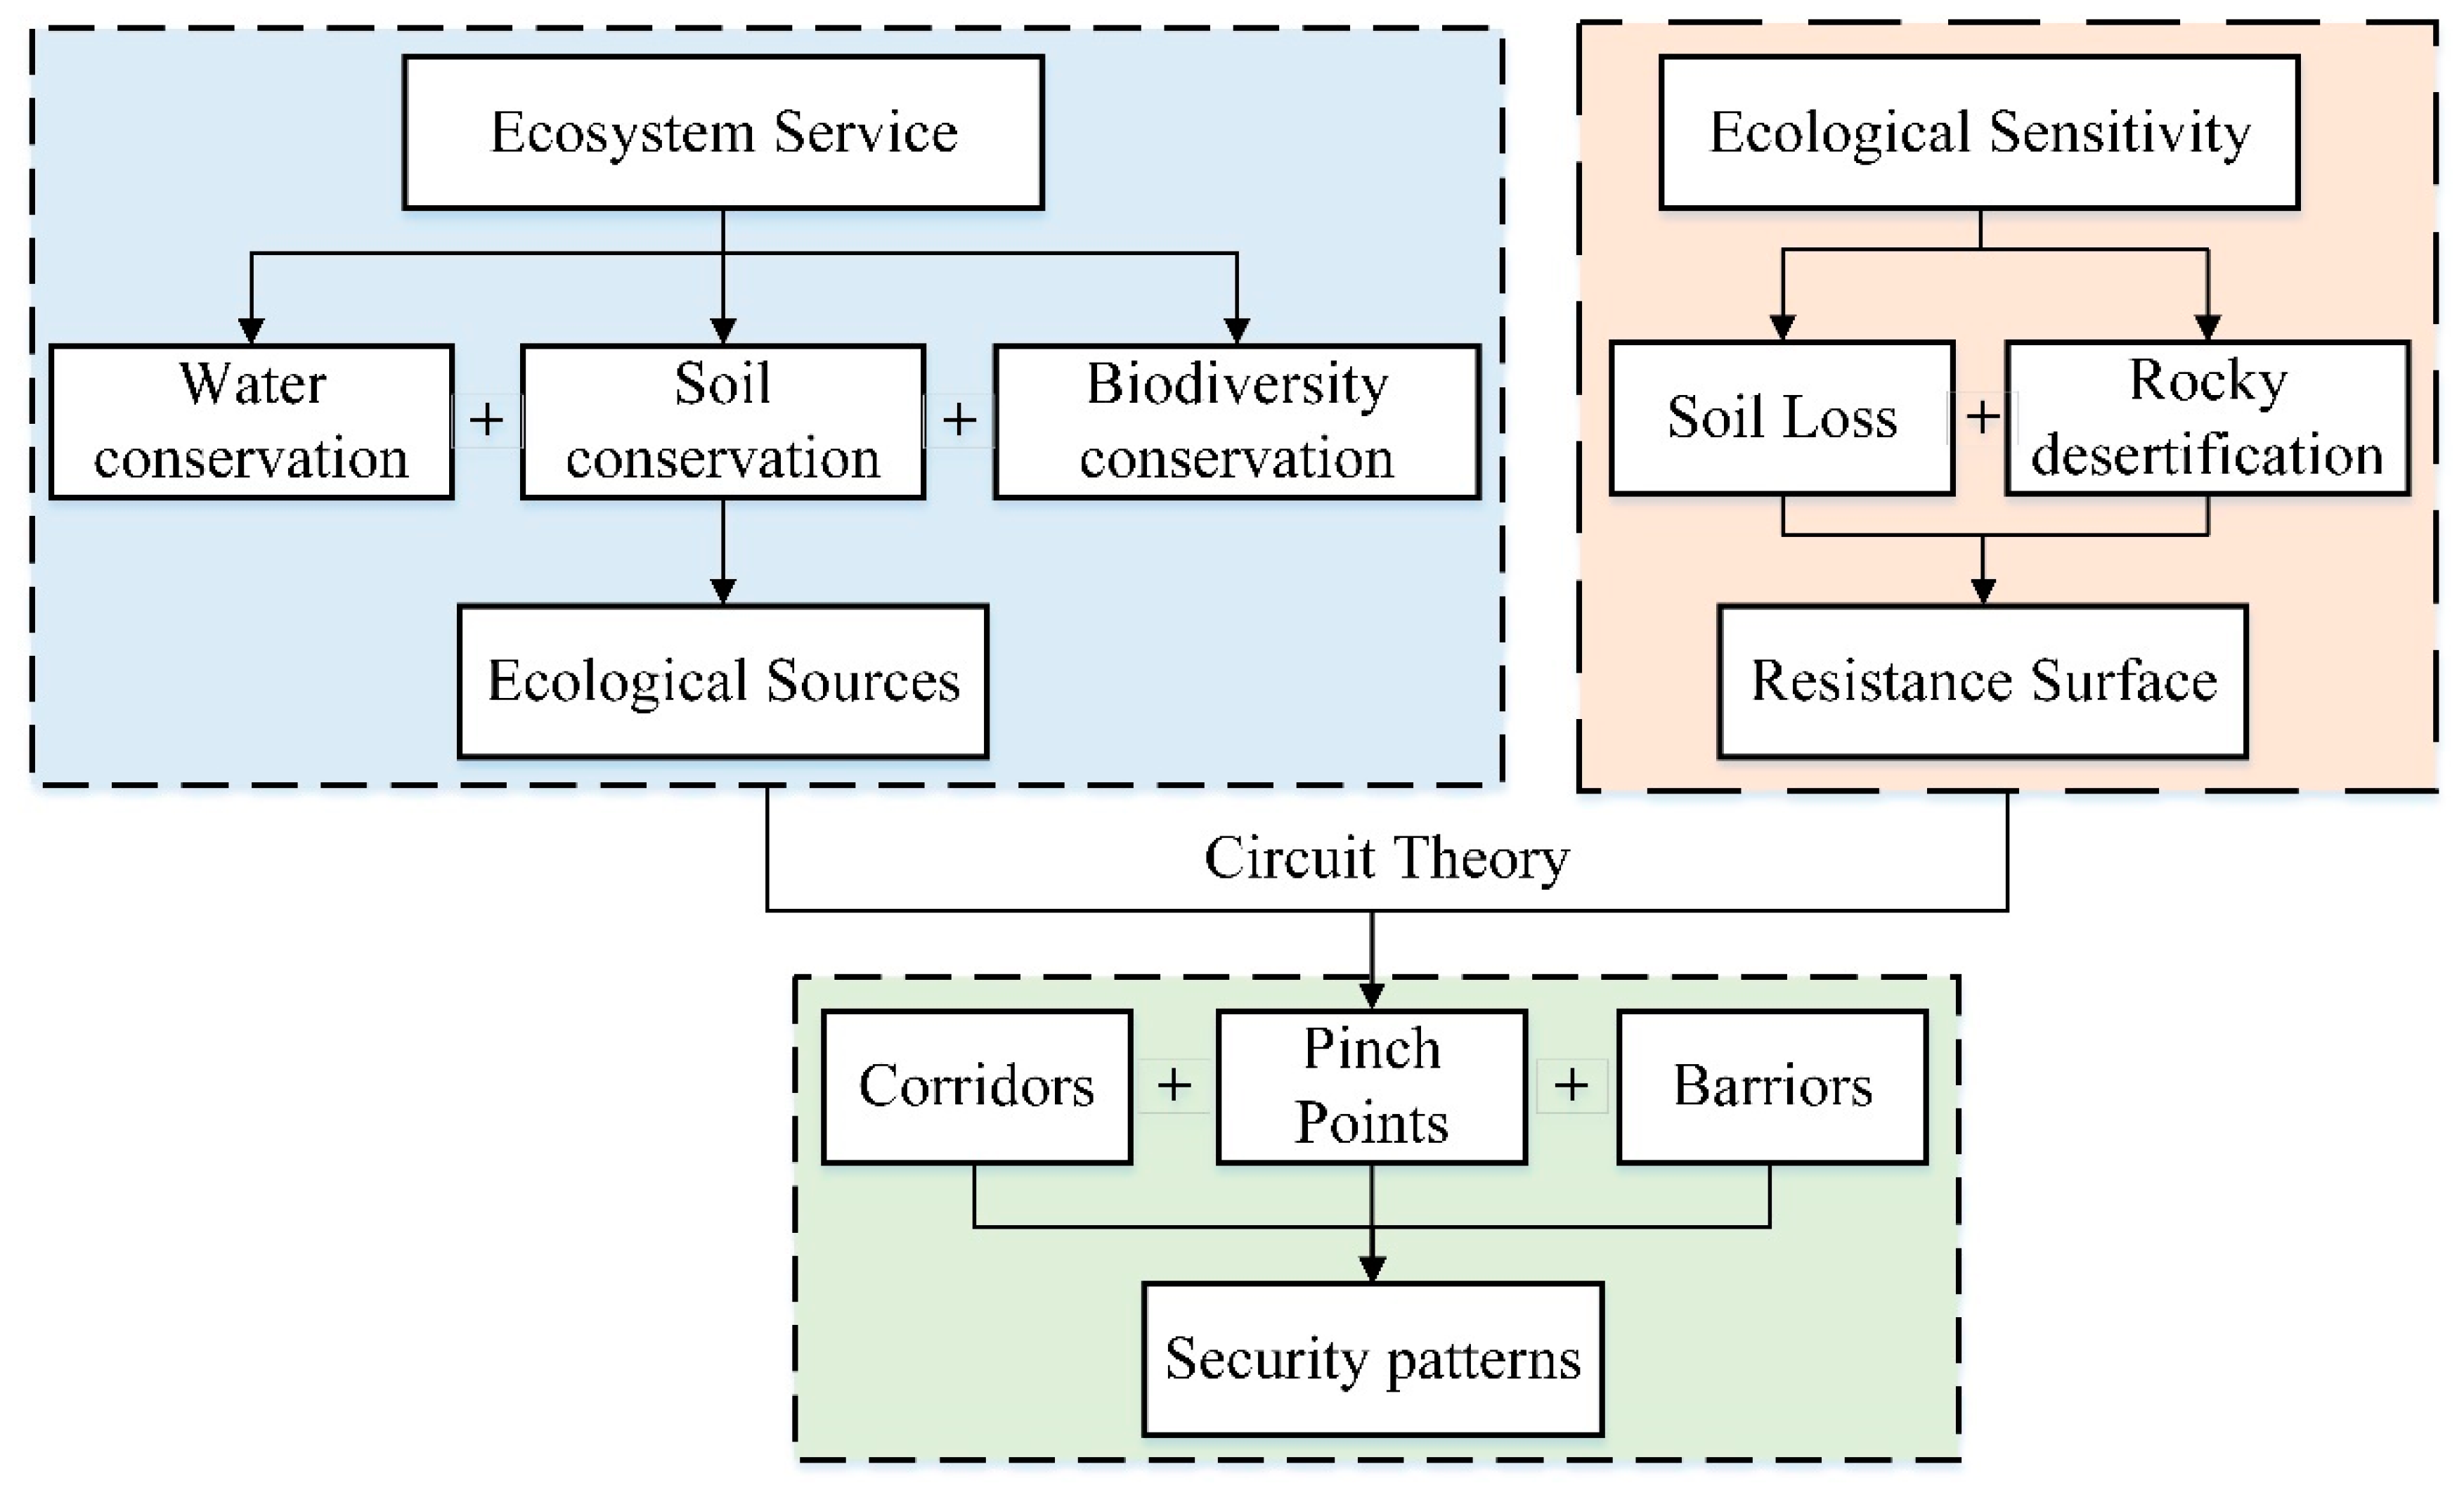
2.3. Research Framework

By recognizing the importance of natural ecosystem services and regional ecological sensitivity, ecologically significant areas that provide crucial ecosystem services are designated as ecological source areas. The resistance values are adjusted based on the ecological sensitivity of each region. Additionally, by applying circuit theory models to identify ecological corridors, ecological pinch points, and ecological barriers, a natural ecological security pattern is established for the Xishuangbanna tropical rainforest. Key protection measures are implemented in ecological pinch-point areas, while targeted restoration efforts are carried out in ecological barrier areas to improve landscape connectivity. This, in turn, guides the optimization of the ecological–production–living space and the governance of the mountain–water–forest–field–lake–grass system, enhancing the regional ecosystem services (Figure 2). By constructing an ecological security pattern, concrete approaches are provided for the conservation of the Xishuangbanna rainforest.

2.4. Research Methods

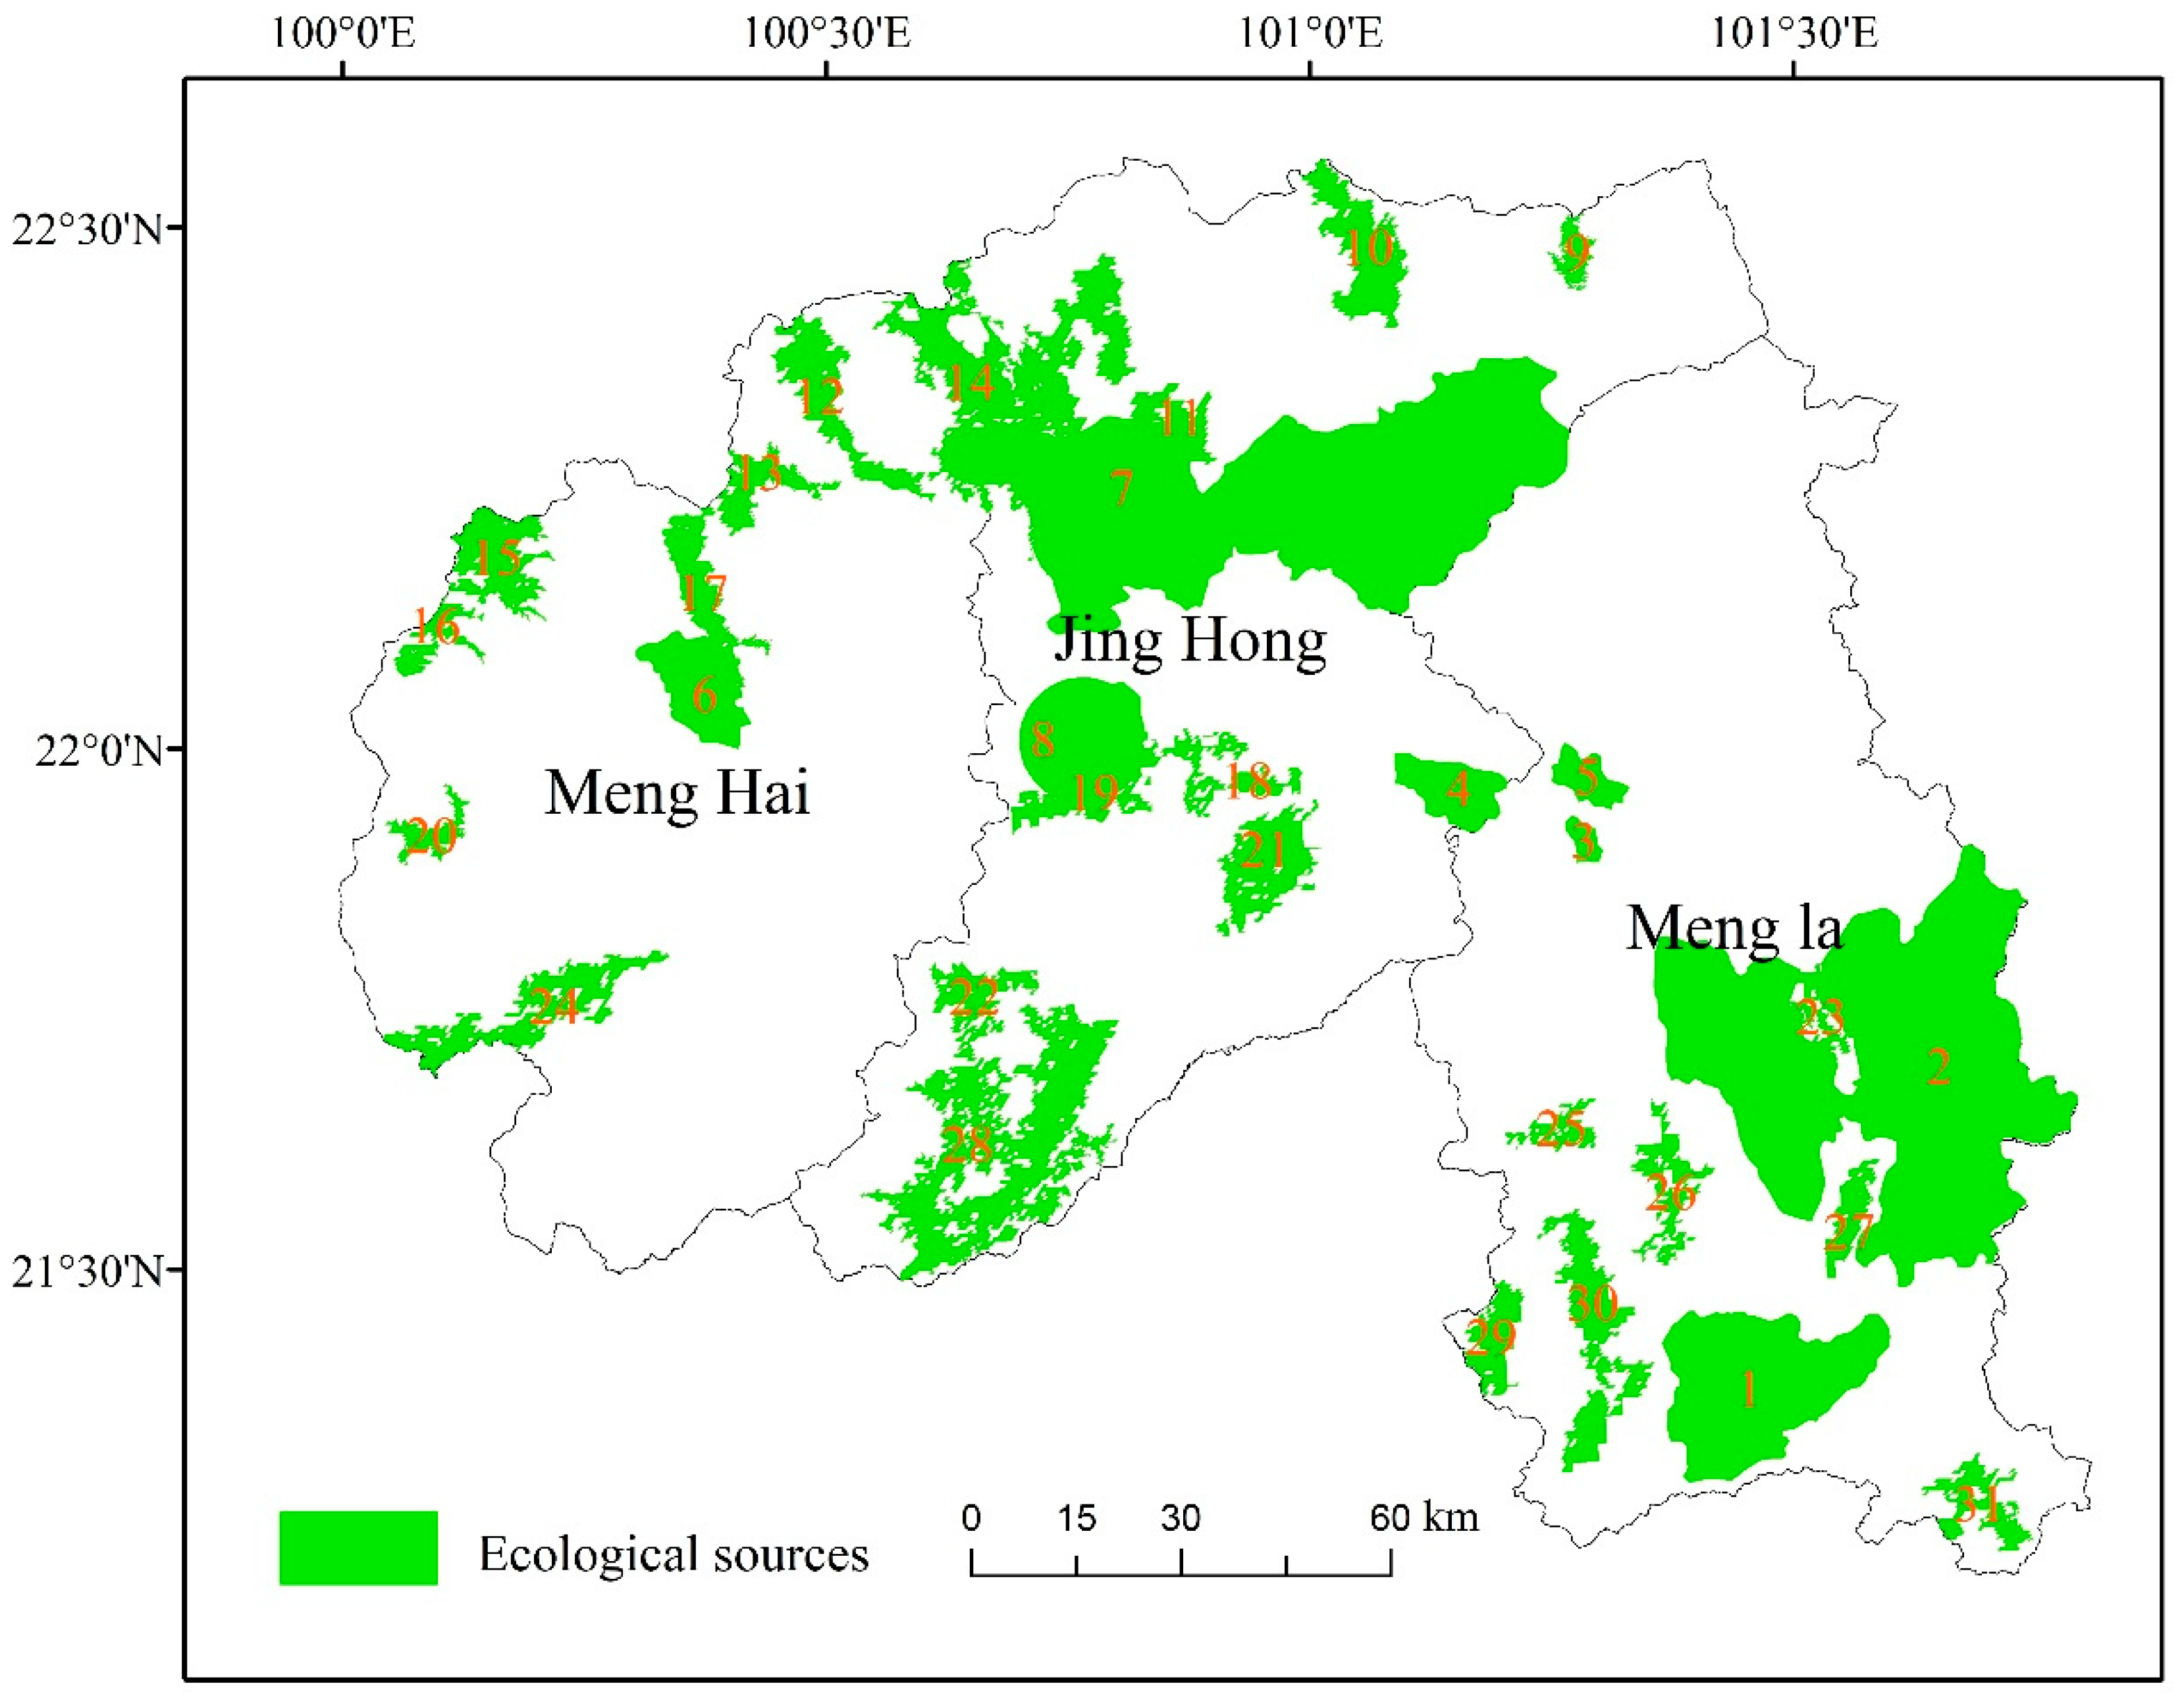
2.4.1. Ecological Source Identification

Ecological source refers to the habitat of existing local species and the focal points for dispersal and maintenance. They play a decisive role in regional ecological processes and functions and are of great significance for regional ecological security or bear important radiative functions. Xishuangbanna tropical rainforest is extremely fragile, with marginal characteristics in terms of latitude distribution, altitude, and hydrothermal conditions, and is highly susceptible to environmental changes and human disturbance. Therefore, combining the ecological conditions of the study area, three indicators, including water conservation, soil conservation, and biodiversity, were selected to evaluate the importance of its ecosystem services [30]. The single-factor evaluation results of the three indicators in the Geographic Information System (GIS) were analyzed through spatial overlay analysis. The final results were classified into three levels: moderately important; relatively important; and highly important, using the natural breaks method. Fragments with an area larger than 50 km2 in the highly important areas were selected as ecological source areas. The specific process of indicator calculation is as follows:
(1) Water Conservation Function Evaluation
Water conservation is the interaction between ecosystems (such as forests, grasslands, etc.) and water through their unique structures that intercept, infiltrate, and store precipitation. It regulates water flow and cycle by evapotranspiration, mainly manifested in mitigating surface runoff, supplementing groundwater, reducing seasonal fluctuations in river flow, flood control, drought relief, and ensuring water quality. This index can be used to identify key areas with the ability to undertake water conservation functions currently and in the future.
The essence of the water conservation function is the complex process of redistributing rainfall by vegetation layer, litter layer, and soil layer [31]. Its main functions include increasing available water resources, regulating runoff and sediment, and purifying water quality. The evaluation of the water conservation function is to evaluate the ability to ensure water resources and flood control and storage capacity in the region. The ecological system water conservation service index is used as the evaluation index, and the calculation formula is
W R = N P P m e a n × F s i c × F p r e × 1 F s l o
where W R represents the index of ecosystem water conservation service capacity; N P P m e a n represents the average long-term net primary productivity of vegetation; F s i c represents the soil infiltration factor; F p r e represents the factor of average annual precipitation, and F s l o represents the slope factor;
(2) Evaluation of soil and water conservation functions
Soil and water conservation refers to the role of ecosystems (such as forests, grasslands, etc.) in reducing soil erosion caused by water erosion through their structure and processes. Its main tasks include preventing and controlling soil and water loss, protecting, improving, and rational use of soil and water resources, and establishing a good ecological environment. It supports sustainable development and, through this indicator evaluation, identifies key areas for current and future soil and water conservation functions. The soil and water conservation function is mainly related to climate, soil, topography, and vegetation.
S p r o = N P P m e a n × 1 K × 1 F s l o
where S p r o is the index of soil conservation service capacity of the ecosystem; N P P m e a n is the average annual net primary productivity of vegetation; F s l o is the slope factor, and K is the soil erodibility factor;
(3) Assessment of Biodiversity Maintenance Functions.
The maintenance function of biodiversity refers to the role played by ecosystems in maintaining species and genetic diversity. Through the evaluation of this indicator, key areas that can support regional biodiversity maintenance functions (including ecosystem diversity, species diversity, and genetic diversity) can be identified for both current and future needs. When using the Biodiversity Conservation Service Capacity Index as an evaluation indicator, the calculation formula is
S b i o = N P P m e a n × F p r e × F t e m × 1 F a l t
where S b i o represents the Biodiversity Conservation Service Capacity Index; N P P m e a n refers to the average annual net primary productivity of vegetation over multiple years; F p r e represents the precipitation factor, calculated by interpolating the average annual precipitation data; F t e m represents the temperature factor; F a l t represents the elevation factor. All factors are normalized to a range from 0 to 1 for further processing.

2.4.2. Construction of Resistance Surface

Ecological resistance refers to the obstacles encountered in ecological processes such as material exchange, energy transfer, or biological migration between ecological source areas. The concept of ecological resistance reflects the resistance or difficulties faced by species when migrating between different landscape units [32]. A higher resistance coefficient indicates more difficulty in species migration and diffusion. In this study, based on the actual regional ecological environment, the resistance coefficient is modified through sensitivity assessment. Sensitivity analysis is conducted on two levels: soil erosion and rocky desertification, which are prone to trigger rainforest ecological crises. The results are spatially overlaid based on their weights. Using the natural breakpoint method in GIS, the overlaid results of these two types of sensitivities are divided into three levels: highly sensitive; moderately sensitive; and slightly sensitive. The calculation process of the indicators is as follows:
(1) Soil erosion sensitivity
According to the driving conditions of soil erosion, the main types of soil erosion are hydraulic erosion and wind erosion. This paper assesses the sensitivity of soil erosion mainly driven by hydraulic forces. Based on the basic principles of the Universal Soil Loss Equation, indicators such as precipitation erosivity, soil erodibility, slope length, and surface vegetation cover are selected. Using GIS technology, the single-factor evaluation data reflecting the sensitivity of each factor to soil erosion are multiplied, and the sensitivity of soil erosion is divided into three levels, namely, highly sensitive, moderately sensitive, and slightly sensitive, using the natural breakpoint method. The formula is as follows:
S S i = R i × K i × L S i × C i 4
where   S S i represents the sensitivity index of soil erosion in spatial unit i; R i denotes rainfall erosivity; K i represents soil erodibility; L S i represents slope length and steepness, and C i represents surface vegetation coverage;
(2) Sensitive assessment of rocky desertification.
A sensitive assessment of rocky desertification is conducted in order to identify areas prone to rocky desertification and evaluate the sensitivity of human activities to rocky desertification. Based on the formation mechanism of rocky desertification, factors such as the percentage of exposed carbonate rock area, terrain slope, and vegetation coverage are selected to construct the index system for assessing the sensitivity of rocky desertification. By using the spatial overlay function of GIS, the sensitivity distribution maps of each individual factor are multiplied to obtain the distribution map of rocky desertification sensitivity levels. The formula is as follows:
S i = D i × P i × C i 3
where S i represents the sensitivity index of desertification in the i-th assessment area; D i , P i , and C i respectively represent the percentage of exposed carbonate rock area, terrain slope, and vegetation coverage in the i-th assessment area.

2.4.3. Construction of Ecological Security Pattern

The construction of ecological security patterns can be regarded as the spatial recognition of key ecological elements, such as nodes, patches, corridors, and even the overall network for habitat restoration and reconstruction. By constructing regional ecological security patterns, effective control of specific ecological processes can be achieved, thus ensuring the full play of ecosystem functions and services. Currently, the construction mode of regional ecological security patterns is still being continuously improved with various indicators and methods, but an increasing number of studies are adopting a combination of “source-destination corridor” to identify and construct ecological security patterns, forming a preliminary construction paradigm for regional ecological security patterns. In general, the identification of ecological sources and the recognition of ecological corridors are two key links in the process of constructing ecological security patterns. At present, various quantitative identification methods for ecological corridors have been developed, such as the minimum cumulative resistance model [33], patch gravity model [34], and comprehensive evaluation index system [35]. Among them, the connectivity model based on circuit theory can effectively identify landscape elements and “pinch points” that have a significant impact on landscape connectivity through the calculation of current density, and the position of “pinch points” is not affected by the width of the corridor, which has obvious advantages in the research of corridor importance identification.
In physics, Ohm’s Law states that the current flowing through a conductor between two points is directly proportional to the voltage across the two points.
I = V R e f f
where I represents the current passing through the conductor; V represents the voltage measured across the conductor; R e f f is the effective resistance of the conductor (or multiple conductors). In ecology, R e f f is considered as an indicator reflecting spatial isolation between nodes, while I reflects the ecological flow and can be used to predict the probability of gene flow or species migration [36]. The basic principle of the connectivity model based on circuit theory is that in a circuit, the movement of charges is in a random state, and the movement of biological flows in nature exhibits similarities with the flow of charges. There is an analogy between circuit theory and Ohm’s law in ecology (Table 1). In circuit theory, Ohm’s law describes the relationship between current, voltage, and resistance, i.e., current equals voltage divided by resistance. Similarly, in ecological circuit theory, the concept of Ohm’s law is applied to describe phenomena such as species migration and gene flow in ecological systems [37]. By connecting circuit theory with movement ecology through the theory of random walks, this model treats landscapes as conductive surfaces and species in complex landscapes as random walkers. Land use/land cover types that facilitate certain ecological processes (such as species migration or dispersal) are assigned lower resistance, while land use/land cover types that hinder such ecological processes are assigned higher resistance. Consequently, heterogeneous landscapes are abstracted as circuits composed of a series of nodes and resistors, where nodes can represent habitats, populations, or protected areas [38].

3. Results

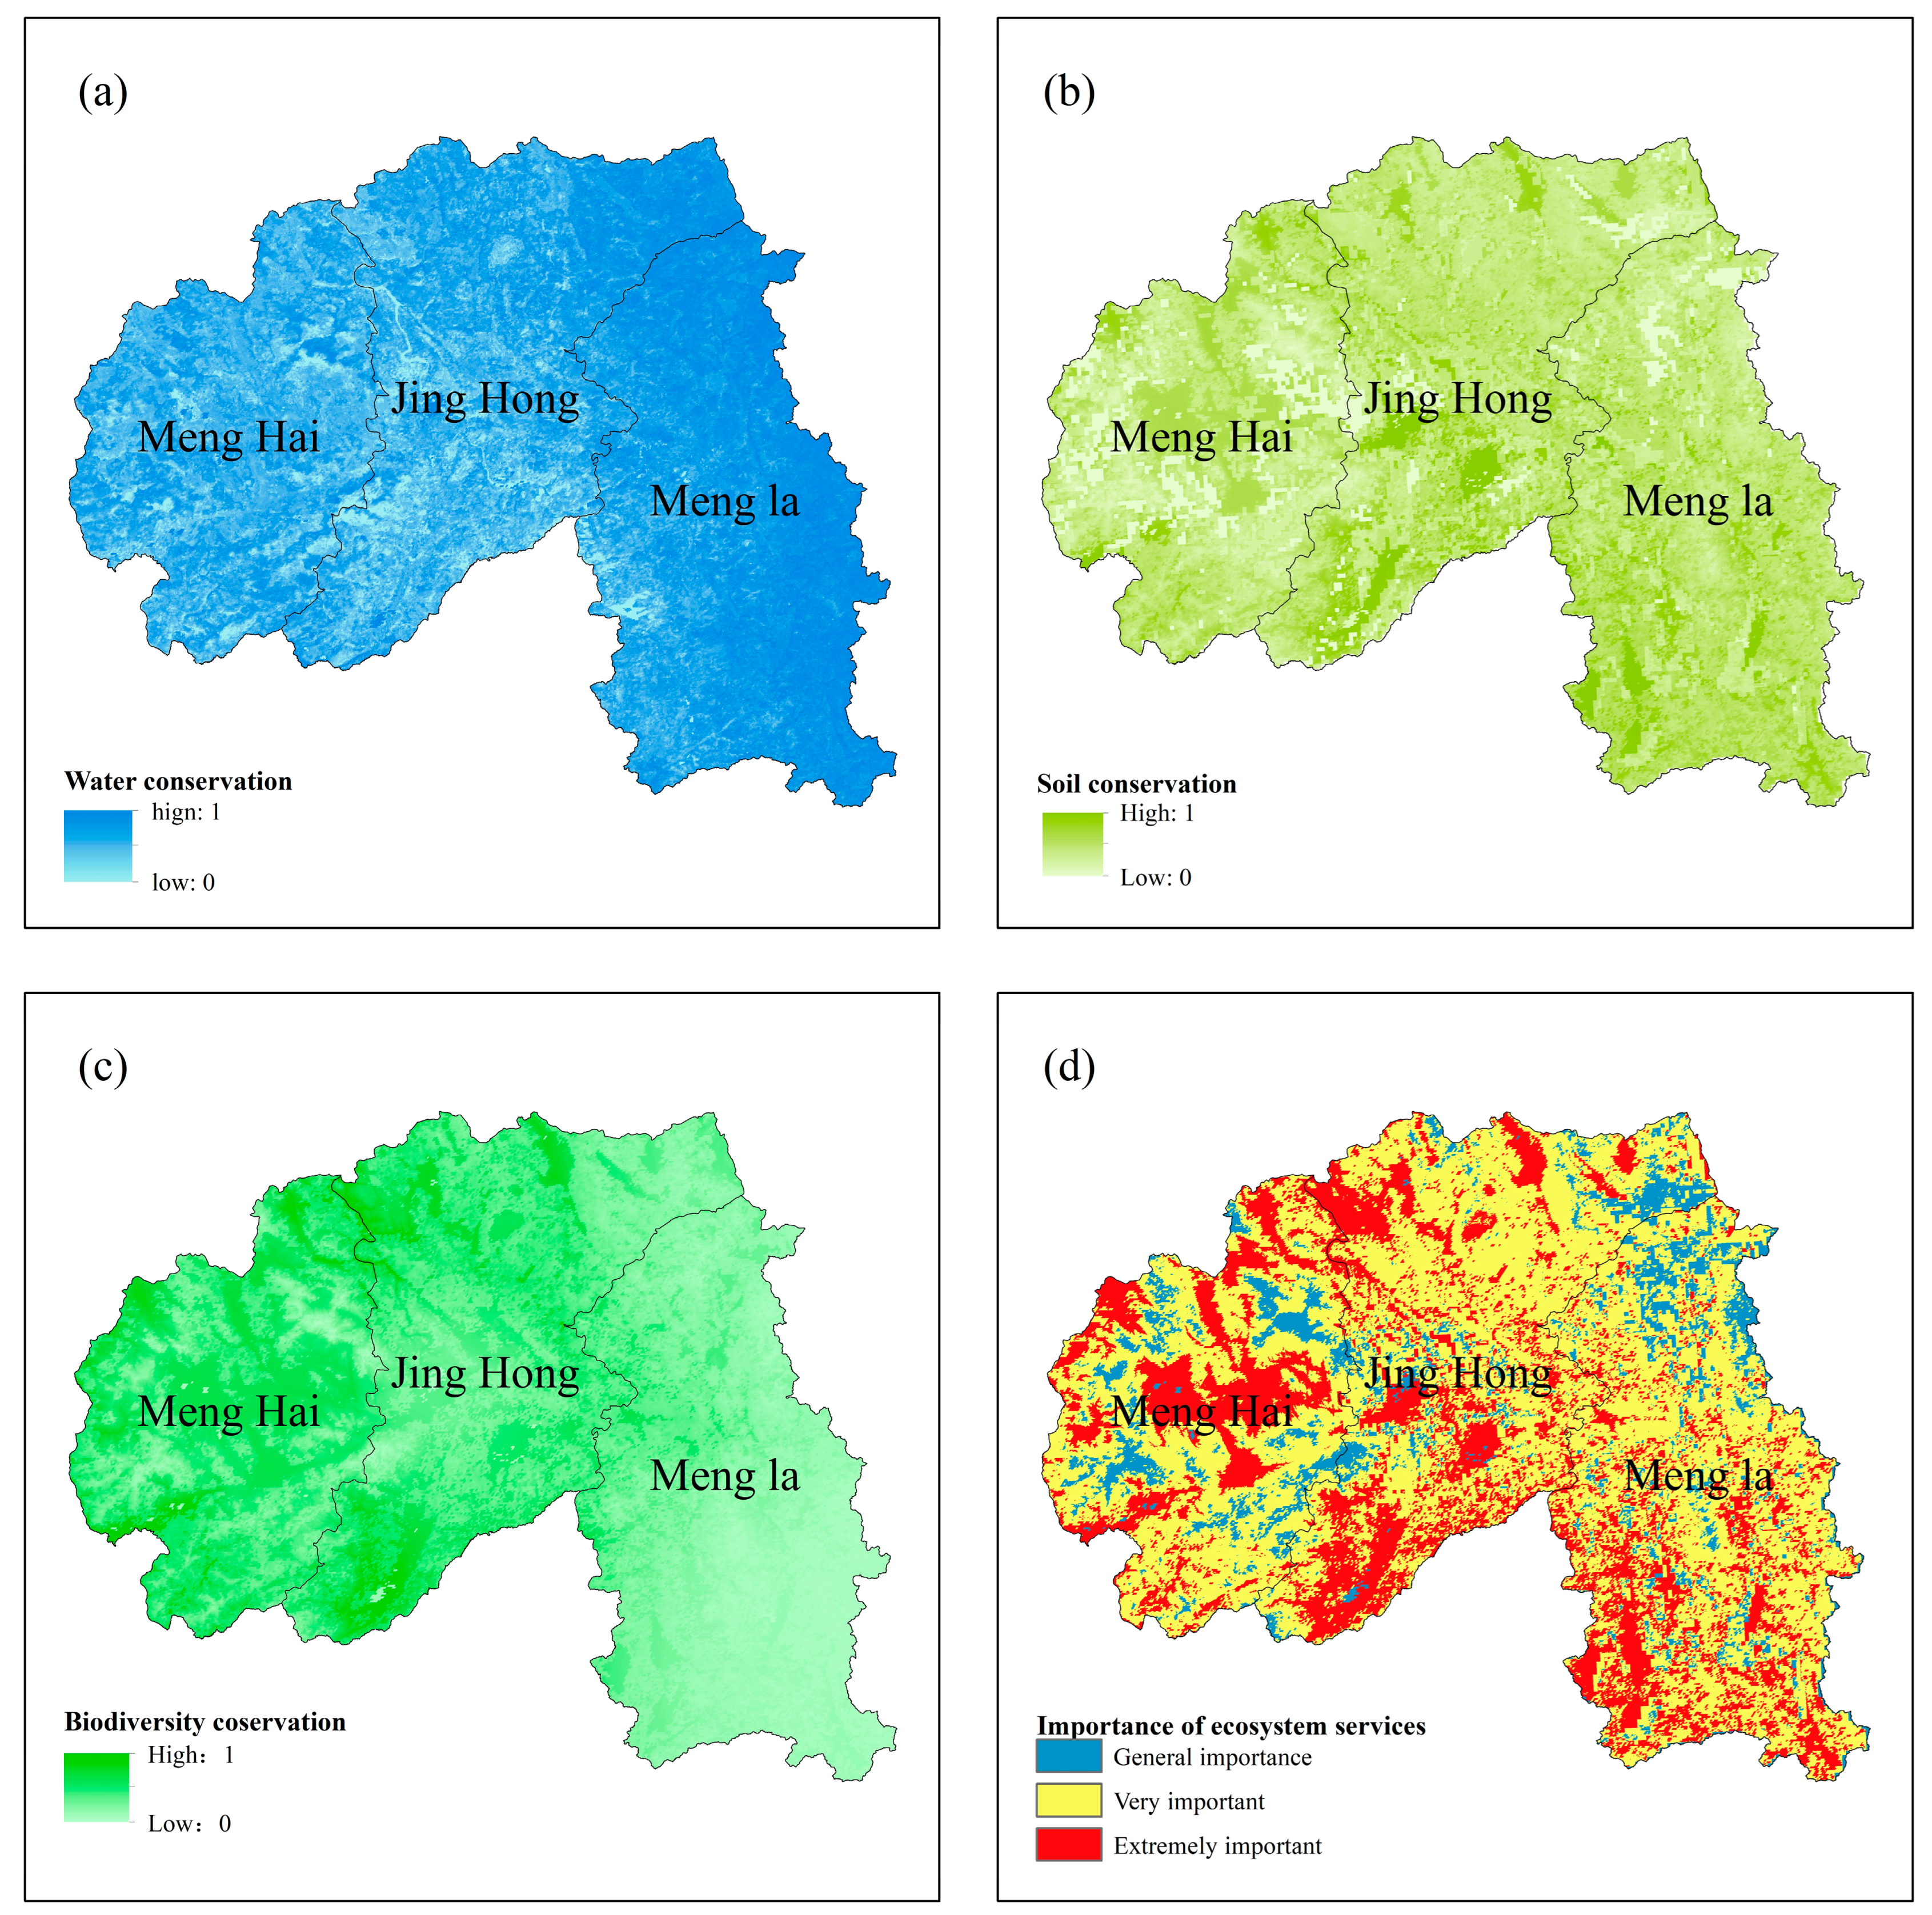
3.1. Assessment of the Importance of Ecosystem Services

According to the analysis, the regions with high importance of ecosystem services in the Xishuangbanna tropical rainforest are mainly distributed in the southern and western fringe areas (Figure 3). The proportions of extremely important regions for ecosystem services in Menghai, Jinghong, and Mengla are 19.35%, 46.15%, and 34.32%, respectively. The proportions of moderately important regions for ecosystem services in Menghai, Jinghong, and Mengla are 30.50%, 31.37%, and 38.13%, respectively. The proportions of generally important regions for ecosystem services in Menghai, Jinghong, and Mengla are 29.23%, 36.57%, and 34.20%, respectively (Table 2). Overall, Jinghong City has a dominant presence of extremely important types of ecosystem services, showing a symmetrical distribution between the north and south. Menghai County is mainly characterized by moderately important and important types, with a relatively small proportion of extremely important regions. Mengla County has extremely important and moderately important regions concentrated in the southern part of the county, while the northern part is mainly characterized by generally important regions.

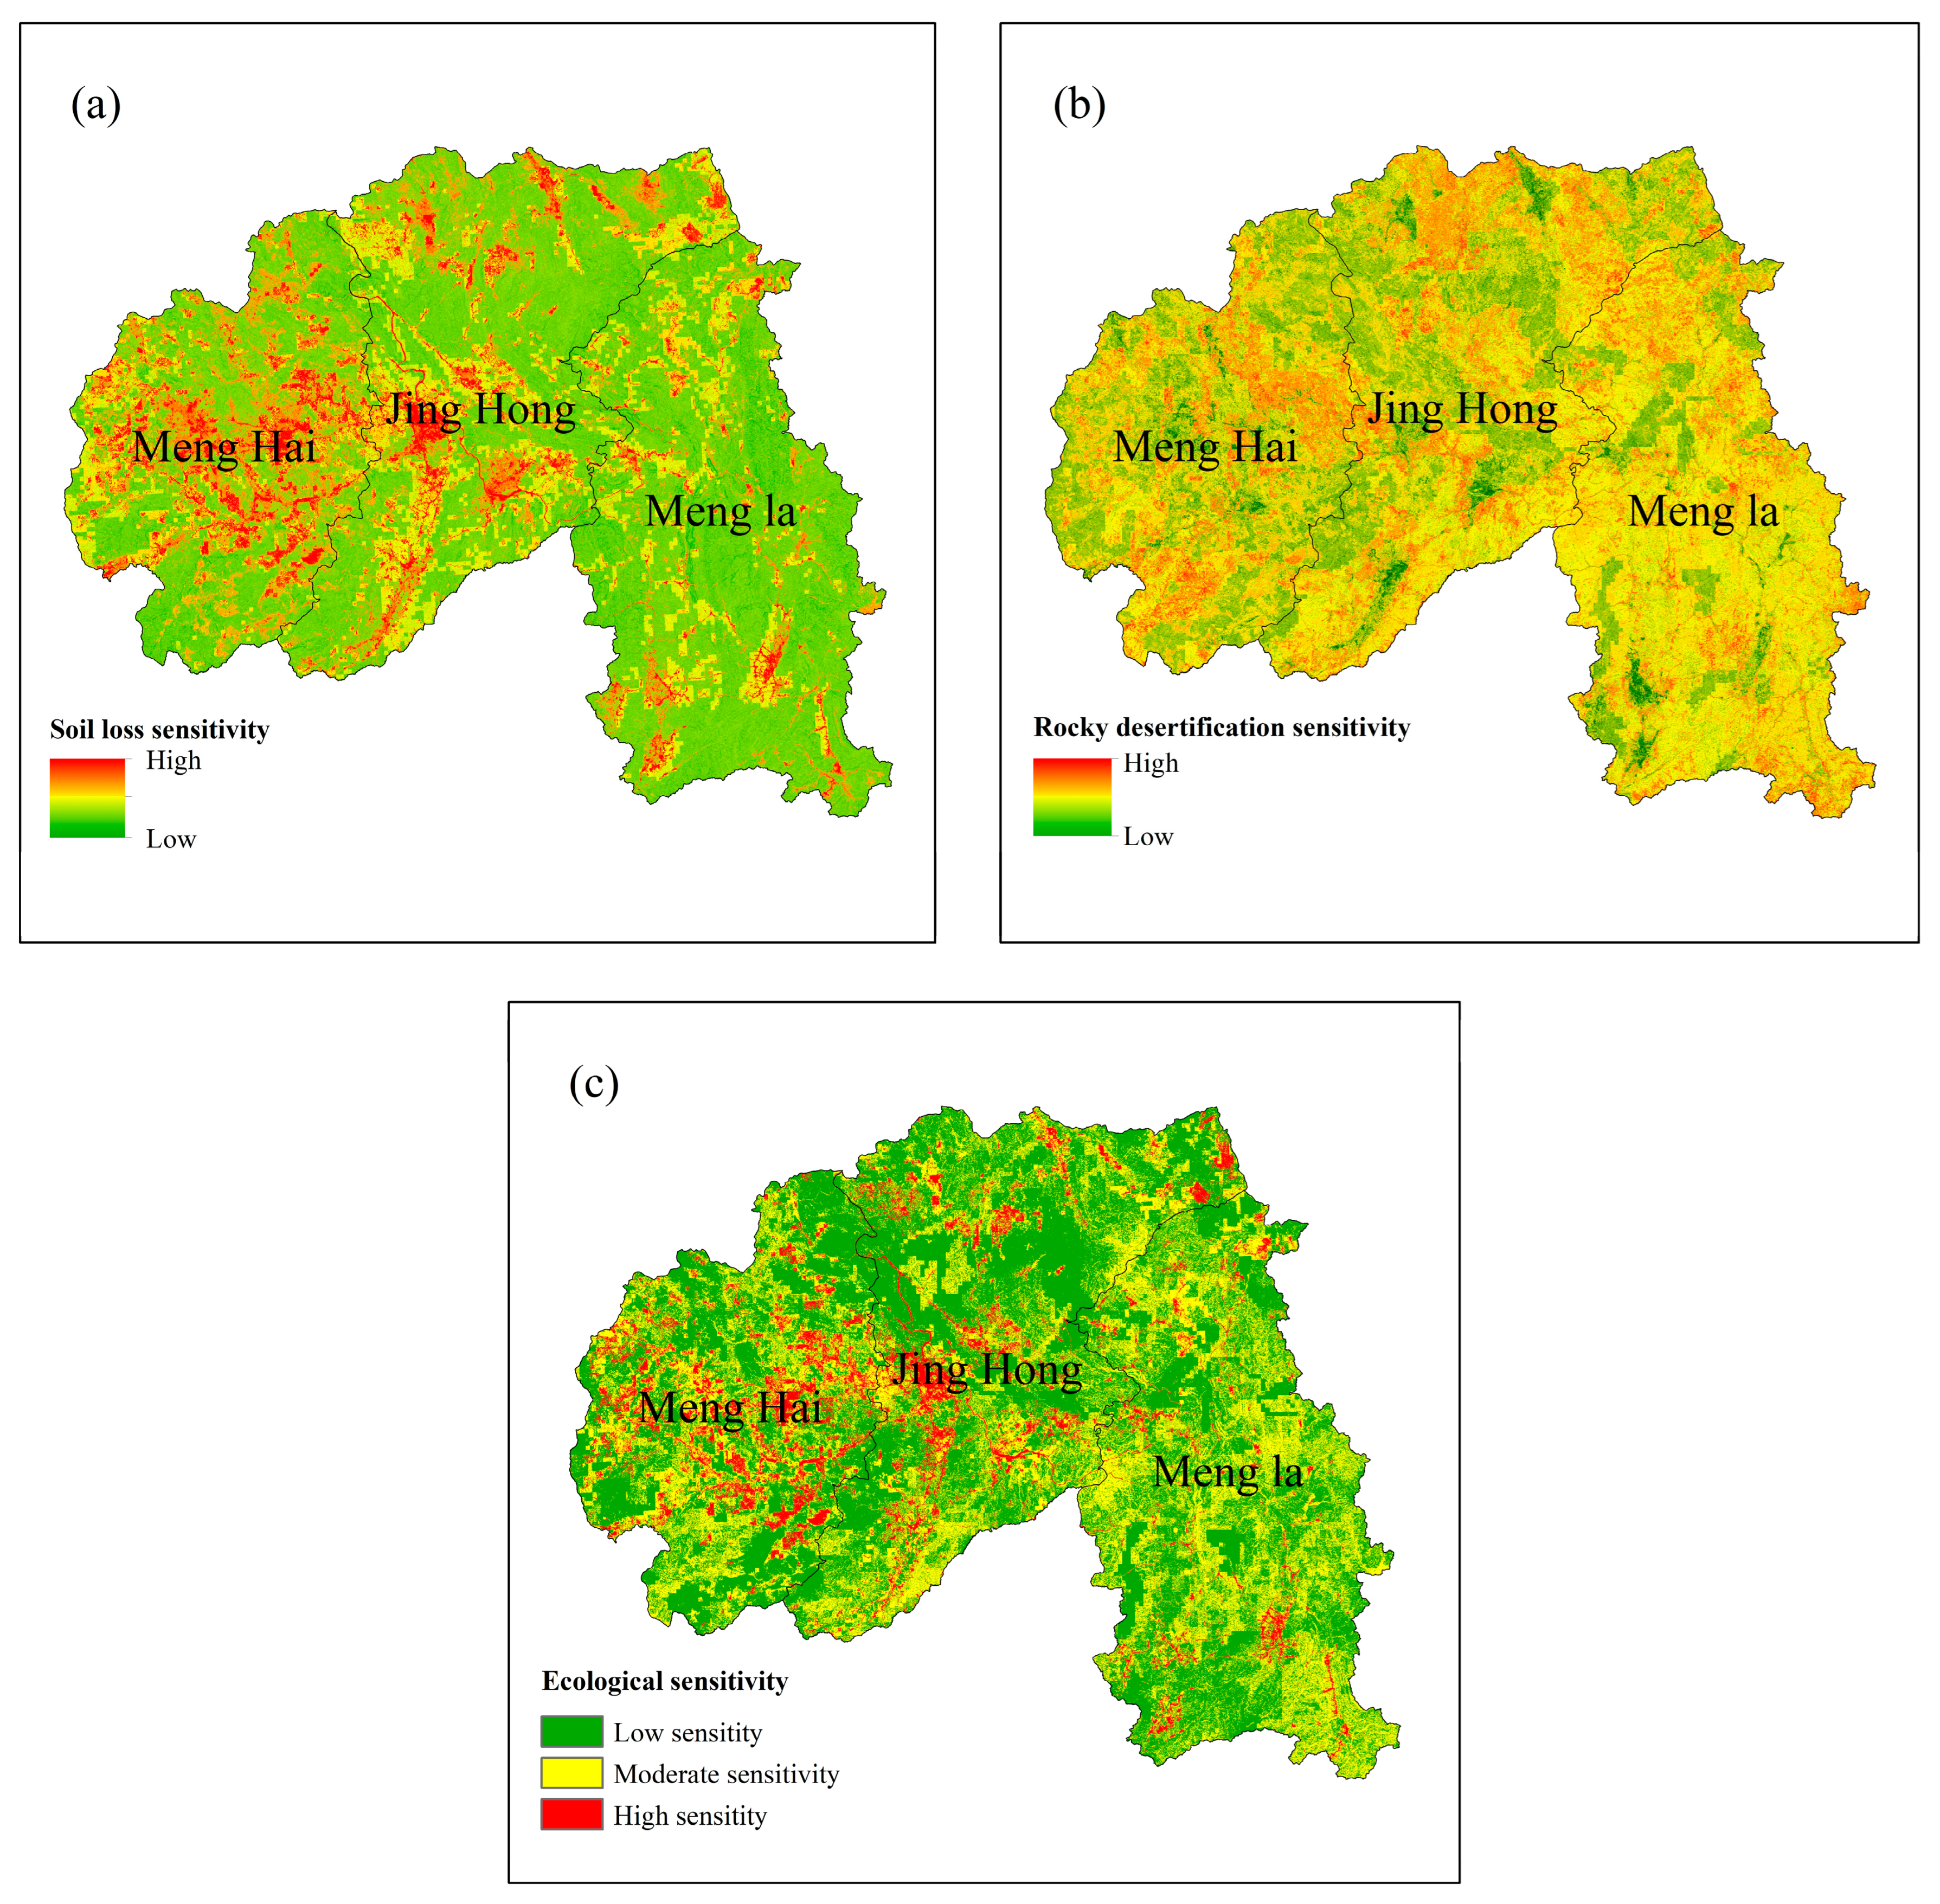
3.2. Ecological Sensitivity Assessment

Based on the calculation of ecological sensitivity based on soil erosion and land desertification, the ecological sensitivity of the study area is classified into three categories: low; medium; and high. High-sensitivity areas for soil erosion are concentrated in the southwest of the study area, while high-sensitivity areas for land desertification are distributed within Mengla County in the southeast of the study area (Figure 4). Overall, highly sensitive ecological areas are mainly distributed in the central–western regions of Menghai County and Jinghong City, with a total area of 1576.67 km2, accounting for 8.26% of the study area. Specifically, the proportions of highly sensitive areas in Menghai, Jinghong, and Mengla are 43.53%, 39.40%, and 17.06%, respectively. The proportions of moderately sensitive areas in Menghai, Jinghong, and Mengla are 26.44%, 31.98%, and 41.58%, respectively. The proportions of low-sensitive areas in Menghai, Jinghong, and Mengla are 26.88%, 38.25%, and 34.87%, respectively (Table 3). Comparatively, Mengla County has a lower ecological sensitivity, mainly consisting of low and moderate sensitivity levels.

3.3. Ecological Pattern Recognition and Construction

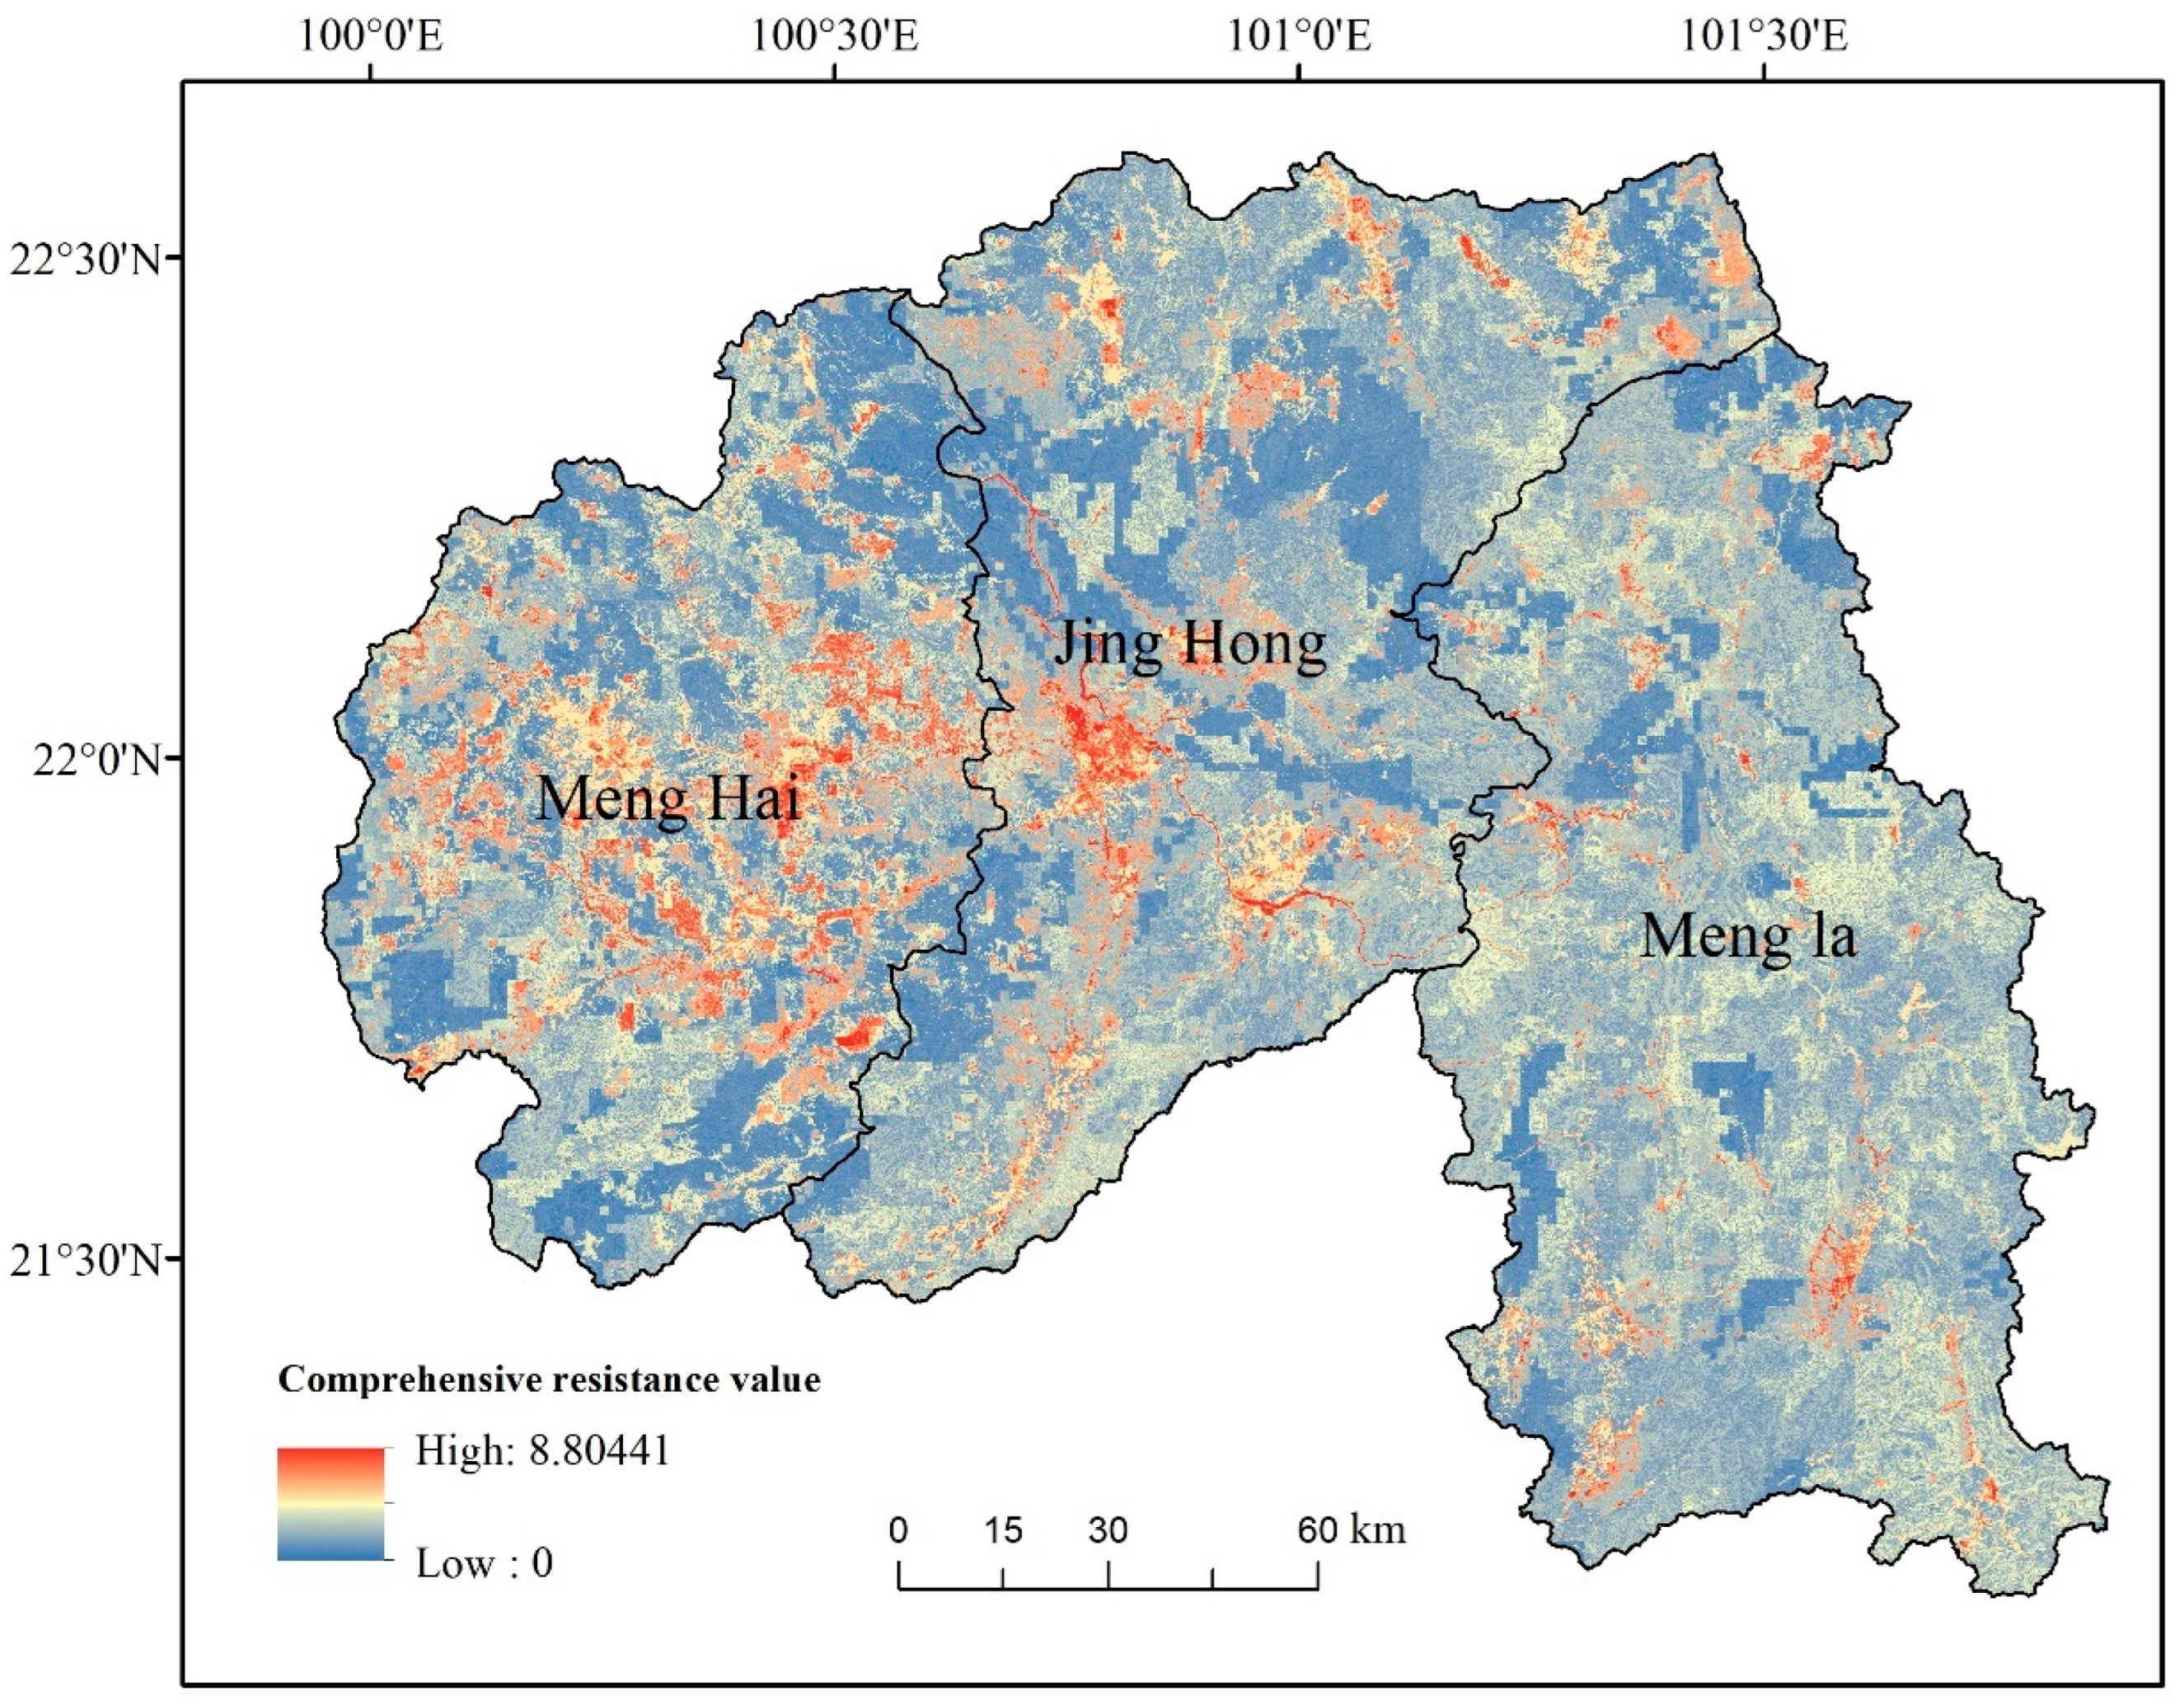
3.3.1. Ecological Source Area and Resistance Surface Analysis

Based on the integrated evaluation of the importance of ecosystem services, patches with an area greater than 20 km2 in extremely important areas were extracted as ecological source areas and modified in conjunction with nature reserves (Figure 5). According to the results of the importance evaluation, a total of 23 important ecological source areas were identified. After modification with nature reserves, a total of 31 ecological source areas were recognized (Figure 6), covering a total area of 4673.41 km2, accounting for 23.75% of the total study area, mainly distributed in Jinghong City and Mengla County. By integrating the sensitivity evaluations of soil erosion and rocky desertification, the distribution map of ecological sensitivity in the study area was obtained. The natural breakpoint method was used to divide the sensitivity into three levels: low; medium; and high. The highest level of sensitivity was taken as the resistance surface, and it can be seen that areas with higher resistance values are mainly concentrated in Menghai County (Figure 7). This finding is closely related to severe soil erosion in the local area.

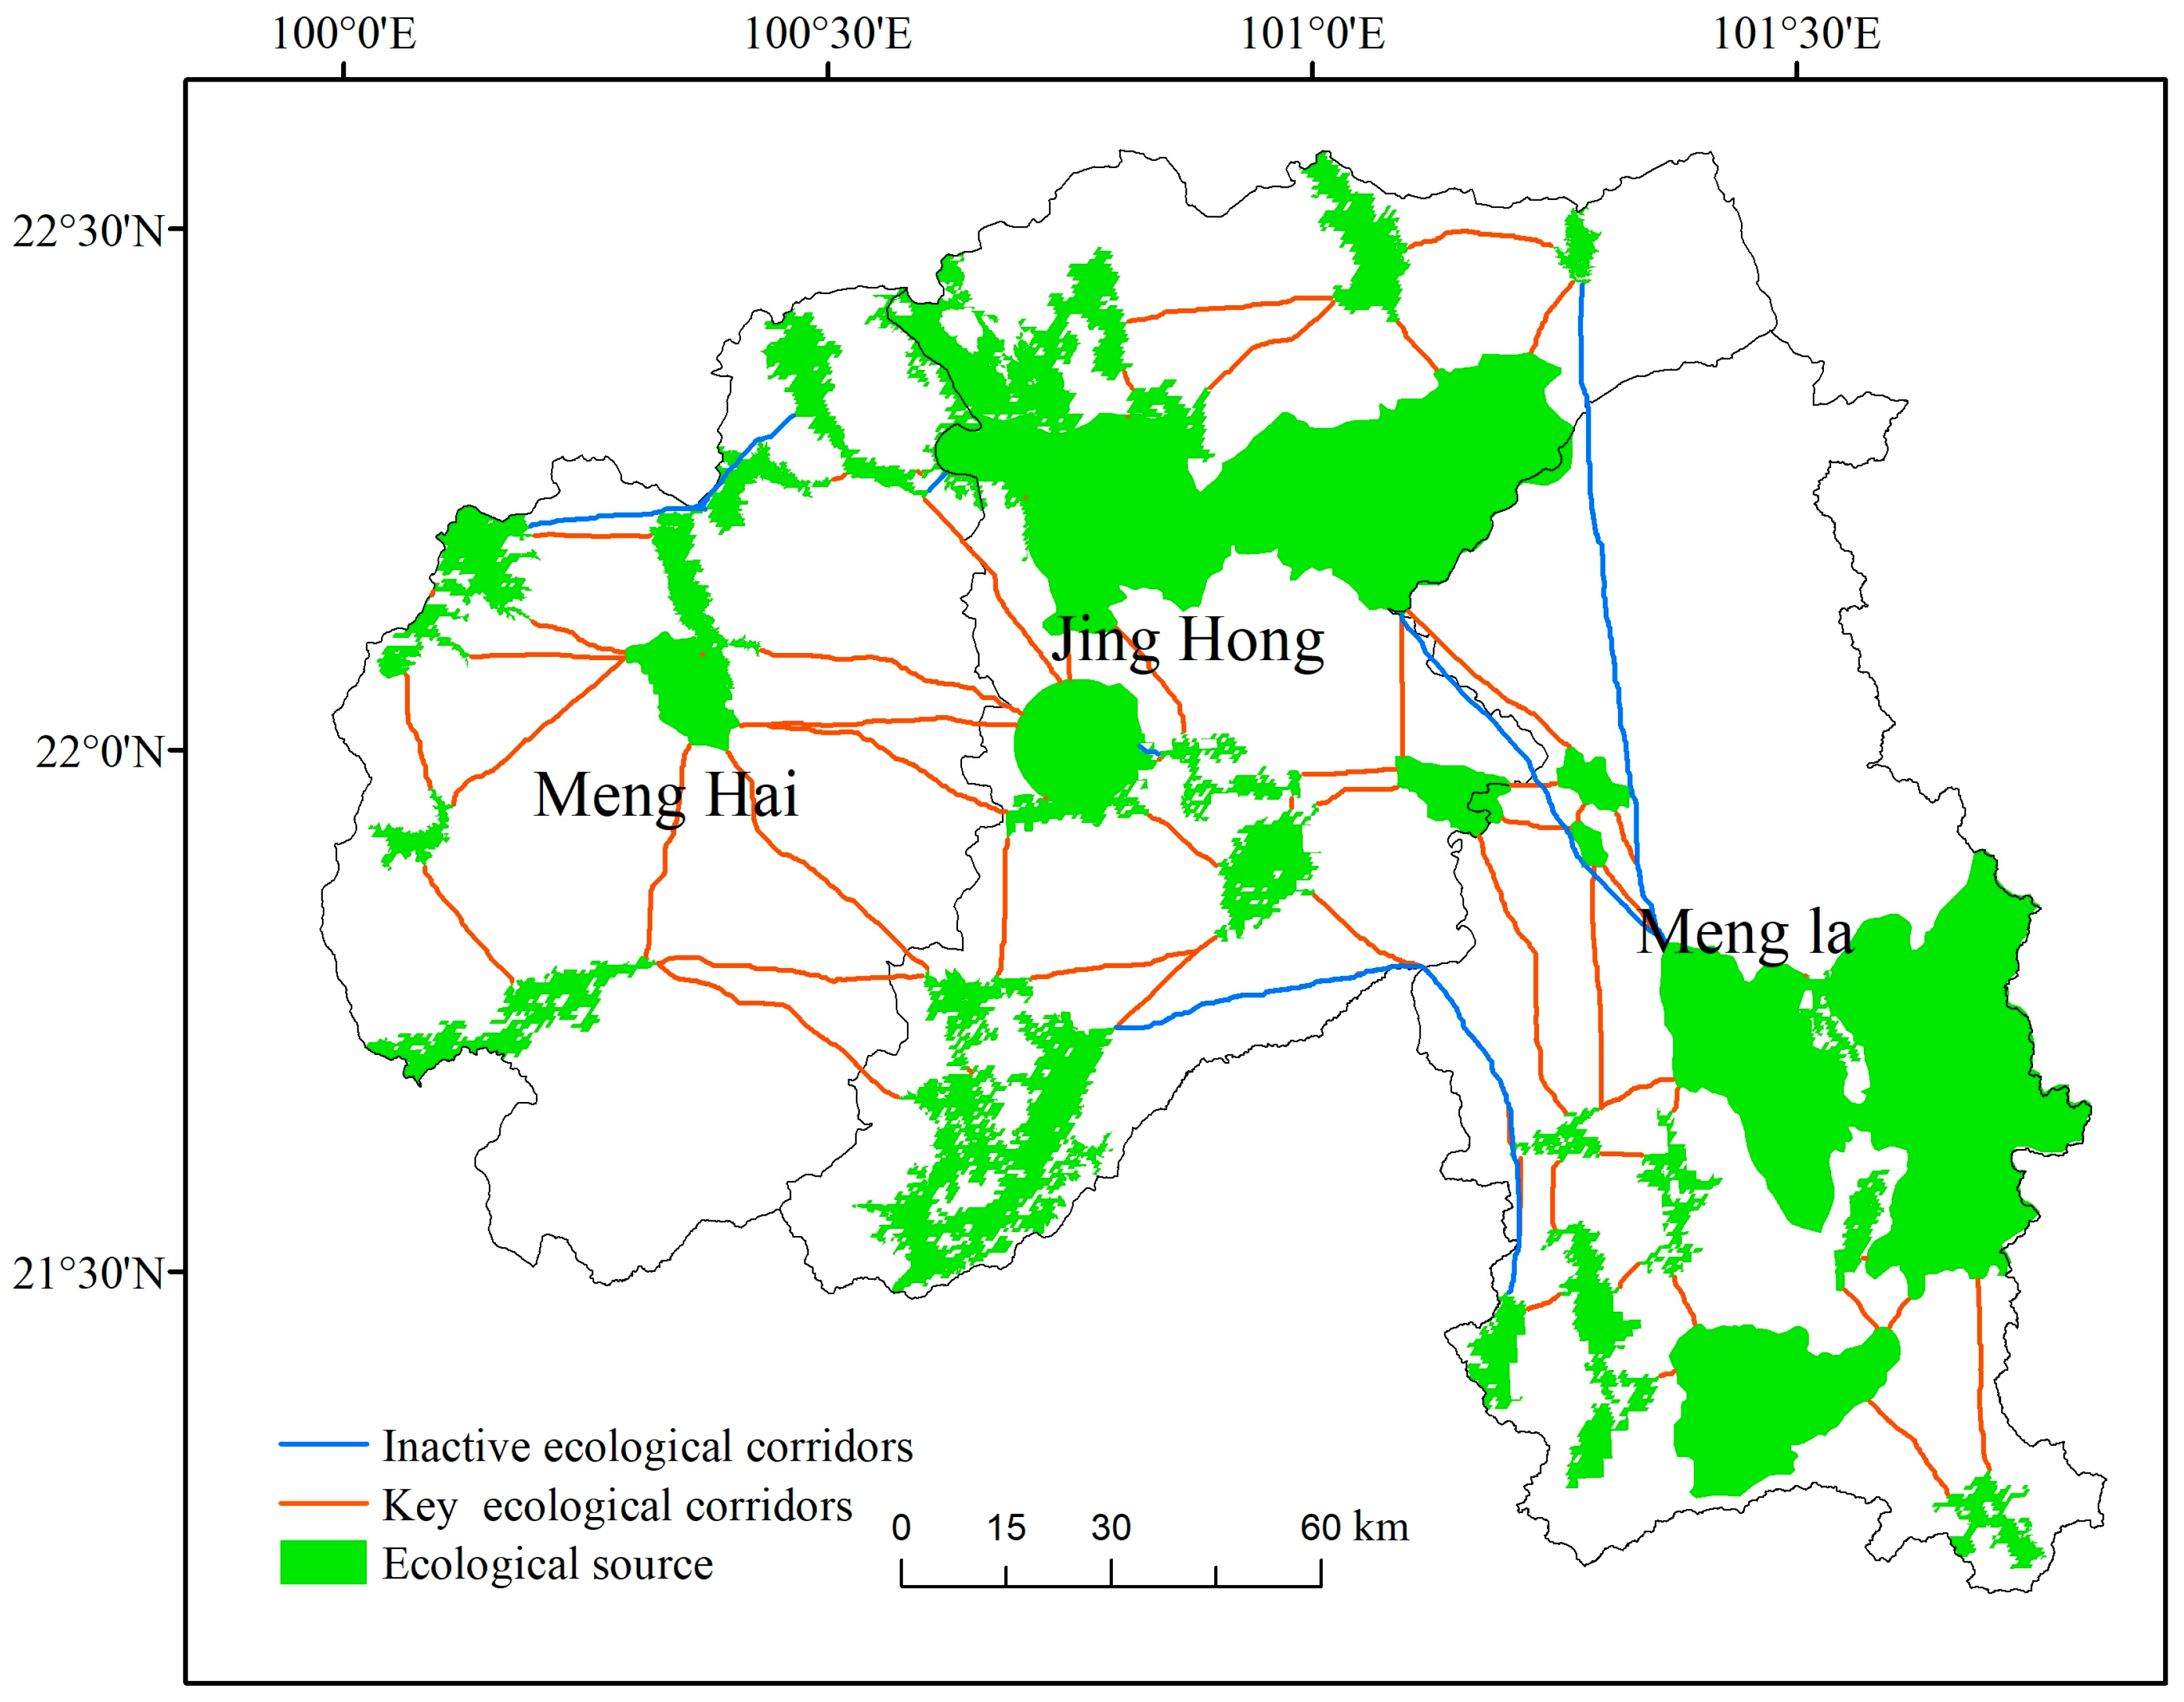
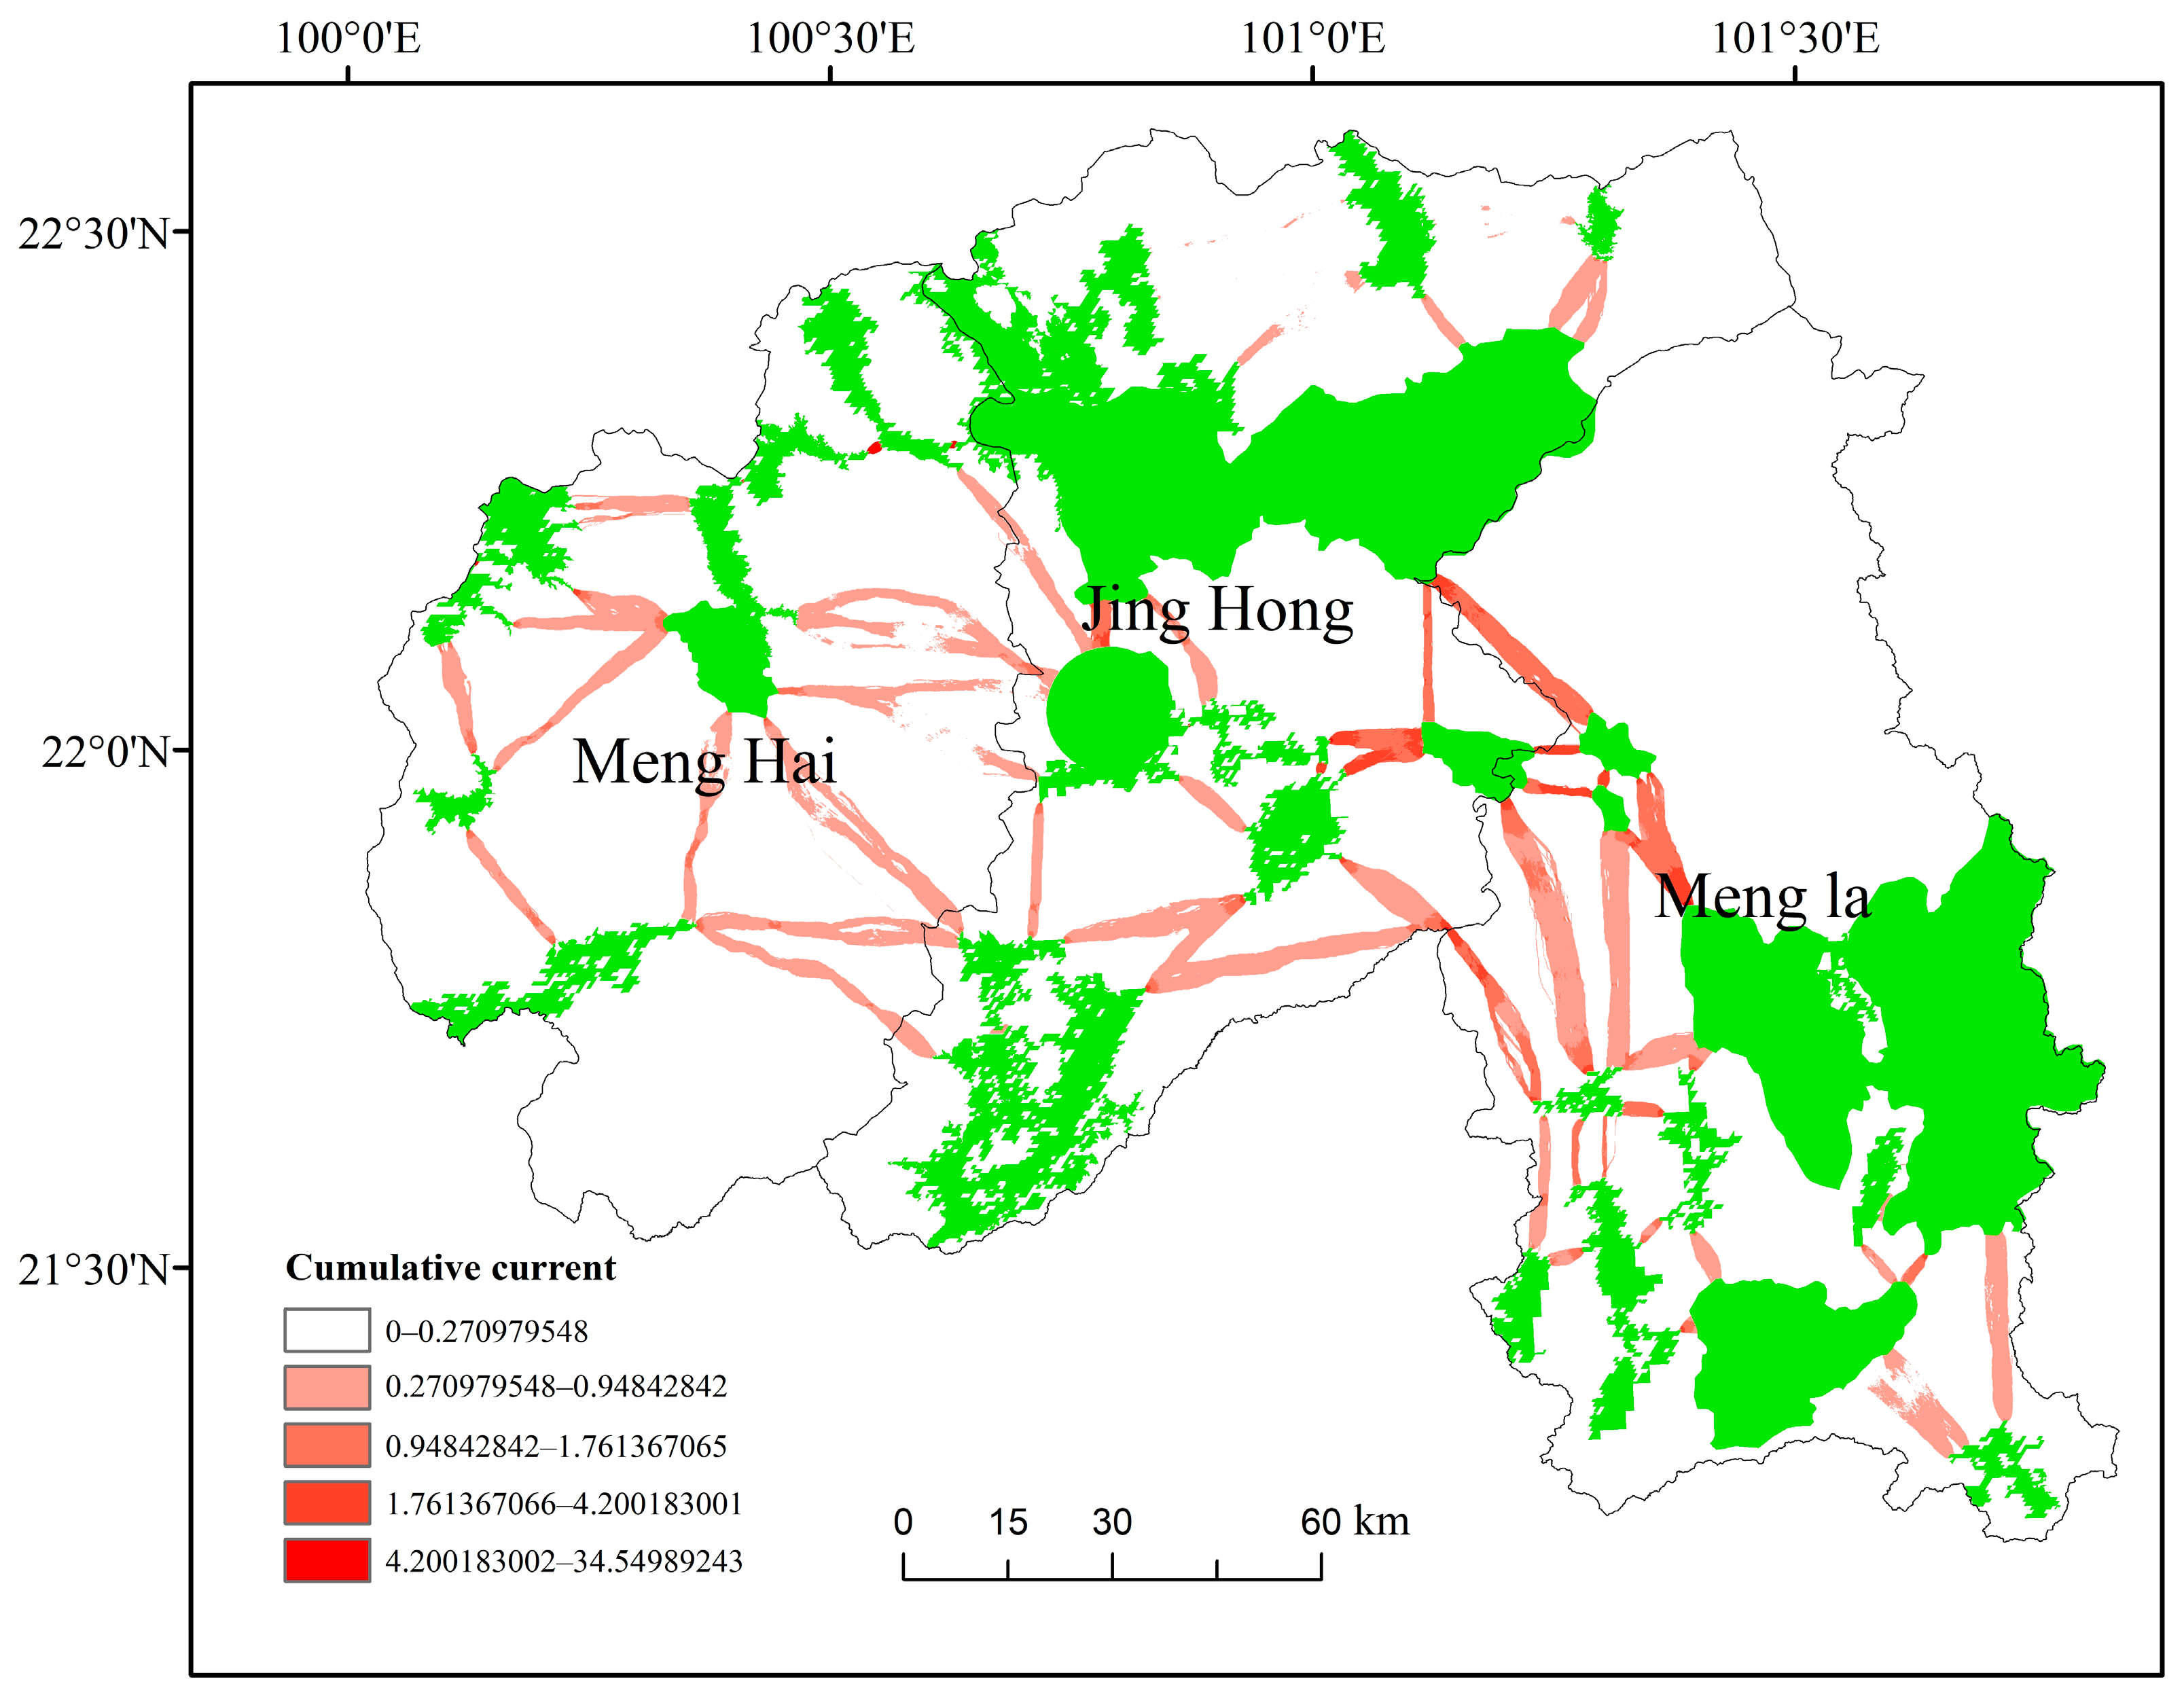
3.3.2. Ecological Corridor Extraction

Based on the ArcGIS 10.8 platform, an all-to-one mode [39,40] in the LinkageMapper 4.0 plugin was chosen to treat each ecological source as a circuit node, simulating the least-cost paths (LCP) and extracting ecological corridors by calculating the cumulative electrical resistance between two nodes. A total of 73 ecological corridors were extracted, with a total length of 1151.92675 km. Among them, there are 65 key corridors with a total length of 872.9545 km and an average length of 13,430.07 m. There are also eight potential corridors with a total length of 278.97225 km and an average length of 34.87153 km. The spatial distribution of the ecological corridors showed significant differences (Figure 8). Overall, the shorter key ecological corridors were mainly located in the southeast of the study area, connecting larger and closer ecological source sites, while the longer key ecological corridors were mainly located in the middle and east, connecting smaller and more scattered ecological source sites. The potential ecological corridors were longer, connecting larger ecological source sites in the southeast. In terms of spatial distribution, there is an occurrence of overlapping between key corridors and potential corridors, indicating a lower degree of migration barriers for species in the overlapping and intersecting zones.

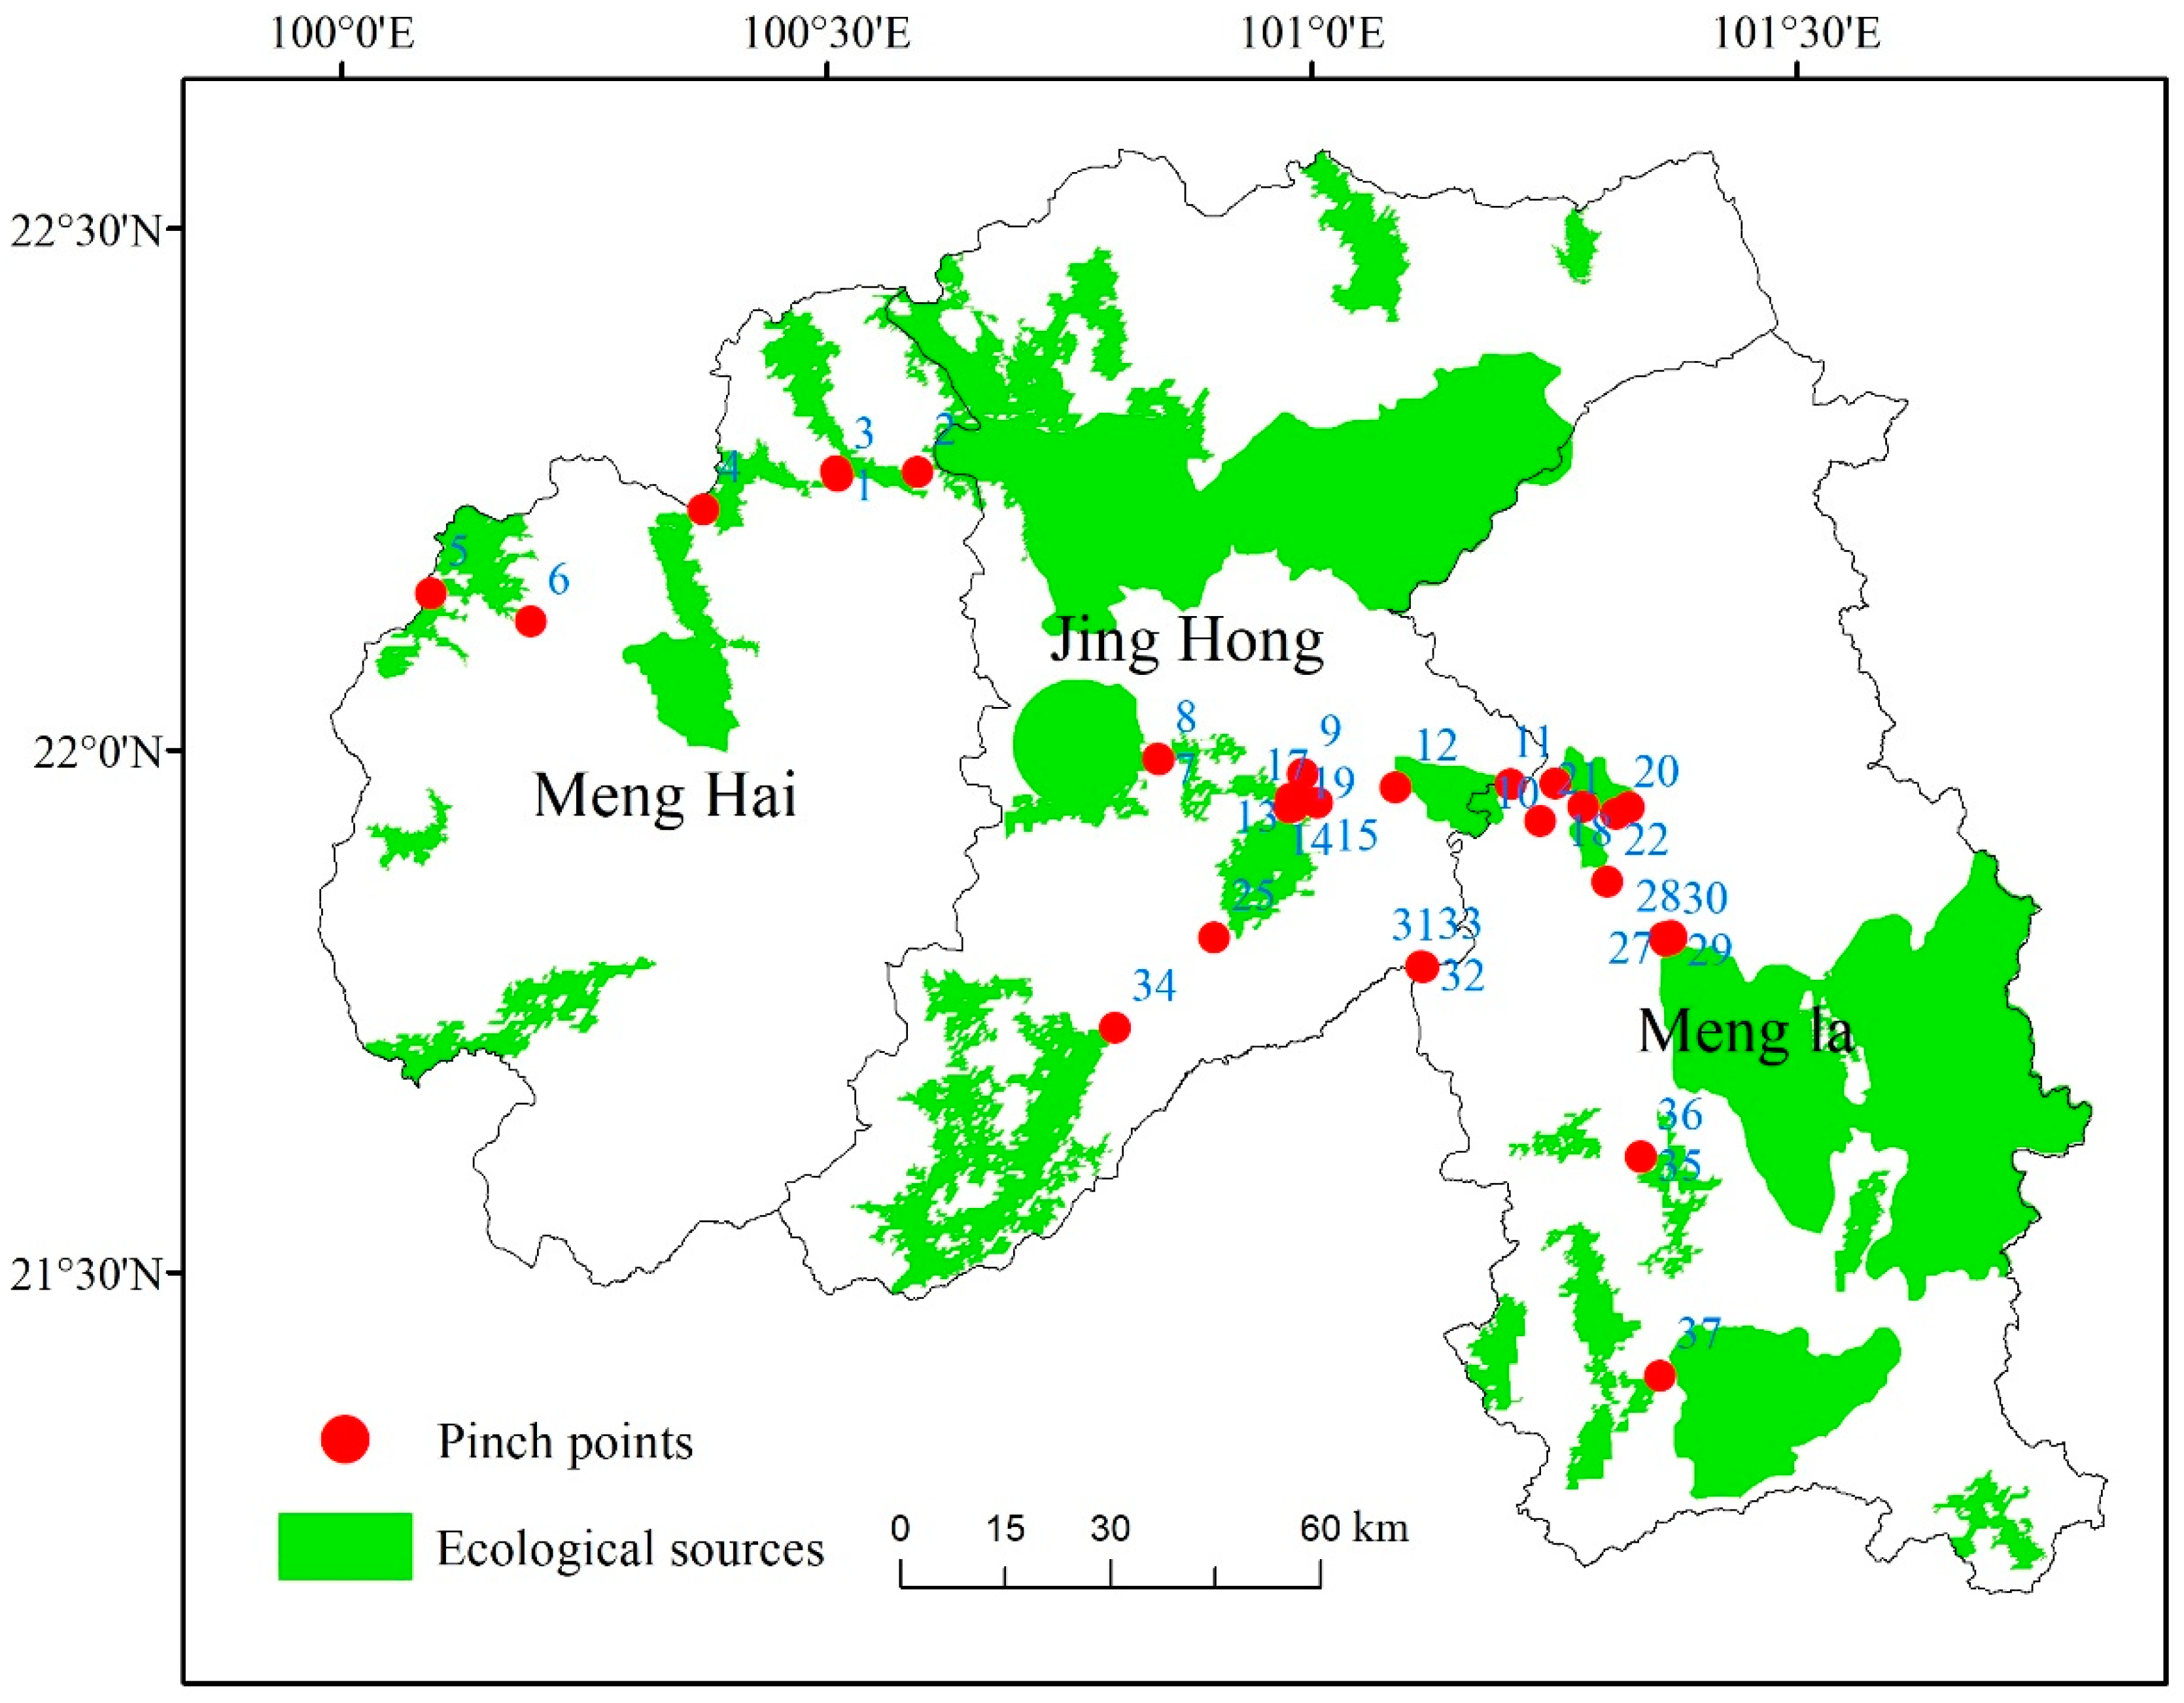
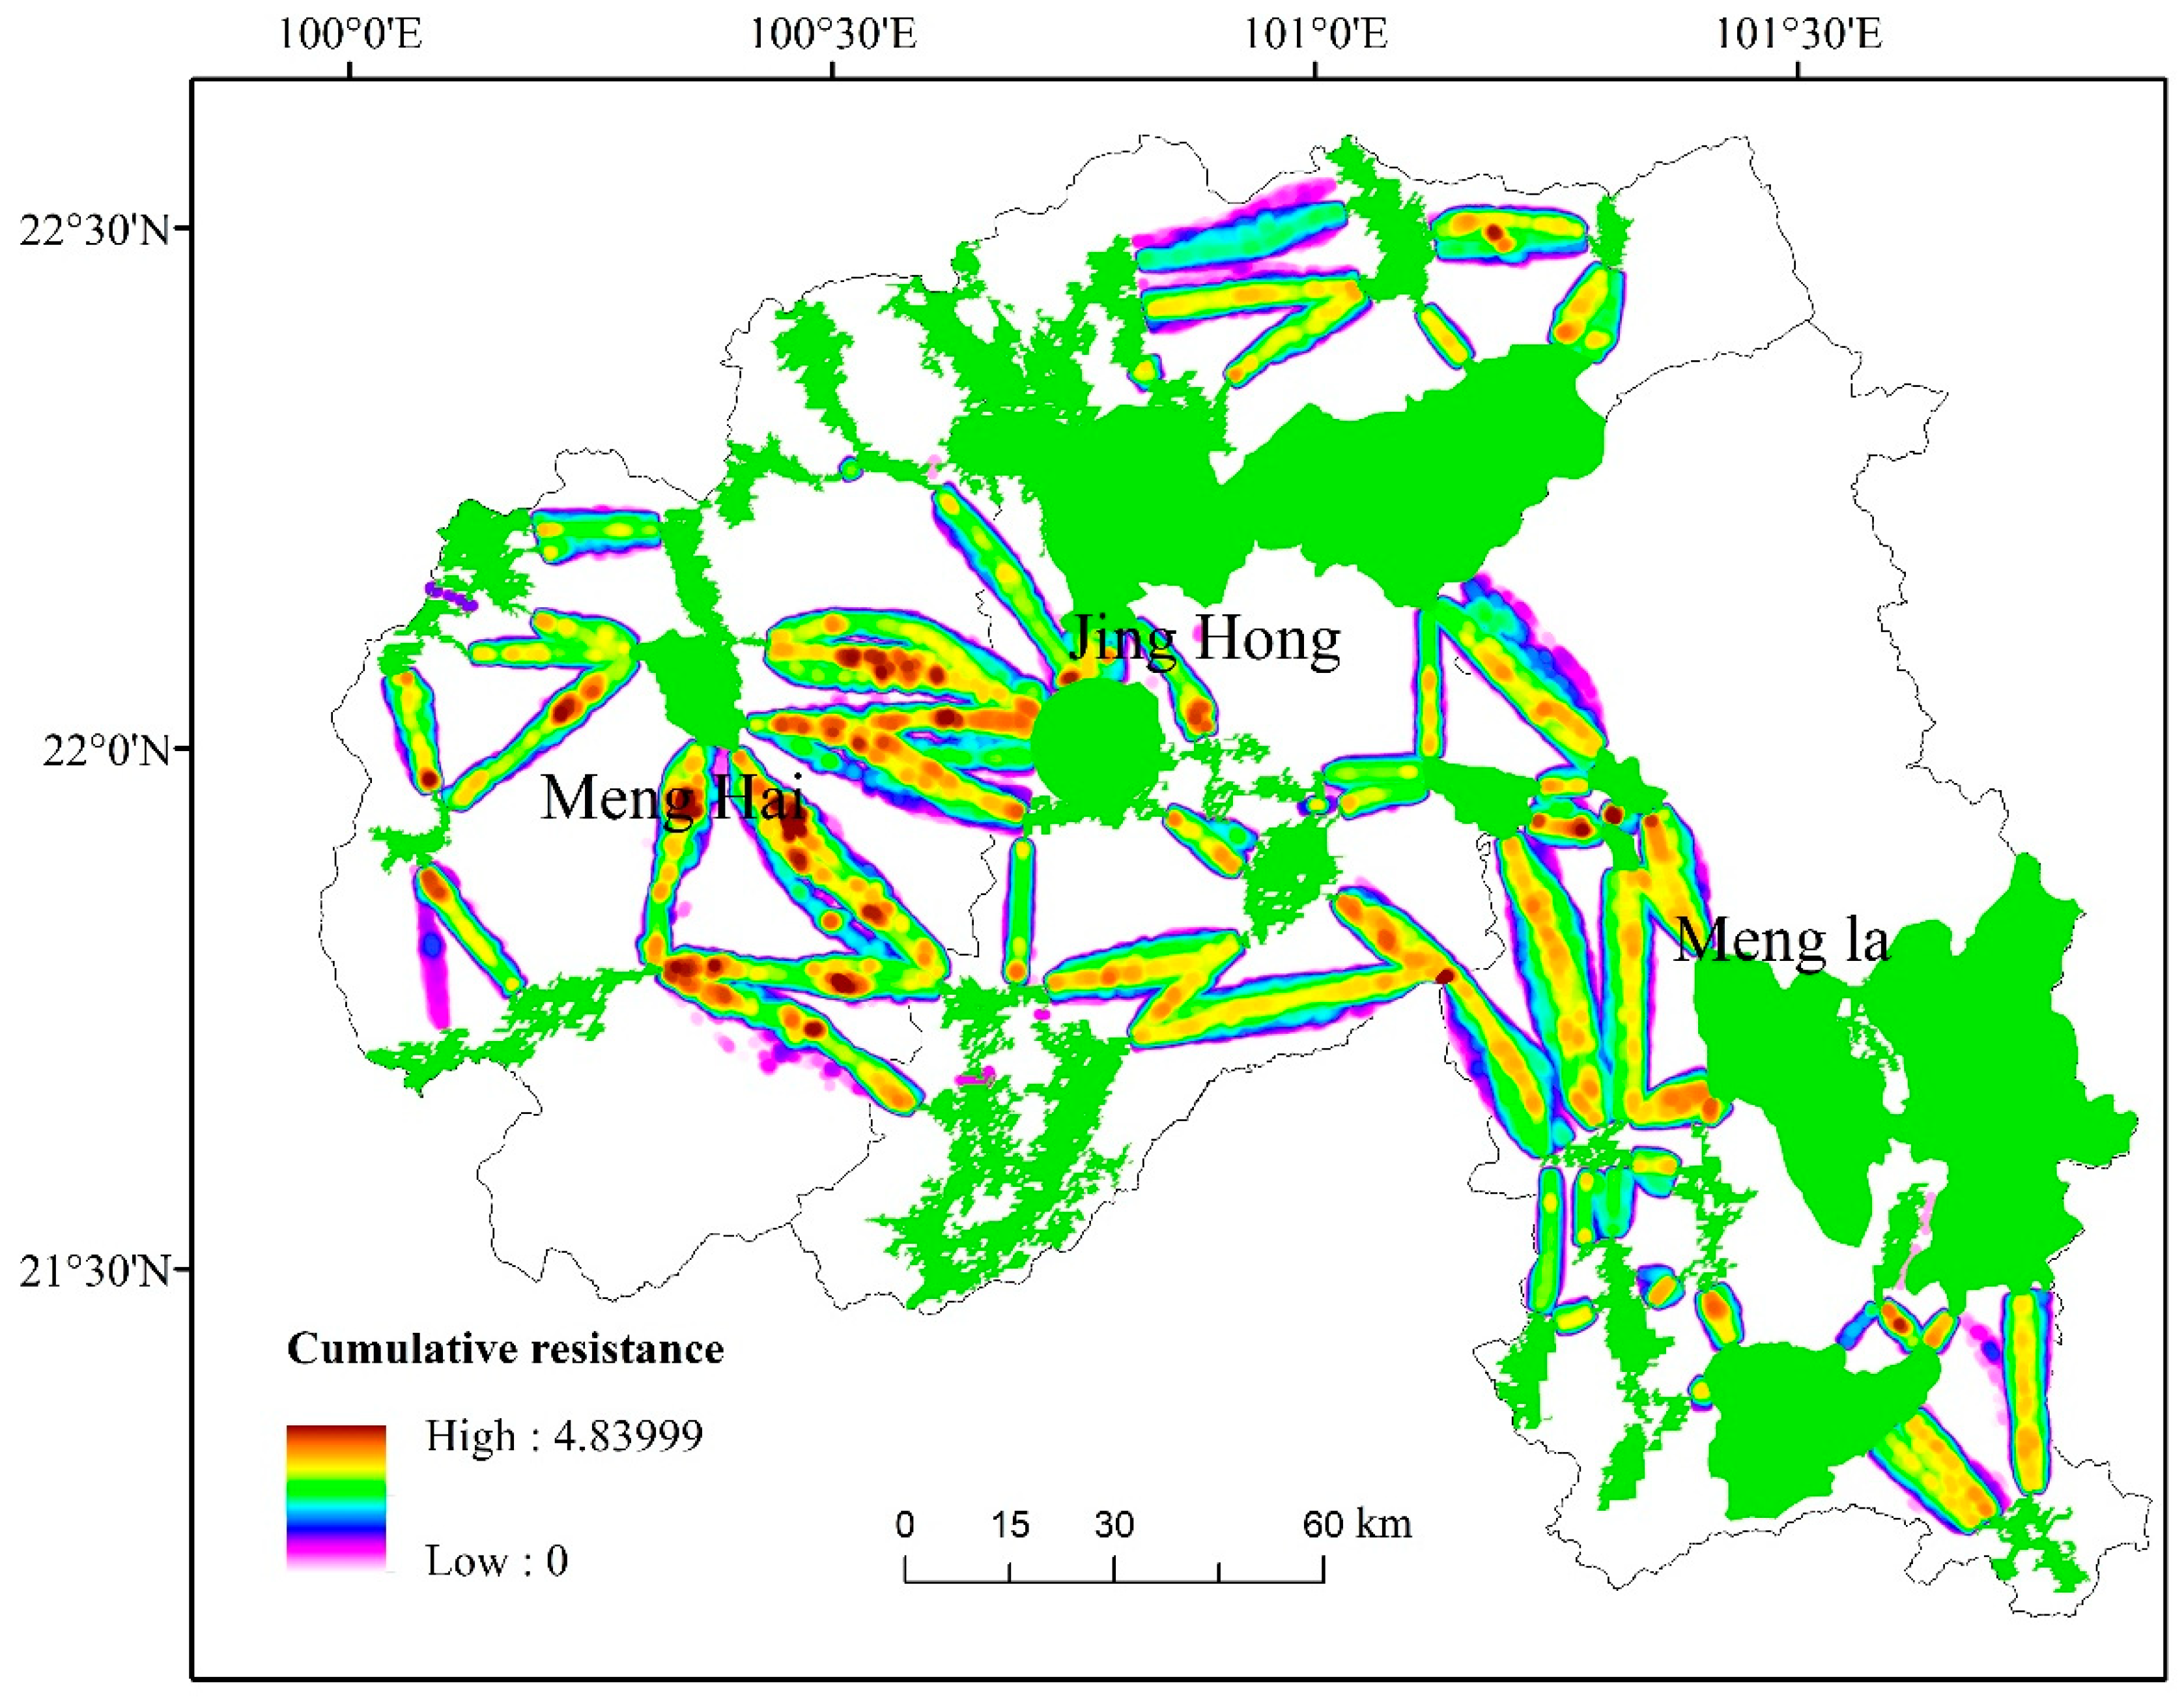
3.3.3. Ecological Pinch Points

The pinch points are unevenly distributed, with the densest areas mainly located in the central and eastern regions within Jinghong City and Mengla County and only six located in Menghai County. On the basis of extracting the corridor with the minimum cost, using the “all-to-one” mode in the Pinchpoint Mapper module of the Linkage Mapper toolbox, the Pinchpoint Mapper module calls the circuit scape program to analyze and identify pinch-point areas within the minimum cost corridor. Circuit scape is an open-source program that uses circuit theory to simulate landscape connectivity in heterogeneous landscapes, mainly used in the study of animal and plant gene flow. In this study, the circuit scape program is used to calculate the current through the grid, dividing the current values into five levels (Figure 9). The regions with the highest current value are designated as pinch points (Figure 10) to further identify important landscape elements in ecological corridors, with pinch points designated as focal areas for ecological protection.
The calculation results identified a total of 37 ecological pinch points, with a total area of 3.08 km2. The largest pinch-point area is 0.98 km2; the smallest is 900 square meters, with an average of 83,359.46 and a standard deviation of 258,089.97. From the perspective of spatial distribution, the distribution of pinch points is uneven. The densest concentration of pinch points is mainly found in the Jinghong City and Mengla County areas in the central and eastern regions. Menghai County, on the other hand, only has six pinch points distributed within its boundaries.

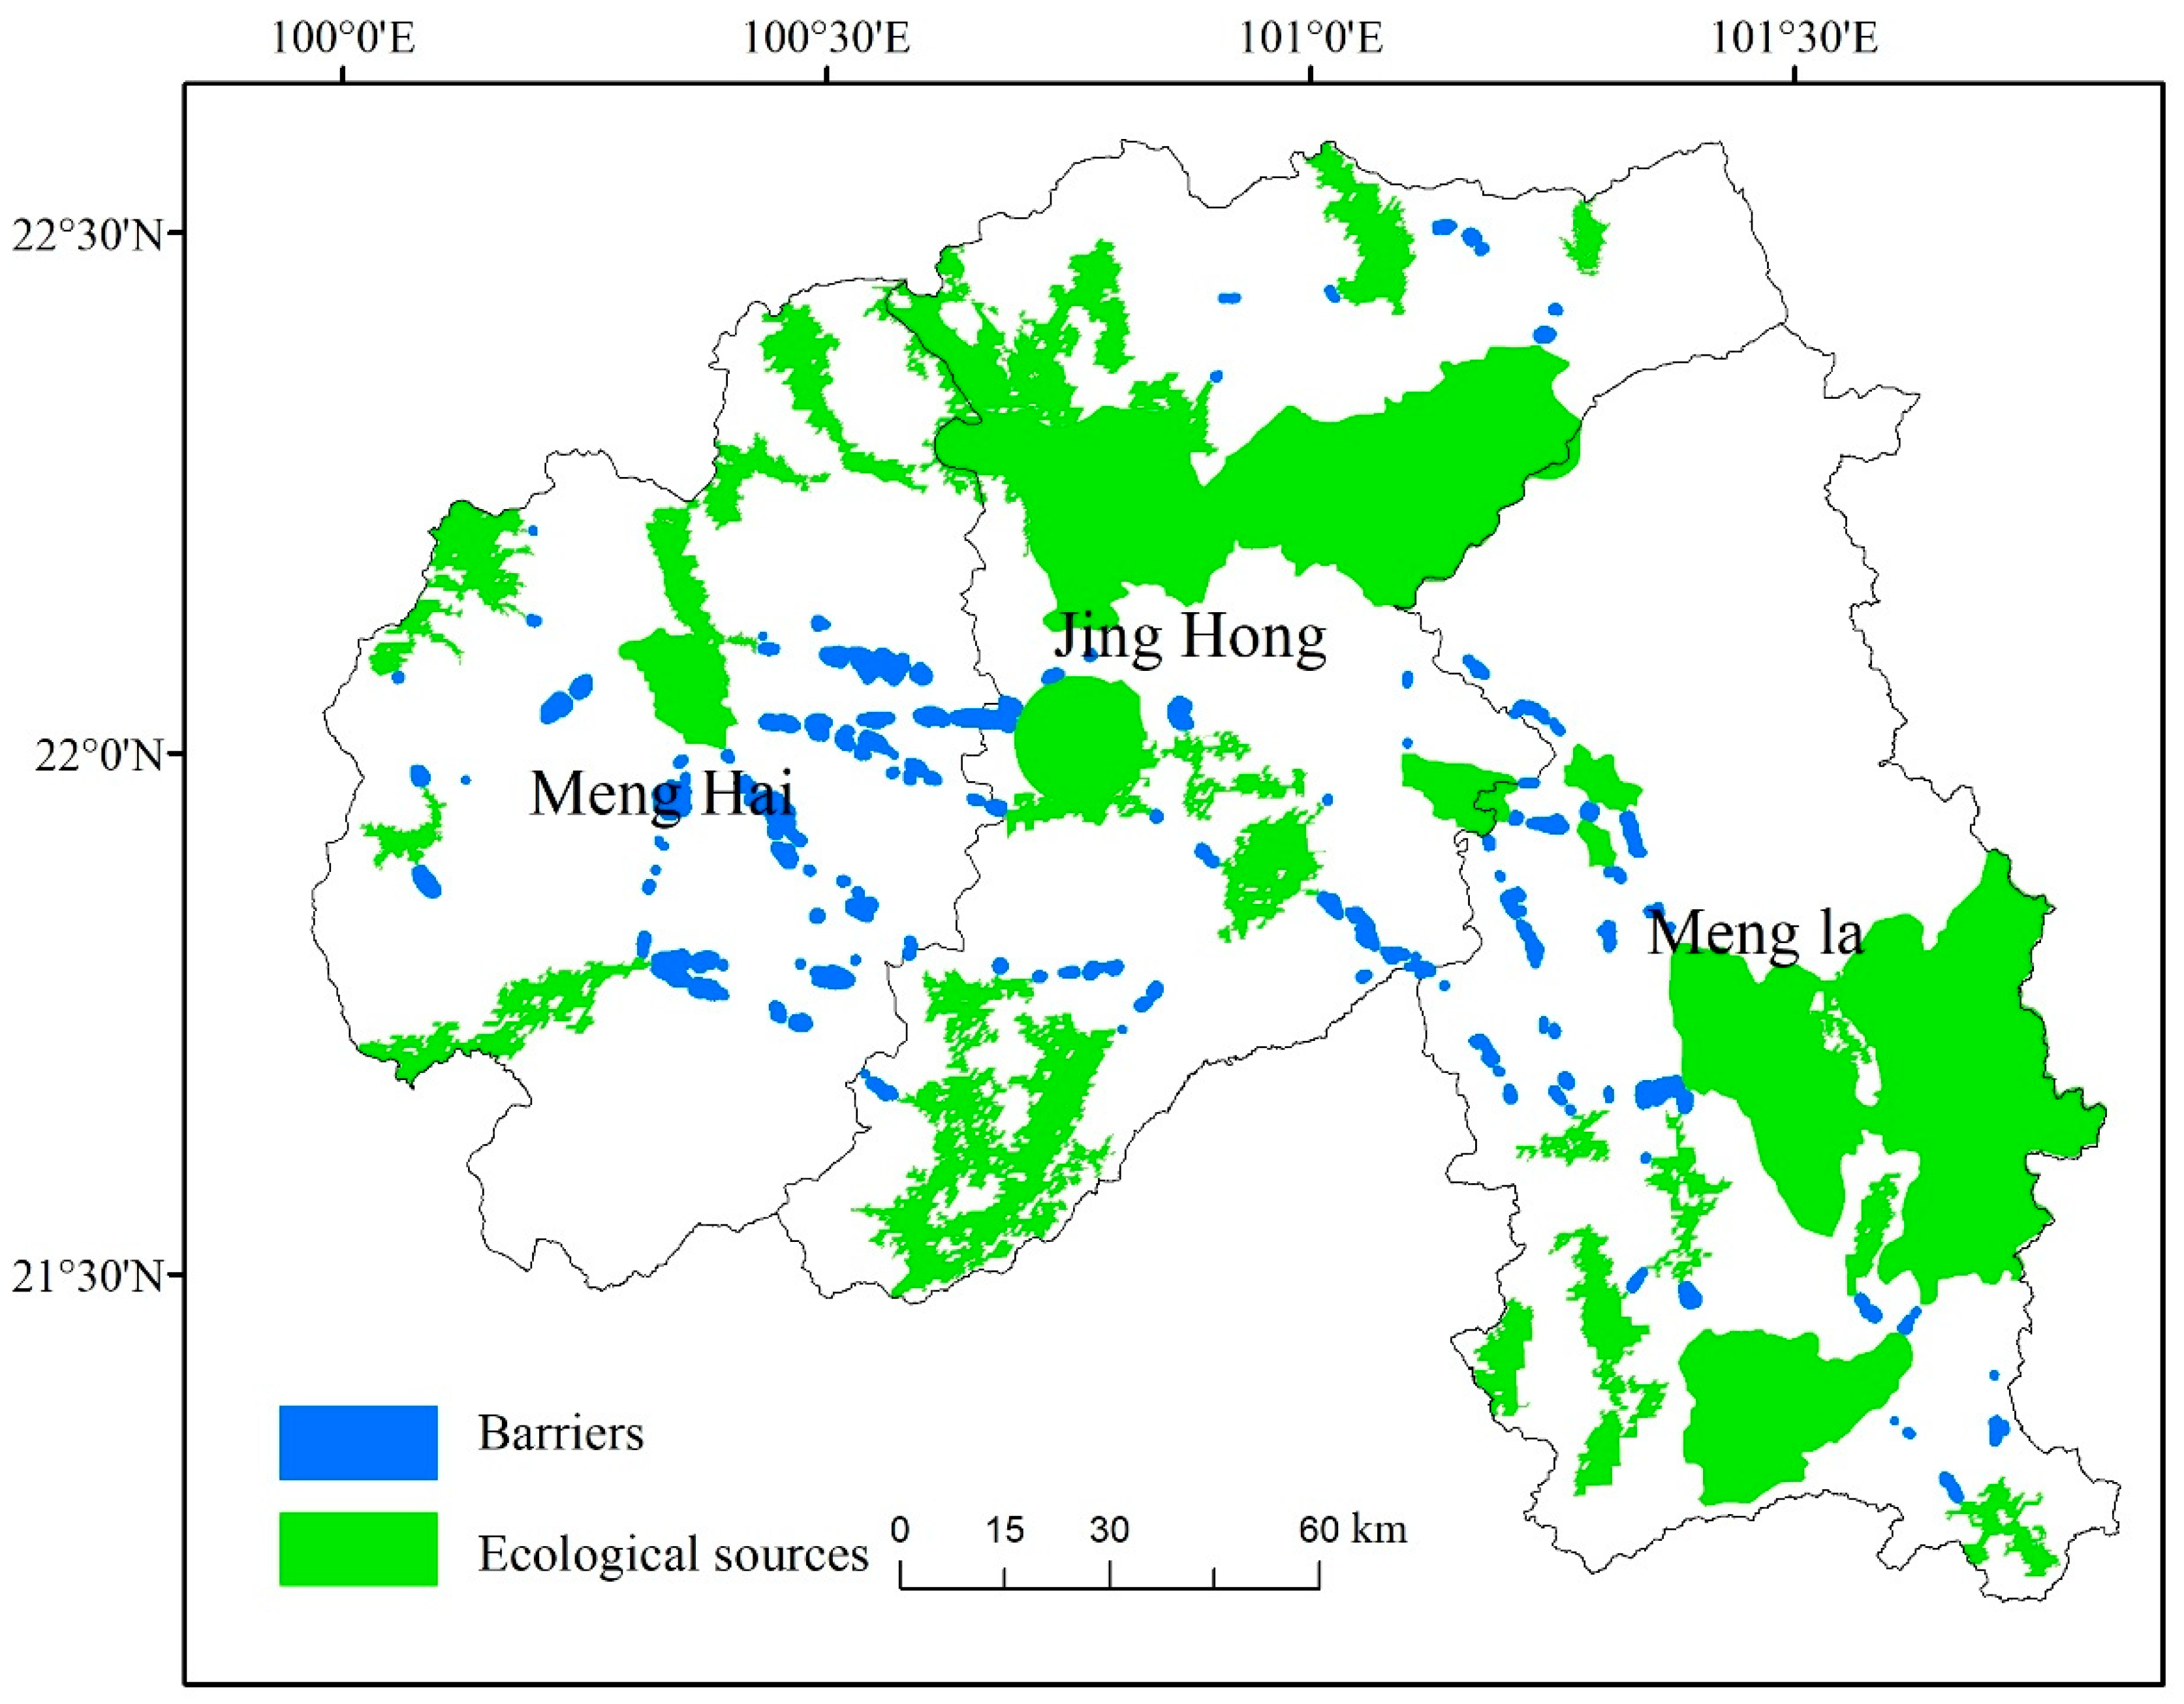
3.3.4. Ecological Barriers Identification

Using the Barrier Mapper module of the Linkage Mapper plugin, ecological “barrier points” are identified. Barrier zones are areas with high resistance values in ecological corridors, which are key areas that impede the flow of ecosystem services and require focus for ecological restoration [36]. In this study, a minimum search radius of 500 was set based on corridor width, and the natural breakpoint method was used to divide the barrier zones into five levels (Figure 11). Ultimately, 99 barrier zones were identified (Figure 12), with a total area of 542.94 km2. The largest barrier point covered an area of 32.47 km2, while the smallest barrier zone had an area of 0.8109 km2, with an average area of 5.48 km2. In terms of spatial distribution, the densest concentration of barrier points is mainly found in the south and southeast, with scattered distribution in the north and virtually no distribution in the northwest and northeast regions.

4. Discussion

4.1. The Significance of the Ecological Security Pattern for the Protection of Tropical Rainforests Conservation

Currently, the phenomenon of tropical rainforest isolation in Xishuangbanna is becoming increasingly severe. Roads, farmland, rubber plantations, and other artificial barriers within the area are posing serious obstacles to genetic exchange among wildlife, such as Asian elephants and Indian bison. Exploring new models for establishing biodiversity conservation corridors to improve the ecological connectivity of nature reserves will be an important measure for strengthening ecological protection in Xishuangbanna.
The ecological security pattern serves as a bridge connecting ecosystem services and human social development, playing a crucial role in ensuring regional ecological security and enhancing human well-being. Currently, research on ecological security patterns covers multiple fields and spatial scales, with a focus on aspects such as land use and biodiversity conservation [41]. Studies can span different scales, including landscapes [42], regions [43], and countries [44], involving urbanized areas (Yu et al., 2009; Wu Yingmei et al., 2023), agro-pastoral transitional zones [45,46], arid/semi-arid regions [47], and scenic areas [48] among various types of study areas, each exhibiting significant socio-ecosystem characteristic differences. Among these, urban areas, being the most densely populated and intensively altered by human activities, face pronounced ecological security challenges, drawing close attention to the construction of ecological security patterns. However, there is a lack of ecological security pattern construction cases specifically focusing on tropical rainforests.
This study constructs 72 ecological corridors to provide pathways for genetic exchange among patches of tropical rainforest, facilitating increased connectivity of isolated populations and achieving the goal of connecting habitats to prevent population isolation, thereby ensuring the functioning of rainforest ecosystem services. Secondly, the identified 37 ecological pinch points can serve as important sites for species reproduction, foraging, and migration. Protecting these critical habitats can promote the maintenance of rainforest biodiversity. Furthermore, ecological barriers refer to geographic, biological, or environmental elements that impede or restrict the movement of biological populations and ecosystem dispersion. If ecological barriers cannot be crossed or bypassed, they may lead to reduced gene flow, increased population isolation, and decreased species diversity within ecosystems. This could have negative impacts on the genetic health and adaptability of biological populations, as well as increase the risk of species extinction. The 99 identified ecological barrier areas in this study will serve as focal points for ecological restoration efforts, and restoration in these key areas will enhance the efficiency of rainforest protection.
Overall, the construction of an ecological security pattern can provide a basis for the delineation of ecological red lines and the planning of key protection areas. Additionally, in the face of challenges such as climate change [49,50], forest fires, and disease transmission, establishing an ecological security pattern can enhance the rainforest’s recovery and adaptability. Protecting surrounding water sources, wetlands, and natural barriers and reducing human activities that disturb the rainforest can help maintain the stability and resilience of the rainforest ecosystem.

4.2. Exploring the Human–Land Relationship in Tropical Rainforest Conservation

Tropical rainforests are threatened by human activities, but the intensity of each threat varies by region. In tropical America, cattle ranching is the main driver of rainforest destruction. In Southeast Asia, tree plantations (such as oil palm, rubber, and cocoa) are responsible for much of the deforestation. In Brazil, mechanized soybean farming has exacerbated the ecological issues in the Amazon region [51]. However, it is undeniable that regardless of the cause of destruction, rainforests have the potential to recover from logging, hunting, and single fires, but few rainforest species can survive after complete forest loss [52]. There is clear evidence that when fragments of tropical forests become isolated from continuous forests, their species richness declines over time [53,54]. Furthermore, some scholars have used economic models to explore methods of rainforest conservation by examining supply and demand issues in the timber market. They argue that the marginal value of protecting an additional unit (1 hectare) of rainforest area is $0.0053 [55]. Other scholars have investigated the critical ecological threshold for rainforest protection in human-altered landscapes and suggest that the minimum forest cover should not be less than 40% [56].
By 1984, the natural forest coverage in Xishuangbanna had decreased from 70–80% in the 1950s to 34%, with a deforested area of over 6 million hectares [57]. Since the 1980s, the government has strengthened its leadership in forestry work and implemented a series of afforestation projects such as artificial afforestation, forest closure for regeneration, and afforestation on barren hills, resulting in an increase in forested land in Xishuangbanna. However, in the 21st century, with the acceleration of modernization and globalization, the traditional natural landscape has gradually transformed due to population growth, economic development, and improved transportation conditions, posing new challenges to rainforest conservation. In this new context, contradictions still exist between the rainforest and humans, the rainforest and nature, and humans and nature. Constructing an ecological network system is conducive to guiding the scientific and rational development of agriculture, forestry, and plantation industries, mitigating conflicts between humans and the environment, and exploring new models of coexistence between humans and nature.

5. Conclusions

The marginality in latitude distribution, altitude, and hydrothermal conditions has contributed to the endangerment of the tropical rainforest in Xishuangbanna. Coupled with forest fragmentation, the escalating conflicts between socio-economic development and conservation efforts, as well as the significant challenges of transboundary conservation, pose direct threats to biodiversity protection within the Xishuangbanna tropical rainforest. Currently, while research on ecological security patterns is abundant, there is a lack of specialized studies focusing on tropical rainforests in terms of spatial scope. Through ecological assessment, the delineation of ecological corridors’ spatial extent and identification of key nodes offer new perspectives for the conservation of the tropical rainforest.
The results indicate that the ecological security pattern in Xishuangbanna consists of forest-dominated ecological sources and radiating ecological corridors distributed along mountains and forest belts. The ecological security pattern mainly includes 31 ecological source patches, 72 corridors, 37 pinch points, and 99 barriers. Based on spatial analysis, 72% of the existing nature reserves are encompassed within the identified ecological sources. In the future, during the process of ecological planning, it is necessary to designate core protected areas in the pinch-point regions, restore barrier points, and optimize land use types in barrier areas to reduce landscape resistance. Increasing the number of pinch points, opening up more potential ecological corridors, and optimizing the ecological security pattern will help address the issue of “forest fragmentation”.
This study primarily applied a circuit theory model and ecological assessment to establish an ecological security pattern for rainforest conservation. However, apart from the circuit theory model, further research is needed to explore more optimized and suitable methods or models to determine the range of ecological corridors specifically tailored to rainforest characteristics. Additionally, the restoration of the Xishuangbanna tropical rainforest cannot be achieved from a single perspective. The integration of natural conservation and cultural preservation will be a key focus of future studies.

Author Contributions

Conceptualization, M.Y.; J.D. and Y.Y. designed research; M.Y. performed research; Y.W. and Y.Q. collected related data; J.Z. writing—original draft preparation; M.Y and Y.L. writing—review and editing. All authors have read and agreed to the published version of the manuscript.

Funding

This research was funded by NFSC Funds (Grant Nos. 41902071 and 42011530173) and the Doctoral Research Start-up Fund, East China University of Technology (DHBK2020019).

Institutional Review Board Statement

Not applicable.

Informed Consent Statement

Not applicable.

Data Availability Statement

Data are contained within the article.

Conflicts of Interest

The authors declare no conflict of interest.

References

  1. Xu, J.; Grumbine, R.E.; Beckschäfer, P. Landscape transformation through the use of ecological and socioeconomic indicators in Xishuangbanna, Southwest China, Mekong Region. Ecol. Indic. 2014, 36, 749–756. [Google Scholar] [CrossRef]
  2. Cao, M.; Zou, X.; Warren, M.; Zhu, H. Tropical forests of xishuangbanna, China 1. Biotropica J. Biol. Conserv. 2006, 38, 306–309. [Google Scholar]
  3. Liu, W.; Luo, Q.; Li, J.; Wang, P.; Lu, H.; Liu, W.; Li, H. The effects of conversion of tropical rainforest to rubber plantation on splash erosion in Xishuangbanna, SW China. Hydrol. Res. 2015, 46, 168–174. [Google Scholar] [CrossRef]
  4. Turner, I.M. Species loss in fragments of tropical rain forest: A review of the evidence. J. Appl. Ecol. 1996, 33, 200–209. [Google Scholar] [CrossRef]
  5. Peng, J.; Zhao, H.; Liu, Y.; Wu, J. Research progress and prospect on regional ecological security pattern construction. Geogr. Res. 2017, 36, 407–419. [Google Scholar]
  6. Zhu, H.; Cao, M.; Hu, H. Geological history, flora, and vegetation of Xishuangbanna, Southern Yunnan, China 1. Biotropica J. Biol. Conserv. 2006, 38, 310–317. [Google Scholar]
  7. Li, H.; Ma, Y.; Aide, T.M.; Liu, W. Past, present and future land-use in Xishuangbanna, China and the implications for carbon dynamics. For. Ecol. Manag. 2008, 255, 16–24. [Google Scholar] [CrossRef]
  8. Liu, H.; Xu, Z.; Xu, Y.; Wang, J. Practice of conserving plant diversity through traditional beliefs: A case study in Xishuangbanna, Southwest China. Biodivers. Conserv. 2002, 11, 705–713. [Google Scholar]
  9. Dabelko, G.D.; Dabelko, D.D. Environmental security: Issues of conflict and redefinition. Environ. Chang. Secur. Proj. Rep. 1995, 1, 3–13. [Google Scholar]
  10. Fu, B.; Liu, Y. The theories and methods for systematically understanding land resource. Chin. Sci. Bull. 2019, 64, 2172–2179. [Google Scholar]
  11. Dai, L.; Liu, Y.; Luo, X. Integrating the MCR and DOI models to construct an ecological security network for the urban agglomeration around Poyang Lake, China. Sci. Total Environ. 2021, 754, 141868. [Google Scholar] [CrossRef] [PubMed]
  12. Yang, K.; Cao, Y.; Feng, Z.; Geng, B.-J.; Feng, Y.; Wang, S. Research Progress of Ecological Security Pattern Construction Based on Minimum Cumulative Resistance Model. J. Ecol. Rural. Environ. 2021, 37, 555–565. [Google Scholar]
  13. Chen, X.; Zhou, C. Review of the Studies on Ecological Security. Prog. Geogr. 2005, 24, 8–20. [Google Scholar]
  14. Ye, X.; Zou, C.; Liu, G.; Lin, N.; Xu, M. Main Research Contents and Advances in the Ecological Security Pattern. Acta Ecol. Sin. 2018, 38, 3382–3392. [Google Scholar]
  15. Wang, X.; Chen, T.; Feng, Z.; Wu, K.; Lin, Q. Construction of Ecological Security Pattern Based on Boundary Analysis: A Case Study on Jiangsu Province. Acta Ecol. Sin. 2020, 40, 3375–3384. [Google Scholar]
  16. Shi, F.; Liu, S.; An, Y.; Sun, Y. Biodiversity Conservation of Mountains-rivers-forests-farmlandslakes-grasslands Using an Ecological Network: A Case Study on the Zuoyoujiang River Basin in Guangxi, China. Acta Ecol. Sin. 2019, 39, 8930–8938. [Google Scholar]
  17. Mao, C.; Dai, L.; Qi, L.; Wang, Y.; Zhou, W.; Zhou, L.; Yu, P.; Zhao, F. Constructing Ecological Security Pattern Based on Ecosystem Services: A Case Study in Liaohe River Basin, Liaoning Province, China. Acta Ecol. Sin. 2020, 40, 6486–6494. [Google Scholar]
  18. McRae, B.H.; Beier, P. Circuit theory predicts gene flow in plant and animal populations. Proc. Natl. Acad. Sci. USA 2007, 104, 19885–19890. [Google Scholar] [CrossRef]
  19. Carroll, C.; Roberts, D.R.; Michalak, J.L.; Lawler, J.J.; Nielsen, S.E.; Stralberg, D.; Hamann, A.; Mcrae, B.H.; Wang, T. Scale-dependent complementarity of climatic velocity and environmental diversity for identifying priority areas for conservation under climate change. Glob. Chang. Biol. 2017, 23, 4508–4520. [Google Scholar] [CrossRef]
  20. Dilts, T.E.; Weisberg, P.J.; Leitner, P.; Matocq, M.D.; Inman, R.D.; Nussear, K.E.; Esque, T.C. Multiscale connectivity and graph theory highlight critical areas for conservation under climate change. Ecol. Appl. 2016, 26, 1223–1237. [Google Scholar] [CrossRef]
  21. Proctor, M.F.; Nielsen, S.E.; Kasworm, W.F.; Servheen, C.; Radandt, T.G.; Machutchon, A.G.; Boyce, M.S. Grizzly bear connectivity mapping in the Canada–United States trans-border region. J. Wildl. Manag. 2015, 79, 544–558. [Google Scholar] [CrossRef]
  22. Peng, J.; Guo, X.; Hu, Y.; Liu, Y. Constructing Ecological Security Patterns in Mountain Areas Based on Geological Disaster Sensitivity: A Case Study in Yuxi City, Yunnan Province, China. Chin. J. Appl. Ecol. 2017, 28, 627–635. [Google Scholar]
  23. Ma, L.; Bo, J.; Li, X.; Fang, F.; Chen, W.J. Identifying key landscape pattern indices influencing the ecological security of inland river basin: The middle and lower reaches of Shule River Basin as an example. Sci. Total Environ. 2019, 674, 424–438. [Google Scholar] [CrossRef]
  24. Xiong, S.G.; Qin, C.B.; Yu, L.; Fang, F.; Cheng, W. Methods to identify the boundary of ecological space based on ecosystem service functions and ecological sensitivity: A case study of Nanning City. Acta Ecol. Sin. 2018, 38, 7899–7911. [Google Scholar]
  25. Chen, Y.Y.; Luo, Z.J.; Qi, S.; Zhao, J.; Yuan, Y.; Li, F. Ecological security pattern construction of Nanchang City based on ecological sensitivity and ecological network. Res. Soil Water Conserv. 2021, 28, 342–349. [Google Scholar]
  26. Fu, B. Several key points in territorial ecological restoration. Bull. Chin. Acad. Sci. (Chin. Version) 2021, 36, 64–69. [Google Scholar]
  27. Yu, K.; Wang, S.; Li, D.; Li, C.-B. The function of Ecological security patterns as an urban growth framework in Beijing. Acta Ecol. Sin. 2009, 29, 1189–1204. [Google Scholar]
  28. Li, Q.; Tang, L.; Qiu, Q.; Li, S.; Xu, Y. Construction of urban ecological security pattern based on MSPA and MCR Model: A case study of Xiamen. Acta Ecol. Sin. 2024, 44, 6. [Google Scholar]
  29. Chen, J.; Wang, S.; Zou, Y. Construction of an ecological security pattern based on ecosystem sensitivity and the importance of ecological services: A case study of the Guanzhong Plain urban agglomeration, China. Ecol. Indic. 2022, 136, 108688. [Google Scholar] [CrossRef]
  30. Xu, W.; Wang, J.; Zhang, M.; Li, S. Construction oflandscape ecological network based on landscape ecologicalrisk assessment in a large-scale opencast coal mine area. J. Clean. Prod. 2021, 286, 125523. [Google Scholar] [CrossRef]
  31. Zhang, B.; Li, W.; Yu, G.; Xiao, Y. Water conservation of forest ecosystem in Beijing and its value. Ecol. Econ. 2010, 69, 1416–1426. [Google Scholar]
  32. Yu, K. Security patterns and surface model in landscape ecological planning. Landsc. Urban Plan. 1996, 36, 1–17. [Google Scholar] [CrossRef]
  33. Knaapen, J.P.; Scheffer, M.; Harms, B. Estimating habitat isolation in landscape planning. Landsc. Urban Plan. 1992, 23, 1–16. [Google Scholar] [CrossRef]
  34. Kong, F.; Yin, H.; Nakagoshi, N.; Zong, Y. Urban green space network development for biodiversity conservation: Identification based on graph theory and gravity modeling. Landsc. Urban Plan. 2010, 95, 16–27. [Google Scholar] [CrossRef]
  35. Zhang, X.; Li, Z.; Wang, R.; Wang, Y.; Li, F.; Xiong, X. Study on Network Analysis for Urban Ecological Security Pattern in Changzhou City. Acta Sci. Nat. Univ. Pekin. 2009, 45, 728–736. [Google Scholar]
  36. Peng, J.; Yang, Y.; Liu, Y.; Du, Y.; Meersmans, J.; Qiu, S. Linking ecosystem services and circuit theory to identify ecological security patterns. Sci. Total Environ. 2018, 644, 781–790. [Google Scholar] [CrossRef]
  37. Doyle, P.G.; Snell, J.L. Random Walks and Electric Net-Works; The Mathematical Association of America: Washington, DC, USA, 1984. [Google Scholar]
  38. McRae, B.H.; Dickson, B.G.; Keitt, T.H.; Shah, V.B. Using circuit theory to model connectivity in ecology, evolution, and conservation. Ecology 2008, 89, 2712–2724. [Google Scholar] [CrossRef]
  39. McRae, B.H.; Kavanagh, D.M. Linkage MapperConnectivity Analysis Software; The Nature Conservancy: Seattle, WA, USA, 2011; Available online: https://linkagemapper.org/ (accessed on 28 February 2023).
  40. Adriaensen, F.; Chardon, J.P.; De Blust, G.; Swinnen, E.; Villalba, S.; Gulinck, H.; Matthysen, E. The application of ‘least-cost’modelling as a functional landscape model. Landsc. Urban Plan. 2003, 64, 233–247. [Google Scholar] [CrossRef]
  41. Zhao, X.Q.; Xu, X.H. Research on landscape ecological security pattern in a eucalyptus introduced region based on biodiversity conservation. Russ. J. Ecol. 2015, 46, 59–70. [Google Scholar] [CrossRef]
  42. Yu, J.; Tang, B.; Chen, Y.; Zhang, L.; Nie, Y.; Deng, W. Landscape ecological risk assessment and ecological security pattern constructionin landscape resource-based city: A case study of Zhangjiajie City. Acta Ecol. Sin. 2022, 42, 1290–1299. [Google Scholar]
  43. Xu, D.; Guo, X.; Watanabe, T.; Liang, K.; Kou, J.; Jiang, X. Ecological Security Pattern Construction in Rural Settlements Based on Importance and Vulnerability of Ecosystem Services: A Case Study of the Southeast Region of Chongqing, China. Sustainability 2023, 15, 7477. [Google Scholar] [CrossRef]
  44. MacMillan, R.A.; Moon, D.E.; Coupé, R.A. Automated predictive ecological mapping in a forest region of BC, Canada, 2001–2005. Geoderma 2007, 140, 353–373. [Google Scholar] [CrossRef]
  45. Li, J.; Meng, J.; Mao, X. MCR based model for developing land use ecological security pattern in Farming-Pastoral Zone: A case study of Jungar Banner, Ordos. Acta Sci. Nat. Univ. Pekin. 2013, 49, 707–715. [Google Scholar]
  46. Wang, R.; Li, X.; Zhang, S.; Li, Y.; Cao, C. Research for landscape ecological security pattern and early warning in farming-pastoral zone of northeast China: A case study of Tongyu county in Jilin province. Geogr. Geo-Inf. Sci. 2014, 30, 111–115. [Google Scholar]
  47. Pan, J.; Liu, X. Landscape ecological risk assessment and landscape security pattern optimization in Shule River basin. Chin. J. Ecol. 2016, 35, 791–799. [Google Scholar]
  48. Zhang, Y.; Yu, C.; Tashpolat, T.; Zhang, Z. Methodology for constructing the landscape ecological security pattern in scenic area: A case study in the scenic area in the Miaofeng Mountain. Arid Zone Res. 2008, 25, 420–425. [Google Scholar]
  49. Bush, M.; Flenley, J.; Gosling, W. (Eds.) Tropical Rainforest Responses to Climatic Change; Springer Science & Business Media: Berlin/Heidelberg, Germany, 2011. [Google Scholar]
  50. Corlett, R.T. Impacts of warming on tropical lowland rainforests. Trends Ecol. Evol. 2011, 26, 606–613. [Google Scholar] [CrossRef]
  51. Corlett, R.T.; Primack, R.B. Tropical rainforest conservation: A global perspective. In Tropical Forest Community Ecology; Blackwell Science: Hoboken, NJ, USA, 2008; pp. 442–457. [Google Scholar]
  52. Adekunle, V.A.J. Conservation of tree species diversity in tropical rainforest ecosystem of South-West Nigeria. J. Trop. For. Sci. 2006, 18, 91–101. [Google Scholar]
  53. Turner, I.M.; Corlett, R.T. The conservation value of small, isolated fragments of lowland tropical rain forest. Trends Ecol. Evol. 1996, 11, 330–333. [Google Scholar] [CrossRef]
  54. Laurance, W.F. Ecological correlates of extinction proneness in Australian tropical rain forest mammals. Conserv. Biol. 1991, 5, 79–89. [Google Scholar] [CrossRef]
  55. Rolfe, J.; Bennett, J.; Louviere, J. Choice modelling and its potential application to tropical rainforest preservation. Ecol. Econ. 2000, 35, 289–302. [Google Scholar] [CrossRef]
  56. Wies, G.; Arzeta, S.N.; Ramos, M.M. Critical ecological thresholds for conservation of tropical rainforest in Human Modified Landscapes. Biol. Conserv. 2021, 255, 109023. [Google Scholar] [CrossRef]
  57. Wen, C.; Wang, L.; Chen, M. Spatial and Temporal Variation of Stability of Soil Water-Stable Aggregates in Rubber Plantation in Xishuangbanna. Adv. Geosci. 2018, 8, 662–672. [Google Scholar] [CrossRef]
Figure 1. Overview of the study area.
Sustainability 16 03290 g001
Figure 2. Framework for identifying ecological security patterns.
Sustainability 16 03290 g002
Figure 3. Spatial patterns of ecosystem service importance in Xishuangbanna: (a) water conservation; (b) soil conservation; (c) biodiversity conservation; and (d) importance of ecosystem services.
Sustainability 16 03290 g003
Figure 4. Spatial patterns of ecosystem sensitivity in Xishuangbanna: (a) soil loss sensitivity; (b) Rock desertification; and (c) ecological sensitivity.
Sustainability 16 03290 g004
Figure 5. Spatial distribution map of nature reserves and in Xishuangbanna.
Sustainability 16 03290 g005
Figure 6. Spatial pattern of the ecological Sources in Xishuangbanna.
Sustainability 16 03290 g006
Figure 7. Spatial patterns of ecosystem sensitivity in Xishuangbanna.
Sustainability 16 03290 g007
Figure 8. Spatial patterns of Ecological corridors in Xishuangbanna.
Sustainability 16 03290 g008
Figure 9. Spatial distribution of Ecological corridors Cumulative current in Xishuangbanna.
Sustainability 16 03290 g009
Figure 10. Spatial distribution of Ecological Pinch points in Xishuangbanna.
Sustainability 16 03290 g010
Figure 11. Spatial distribution of Ecological corridors Cumulative resistance in Xishuangbanna.
Sustainability 16 03290 g011
Figure 12. Spatial distribution of barriers in Xishuangbanna.
Sustainability 16 03290 g012
Table 1. Common terms used in circuit theory, units, and their ecological interpretations.
TermUnitEcological Interpretation
Resistance (R)OhmSimilar to the concept of landscape resistance, the greater the electrical resistance, the stronger the hindrance to species movement (migration or dispersal).
Conductance (G)SiemensThe reciprocal of electrical resistance, similar to habitat permeability, the greater the electrical conductivity, the more favorable it is for species movement (migration or dispersal).
Effective resistance ( R ^ )OhmThe measurement index for the degree of isolation between two nodes or two pixels in raster data, wherein the effective electrical resistance decreases as the connectivity path between nodes or pixels increases.
Effective conductance ( R ^ )SiemensThe measurement index for the connectivity between two nodes or two pixels in raster data, wherein it increases as the available paths between nodes or pixels increase.
Current (I)AmpereThis reflects the net number of times random walkers pass through corresponding nodes or paths before reaching the target habitat, which is used to predict the net migration probability of species through the corresponding nodes or paths and, thus, predict areas with higher levels of connectivity.
Voltage (V)VoltThe measurement index of the probability for a random walker to leave any node (or pixel) and successfully reach a given target node (or pixel) (i.e., the probability of successful diffusion).
Table 2. Area statistics of ecosystem service importance in different areas.
CitiesGeneral
Important (km2)
Percentage
(%)
Very
Important (km2)
Percentage
(%)
Extremely
Important (km2)
Percentage
(%)
MengHai2147.529.232566.52930.50651.657619.53
JingHong2686.2336.572637.91831.371539.78846.15
Mengla2511.93134.203206.84138.131145.09334.32
All7345.661-8411.283-3336.5386-
Table 3. Area statistics of ecological sensitivity in different cities.
CitiesLow
Sensitity (km2)
Percentage
(%)
Moderate
Sensitity (km2)
Percentage
(%)
High
Sensitity (km2)
Percentage
(%)
MengHai2753.63526.881918.91526.44686.340943.53
JingHong3918.15638.252320.91431.98621.253839.40
Mengla3571.21234.873018.05541.58269.076617.06
All10,243.003-7257.884-1576.6713-
Disclaimer/Publisher’s Note: The statements, opinions and data contained in all publications are solely those of the individual author(s) and contributor(s) and not of MDPI and/or the editor(s). MDPI and/or the editor(s) disclaim responsibility for any injury to people or property resulting from any ideas, methods, instructions or products referred to in the content.

