Article

Design and Simulation of the Biodiesel Process Plant for Sustainable Fuel Production

by
Abul Kalam Azad
1,*,
Abhijaysinh Chandrasinh Jadeja
1,
Arun Teja Doppalapudi
1,
Nur Md Sayeed Hassan
2,
Md Nurun Nabi
1 and
Roshan Rauniyar
1
1
School of Engineering and Technology, Central Queensland University, 120 Spencer Street, Melbourne, VIC 3000, Australia
2
School of Engineering and Technology, Central Queensland University, Cairns, QLD 4870, Australia
*
Author to whom correspondence should be addressed.
Sustainability 2024, 16(8), 3291; https://doi.org/10.3390/su16083291
Submission received: 13 March 2024 / Revised: 5 April 2024 / Accepted: 11 April 2024 / Published: 15 April 2024
(This article belongs to the Section Energy Sustainability)

Abstract

:
The biodiesel production process is extensively studied in the literature, focusing on mechanisms, modeling, and economic aspects, yet plant design and fluid flow losses remain underexplored areas. The study addressed this gap by designing a biodiesel production plant, analyzing flow losses, and developing a pipe network and suitable pump models. In this study, an integration of biodiesel production plant design and simulation of continuous production of Calophyllum inophyllum biodiesel was investigated. Biodiesel production encompasses complex stages that involve systematic planning and system design. The goal of the plant design is to reduce the losses that occur during the conversion process, which can reduce the capital cost of the plant. A few assumptions were made when selecting biodiesel plant materials, such as pipes, pumps, fittings, and bends. These assumptions were based on considerations of the biodiesel fluid properties and pressure requirements. On the other hand, Aspen Plus was used to simulate the biodiesel production process. Calophyllum inophyllum was considered oil as the biodiesel feedstock and was inputted to the Aspen Plus as triglyceride composition. The simulation was carried out with rigorous kinetic reactions using the Non-Random Two-Liquid (NRTL) method to predict the liquid equilibrium in the reactor. Results revealed that the designed steel pipe meets safety requirements with a bursting pressure of 49.68MPa, capable of withstanding the maximum pressure of 4 bar and turbulent flow conditions. Additionally, the selected pump satisfies the required head and flow rate, ensuring efficient fluid movement. Moreover, simulation results closely matched experimental data, and 88% of biodiesel yield was recorded.

1. Introduction

The need to meet the world’s rising energy demands cost-effectively is a crucial global need, necessitating increased creative work on cutting-edge renewable energy frameworks for oil-based energy [1]. The world population is increasing and is expected to increase in the future [2]. This rising population grows the world’s energy demands as well. According to the Energy Information Administration (EIA), around 87% of global energy consumption is met by fossil fuels (including coal, natural gas, and petroleum oil) [3]. These fossil fuel reserves are continuously depleting as they are non-renewable [4]. In addition, the excessive use of fossil fuels has resulted in significant global climate change [5,6]. A strong pressing need arises to identify sustainable energy sources to meet the increasing energy demand [7,8]. So, it is essential to have research on the replacement of fossil fuels with biofuels that have lesser impacts on the environment [9,10]. Among all different biofuels, biodiesel has sparked much interest and fame among the various alternative fuel options [11,12]. Therefore, maximizing the development and utilization of biodiesel may be a potential solution to the current problem [13,14,15].
Biodiesel is the fuel for diesel engines produced from renewable/natural sources that meet the standard specifications imposed by the American Society for Testing and Materials ASTM D6751 standard [16]. Biodiesel is produced from fats and oils containing ethyl or methyl esters [17,18]. They are non-toxic and biodegradable [19,20]. For instance, various feedstocks such as babassu, andiroba, almond, tamanu, camelina, copra, coconut, fish oil, jatropha, groundnut, microalgae, Karanja, oat, sesame, poppy seed, and sorghum are used in several studies to produce biodiesel esters [21,22,23,24,25,26,27,28,29]. Several methods are used to convert biodiesel, including thermochemical, biochemical, and electrochemical conversion [30,31]. The most efficient method is the transesterification method, which follows the thermochemical conversion process, where triglyceride molecules react with alcohol in the presence of a catalyst. This chemical conversion process converts fatty acids to esters and glycerin [32]. Base catalysts such as sodium hydroxide and potassium hydroxide were widely used in commercial applications [33]. Despite the mentioned advantages of biodiesel for sustainability, the commercialization of biodiesel has not occurred due to its high cost compared to fossil fuels [34].
The cost of biodiesel production is associated with the cost of feedstock. Thus, efforts need to be applied to produce biodiesel from various feedstocks using the most efficient process. The production process plant has been modeled using Aspen Plus to optimize the cost of production [35]. The analysis will be conducted for different plant configurations to optimize the plant and suit continuous biodiesel conversion.
Before developing any production process, a mathematical model of the unit is usually made to identify different operations. Similarly, mathematical models are built for biodiesel production plants. Various researchers have performed a cost analysis of biodiesel production plants. For instance, Haas et al. [36] developed a mathematical model of the biodiesel production plant to determine the cost of producing biodiesel. They determined the capital and operational cost of the plant using the computer-based model. The three main reaction types are considered in their model, i.e., (i) transesterification of vegetable oil, (ii) ester recovery, and (iii) glycol recovery. The production capacity of the plant is 37.8 million liters annually. They studied the impact of feedstock expenses on the overall biodiesel production costs. In addition, Lee et al. [37] simulated three different biodiesel production processes with a 40,000 tone/year capacity using Aspen HYSYS. Using the Aspen Plant cost estimator, they also performed the economic analysis of the production process. They studied alkali-catalyzed processes and supercritical methanol processes for the conversion of waste cooking oil to biodiesel. The study revealed that the alkali-catalyzed process with fresh vegetable oil as the feedstock has a lower capital investment. However, the supercritical process emerged as the most economically viable option, with superior advantages in terms of lower manufacturing costs, higher net present value, and a discounted cash flow rate of return. The study also revealed that feedstock oil contributes the highest independence of feedstock and process for biodiesel production. The feedstock cost of fresh vegetable oil is high, contributing to the highest operating cost of the other considerations. Furthermore, Poddar et al. [38] developed a biodiesel production process using reactive distillation with alkali and heterogeneous catalysts. They simulated the biodiesel production process using Aspen Plus V11 process simulator software. They compared the costs of two different processes and found the biodiesel production cost slightly higher but insignificant.
Most of the previous literature is based on the production mechanism of biodiesel [39,40,41]. Several studies have focused on modeling the biodiesel production process, and several more have discussed energy consumption, mass and heat integration methods, economic evaluation, and life cycle assessment [37,42,43,44,45,46,47]. However, there are very few studies on the production plant design and the fluid flow losses that relate to the conversion process. The present study aimed to design a biodiesel production plant to estimate the flow losses as per the fluid properties and propose the pump characteristics to effectively create a pipe network to the plant. The study focuses on a simple calculation approach and simulation analysis to obtain the main aims and objectives. Moreover, a detailed process simulation of the biodiesel production process using the Aspen Plus software is presented in the study to analyze the proposed plant layout. The biodiesel production process needs to be well understood, and plant optimization needs to be performed. This will help to bring down the overall production cost. The study focused on designing a schematic diagram of the whole plant along with the piping system, pumps, and appropriate placement of the vessels in which various processes conduct the production of the biodiesel.

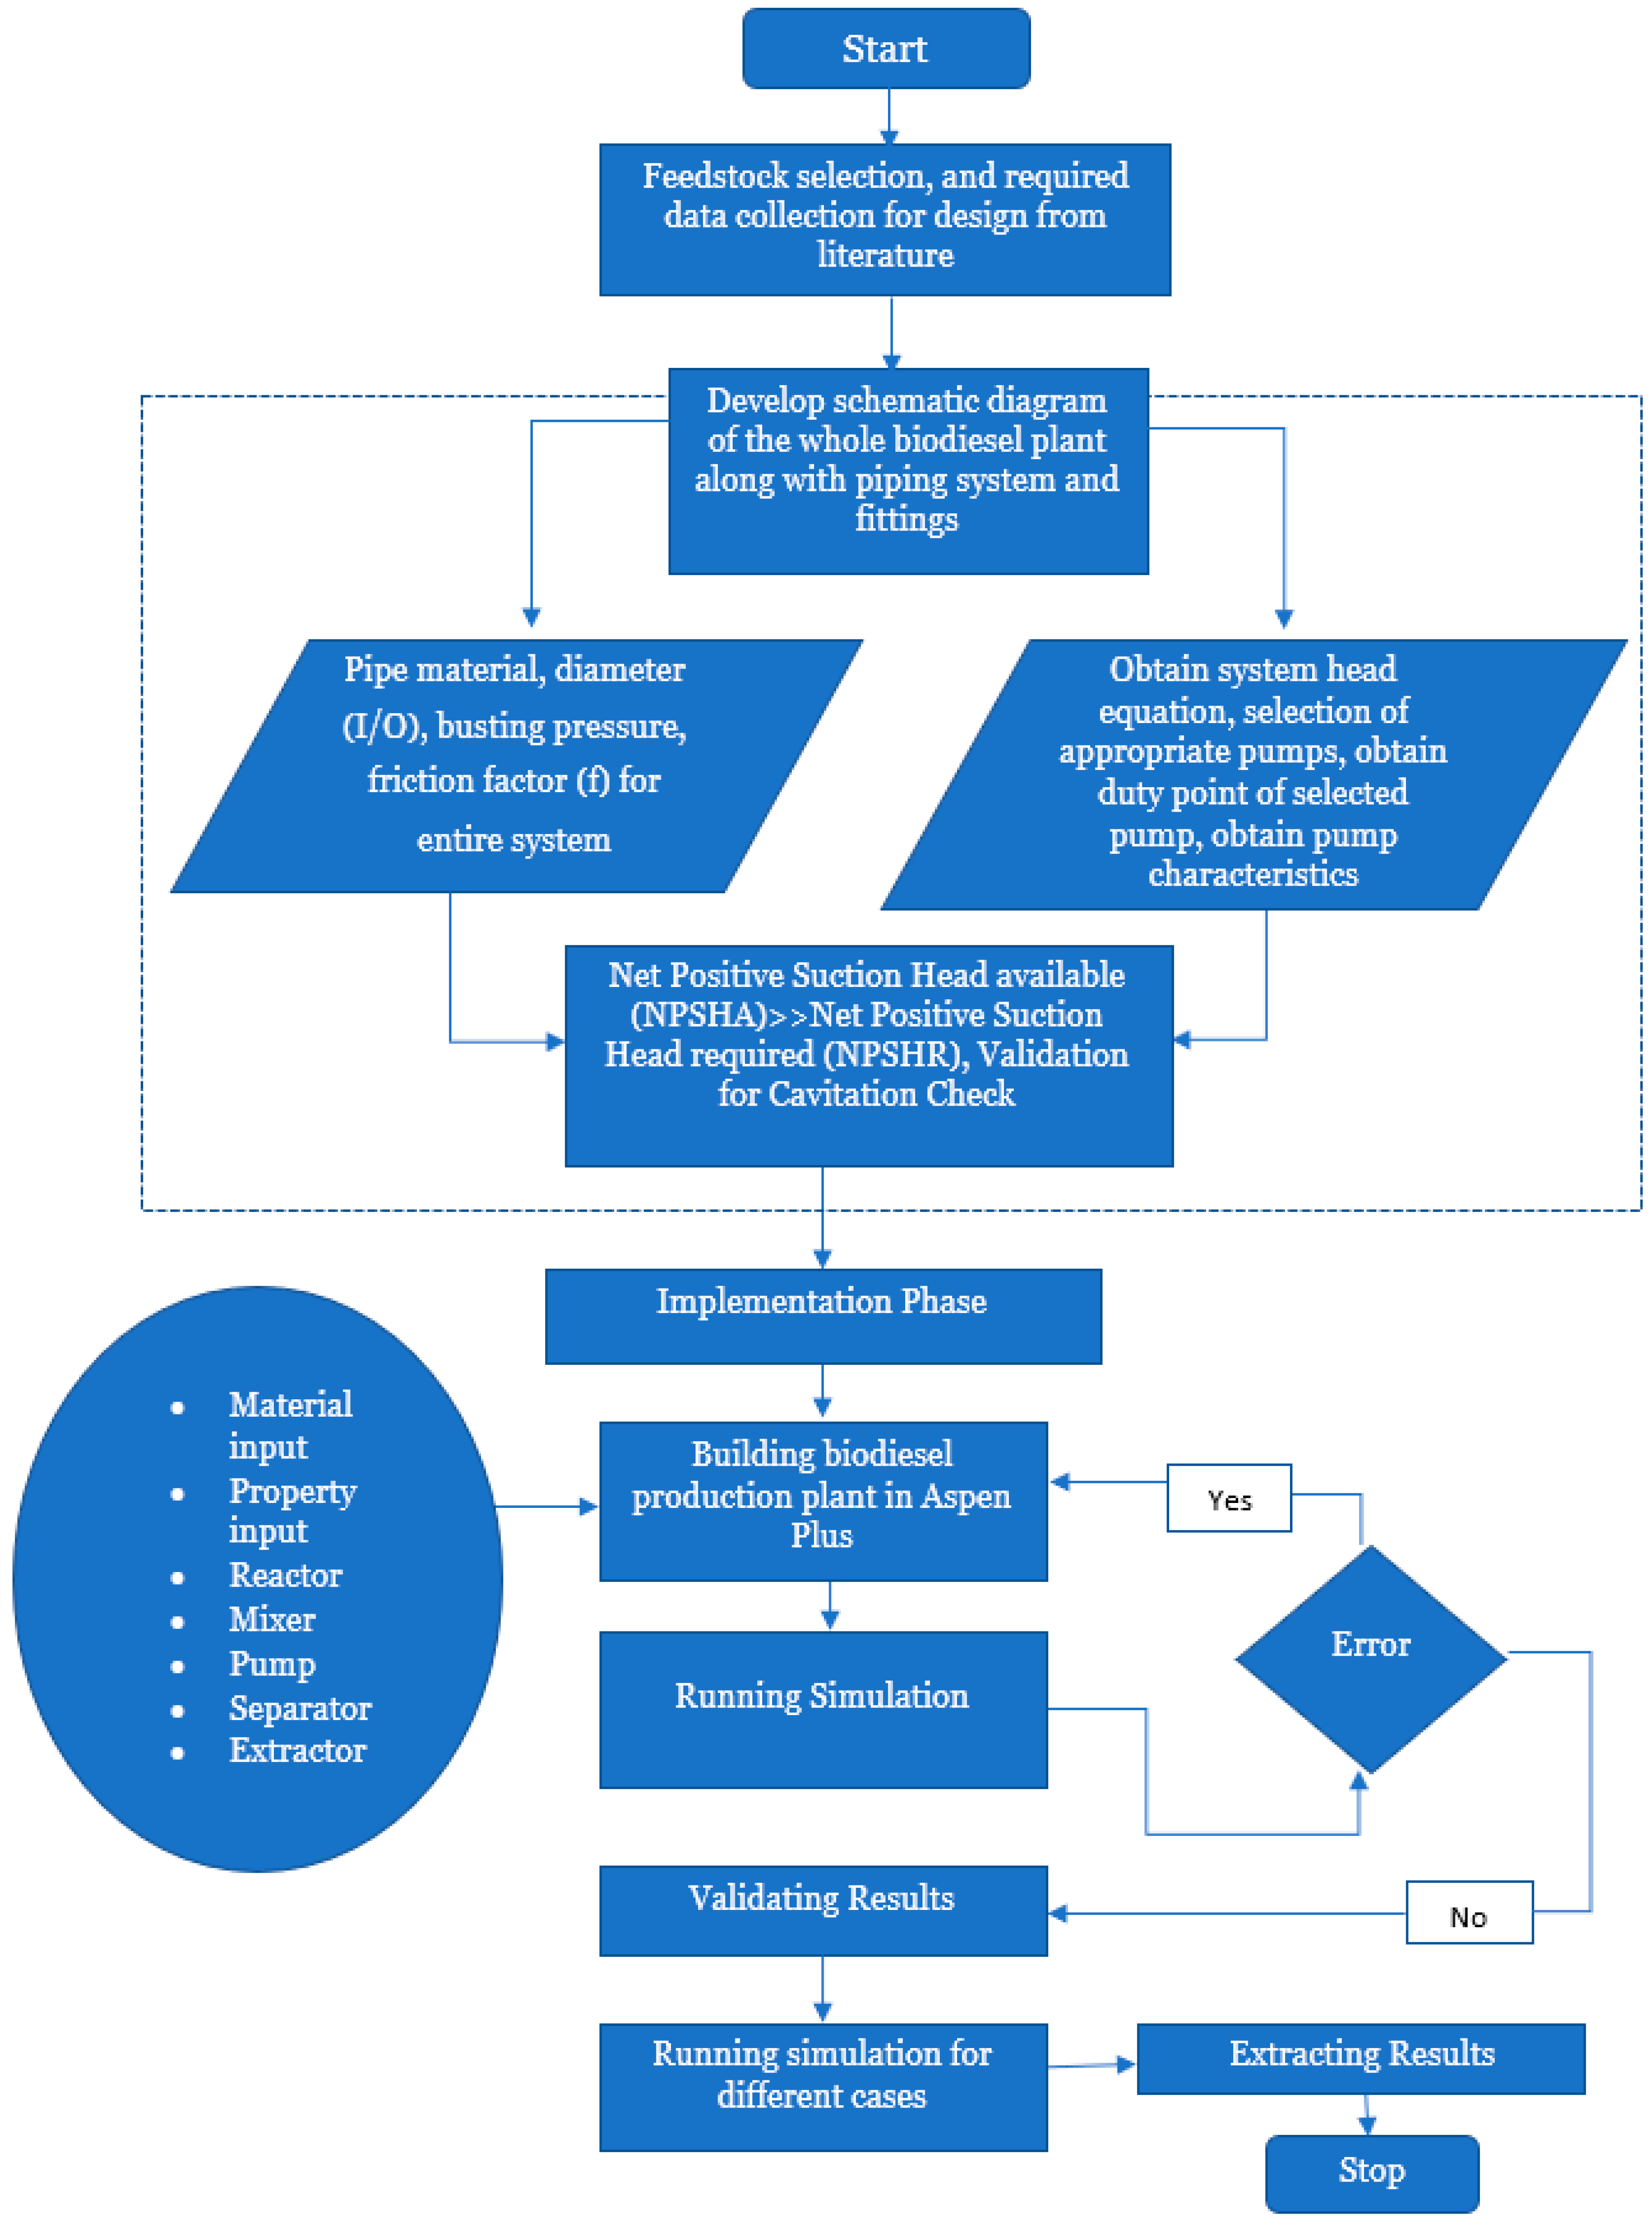
2. Materials and Methods

Biodiesel production plants require different components such as storage tanks, reactors, agitators, valves, flowmeters, heat exchangers, pumps, and pipeline networks. Various methods can be used to design a fluid flow system of a biodiesel production plant with minimum fluid losses and improved yield strength and conversion rate of biodiesel production. Figure 1 illustrates the schematic diagram with the main components and flow directions. Methanol and solid catalysts were mixed rigorously before being directed to the reactor. On the other hand, the oils with different feedstocks were mixed in Mixer 2 and then passed to the transesterification reactor. After the conversion process, the converted fatty acid methyl ester (FAME) was passed to a water-washing chamber to clean the FAME, which was then further purified in a purification chamber where excess methanol and water components were separated. Meanwhile, the collected glycerol was further purified by removing the excess catalyst and water.
Figure 2 illustrates the flow chart involving seven steps followed to complete the design and simulation process. Each of those steps is briefly discussed below.
Step 1: The first step of the study is to conduct deep research and literature on the different feedstocks and their production methods. This helps to collect required design data and parameters of vessels, piping systems, and pumps that can be used to design a schematic diagram.
Step 2: The next step is to obtain a schematic diagram of the entire fluid flow system to produce biodiesel. This will provide the location of all the components, including the piping system, fittings, vessels, and pumps. This will provide the required values for the calculation of the fluid flow system.
Step 3: The next step is to assume certain variables such as velocity, fluid flow rate, and pipe material to be used to find the diameter of the pipe used, bursting pressure, working pressure, and friction factor of the entire fluid flow system.
Step 4: The next step is to obtain the system head equation, which is an important variable in the selection of appropriate pumps from the commercial market. The system head equation is the summation of the static head and dynamic head produced in the system. It can provide the different heads that will be produced in the system with different fluid flow rates, which helps in the pump selection. Further, the duty points and characteristics of the selected pump will be obtained using the performance curve and system head Equation (1) curve [48,49].
System head equation
Q = A + BQ2
here, A = H s t a t i c , constant static pressure head as shown in Equation (2).
H s t a t i c = P 2 P 1 ρ g + ( z 2 z 1 )
where, P1 and P2 are the Pressures at the inlet and exit in Pa, Z1, and Z2 are the head at the inlet and exit in m, ρ refers to Fluid density (kg/m3), and g is acceleration due to gravity (m/s2).
Additionally, B =Hdynamic, dynamic head loss, and head loss due to velocity change (3).
H d y n a m i c = V 2 2 V 1 2 2 g + H L
where V1 and V2 refer to the fluid velocity at the inlet and exit (m/s), and HL is the head loss (m).
The methodology followed for performing analytical calculations is described here. The flow rate of different fluids flowing through the plant is assumed to calculate the head loss developed in the pipe network. This includes the flow rate of vegetable oil, methanol, and catalyst. The following steps are followed for the calculation of head loss in the plant.
The minor head loss factor ( K L ) are calculated for bends, valves, flanges, sudden contraction, and expansion throughout the plant were identified. Minor head loss was calculated using Equation (4). In addition, the major loss due to fluid velocity and friction on the internal wall was calculated using Equation (5). The friction factor (f) was determined from the Moody diagram using the corresponding Reynolds number and roughness ratio (ϵ/D). The total head loss is the integration of minor and major head losses and was calculated using Equation (6).
Minor   head   loss :   H m i n o r = Σ K L V 2 2 g
Major   head   loss :   H m a j o r = f l d V 2 2 g
Total   head   loss :   H L = f l d + Σ K L V 2 2 g
The cooling water flow rate required in a heat exchanger was calculated considering simple energy equations. The amount of total heat transfer required was obtained from Equation (7).
Q = m w C p ( T 2 T 1 )
where m w is the mass flow rate of water, C p is the specific heat of water, T is temperature, and subscripts 2 and 1 correspond to the outlet and inlet, respectively.
Step 5: The next step includes the calculation of the theoretical head and power. These theoretical values aid in identifying the duty point values.
Step 6: This step includes the cavitation check, in which the Net Positive Suction Head Available (NPSHA) is compared with the standard Net Positive Suction Head Required (NPSHR). This is an important criterion that verifies the validity of the fluid flow system.
Precise modeling of these components provides an idea of the feasibility of the plant. During the development of the plant layout, all components need to be modeled accurately. The plant layout has been prepared using commercial CAD modeling software Space Claim R2021. The routing feature of the software was used to prepare the plant layout. With the aid of the routing feature, a path for the tubes, pipes, and electrical cables can be created easily between components. This makes the creation of the plant layout easier.
Step 7: This is the final step of the implementation step. Figure 3 presents the flow chart for the methodology followed to conduct the Aspen simulation. As presented, a mathematical model of all the components will be set up in the Aspen Plus software to conduct a simulation of the whole system. Several simulations were performed with different components, providing an overview of the yield strength of the designed system. Table 1 presents the list of components used in the Aspen software to produce biodiesel fuel.

3. Results and Discussion

The present work is divided into two separate parts. This section is divided into two parts describing two aspects viz. (i) development of plant layout and its calculations, and (ii) evaluation of technical aspects of biodiesel production using the Aspen Plus.

3.1. Analytical Design and Calculations

According to Coronado. et al. [50], the biodiesel industry needs corrosion and degradation-resistant pipe material against the chemical agents present in biofuel. ASTM/ASME Commercial steel of welded standard (grade B) is considered a pipe material due to its suitability in coiling, bending, and flanging operations. For the current study, the pipe diameter and thickness are as per standard sch 40S.
Analytical calculations for the biodiesel production plant are reported in this section. Head loss in the pipe network, system curve, and heat exchanger calculations are reported in this section. Table 2 shows the calculations performed for the pipe network. The calculated bursting pressure of the selected pipe is 49.68 MPa which is significantly higher and flow behavior is turbulent as Re > 4000, making the system, design safe.
The friction factor of the pipe is 0.0165, which is a smooth pipe that allows for the flow of fluid. The coefficient of loss factor(K) is a constant that is directly proportional to pressure drop across components and fittings. The proposed production pipeline design shown in Figures 5–7 comprises multiple fittings such as elbow, flanges, bends, valves, and so on. Table 3 adds up all the loss factor values of different components and is considered as follows [51]:
  • Flange = 0.2 • Bend = 0.3;
  • Sudden entrance = 0.5 • Valve = 0.2; the valve is assumed to be completely open.
Table 2. Analytical calculations for pipe network.
Design ItemDescriptionDesign ValueCalculation
Pipe networkPipe materialCommercial Steel
ASTM/ASME A53/SA53-Seamless and welded standard steel pipes Grade B [52]
Bursting pressure = 2 t σ u t D = 2 0.006 414 × 10 6 0.1
= 49.68 M P a
Pipe dia (inner and outer)Di = 0.10 m
Do = 0.11 m
As per standard, Sch 40S
Pipe wall thicknesst = 0.006 m
Busting pressure49.68 MPa
Fitting loss
factor Σ K l
51.3The calculation is shown in Table 3
Friction factor (f) f = 0.0165
  • Assuming velocity (v) = 1 m/s
  • Viscosity, ( μ ) = 38.17 mm2/s
  • Roughness, ϵ = 0.045   m m   (Moody chart)
  • Relative Roughness ( ϵ D ) = 0.00045
  • Reynolds number (Re) = ρ v D μ = 2.3 × 10 6
Table 3. Calculations for loss factor.
Oil & KOH & Methanol TankReactor’s TankMethanol
Recovery Tank
Water Washing TankReactor Tank for Glycerol RemovalFAME/Glycerol Storage
InOutInOutInOutInOutInOutInOut
Flanges0.80.620.80.40.40.60.40.80.60.40.4
Bends01.861.81.23.62.44.83.632.41.2
Sudden entrance1.501.500.50101010
Valve 0.6020.80000.60.4000.4
Total2.92.411.53.42.1445.85.83.63.82
Σ K l 51.3
Table 4 shows the calculations for evaluating the total system head. The system head equation obtained is utilized to develop a system head curve, as presented in Figure 4.
Figure 4 illustrates the system head curve and pump characteristics curve for the flow rate. The system head curve is plotted using the system head equation from Table 4. It is found that the proposed designed system required a head of 66.9 m to pump the biodiesel fuel at a flow rate of 0.008 m3/s. From the curve, it is analyzed that the difference in head increment is not uniform. The total requirements of the head add up despite increasing the flow rate at a constant rate. Thus, a more powerful pump might be required if the system is modified.
The selection of a pump that is compatible with the fluid is crucial, as biodiesel is a flammable fluid. According to Chiavola and Palmieri [53], fluid properties have several factors that can influence pump performance and other hydraulic components. Table 5 shows the specifications of pumps used for the proposed designed system. The operating point of the pump is 67 m of head with a flow rate of 0.008 m3/s, which can pump the fuel with the required flow and pressure of the system.
Table 6 shows input specifications for the size of the tanks, reactors, and the flow rate required for heat exchangers in the system with a description.

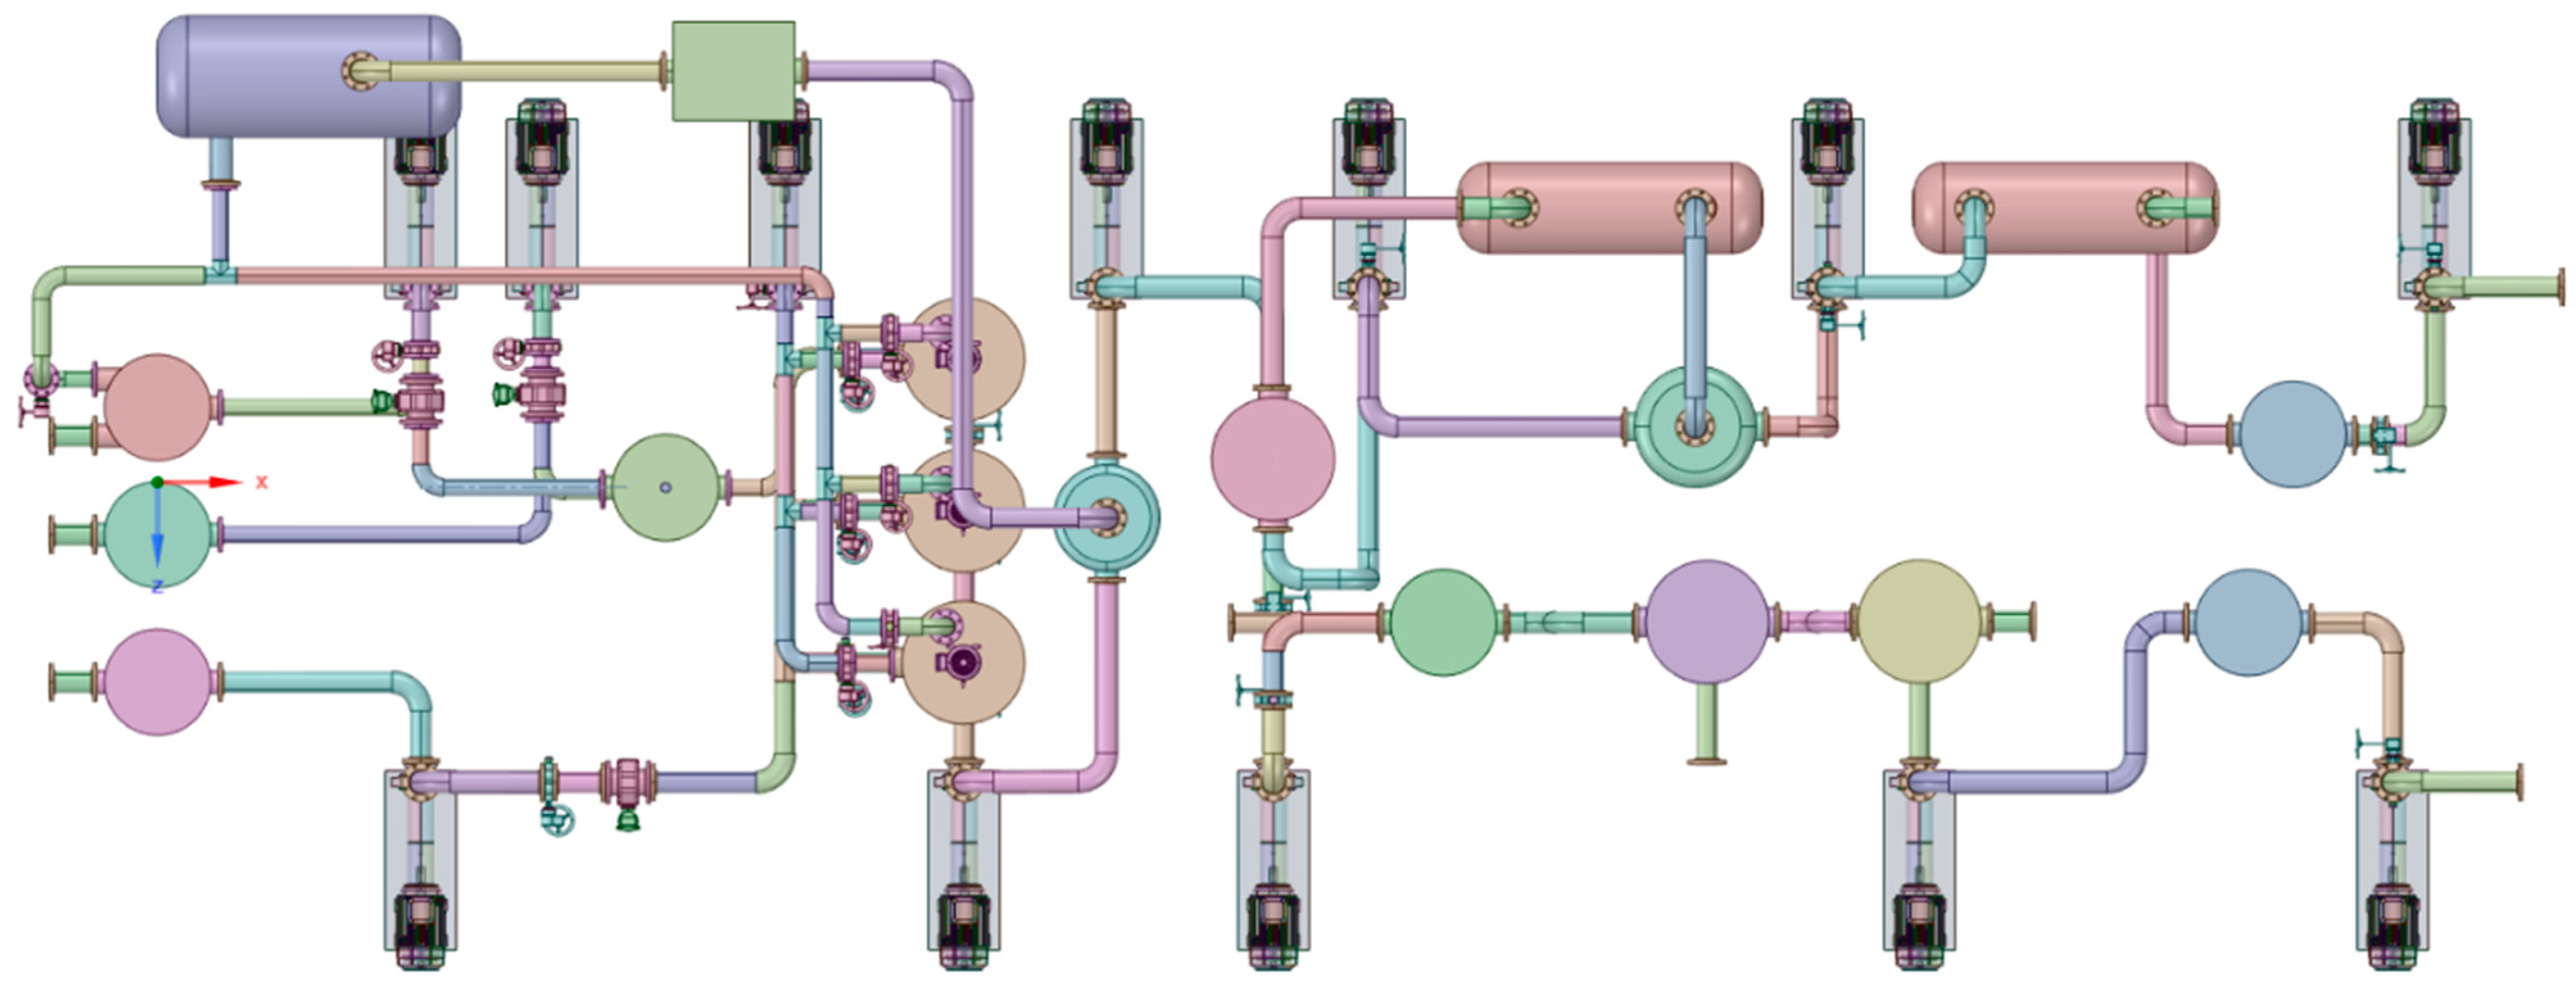
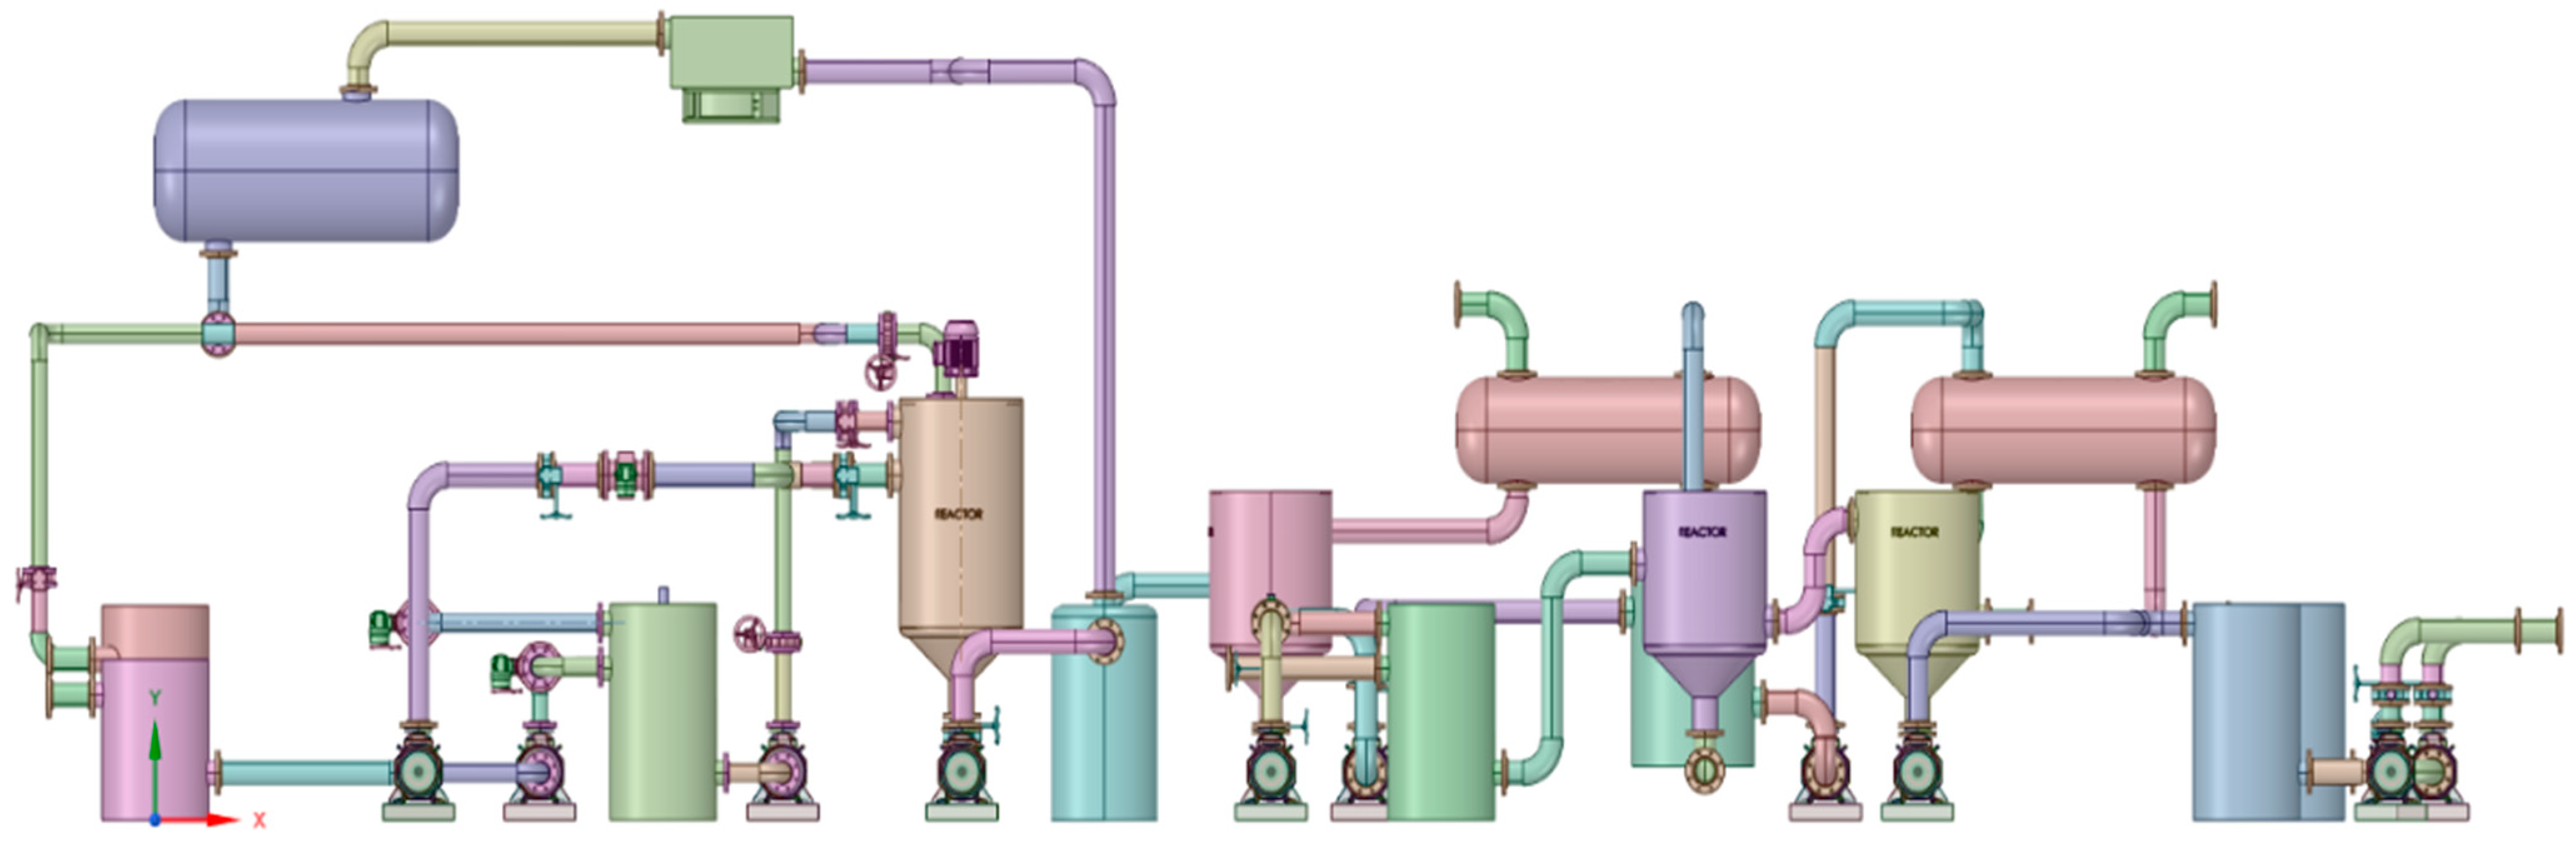
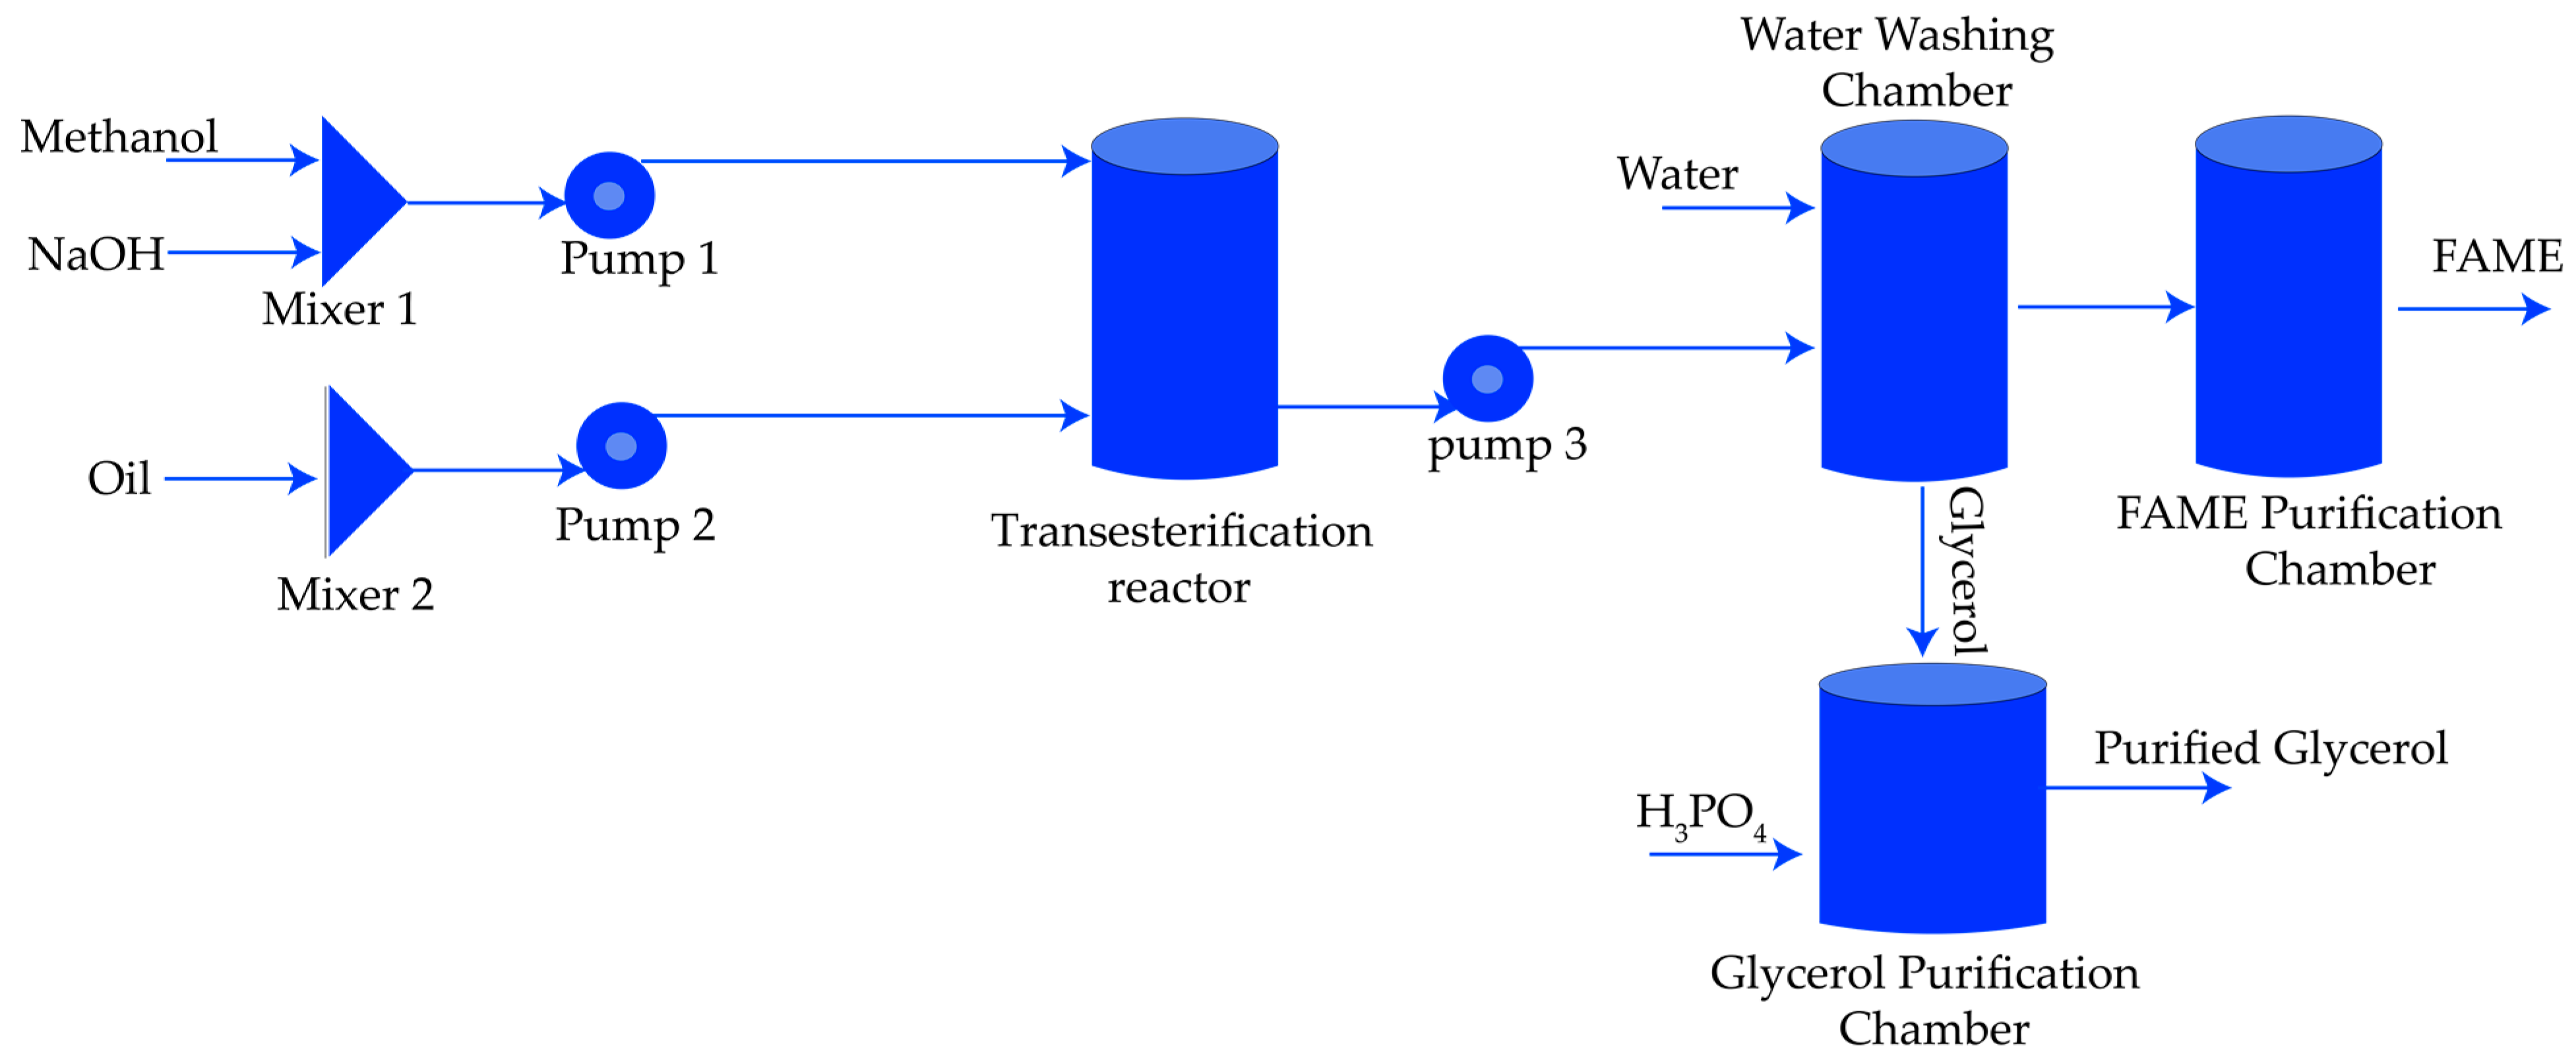
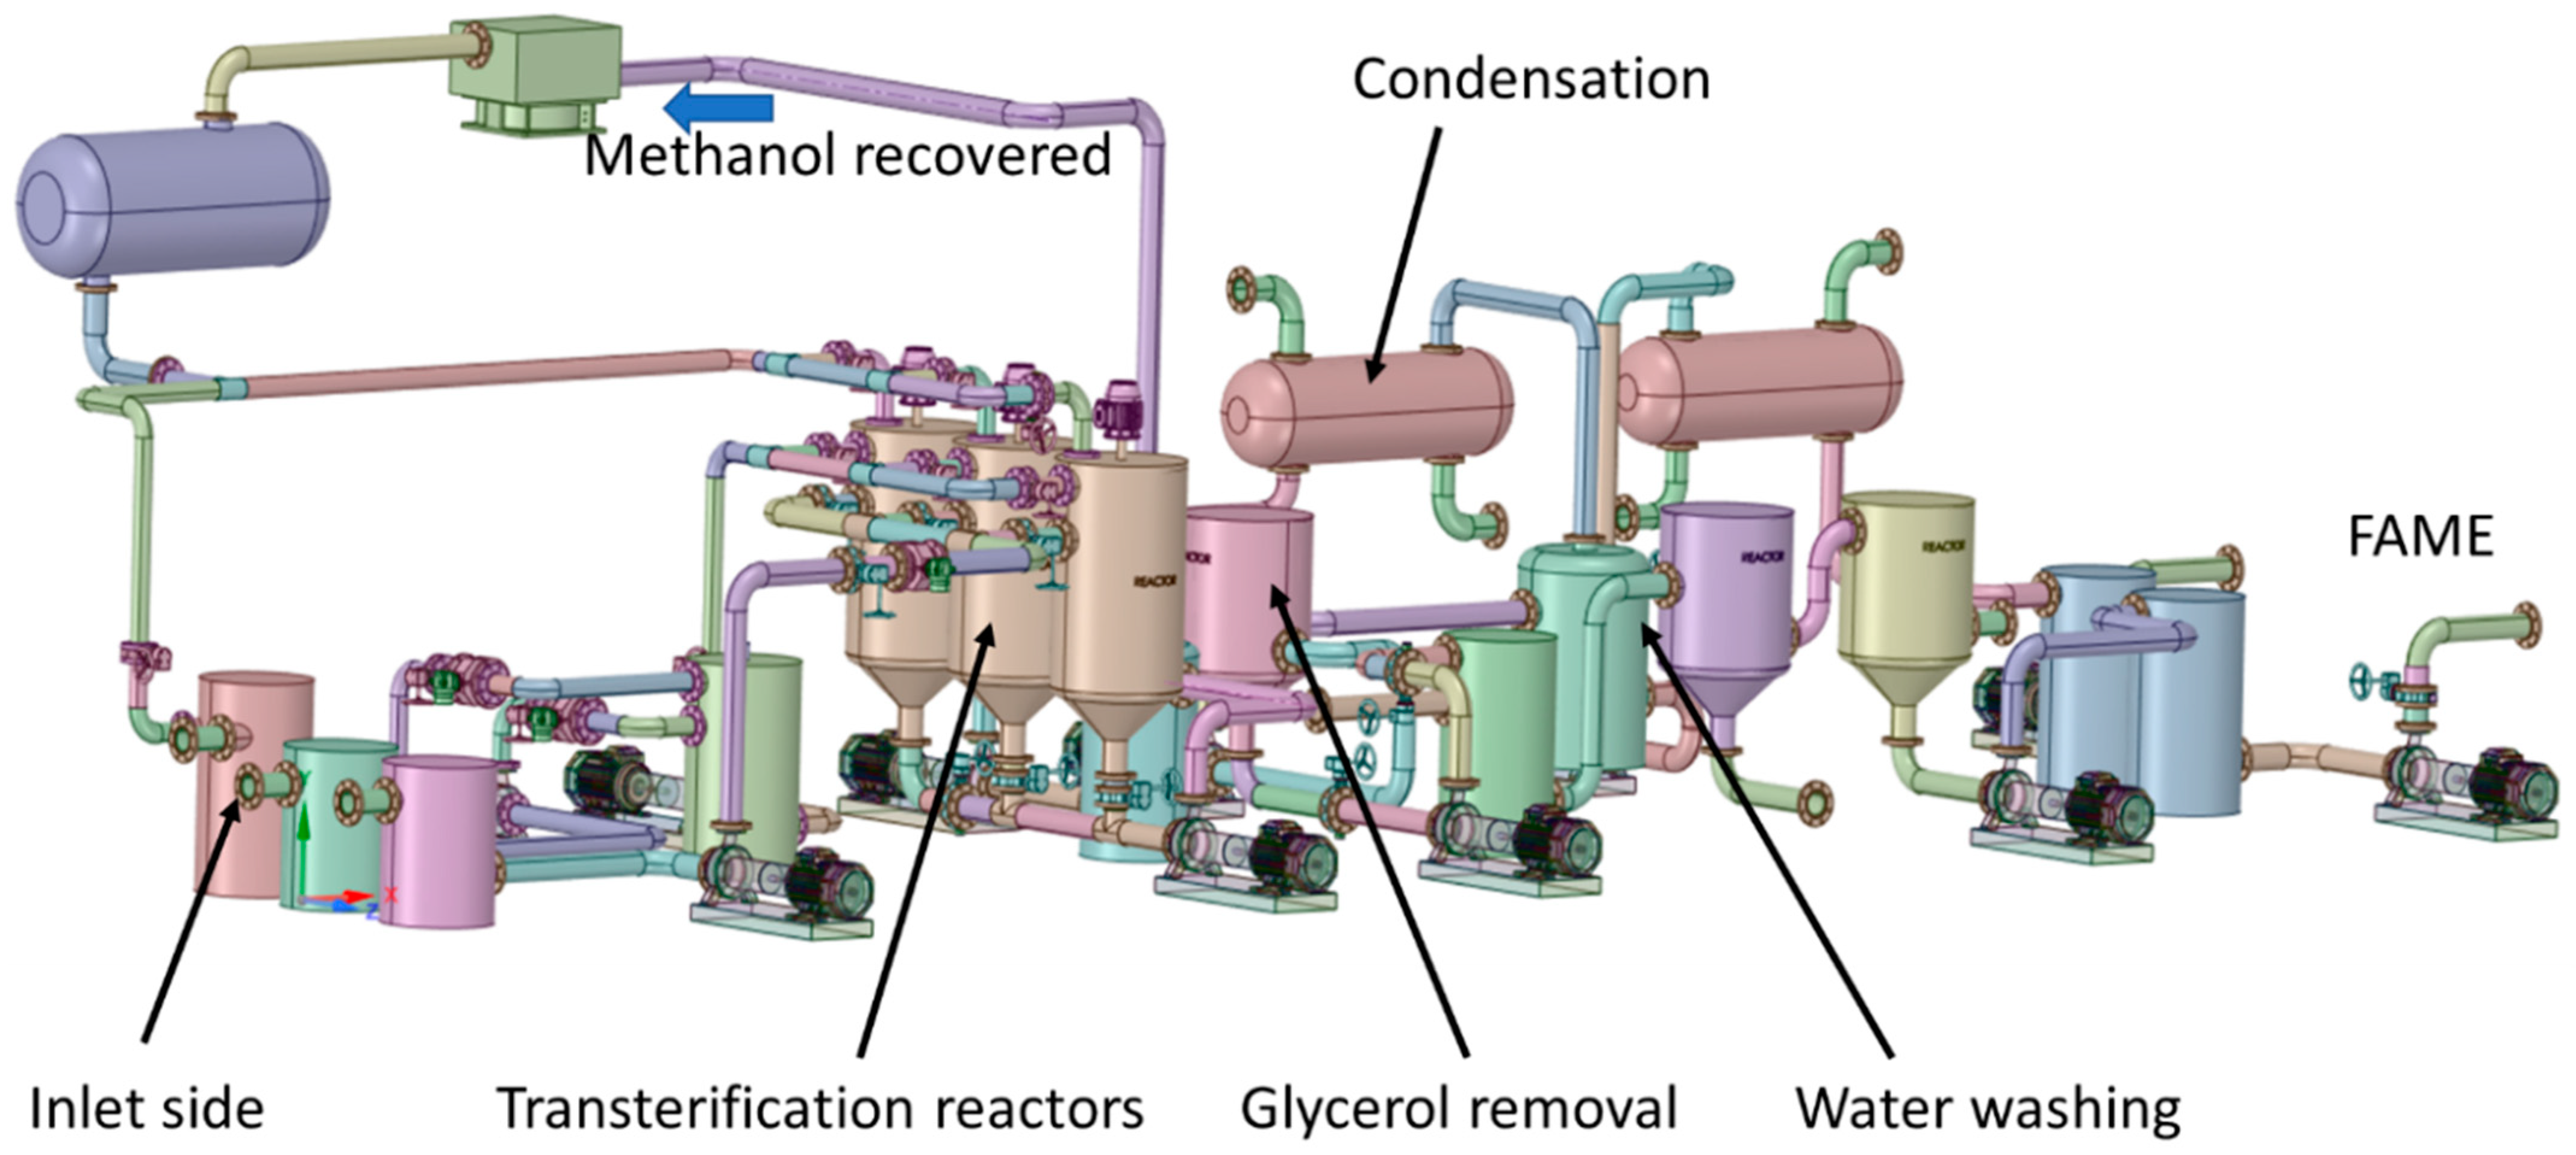
3.2. Biodiesel Plant Model

Figure 5, Figure 6 and Figure 7 illustrate the proposed biodiesel production plant layout’s top, isometric and front view. The plant has three tanks for storing the bio-oil, alcohol, and catalyst. Three reactors are added to the proposed model for the transesterification process. The transesterification reaction occurs in the first reactor in the first stage while the others are in the queue. In the later stages, the second reactor will be connected to the oil and methanol inputs, during which the transesterification will run in the first reactor. Similarly, when the third reactor is connected to the inputs, the first reactor will be in the final stages of the reaction, and the second reactor will initiate the process. The process will continue continuously for the large-scale production of biodiesel. As seen in Figure 5, Figure 6 and Figure 7, the layout highlights all the mechanical components, such as pumps, pipelines, fittings, and different stages of production. It also outlines the information related to bends and types of fittings in the pipeline for calculating the coefficient of loss factors, as presented in Table 3.

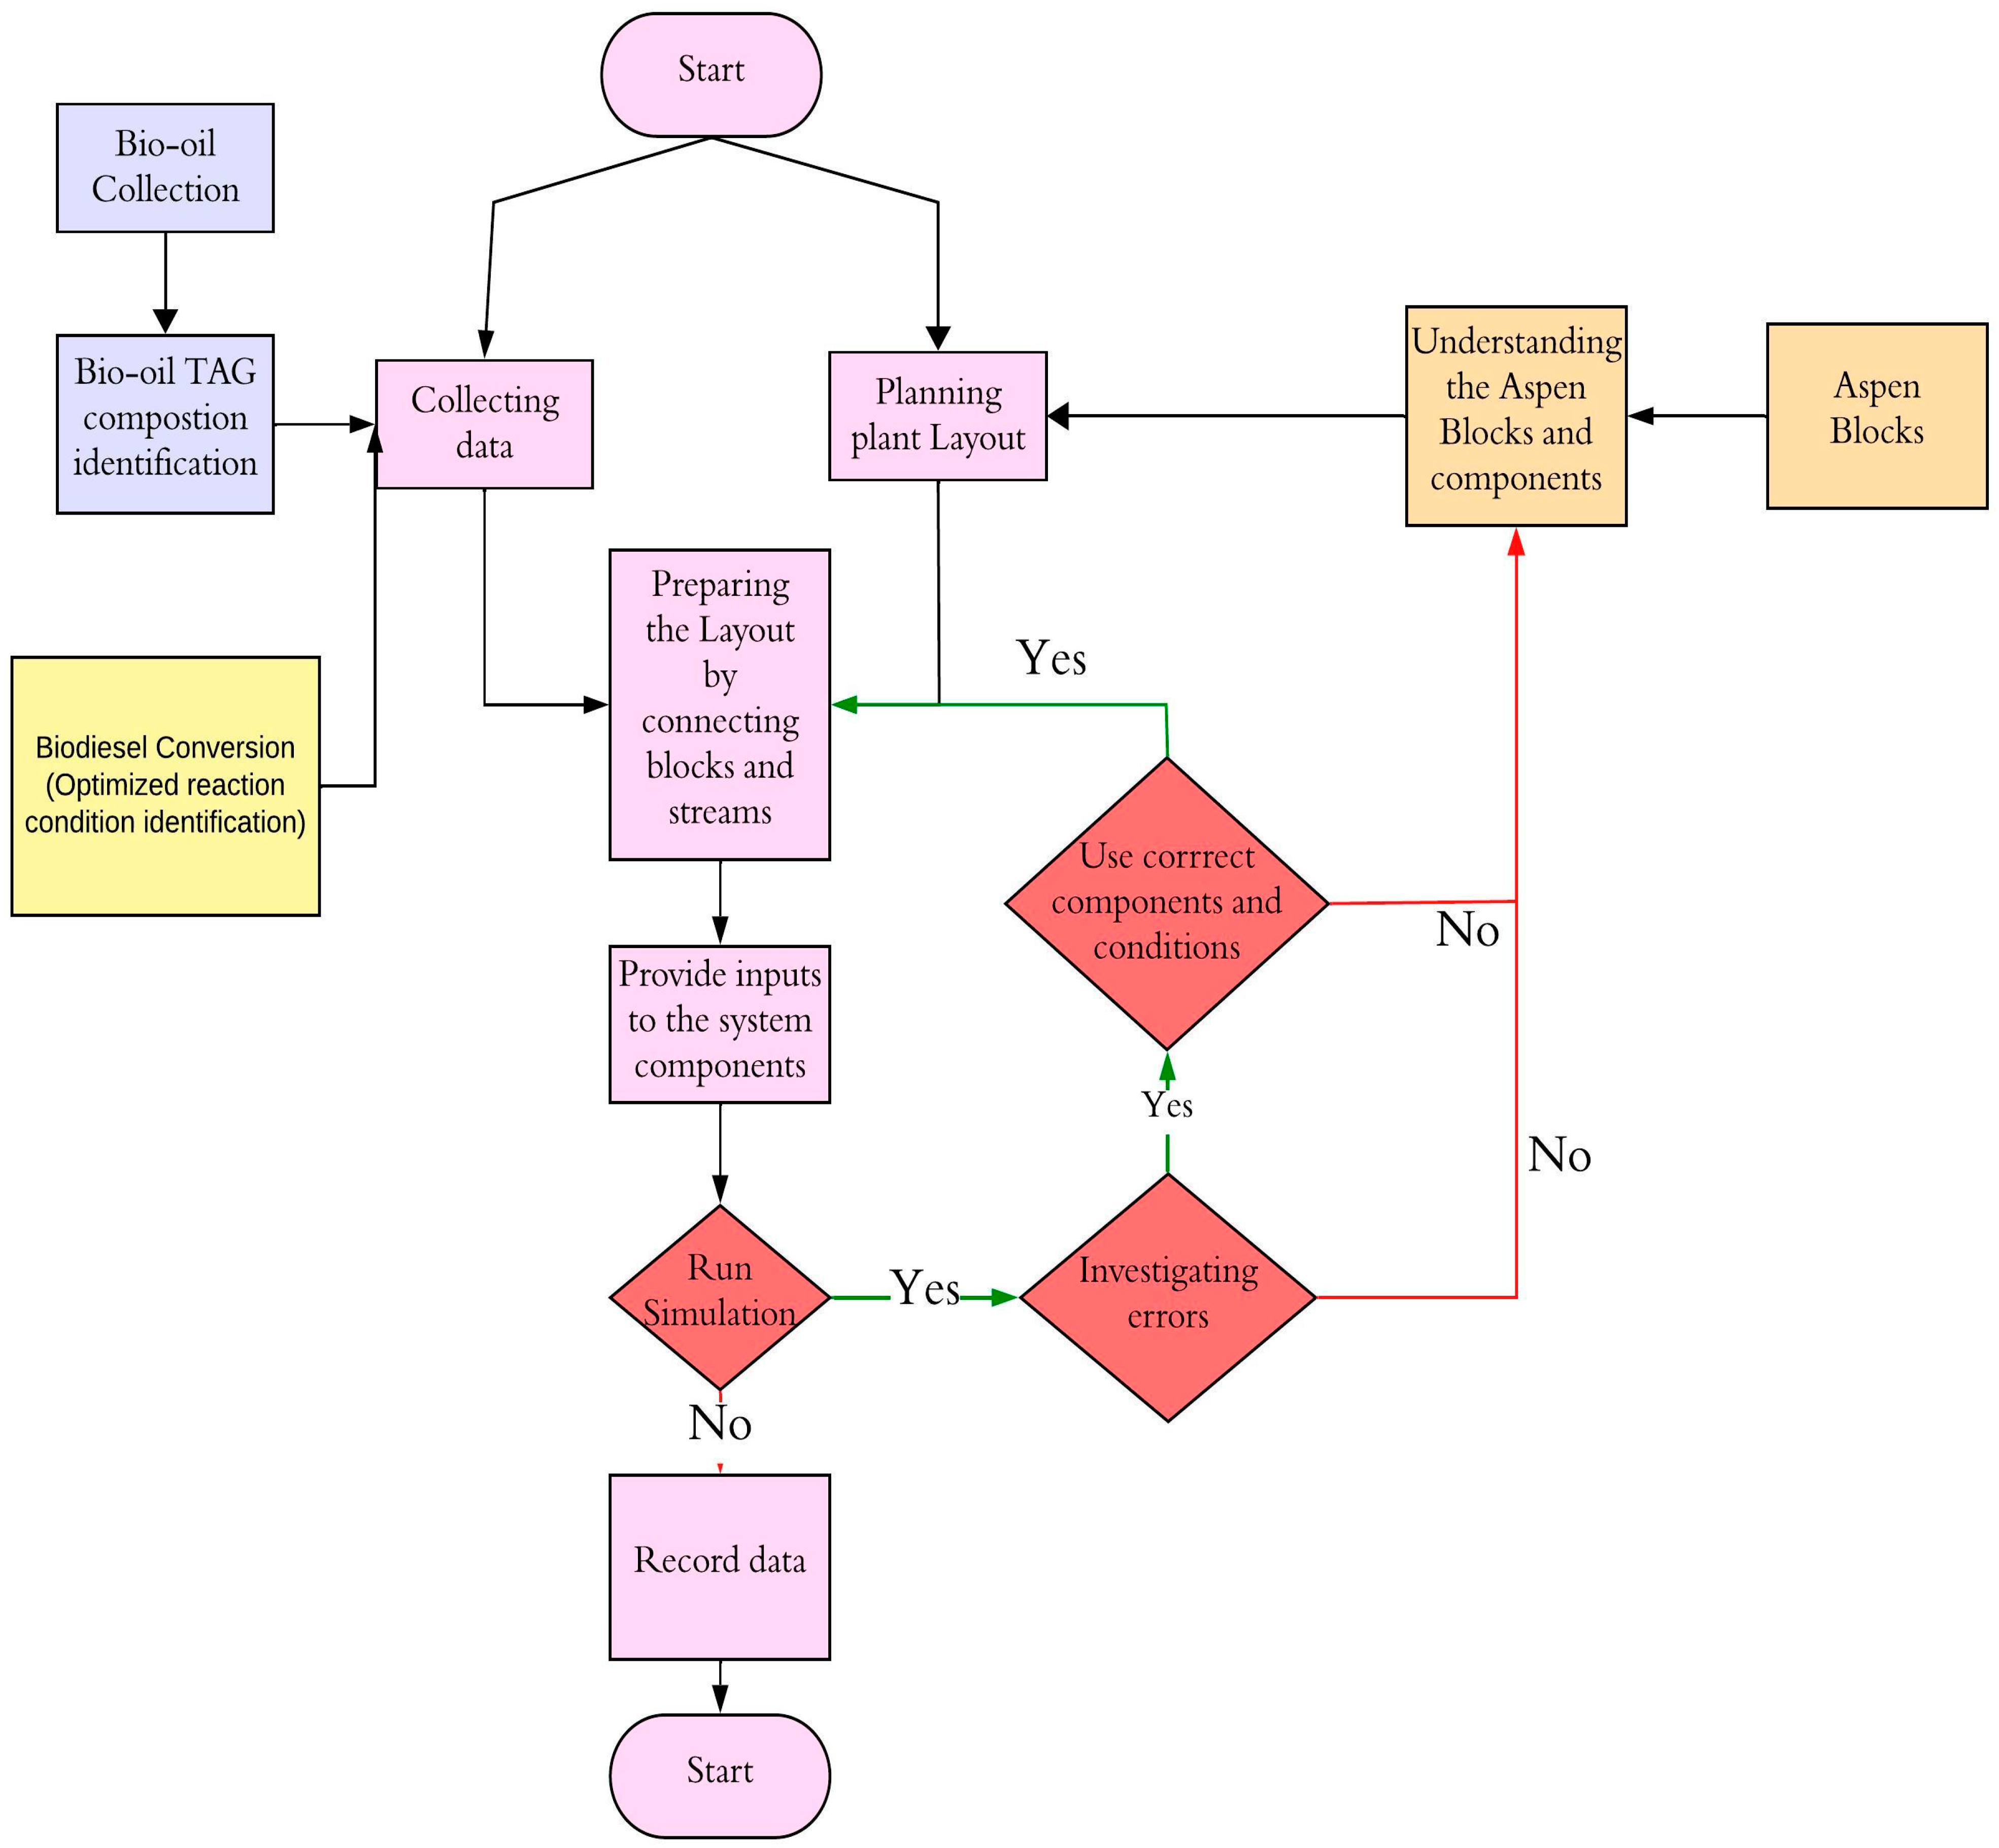
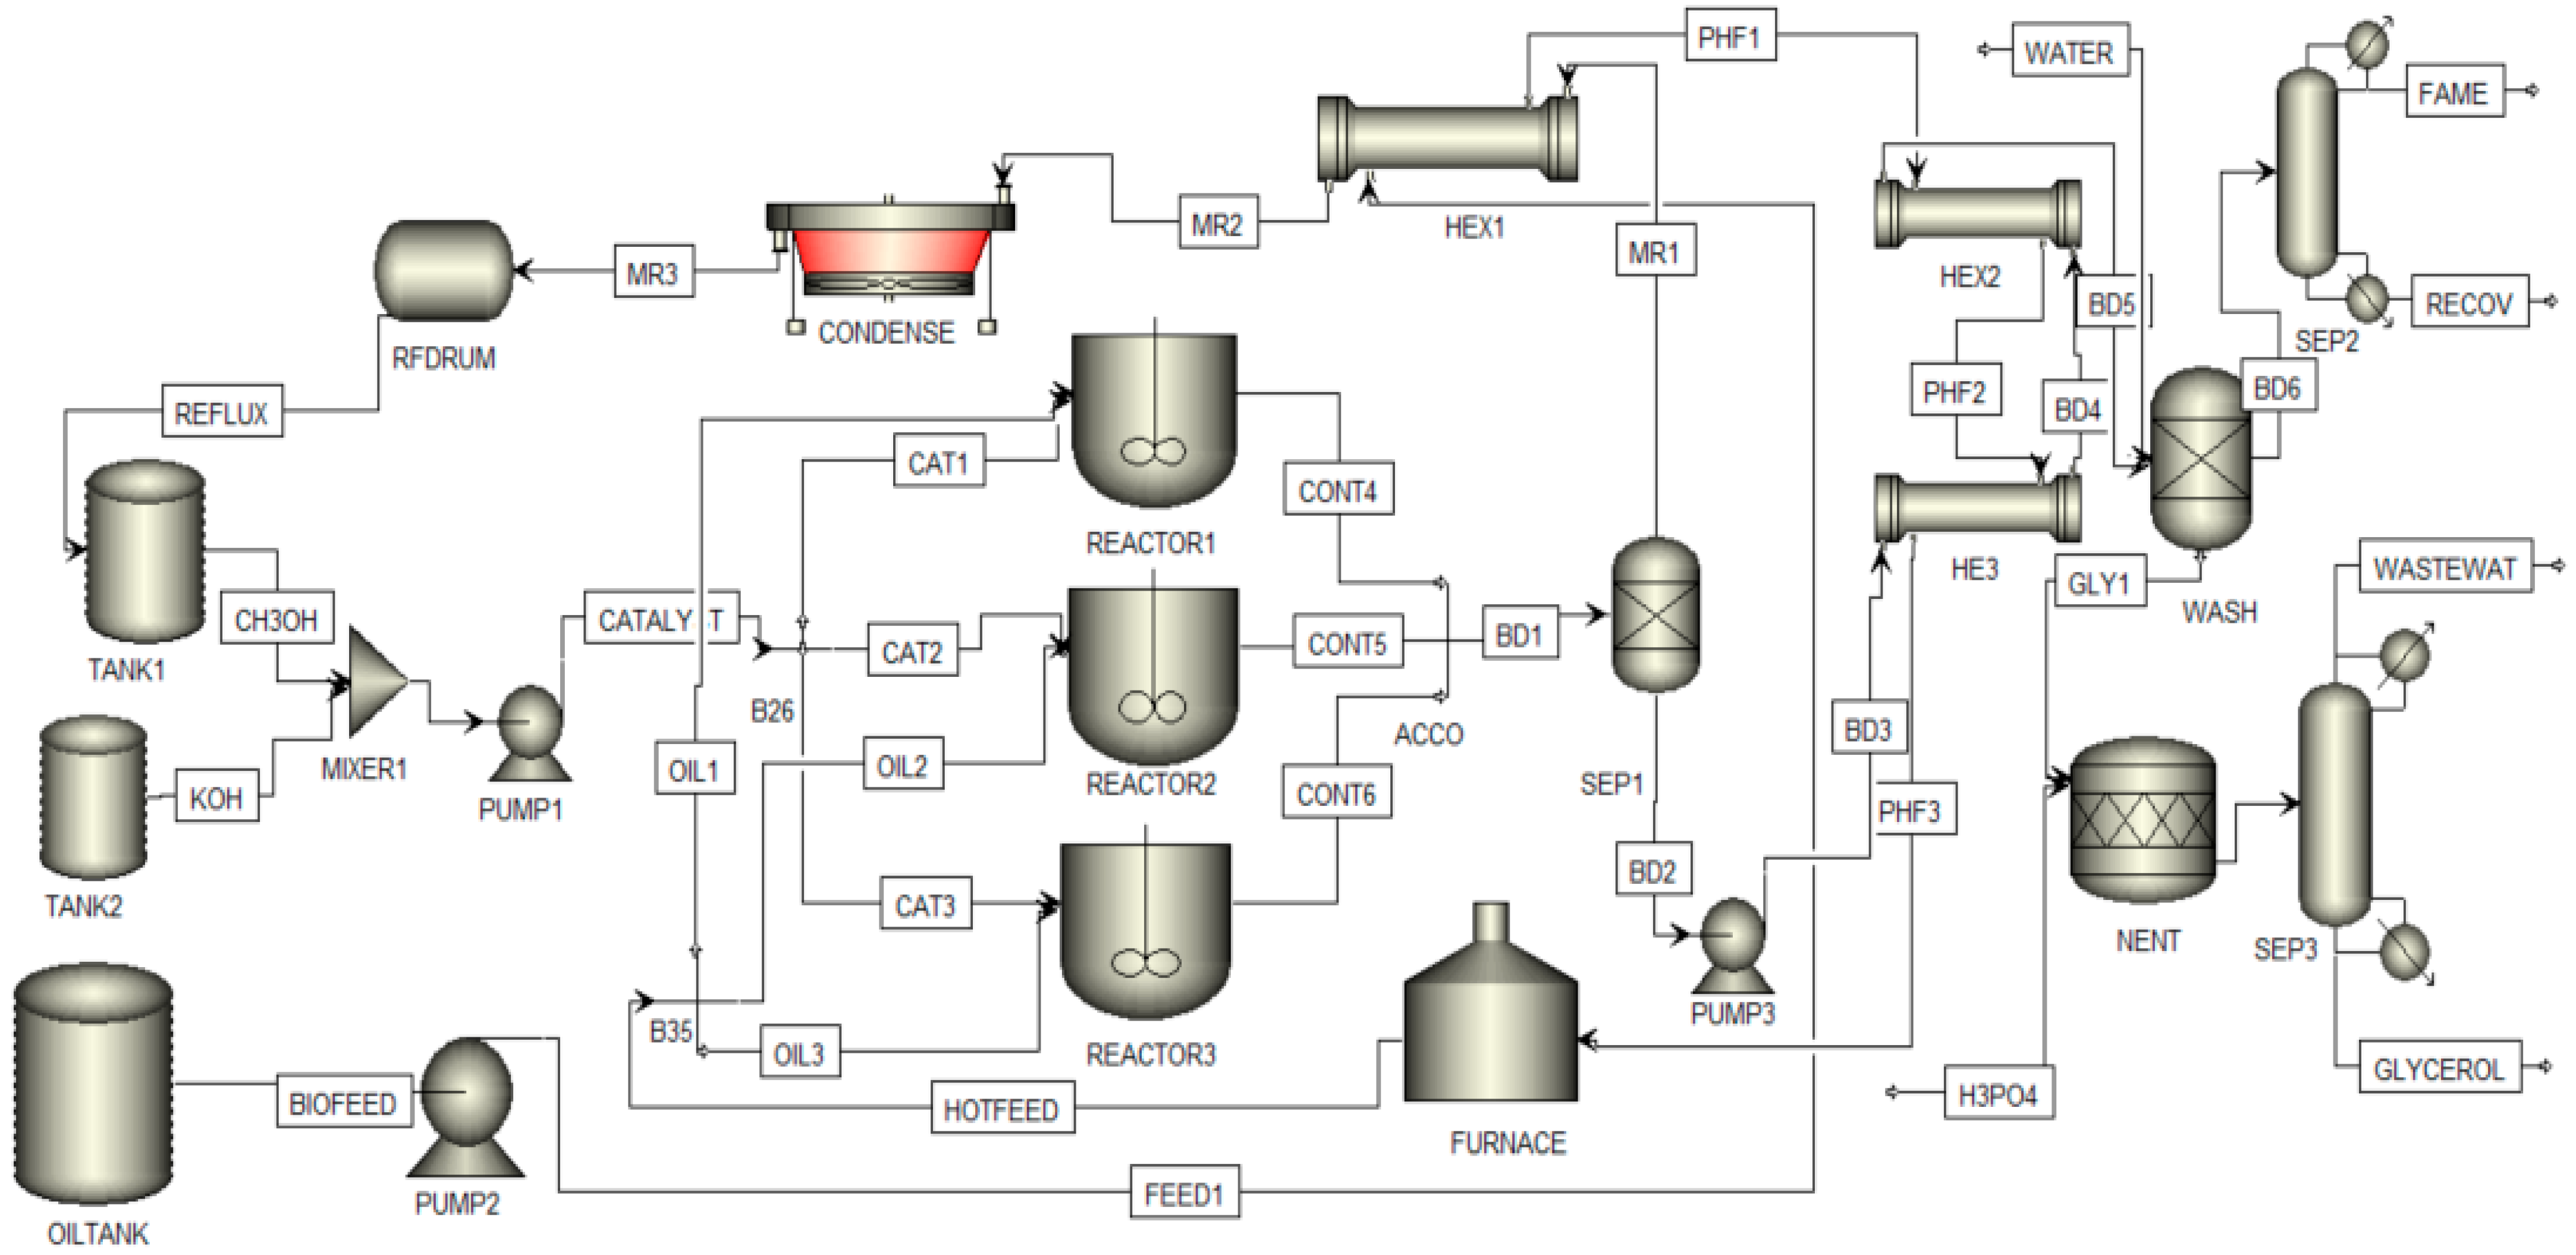
3.3. Simulations Model

This section discusses the model development in Aspen Plus, followed by the results obtained from the same. As discussed before, biodiesel conversion requires different processes such as transesterification, water washing, catalyst removal, methanol recovery, glycerol purification, fatty acid methyl ester (FAME) purification, and many others. Figure 8 shows the composition of Calophyllum inophyllum triacyl-glycerides (TAG) composition. The TAG composition values were obtained from the research study conducted by Crane et al. [54]. The bio-oil contains a reduced quantity of monounsaturated TAG forms (such as PPO, SSO, PSO, etc.) and an elevated quantity of di- and tri-unsaturated TAG forms (such as POO, SOO, OOO, etc.). A higher amount of OOL (11.06%) was observed, followed by OLL (10.7%), POL (10.7%), OOS (9.5%), POO (9.4%), and OOO (9.2%). Trace amounts of PPS (0.7%) and PLiLi (0.2%) were also noticed.
Due to the intricate chemical structures of oil components, the authors chose to select the fatty acid compositions that have higher proportions within Calophyllum inophyllum oil. For instance, according to Atabani and César [55], Calophyllum inophyllum oil contains traces of Myristic (0.9 wt.%), Palmitoleic (0.3 wt.%), Lignocerate (2.6 wt.%), and Arachidic (0.8 wt.%). While these values are slightly varied in the literature [56,57,58,59], the overall weight % composition remains largely consistent. Hence, the higher trace components were selected for the chemical conversion process in Aspen.
As presented in Figure 9, Calophyllum inophyllum bio-oil was sent to the reaction tank using pump 1. The oil was first pre-heated from the heat exchangers (Blocks HEX 1,2 and 3) in the methanol recovery section and glycerol purification section, where the oil will be pre-heated from the methanol condensation vapors (stream-PHF1) and glycerol cooling process (stream-PHF3). The oil will then be further heated in the furnace (stream-HOTFEED) to reach 60 °C, before being sent to the reactor. On the other hand, KOH and methanol were blended in a mixer at 60 °C an d were passed to the reaction chamber. For one mole of oil, 6 moles of methanol were used for the transesterification. Both the heated oil and alcohol catalyst mixtures were blended in the reactor at 60 °C, for a residence time of 120 min. The feed values of the input components are shown in Table 7.
Bio-oil is the mixture of different TAG components, where these TAG components will be converted to methyl esters [60,61]. As shown in reactions 8,9 and 10, triglycerides react with methanol and will be converted to di-glycerides, leaving a methyl ester component [62,63]. Again, these diglycerides will react with the methanol and will be further converted to monoglycerides. In the last stage, the monoglycerides will be converted to methyl esters by leaving glycerol as the side product. Based on the Calophyllum inophyllum composition, a total of 130 reactions were prepared and added to the kinetic reaction phases of the reactors. These kinetic reactions were prepared for every possible triglyceride and were added to the simulation. As reported by Rabelo Silva and Caño de Andrade [64], transesterification is a reversible reaction, and reversible reactions were also included in the reaction. As presented in reactions 8,9 and 10, kf and kr are rate constants for forward and reverse reactions. As the reactions between the conversions of triglycerides to monoglycerides are elementary the study has included the kinetic parameters, rate constants, and activation energy rates from the literature provided by the Aspen [65].
t r i g l y c e r i d e s + m e t h a n o l   k f ,   k r     d i g l y c e r i d e s + m e t h y l   e s t e r s  
d i g l y c e r i d e s + m e t h a n o l   k f ,   k r     m o n o g l y c e r i d e s + m e t h y l   e s t e r s
m o n o g l y c e r i d e s + m e t h a n o l   k f ,   k r     g l y c e r o l + m e t h y l   e s t e r s
The transesterification reaction was carried at 60 °C in closed reactors for two hours and the output reactants were taken as stream BD1, as shown in Figure 9. The mixture was passed to the separatory vessel (Block SEP1) where the excess methanol vapors were collected on the top and condensed using a blower (Block CONDNSE). The condensed methanol was then passed to the methanol storage tank. Besides, the biodiesel mixture BD2 extracted from the separatory vessel (Block SEP1) was passed to water washing and biodiesel purification stages.
The extract column (Block WASH) was used for the water washing of the feed BD5. The FAME in stream BD5 is isolated from glycerin (GLY1), methanol, and catalyst. The extract column downstream (stream GLY1) contains glycerin, wastewater, methanol, oil, and a catalyst. The upper stream (stream BD6), rich in FAME, is directed to the separator (Block SEP2) for the extraction of pure biodiesel (Stream FAME). To extract high-purity glycerin free from the catalyst, the lower stream from the extract column is directed to the reactor (Block NENT). In the reactor, the catalyst KOH is mixed with H3PO4 at 50 °C and forms Na3PO4 and water. This mixture was further passed to a separatory funnel (SEP3), where wastewater will be separated from the upper section of the tower, while pure glycerin is collected from the lower stream. The input boundary conditions for the separator blocks SEP1, SEP2, SEP3, and Wash columns are shown in Table 7.
Table 8 presents the overview of the inputs and outputs from the simulation. 88.8% of biodiesel yield is recorded from the simulation. 76.8% of pure glycerol is recorded at the end of the purification process. Figure 10 illustrates the biodiesel composition of Calophyllum inophyllum in comparison with both experimental and simulation results. The simulation results are validated with the experimental test results obtained from Rizwanul Fattah et al. [66]. The Calophyllum inophyllum biodiesel was prepared through a transesterification process at the test conditions, 6:1 methanol to oil molar ratio, 1% (w/w) KOH, and the temperature was sustained at 60 °C for 2 h [66]. Similar operating conditions were added to the simulation setup. The composition variations are similar for both the experimental and simulation results. Higher amounts of methyl oleate (42.97%) were noticed in the biodiesel, followed by methyl linoleate (24.74%), Methyl stearate (15.46%), methyl palmitate (10.54%) and methyl linolenate (2.15%). As can be seen from the observations, there are slight differences in the FAME composition which is mainly because of the assumed reaction mechanisms in Aspen Plus simulation. As mentioned earlier, the input oil data does not reflect the properties of the feedstocks used in the process; hence, the kinetic parameters used in Aspen Plus models do not accurately represent the kinetics of the reactions involved in FAME production. Differences in feedstock composition, impurities, or properties can lead to variations in the predicted FAMEs output [67,68,69]. Moreover, experimental conditions such as temperature, pressure, and catalyst type can significantly affect reaction kinetics.

4. Conclusions and Recommendations

This study investigated biodiesel plant design and continuous Calophyllum inophyllum biodiesel production simulation. For a continuous production plant, the flow losses are significant, and these losses vary depending on the pipe material, pipe fittings, bending, and material flow rate. Hence, the study aimed to design a continuous production plant to reduce the flow losses, and for that, a pipe network was proposed in the study, assuming the materials and flow rates at different stages. The proposed calculations will be a reference to the research community to investigate the effect of flow losses in the biodiesel production plant. Moreover, the designed calculations can assist in selecting suitable pipes and pumps. The major conclusions are as follows.
(1)
For the proposed plant model, the bursting pressure of steel pipe is 49.68 MPa for the chosen diameter and thickness, which must withstand max pressure of 4 bar and turbulent flow behavior with Reynold number of 2.3 × 10⁶; thus, the system was found to be designed safely. Also, the friction factor of the pipe is 0.0165, which is a fairly smooth pipe with smooth flow and less resistance;
(2)
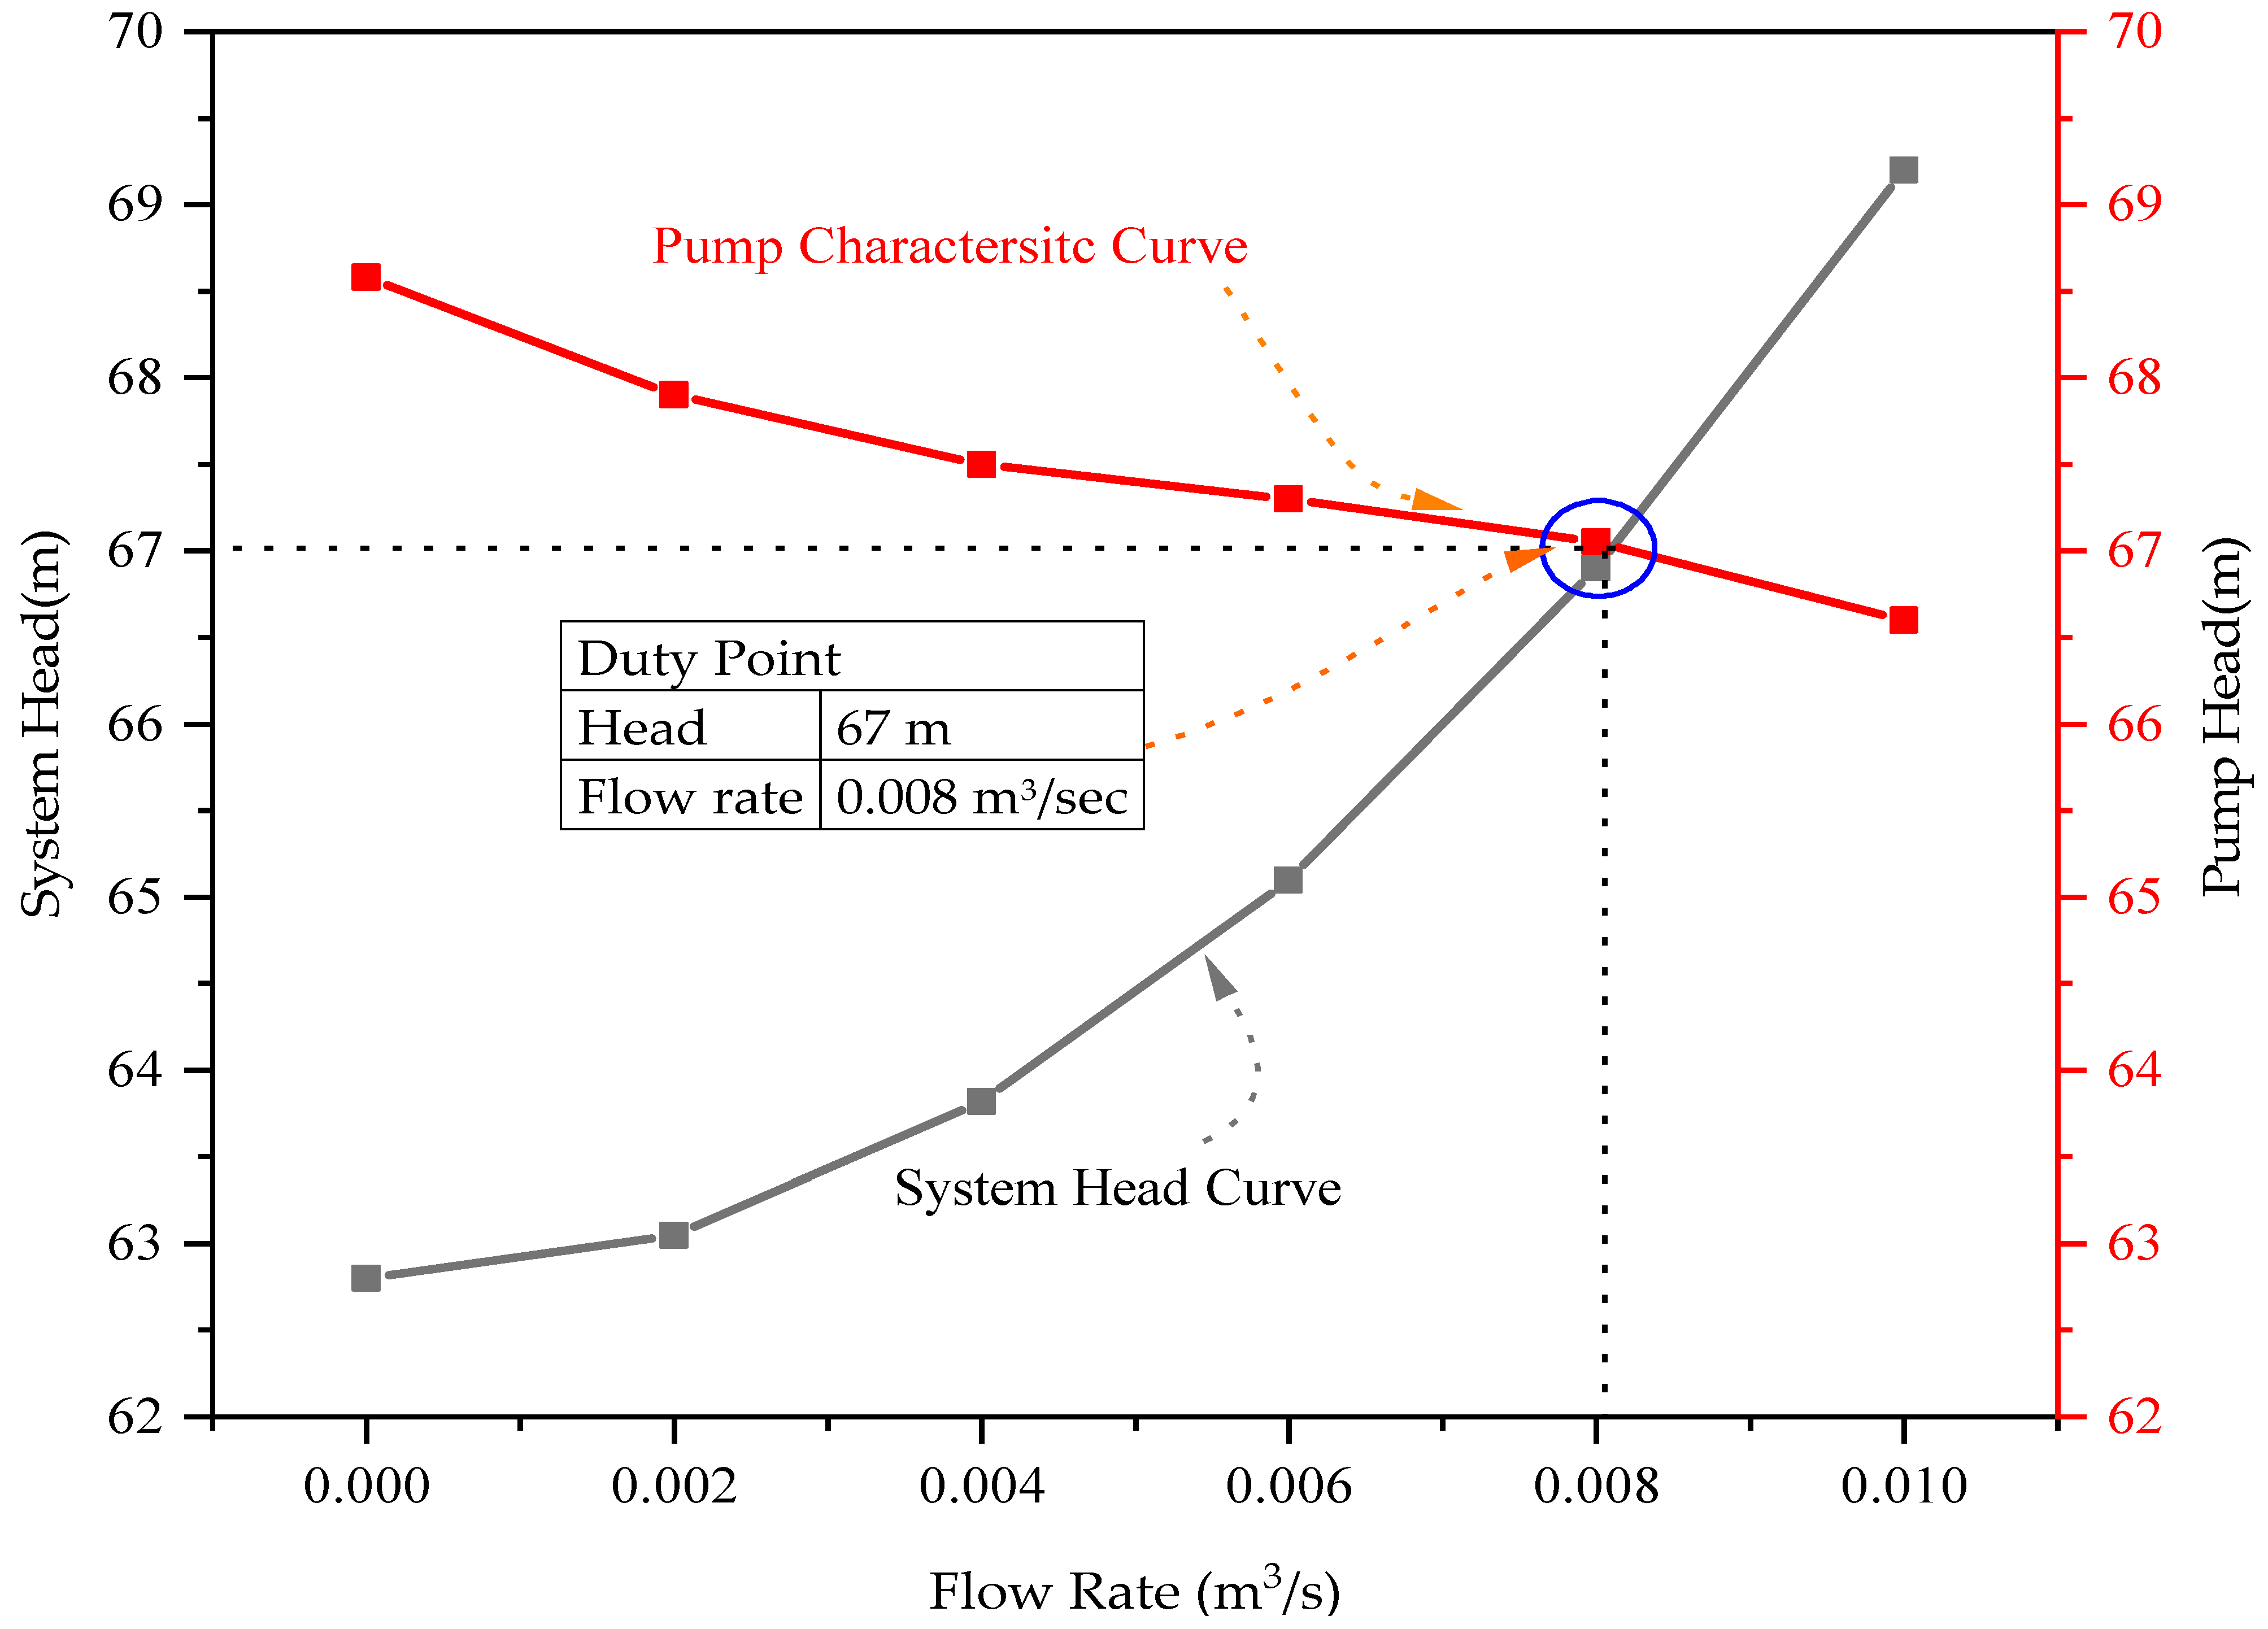
The required head and flow rates are 0.008 m3/s and 66.9 m, and the duty point obtained from the results shows that the selected pump gives the desired output;
(3)
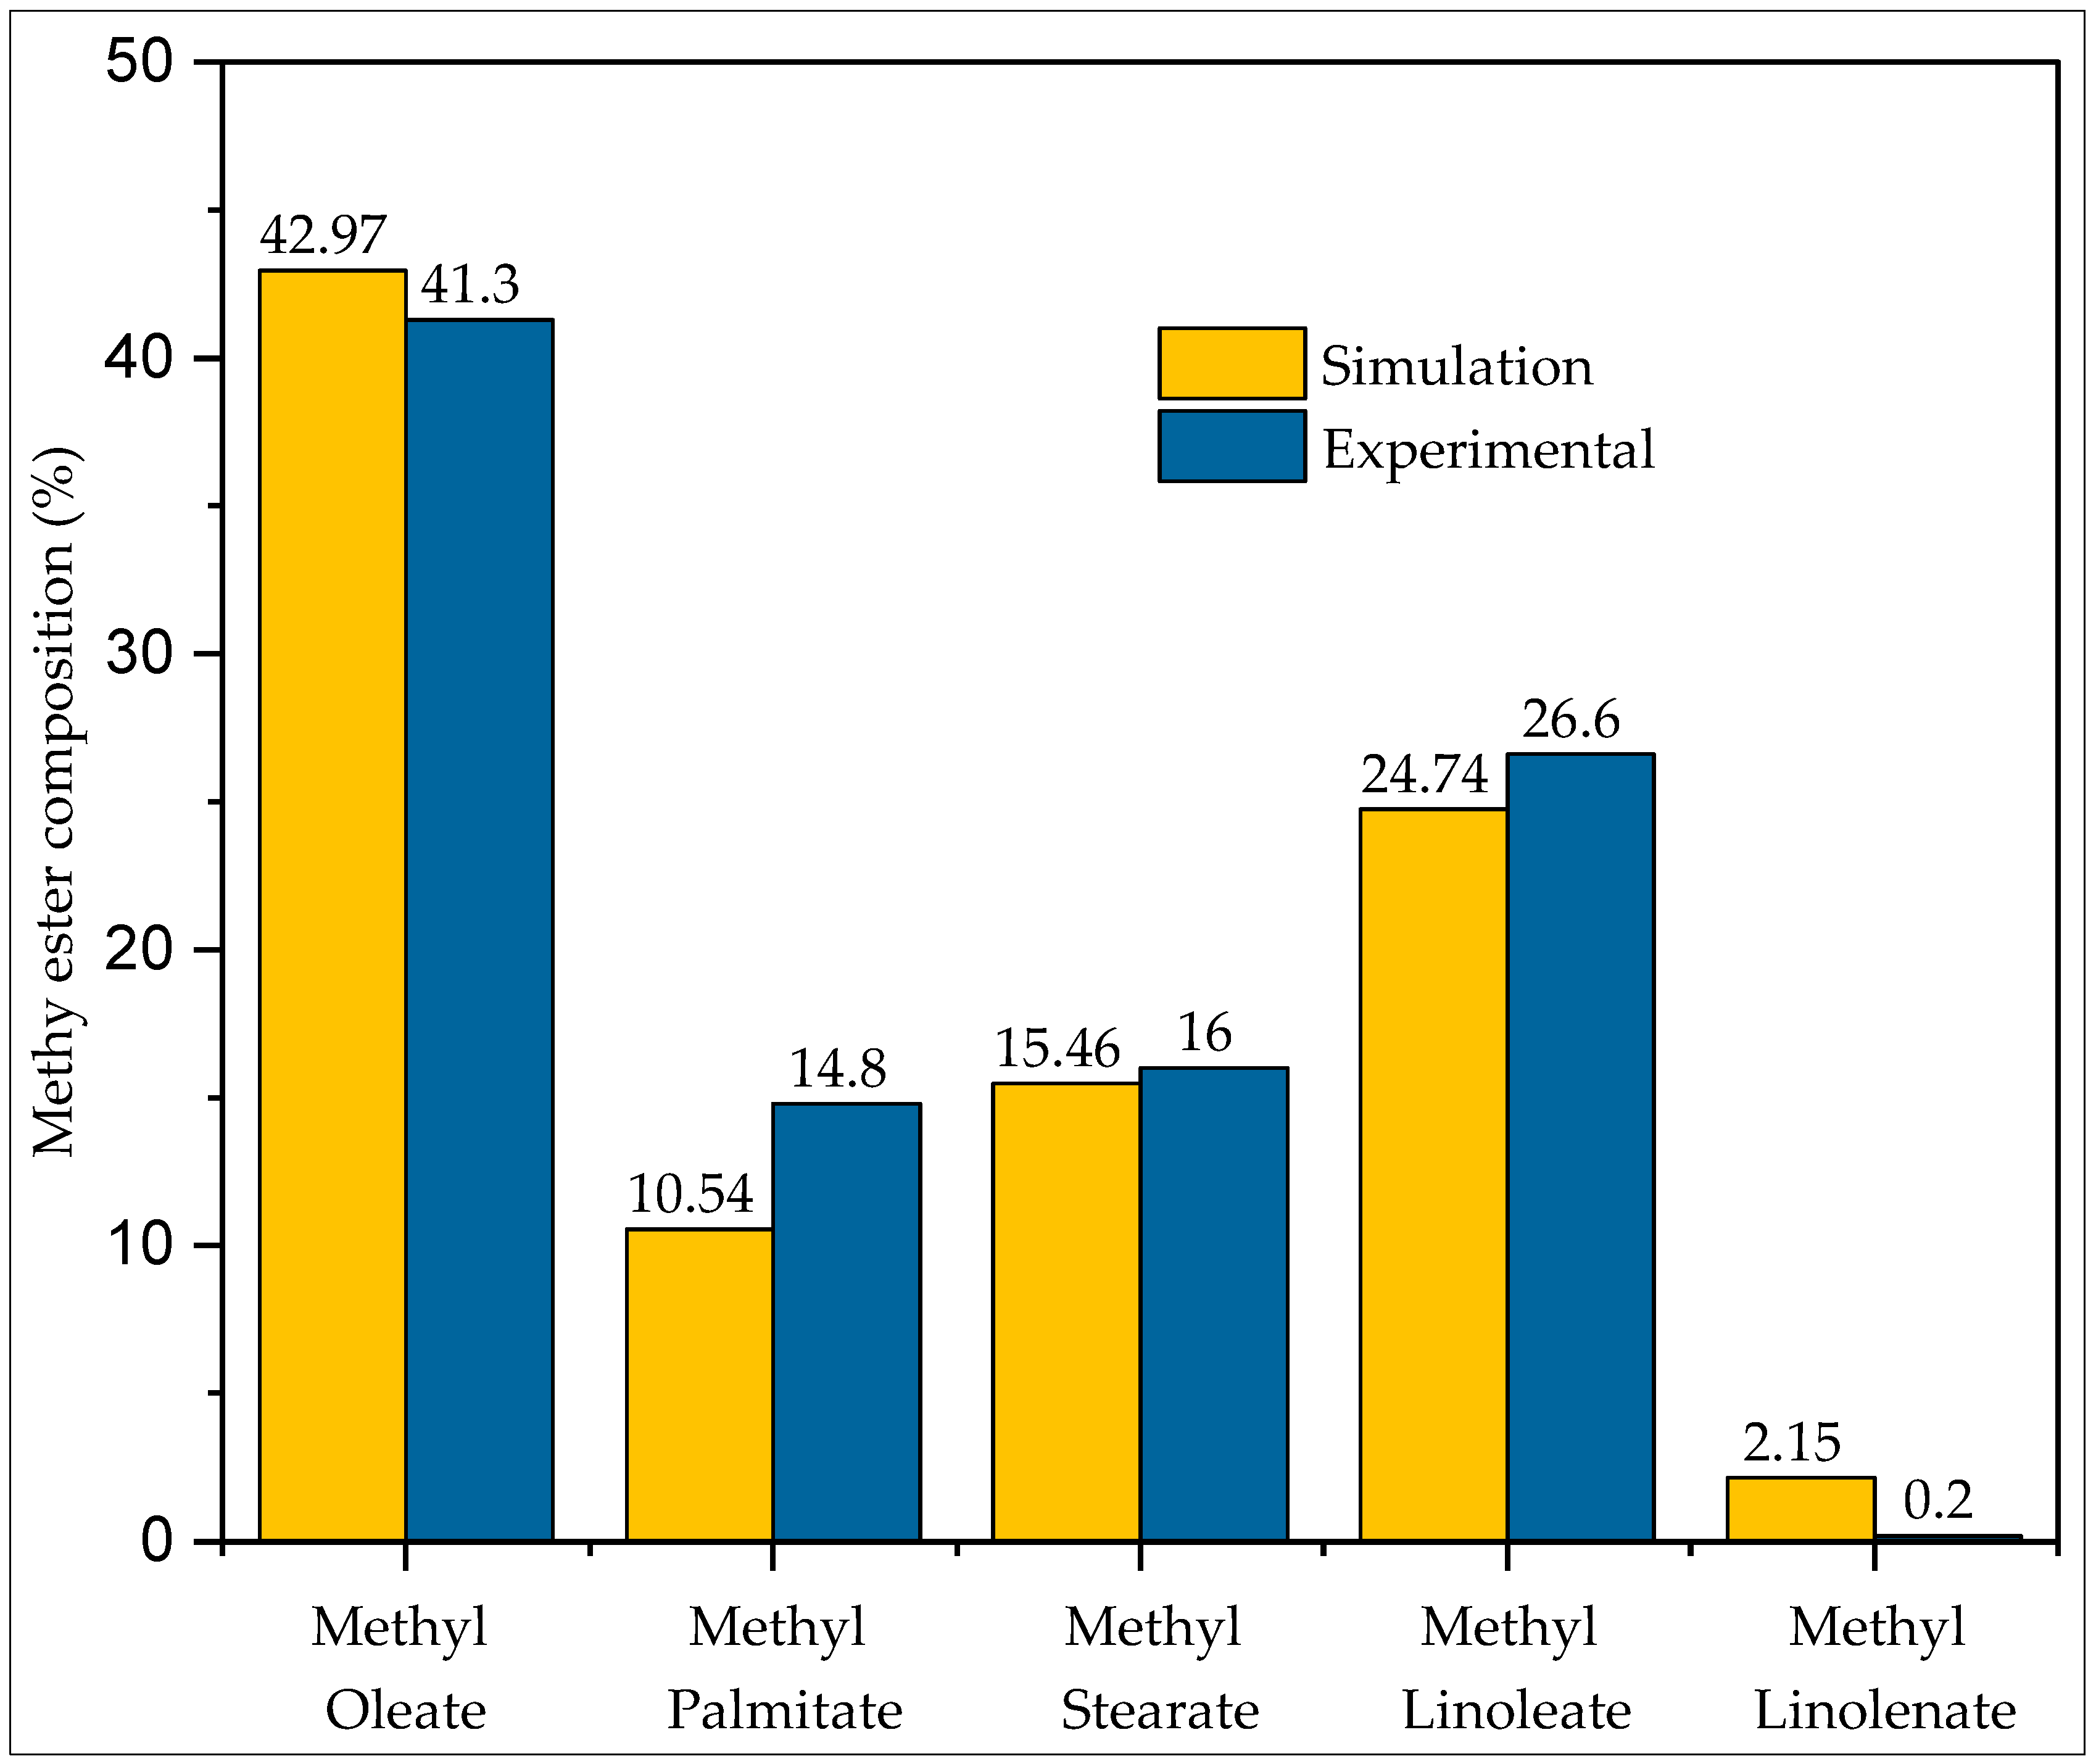
The simulation results closely match the experimental biodiesel composition, and biodiesel yield was recorded as 88.8%.
While the study includes pipe design calculations based on the proposed plant layout, it suggests that the proposed pipe data can accommodate the assigned mass flow rates and that the recommended pump characteristics are also suitable. Future research could optimize the pipe network by adjusting fittings and bending. Once the pipe network has been adjusted, it is recommended that flow characteristics be optimized for enhanced efficiency and performance through varying operating conditions and material adjustments. Furthermore, a cost economic analysis of the proposed plant needs to be conducted to ensure the long-term sustainability of the biodiesel production venture.

Author Contributions

Conceptualization, A.K.A. and A.C.J.; methodology, A.K.A., A.C.J. and A.T.D.; software, A.K.A. and A.T.D.; validation, A.T.D.; formal analysis, A.K.A. and N.M.S.H.; investigation, A.K.A., A.C.J., A.T.D. and R.R.; resources, A.K.A. and N.M.S.H.; data curation, A.T.D. and R.R.; writing—original draft preparation, A.C.J. and A.T.D.; writing and editing—A.K.A., N.M.S.H. and M.N.N.; visualization, A.K.A., A.C.J. and A.T.D.; supervision, A.K.A.; project administration, A.K.A. All authors have read and agreed to the published version of the manuscript.

Funding

This research received no external funding. The APC was fully waived by the journal.

Institutional Review Board Statement

Not applicable.

Informed Consent Statement

Not applicable.

Data Availability Statement

Data are available on request.

Conflicts of Interest

The authors declare no conflicts of interest.

Abbreviation

ASMEAmerican Society of Mechanical Engineers
ASTMAmerican Society for Testing and Materials
EIAEnergy Information Administration
FAMEFatty Acid Methyl Ester
KOHPotassium Hydroxide
NPSHANet Positive Suction Head
NPSHRNet Positive Suction Head Required
NRTLNon-Random Two-Liquid
TAGTriacyl Glycerides

References

  1. Hezam, I.M.; Vedala, N.R.; Kumar, B.R.; Mishra, A.R.; Cavallaro, F. Assessment of Biofuel Industry Sustainability Factors Based on the Intuitionistic Fuzzy Symmetry Point of Criterion and Rank-Sum-Based MAIRCA Method. Sustainability 2023, 15, 6749. [Google Scholar] [CrossRef]
  2. Hajjari, M.; Tabatabaei, M.; Aghbashlo, M.; Ghanavati, H. A review on the prospects of sustainable biodiesel production: A global scenario with an emphasis on waste-oil biodiesel utilization. Renew. Sustain. Energy Rev. 2017, 72, 445–464. [Google Scholar] [CrossRef]
  3. EIA. EIA Projects Nearly 50% Increase in World Energy Use by 2050, Led by Growth in Renewables. 2021. Available online: https://www.eia.gov/todayinenergy/detail.php?id=49876 (accessed on 21 February 2024).
  4. Raju, V.D.; Veza, I.; Venu, H.; Soudagar, M.E.M.; Kalam, M.A.; Ahamad, T.; Appavu, P.; Nair, J.N.; Rahman, S.M.A. Comprehensive Analysis of Compression Ratio, Exhaust Gas Recirculation, and Pilot Fuel Injection in a Diesel Engine Fuelled with Tamarind Biodiesel. Sustainability 2023, 15, 5222. [Google Scholar] [CrossRef]
  5. Jia, L.; Cheng, P.; Yu, Y.; Chen, S.-H.; Wang, C.-X.; He, L.; Nie, H.-T.; Wang, J.-C.; Zhang, J.-C.; Fan, B.-G.; et al. Regeneration mechanism of a novel high-performance biochar mercury adsorbent directionally modified by multimetal multilayer loading. J. Environ. Manag. 2023, 326, 116790. [Google Scholar] [CrossRef] [PubMed]
  6. Rattanaphra, D.; Tawkaew, S.; Chuichulcherm, S.; Kingkam, W.; Nuchdang, S.; Kitpakornsanti, K.; Suwanmanee, U. Evaluation of Life Cycle Assessment of Jatropha Biodiesel Processed by Esterification of Thai Domestic Rare Earth Oxide Catalysts. Sustainability 2024, 16, 100. [Google Scholar] [CrossRef]
  7. Musharavati, F.; Sajid, K.; Anwer, I.; Nizami, A.-S.; Javed, M.H.; Ahmad, A.; Naqvi, M. Advancing Biodiesel Production System from Mixed Vegetable Oil Waste: A Life Cycle Assessment of Environmental and Economic Outcomes. Sustainability 2023, 15, 16550. [Google Scholar] [CrossRef]
  8. Zailani, S.; Iranmanesh, M.; Sean Hyun, S.; Ali, M.H. Barriers of Biodiesel Adoption by Transportation Companies: A Case of Malaysian Transportation Industry. Sustainability 2019, 11, 931. [Google Scholar] [CrossRef]
  9. Dey, S.; Singh, A.P.; Gajghate, S.S.; Pal, S.; Saha, B.B.; Deb, M.; Das, P.K. Optimization of CI Engine Performance and Emissions Using Alcohol–Biodiesel Blends: A Regression Analysis Approach. Sustainability 2023, 15, 14667. [Google Scholar] [CrossRef]
  10. Etim, A.O.; Betiku, E.; Ajala, S.O.; Olaniyi, P.J.; Ojumu, T.V. Potential of Ripe Plantain Fruit Peels as an Ecofriendly Catalyst for Biodiesel Synthesis: Optimization by Artificial Neural Network Integrated with Genetic Algorithm. Sustainability 2018, 10, 707. [Google Scholar] [CrossRef]
  11. Ahmad, G.; Imran, S.; Farooq, M.; Shah, A.N.; Anwar, Z.; Rehman, A.U.; Imran, M. Biodiesel Production from Waste Cooking Oil Using Extracted Catalyst from Plantain Banana Stem via RSM and ANN Optimization for Sustainable Development. Sustainability 2023, 15, 3599. [Google Scholar] [CrossRef]
  12. Azad, A.K.; Halder, P.; Wu, Q.; Rasul, M.G.; Hassan, N.M.S.; Karthickeyan, V. Experimental investigation of ternary biodiesel blends combustion in a diesel engine to reduce emissions. Energy Convers. Manag. X 2023, 20, 100499. [Google Scholar] [CrossRef]
  13. Doppalapudi, A.T.; Azad, A.; Khan, M. Combustion chamber modifications to improve diesel engine performance and reduce emissions: A review. Renew. Sustain. Energy Rev. 2021, 152, 111683. [Google Scholar] [CrossRef]
  14. López-Zapata, B.Y.; Adam-Medina, M.; Álvarez-Gutiérrez, P.E.; Castillo-González, J.P.; León, H.R.H.-d.; Vela-Valdés, L.G. Virtual Sensors for Biodiesel Production in a Batch Reactor. Sustainability 2017, 9, 455. [Google Scholar] [CrossRef]
  15. Rahman, M.M.; Kamil, M.; Bakar, R.A. Engine performance and optimum injection timing for 4-cylinder direct injection hydrogen fueled engine. Simul. Model. Pract. Theory 2011, 19, 734–751. [Google Scholar] [CrossRef]
  16. ASTM D6751; Standard Specification for Biodiesel Fuel Blend Stock (B100) for Middle Distillate Fuels. ASTM International: West Conshohocken, PA, USA, 2023.
  17. Almuhayawi, M.S.; Hassan, E.A.; Almasaudi, S.; Zabermawi, N.; Azhar, E.I.; Najjar, A.; Alkuwaity, K.; Abujamel, T.S.; Alamri, T.; Harakeh, S. Biodiesel Production through Rhodotorula toruloides Lipids and Utilization of De-Oiled Biomass for Congo Red Removal. Sustainability 2023, 15, 13412. [Google Scholar] [CrossRef]
  18. Mustafa, A.; Faisal, S.; Ahmed, I.A.; Munir, M.; Cipolatti, E.P.; Manoel, E.A.; Pastore, C.; di Bitonto, L.; Hanelt, D.; Nitbani, F.O.; et al. Has the time finally come for green oleochemicals and biodiesel production using large-scale enzyme technologies? Current status and new developments. Biotechnol. Adv. 2023, 69, 108275. [Google Scholar] [CrossRef]
  19. Azad, A.K.; Doppalapudi, A.T.; Khan, M.M.K.; Hassan, N.M.S.; Gudimetla, P. A landscape review on biodiesel combustion strategies to reduce emission. Energy Rep. 2023, 9, 4413–4436. [Google Scholar] [CrossRef]
  20. Doppalapudi, A.T.; Azad, A.K.; Khan, M.M.K. Advanced strategies to reduce harmful nitrogen-oxide emissions from biodiesel fueled engine. Renew. Sustain. Energy Rev. 2023, 174, 113123. [Google Scholar] [CrossRef]
  21. Abu-Hamdeh, N.H.; Alnefaie, K.A. A comparative study of almond biodiesel-diesel blends for diesel engine in terms of performance and emissions. BioMed Res. Int. 2015, 2015, 529808. [Google Scholar] [CrossRef]
  22. Antony Miraculas, G.; Bose, N.; Edwin Raj, R. Optimization of process parameters for biodiesel extraction from tamanu oil using design of experiments. J. Renew. Sustain. Energy 2014, 6, 033120. [Google Scholar] [CrossRef]
  23. Azad, A.K.; Rasul, M.G.; Khan, M.M.K.; Sharma, S.C.; Mofijur, M.; Bhuiya, M.M.K. Prospects, feedstocks and challenges of biodiesel production from beauty leaf oil and castor oil: A nonedible oil sources in Australia. Renew. Sustain. Energy Rev. 2016, 61, 302–318. [Google Scholar] [CrossRef]
  24. Chauhan, B.S.; Kumar, N.; Cho, H.M.; Lim, H.C. A study on the performance and emission of a diesel engine fueled with Karanja biodiesel and its blends. Energy 2013, 56, 1–7. [Google Scholar] [CrossRef]
  25. Liaquat, A.M.; Masjuki, H.H.; Kalam, M.; Fattah, I.R.; Hazrat, M.; Varman, M.; Mofijur, M.; Shahabuddin, M. Effect of coconut biodiesel blended fuels on engine performance and emission characteristics. Procedia Eng. 2013, 56, 583–590. [Google Scholar] [CrossRef]
  26. Moreira, K.S.; Moura Junior, L.S.; Monteiro, R.R.; de Oliveira, A.L.; Valle, C.P.; Freire, T.M.; Fechine, P.B.; de Souza, M.C.; Fernandez-Lorente, G.; Guisan, J.M. Optimization of the production of enzymatic biodiesel from residual babassu oil (Orbignya sp.) via RSM. Catalysts 2020, 10, 414. [Google Scholar] [CrossRef]
  27. Oniya, O.O.; Bamgboye, A.I. Production of biodiesel from groundnut (Arachis hypogea, L.) oil. Agric. Eng. Int. CIGR J. 2014, 16, 143–150. [Google Scholar]
  28. Otamiri, F.O.; Ogugua, V.N.; Joshua, P.E.; Odiba, A.S.; Ukegbu, C.Y. Physicochemical characterization of coconut copra (Dry Flesh) oil and production of biodiesel from coconut copra oil. Jökull J. Univ. Niger. Nsukka 2014, 64, 201–236. [Google Scholar]
  29. Patel, R.L.; Sankhavara, C. Biodiesel production from Karanja oil and its use in diesel engine: A review. Renew. Sustain. Energy Rev. 2017, 71, 464–474. [Google Scholar] [CrossRef]
  30. Azad, A.K. Biodiesel from Mandarin Seed Oil: A Surprising Source of Alternative Fuel. Energies 2017, 10, 1689. [Google Scholar] [CrossRef]
  31. Ghadge, S.V.; Raheman, H. Process optimization for biodiesel production from mahua (Madhuca indica) oil using response surface methodology. Bioresour. Technol. 2006, 97, 379–384. [Google Scholar] [CrossRef]
  32. Abbaszaadeh, A.; Ghobadian, B.; Omidkhah, M.R.; Najafi, G. Current biodiesel production technologies: A comparative review. Energy Convers. Manag. 2012, 63, 138–148. [Google Scholar] [CrossRef]
  33. Ghedini, E.; Taghavi, S.; Menegazzo, F.; Signoretto, M. A Review on the Efficient Catalysts for Algae Transesterification to Biodiesel. Sustainability 2021, 13, 10479. [Google Scholar] [CrossRef]
  34. Marchetti, J.M.; Miguel, V.U.; Errazu, A.F. Techno-economic study of different alternatives for biodiesel production. Fuel Process. Technol. 2008, 89, 740–748. [Google Scholar] [CrossRef]
  35. Samuel, O.D.; Aigba, P.A.; Tran, T.K.; Fayaz, H.; Pastore, C.; Der, O.; Erçetin, A.; Enweremadu, C.C.; Mustafa, A. Comparison of the Techno-Economic and Environmental Assessment of Hydrodynamic Cavitation and Mechanical Stirring Reactors for the Production of Sustainable Hevea brasiliensis Ethyl Ester. Sustainability 2023, 15, 16287. [Google Scholar] [CrossRef]
  36. Haas, M.J.; McAloon, A.J.; Yee, W.C.; Foglia, T.A. A process model to estimate biodiesel production costs. Bioresour. Technol. 2006, 97, 671–678. [Google Scholar] [CrossRef]
  37. Lee, S.; Posarac, D.; Ellis, N. Process simulation and economic analysis of biodiesel production processes using fresh and waste vegetable oil and supercritical methanol. Chem. Eng. Res. Des. 2011, 89, 2626–2642. [Google Scholar] [CrossRef]
  38. Poddar, T.; Jagannath, A.; Almansoori, A. Biodiesel Production using Reactive Distillation: A Comparative Simulation Study. Energy Procedia 2015, 75, 17–22. [Google Scholar] [CrossRef]
  39. Adeniyi, A.G.; Ighalo, J.O.; Adeoye, A.S.; Onifade, D.V. Modelling and optimisation of biodiesel production from Euphorbia lathyris using ASPEN Hysys. SN Appl. Sci. 2019, 1, 1452. [Google Scholar] [CrossRef]
  40. Giwa, A.; Giwa, S.O.; Olugbade, E.A. Application of Aspen HYSYS process simulator in green energy revolution: A case study of biodiesel production. ARPN J. Eng. Appl. Sci 2018, 13, 569–581. [Google Scholar]
  41. Salehi, A.; Karbassi, A.; Ghobadian, B.; Ghasemi, A.; Doustgani, A. Simulation process of biodiesel production plant. Environ. Prog. Sustain. Energy 2019, 38, e13264. [Google Scholar] [CrossRef]
  42. Apostolakou, A.; Kookos, I.; Marazioti, C.; Angelopoulos, K. Techno-economic analysis of a biodiesel production process from vegetable oils. Fuel Process. Technol. 2009, 90, 1023–1031. [Google Scholar] [CrossRef]
  43. Avinash, A.; Murugesan, A. Economic analysis of biodiesel production from waste cooking oil. Energy Sources Part B Econ. Plan. Policy 2017, 12, 890–894. [Google Scholar] [CrossRef]
  44. Glisic, S.B.; Pajnik, J.M.; Orlović, A.M. Process and techno-economic analysis of green diesel production from waste vegetable oil and the comparison with ester type biodiesel production. Appl. Energy 2016, 170, 176–185. [Google Scholar] [CrossRef]
  45. Nagarajan, S.; Chou, S.K.; Cao, S.; Wu, C.; Zhou, Z. An updated comprehensive techno-economic analysis of algae biodiesel. Bioresour. Technol. 2013, 145, 150–156. [Google Scholar] [CrossRef]
  46. Sun, J.; Xiong, X.; Wang, M.; Du, H.; Li, J.; Zhou, D.; Zuo, J. Microalgae biodiesel production in China: A preliminary economic analysis. Renew. Sustain. Energy Rev. 2019, 104, 296–306. [Google Scholar] [CrossRef]
  47. Vlysidis, A.; Binns, M.; Webb, C.; Theodoropoulos, C. A techno-economic analysis of biodiesel biorefineries: Assessment of integrated designs for the co-production of fuels and chemicals. Energy 2011, 36, 4671–4683. [Google Scholar] [CrossRef]
  48. Gerhart, P.M.; Gerhart, A.L.; Hochstein, J.I. Munson, Young and Okiishi’s Fundamentals of Fluid Mechanics; John Wiley & Sons: Hoboken, NJ, USA, 2016. [Google Scholar]
  49. McDonald, A.G.; Magande, H. Introduction to Thermo-Fluids Systems Design; John Wiley & Sons: Hoboken, NJ, USA, 2012. [Google Scholar]
  50. Coronado, M.; Montero, G.; Garcia, C.; Schorr, M.; Valdez, B.; Eliezer, A. Equipment, Materials, and Corrosion in the Biodiesel Industry. 2020. Available online: https://www.materialsperformance.com/articles/material-selection-design/2019/06/equipment-materials-and-corrosion-in-the-biodiesel-industry (accessed on 12 March 2024).
  51. ToolBox, T.E. Young’s Modulus, Tensile Strength and Yield Strength Values for Some Materials. 2003. Available online: https://www.engineeringtoolbox.com/young-modulus-d_417.html (accessed on 12 March 2024).
  52. ASTM/ASME A53/SA53; Standard Specification for Pipe, Steel, Black and Hot-Dipped, Zinc-Coated, Welded and Seamless. ASTM International: West Conshohocken, PA, USA, 2012.
  53. Chiavola, O.; Palmieri, F. Investigating the Fuel Type Influence on Diesel CR Pump Performance. Energy Procedia 2018, 148, 908–915. [Google Scholar] [CrossRef]
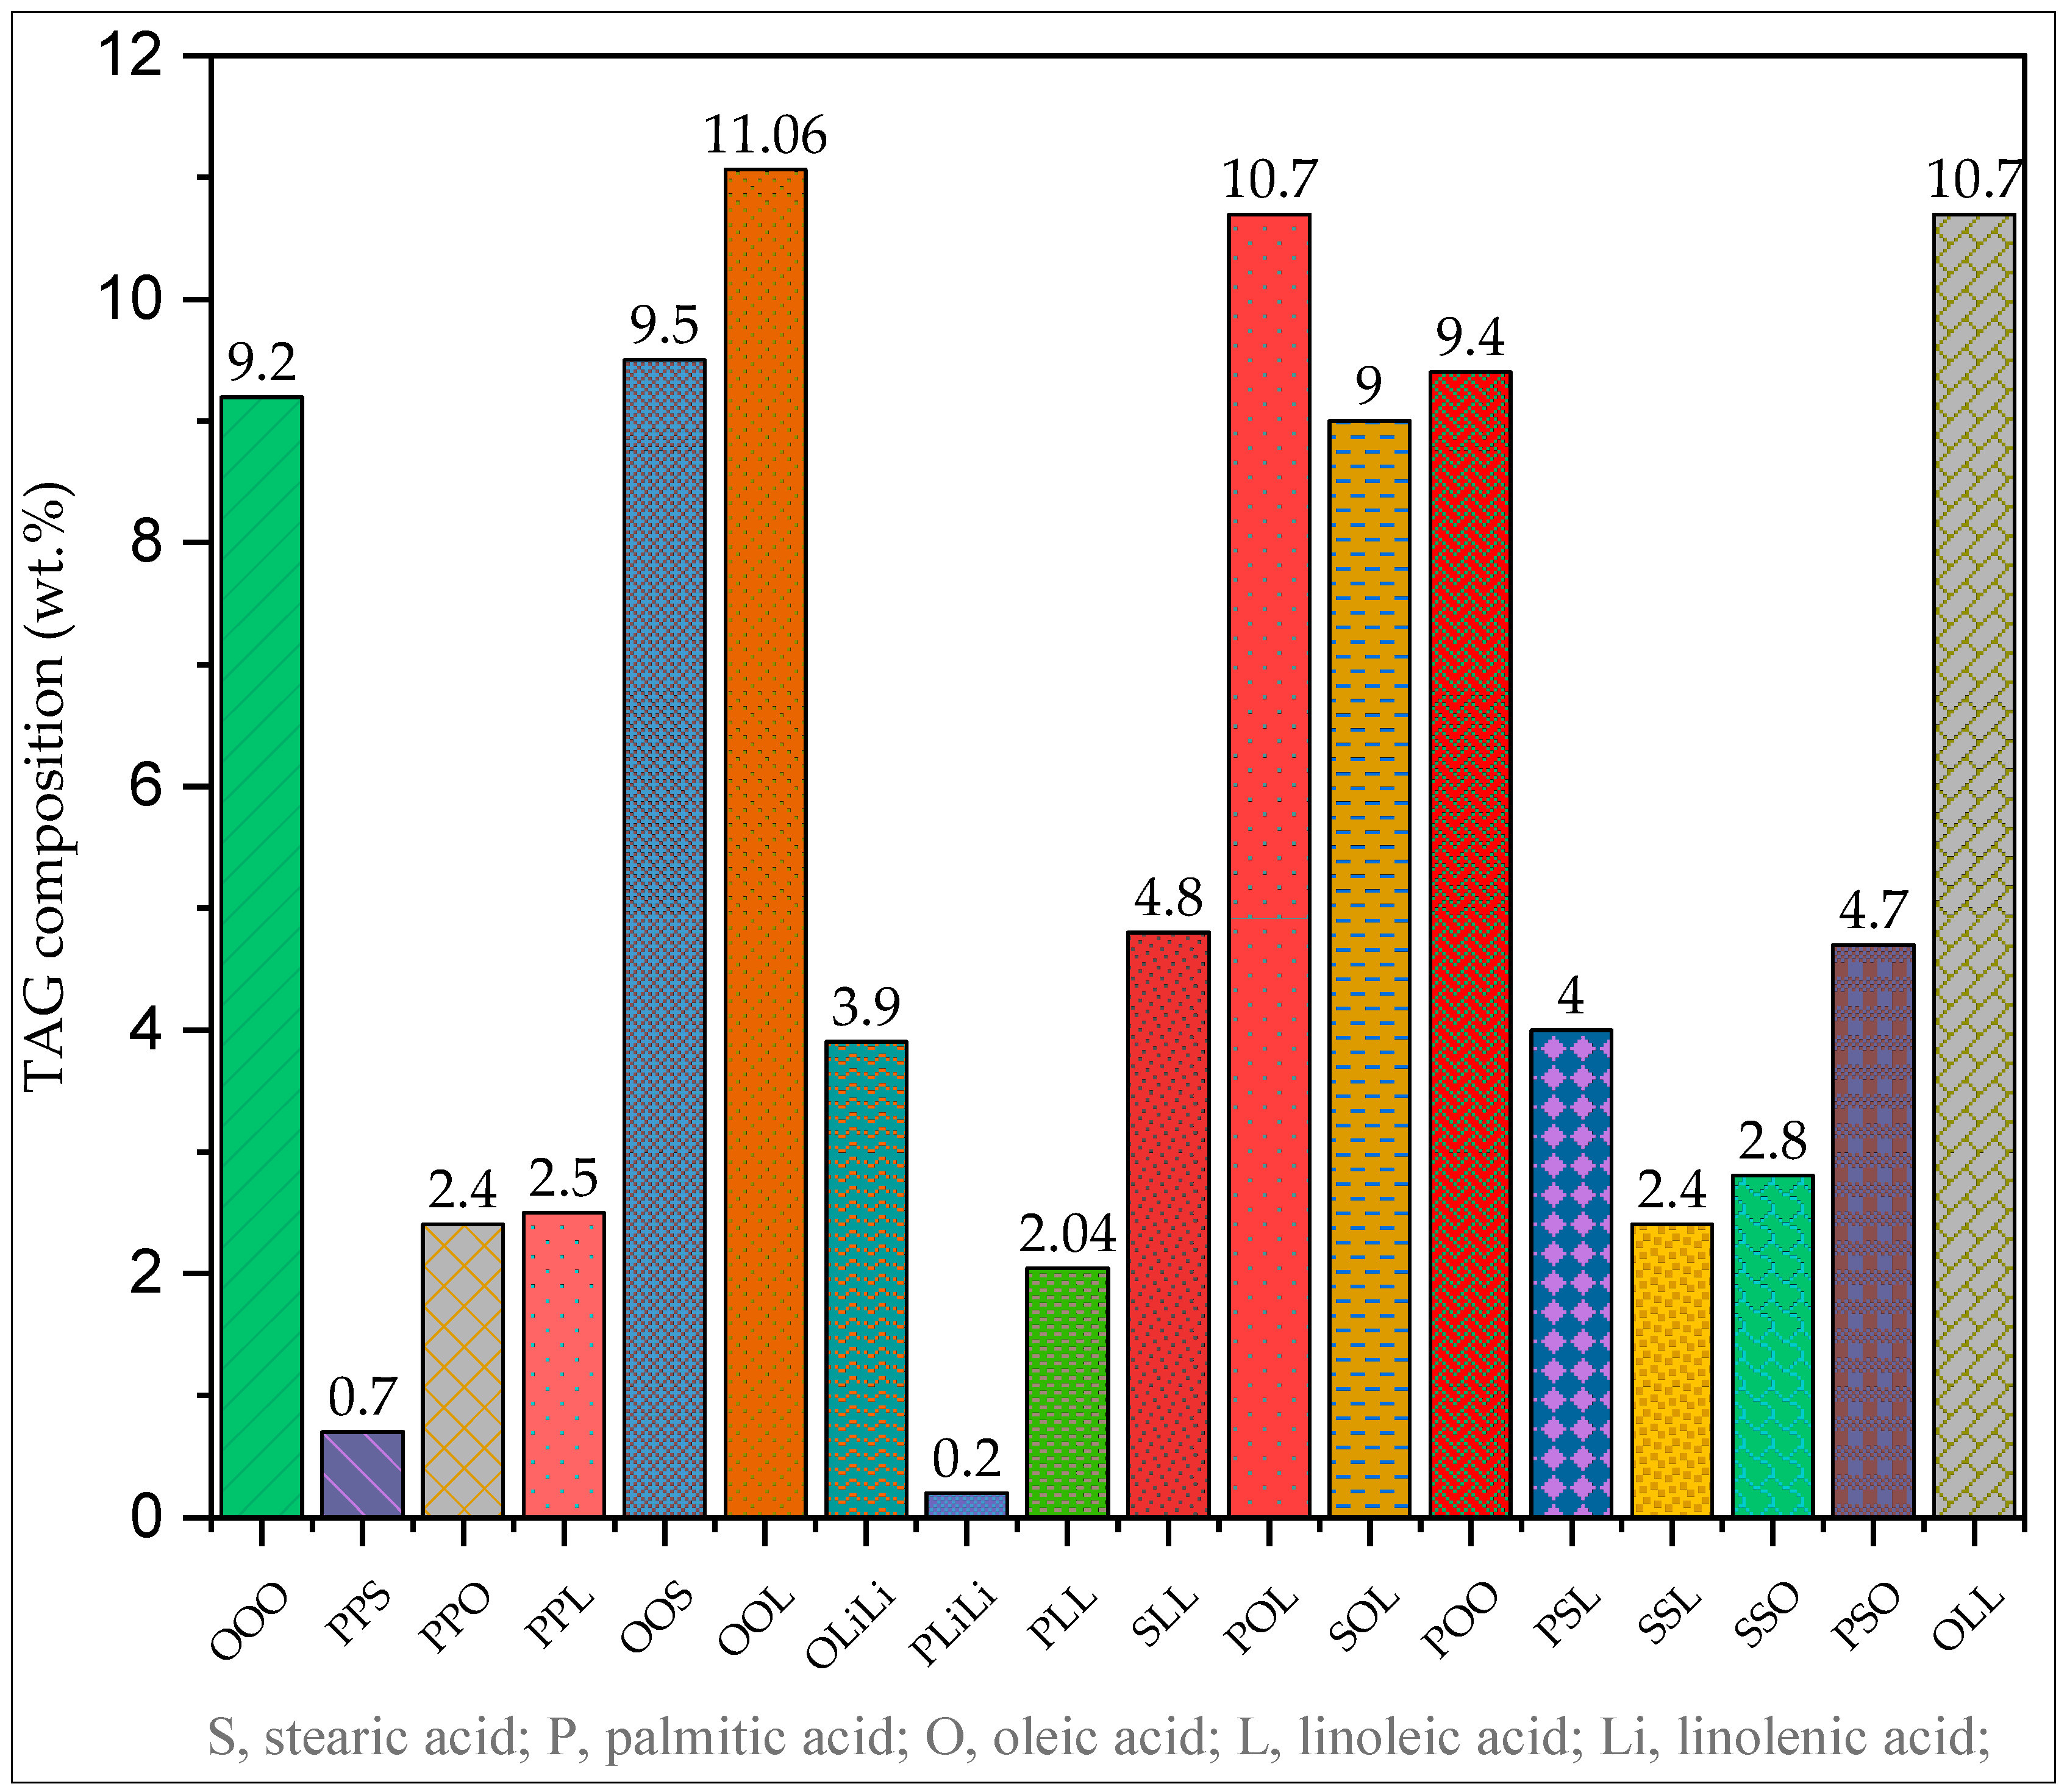
  54. Crane, S.; Aurore, G.; Joseph, H.; Mouloungui, Z.; Bourgeois, P. Composition of fatty acids triacylglycerols and unsaponifiable matter in Calophyllum calaba L. oil from Guadeloupe. Phytochemistry 2005, 66, 1825–1831. [Google Scholar] [CrossRef] [PubMed]
  55. Atabani, A.E.; César, A.d.S. Calophyllum inophyllum L.—A prospective non-edible biodiesel feedstock. Study of biodiesel production, properties, fatty acid composition, blending and engine performance. Renew. Sustain. Energy Rev. 2014, 37, 644–655. [Google Scholar] [CrossRef]
  56. Atabani, A. A Comprehensive Analysis of Edible and Non-Edible Biodiesel Feedstocks, in Mechanical Engineering; University of Malaya: Kuala Lumpur, Malaysia, 2013; Volume 188. [Google Scholar]
  57. Atabania, A.; Silitonga, A.; Mahliaa, T.; Masjukia, H.; Badruddina, I. Calophyllum inophyllum L. as a potential feedstock for bio-diesel production. Seed 2011, 40, 40–50. [Google Scholar]
  58. Sahoo, P.; Das, L. Process optimization for biodiesel production from Jatropha, Karanja and Polanga oils. Fuel 2009, 88, 1588–1594. [Google Scholar] [CrossRef]
  59. Fattah, I.R.; Kalam, M.; Masjuki, H.; Wakil, M. Biodiesel production, characterization, engine performance, and emission characteristics of Malaysian Alexandrian laurel oil. RSC Adv. 2014, 4, 17787–17796. [Google Scholar] [CrossRef]
  60. Serrano-Bermúdez, L.M.; Monroy-Peña, C.A.; Moreno, D.; Abril, A.; Imbachi Niño, A.D.; Martínez Riascos, C.A.; Buitrago Hurtado, G.; Narváez Rincón, P.C. Kinetic model for the esterification of free fatty acids from palm oil with methanol using sulfuric acid as catalyst and sensitivity analysis in tubular reactors. J. Am. Oil Chem. Soc. 2022, 99, 253–263. [Google Scholar] [CrossRef]
  61. Zulqarnain; Yusoff, M.H.M.; Ayoub, M.; Nazir, M.H.; Sher, F.; Zahid, I.; Ameen, M. Solvent extraction and performance analysis of residual palm oil for biodiesel production: Experimental and simulation study. J. Environ. Chem. Eng. 2021, 9, 105519. [Google Scholar] [CrossRef]
  62. Okoro, O.V.; Sun, Z.; Birch, J. Catalyst-Free Biodiesel Production Methods: A Comparative Technical and Environmental Evaluation. Sustainability 2018, 10, 127. [Google Scholar] [CrossRef]
  63. Yancy-Caballero, D.M.; Guirardello, R. Modeling and parameters fitting of chemical and phase equilibria in reactive systems for biodiesel production. Biomass Bioenergy 2015, 81, 544–555. [Google Scholar] [CrossRef]
  64. Rabelo Silva, G.C.; Caño de Andrade, M.H. Simulation and optimization of CSTR reactor of a biodiesel plant by various plant sources using Aspen Plus. Int. J. Chem. React. Eng. 2020, 18, 20200085. [Google Scholar] [CrossRef]
  65. Narváez, P.C.; Rincon, S.; Sanchez, F. Kinetics of palm oil methanolysis. J. Am. Oil Chem. Soc. 2007, 84, 971–977. [Google Scholar] [CrossRef]
  66. Rizwanul Fattah, I.M.; Masjuki, H.H.; Kalam, M.A.; Wakil, M.A.; Ashraful, A.M.; Shahir, S.A. Experimental investigation of performance and regulated emissions of a diesel engine with Calophyllum inophyllum biodiesel blends accompanied by oxidation inhibitors. Energy Convers. Manag. 2014, 83, 232–240. [Google Scholar] [CrossRef]
  67. Albuquerque, A.A.; Ng, F.T.T.; Danielski, L.; Stragevitch, L. Phase equilibrium modeling in biodiesel production by reactive distillation. Fuel 2020, 271, 117688. [Google Scholar] [CrossRef]
  68. Granjo, J.F.O.; Duarte, B.P.M.; Oliveira, N.M.C. Integrated production of biodiesel in a soybean biorefinery: Modeling, simulation and economical assessment. Energy 2017, 129, 273–291. [Google Scholar] [CrossRef]
  69. Osmieri, L.; Alipour Moghadam Esfahani, R.; Recasens, F. Continuous biodiesel production in supercritical two-step process: Phase equilibrium and process design. J. Supercrit. Fluids 2017, 124, 57–71. [Google Scholar] [CrossRef]
Figure 1. Schematic diagram representation of biodiesel production plant.
Sustainability 16 03291 g001
Figure 2. Methodology flowchart for design, analysis, and calculations.
Sustainability 16 03291 g002
Figure 3. Flowchart for biodiesel conversion modeling and simulation.
Sustainability 16 03291 g003
Figure 4. Pump performance curve and system curve superimposed, head vs. flow rate.
Sustainability 16 03291 g004
Figure 5. Top view of the proposed plant highlighting the bends involved in the pipe network.
Sustainability 16 03291 g005
Figure 6. Isometric view of the proposed plant layout indicating the stages of the production plant.
Sustainability 16 03291 g006
Figure 7. Front view of the proposed biodiesel production plant.
Sustainability 16 03291 g007
Figure 8. Composition of Calophyllum inophyllum bio-oil.
Sustainability 16 03291 g008
Figure 9. Biodiesel production plant developed in Aspen Plus.
Sustainability 16 03291 g009
Figure 10. Calophyllum inophyllum biodiesel composition.
Sustainability 16 03291 g010
Table 1. Analytical calculations for the pipe network.
NameBlockProcessPurposeComment
RCSTRSustainability 16 03291 i001TransesterificationOil reacts with alcohol in the presence of the catalyst to separate FAME and glycerolSimplified simulation with stoichiometric reactions
RadFracSustainability 16 03291 i002Methanol recoveryRecover the excess and unreacted methanol Rigorous multi-stage distillation model with seven theoretical stages.
L/L SepSustainability 16 03291 i003Water washingRemove unreacted catalyst and other impurities Rigorous multi-stage liquid-liquid extractor model with six theoretical stages.
RedFracSustainability 16 03291 i004FAME purificationPurify FAME and recover bio-oilRigorous multi-stage liquid-liquid extractor model with six theoretical stages.
RStoic & L/L SepSustainability 16 03291 i005Catalyst removalRemove excess catalystSimplified simulation with stoichiometric reactions and solid removal.
RedFracSustainability 16 03291 i006Glycerol purificationPurify glycerolRigorous multi-stage liquid-liquid extractor model.
Table 4. Calculations were carried out for the pump.
Design ItemDescriptionValueCalculation
PumpSystem head equation = Static Head + Dynamic Head 62.8 + 64208 Q 2
  • Assumptions:
    Pipe Length (L) = 150 m
    Inlet Pressure (P1) = 1 bar
    Outlet Pressure (P2) = 4 bar
    Z2 − Z1 = 28 m
    V2 − V1 = V2 = V = Q A = 0.0078 m2
    Density ( ρ ) = 880 kg/m3
  • H s t a t i c = P 2 P 1 ρ g + ( Z 2 Z 1 ) = 4 1 × 10 ^ 5 ρ g + 28 = 62.8 m
  • H d y n = V 2 2 V 1 2 ρ g + [ f l D + Σ K L ] v 2 2 g
  • H d y n = 64208 Q 2
Table 5. Specification of the selected pump.
Pump Specifications
Pump TypeCentrifugal
Pump ModelMP Pumps, Petroleum 40
Suction and Discharge Size4-inch × 4-inch NPT
Maximum Capacity0.047 m3/s
Maximum Head69 m
Speed3500 rpm
Power37.28 kW
Table 6. Calculations for the reactor, tanks, and heat exchanger sizing.
ComponentDescriptionNotes
Reactors
  • Reactors gain liquid from all lines.
  • The volume of one reactor: 1200 lite
  • Residence time: Around 1 h.
  • Heat duty: = (incoming mass) (specific heat) (temperature rise) = 22 kW
  • Outlet temperature: 60 °C
  • Volume flow rate = 1000 lits//h.
  • Residence time = 1 h.
  • The volume required for one reactor = 1200 lits.
Methanol recovery
  • Methanol is recovered from the liquid coming from the reactor.
  • Amount of heat release required = (mass flow rate) (specific heat) (temperature drop) = 107 kW
Assumption: Condensed methanol from the distillation block. A blower and heat exchangers are used to condense the methanol on an industrial scale.
Water washing
  • The water and glycerol mixture are sent for further processing.
  • The volume of the tank required is around 440 lits which is 1750/4.
Assumption: 20 min time is allowed for water washing.
Table 7. Input boundary conditions for the separators.
BlockTotal StagesRecovery StageDistillate RateReflux RatioBottoms RateCondenser Pressure
SEP174111 kg/hr2-0.2
SEP264-1100 kg/h0.1
SEP363-2103 kg/h0.4
Table 8. Input and output feeds of the workflow chart.
InputOutput
material feedFlow rateRecorded resultsFlow rate
Oil890 kg/h (1000 lits of oil)FAME800.9 kg/h
Methanol199 kg/hGlycerol76.68 kg/h
KOH8.9 kg/hOil recovered 220 kg/h
Disclaimer/Publisher’s Note: The statements, opinions and data contained in all publications are solely those of the individual author(s) and contributor(s) and not of MDPI and/or the editor(s). MDPI and/or the editor(s) disclaim responsibility for any injury to people or property resulting from any ideas, methods, instructions or products referred to in the content.

