Article

Analysis of Vegetation Environmental Stress and the Lag Effect in Countries along the “Six Economic Corridors”

1
Key Laboratory of Mountain Hazards and Earth Surface Process, Institute of Mountain Hazards and Environment (IMHE), Chinese Academy of Sciences (CAS), Chengdu 610041, China
2
Chengdu Institute of Planning & Design, Chengdu 610000, China
3
Forestry and Garden Center of Pengshan District, Meishan 620000, China
*
Author to whom correspondence should be addressed.
These authors contributed equally to this work.
Sustainability 2024, 16(8), 3303; https://doi.org/10.3390/su16083303
Submission received: 21 February 2024 / Revised: 5 April 2024 / Accepted: 12 April 2024 / Published: 15 April 2024

Abstract

:
Climate conditions have a significant impact on the growth of vegetation in terrestrial ecosystems, and the response of vegetation to climate shows different lag effects with the change in spatial pattern and category of the ecosystem. Exploring the interaction mechanism between climate and vegetation growth is helpful to promote the sustainable development of the regional ecological environment. Using normalized vegetation index (NDVI) and meteorological data, based on univariate linear regression and partial correlation analysis, this study explores the temporal and spatial pattern and change trend of vegetation cover in regions and node cities along the “six economic corridors”, and analyzes the environmental stress of vegetation growth and the lag effect of climate response. This study shows that there are great differences in the overall vegetation coverage along the “six economic corridors”. The vegetation coverage in Southeast Asia is the best and that in central and West Asia is the worst. The vegetation coverage in the study area shows an improvement trend, accounting for 39.6% of the total area. There are significant differences in the lag effect of vegetation response and the main climate factors affecting vegetation growth, which is related to the diversity of vegetation and climate characteristics. In this study, we selected regions along the “six economic corridors” that exhibit large latitude and altitude gradients, diverse climate types, and significant seasonal changes and spatial differences in climate conditions as our research areas. Additionally, we considered the impact of different regions and various types of vegetation on their response to climate change. This is of great significance for gaining a deeper understanding of the response mechanism of global climate change and vegetation ecology. Furthermore, our research can provide valuable information to support the ecological environment protection of different typical vegetation against extreme climates, ultimately contributing to the sustainable development of “the Belt and Road”.

1. Introduction

The Global Climate Change and Terrestrial Ecosystem Response (GCTE) is a focal area of research within the International Geosphere-Biosphere Programme (IGBP) that has garnered significant attention from the global scientific community and society at large [1,2]. Vegetation plays a crucial role in Earth’s terrestrial ecosystems, intricately interconnected with atmospheric, soil, and water elements [3]. Changes in vegetation type and coverage over space and time are influenced by terrestrial ecosystems and serve as comprehensive indicators for monitoring ecological shifts [3,4,5,6,7,8]. Therefore, within the context of global climate change, comprehending the spatial and temporal dynamics of terrestrial vegetation coverage and investigating the dynamic impacts of climate factors on it (examining alterations in surface vegetation coverage and climate factors over time and space, elucidating their interdependent relationship) hold paramount importance for gaining deeper insights into the mechanisms governing global climate change and vegetation ecology [9].
Investigating the spatiotemporal dynamics of vegetation requires the support of long-term data, and remote sensing technology, with its advantages of continuous observation and multiple spatiotemporal scales, provides an effective means for this purpose [10]. Among these technologies, the Normalized Difference Vegetation Index (NDVI) calculated from different spectral reflectance values of remote sensing satellites can effectively reflect the growth status of regional vegetation [11,12]. It is an excellent indicator for monitoring vegetation coverage and vigor of terrestrial ecosystems and has been widely used in research on vegetation dynamics at regional or global scales [13,14]. In recent years, the most commonly used NDVI remote sensing datasets include GIMMS NDVI [15], MODIS NDVI [16], and SPOT-VGT NDVI [17]. Although MODIS NDVI and SPOT-VGT NDVI have higher spatial resolution, their time series are shorter. On the other hand, the GIMMS NDVI dataset has a long time span, wide coverage, and strong ability to reflect vegetation changes [18]. Therefore, using the GIMMS NDVI dataset for long-term monitoring and driving force analysis of vegetation coverage in large-scale regions has obvious advantages.
Climate is a crucial factor influencing the growth of vegetation, and vegetation activities and annual changes are impacted by climate change, particularly in the context of global warming [19]. Precipitation, temperature, and radiation are significant climatic factors that drive changes in vegetation. Variations in water and heat conditions have a substantial impact on physiological functions and distribution density of vegetation, leading to alterations in vegetation structure [20,21]. To investigate spatial and temporal changes in vegetation cover and its response to climatic factors, numerous scholars have conducted studies on dynamic changes in vegetation cover based on NDVI data [13,20,22,23]. Initially, these studies focused on the influence of specific climate factors on vegetation growth. For instance, Zhou et al. demonstrated that rising temperatures can enhance photosynthesis in vegetation [24]; Jiapaer et al. indicated that rainfall can alter soil aeration conditions, increase soil moisture, thereby affecting plant growth [25]; Jiang et al. pointed out that solar radiation is the primary climate factor impacting NDVI changes in South China [26]. However, there is inconsistency regarding the correlation between hydrothermal factors and vegetative growth across different regions. Some scholars believe precipitation plays an important role while others argue that temperature has a more pronounced effect on vegetative growth than precipitation [27,28,29,30]. Nevertheless, it remains consistent that temperature, precipitation, and solar radiation are the main climatic factors influencing variations in NDVI [31,32]. Later, as more research was conducted on various land uses [21], vegetation zoning [28], and climate zoning [33], researchers discovered that different types of vegetation respond differently to the same climate factors [11]. Additionally, they found that vegetation in different regions also exhibits significant differences in response to climate factors. However, most studies have focused on the interannual scale and have overlooked the influence of climate factors during different seasons on various growth stages of vegetation. Furthermore, only a few studies have considered the variation in vegetation response to climatic seasons and often solely concentrate on the direct impact of climate change on vegetation growth without evaluating the delayed effect of climate change on adjacent seasons. An increasing number of studies have indicated a hysteresis effect in the response of vegetation growth to climate. These studies clearly demonstrate that concurrent climatic conditions may not necessarily drive vegetation growth and that early climatic factors may exert a greater influence [11,34]. Therefore, it is essential to consider the hysteresis effect when exploring environmental stress on vegetation. Moreover, when studying areas with substantial latitude and altitude gradients, diverse climate types, and notable seasonal and spatial variations in climate conditions, it is crucial to account for the influence of different regions and various types of vegetation.
These six economic corridors are collaborative economic zones planned by China and the countries along “the Belt and Road”. While these corridors aim to promote economic development, they also have a significant impact on the ecological environment of the regions they pass through. The majority of countries along these corridors are developing nations and emerging economies, facing various challenges such as environmental pollution and ecological degradation due to industrialization and urbanization. Vegetation plays a crucial role in providing regional ecological services, including soil and water conservation, climate regulation, disaster prevention and mitigation, protection of ecosystem diversity, as well as enhancing the overall ecological landscape value.
In light of this, this study utilizes GIMMS NDVI data from 1986 to 2015 to examine the spatiotemporal dynamics of vegetation coverage in six corridors and node cities. It combines global high-resolution climate reanalysis data to analyze the environmental pressure on vegetation growth at the pixel scale and hysteresis effect. Additionally, it seeks to understand the response mechanism and spatial differences between NDVI and climate factors based on different typical vegetation types. The research objectives include (1) analyzing the changes in NDVI and climate factors in six corridor areas; (2) investigating the correlation between NDVI and climatic factors; (3) exploring the time lag effect of NDVI on climatic factors and the difference in response of NDVI to climatic factors in different vegetation types. Understanding the potential impact of long-term climate change on terrestrial ecosystems along the six economic corridors of “the Belt and Road”, as well as exploring response mechanisms of different vegetation types along these corridors, is crucial for understanding how vegetation ecosystems respond to global climate change. This research provides information support for ecological environment protection of different typical vegetations in response to extreme climates, ultimately supporting sustainable development efforts within “the Belt and Road”.
The remaining sections of this study are organized as follows: Section 2 offers a detailed description of the research methodology, including data collection and data analysis techniques. Section 3 gives the empirical results. Section 4 provides an extensive discussion. Finally, Section 5 provides conclusions.

2. Materials and Methods

2.1. Materials

2.1.1. Climate Data

The monthly temperature and precipitation data used in this study were obtained from the Centre for Climate Research, University of East Anglia, UK data (CRU TS v4.01) with a spatial resolution of 0.5° × 0.5°, this dataset obtained by interpolating observations from more than 4000 meteorological stations [35]. Monthly solar radiation data were derived from the CRUNCEP V7 dataset, which was reanalyzed by the NATIONAL Center for Environmental Prediction (NCEF) from the CRU TS3.21 database with a spatial resolution of 0.5° × 0.5°.

2.1.2. NDVI

The NDVI data were obtained from the GIMMS NDVI3g dataset provided by the Global Monitoring and Modeling Study Group (GIMMS) of the National Aeronautics and Space Administration (NASA) with a temporal resolution of 15 days, a spatial resolution of 8 km × 8 km, and a time series of 1982–2015 [36]. The dataset has been processed with radiometric correction, geometric correction, and atmospheric correction to ensure the quality of the data [36]. To eliminate the influence of clouds and noise, the maximum synthesis method (MVC) was used to synthesize monthly NDVI data and annual NDVI data separately, after which the Savitzky–Golay filter (S–G filter) was adopted to smooth and de-noise the data [37,38]. The monthly NDVI data were resampled to 0.5° to maintain the same resolution as the meteorological data.

2.1.3. Land Cover Data

MODIS land cover data (MCD12C1) was obtained from the NASA Land Processes Distributed Data Archive Center (LPDAAC) with a spatial resolution of 0.05° [39]. This dataset classifies land use types into 17 categories, of which we extracted the vegetation category (Figure 1), and subsequent studies were conducted on the vegetation category in order to eliminate the influence of non-vegetation.

2.2. Methods

This study explored vegetation trends, environmental stresses and lag effects in countries along the six corridors using NDVI, temperature, precipitation and radiation for 30 years from 1986 to 2015.

2.2.1. Univariate Linear Regression Analysis

The annual maximum NDVI and time pixel by pixel were selected for linear regression analysis. The fitted slope was used to characterize the vegetation growth, slope > 0 indicates that the vegetation tends to improve, the greater the value, the more pronounced the improvement effect, and vice versa is degradation [40]. The calculation formula can be described as:
s l o p e j = 1 m n × 1 n i × N D V I I 1 n ( N D V I i ) n × 1 n ( i 2 ) 1 n N D V I i 2 ,
where slopej represents the slope value of the regression equation for the jth pixel, m represents the total number of pixels, n is the total number of years studied, i.e., n = 30, i represents the ith year, and NDVIi represents the annual maximum NDVI value in ith year.

2.2.2. Partial Correlation Analysis

The 30-year time series data were extracted from the corresponding pixels of monthly NDVI, temperature, precipitation and radiation data, resampling to 0.5°, respectively, and the interannual change curves were constructed. Translated meteorological data, as shown in Figure 2, m represents the length of translational data, and each translation represents a lag of one month.
The lag effect on the monthly scale generally does not exceed one quarter [34,41], so the value of m ranges from 0 to 3. The bias correlation coefficients of NDVI and meteorological factors were calculated separately [42]. r2max indicates the maximum bias correlation coefficient, and r2max was used to characterize the environmental stress of vegetation and m was used to characterize the lag month.
The partial correlation calculation formula can be described as:
r 2 12,34 = R 2 1 2,3 , 4 R 2 1 ( 3,4 ) 1 R 2 1 ( 3,4 ) ,
where r212,34 represents the partial correlation coefficient between variables 1 and 2; R21(2,3,4) represents the coefficient of determination of the regression analysis between variable 1 and variables 2, 3, and 4; R21(3,4) represents the coefficient of determination of the regression analysis between variable 1 and variables 3 and 4.
The t-test was utilized to assess the significance of the partial correlation coefficients in this study, and the significance level α was set at 0.05, and the pixels that did not pass the significance test were excluded.

3. Results

3.1. Vegetation Distribution and Trend Analysis

The spatial distribution of the mean value of the annual maximum NDVI over the 30-year period from 1986 to 2015 is shown in Figure 3. It can be seen that the overall vegetation cover along the “six economic corridors” varies greatly, with better vegetation cover in Southeast Asia and along the southern Siberian Plain and Europe, and most of the NDVI in this region is above 0.8; followed by southeastern China and South Asia, with NDVI between 0.6 and 0.8, among which the vegetation cover in southeastern China is slightly better than that in South Asia. The vegetation cover in Southeast China is slightly better than that in South Asia; the vegetation cover in Central Asia, West Asia and the non-vegetation-to-vegetation transition area of the Qinghai–Tibet Plateau is poor, with NDVI below 0.5 in most areas. Central Asia is deeply inland, less influenced by the ocean, and has a temperate continental climate with less precipitation, while West Asia is influenced by the subtropical high pressure and the trade wind belt, forming a tropical desert climate with the same scarce precipitation, which is the fundamental reason for its sparse vegetation. According to the classification statistics of the mean NDVI in 30 years, the vegetation coverage in this region is generally good, and the areas with NDVI > 0.8 account for 35.1%, which is the largest proportion. The area of 0.7–0.8 accounted for 23.1%, the area of 0.5–0.7 accounted for 25.3%, and the area of less than 0.5 accounted for only 16.5%. The text continues here.
The change in NDVI in the study area from 1986 to 2015 is analyzed by univariate linear regression. Univariate linear regression aims to analyze the overall change over the past 30 years, which greatly weakens the impact of abnormal data and can truly reflect the evolution trend of vegetation cover over a long period of time [43,44]. Understanding the changing trend of NDVI is essential for grasping the temporal and spatial variations in vegetation cover within the study area. This knowledge holds significant value and practical significance for the preservation of the ecological environment [45]. The spatiotemporal variation trend of NDVI is shown in Figure 4, and the statistical variation trend is shown in Table 1, where the variation range is the product of the trend and the total years. In the countries along the “six economic corridors”, the areas with essentially unchanged vegetation cover accounted for the largest proportion, up to 40.1%. 39.6% of the regions showed slight improvement, moderate improvement and obvious improvement, among which South Asia, southeast China and Siberia showed the most obvious improvement. The reason for the trend increase in vegetation cover in high latitudes may be that global warming promotes photosynthesis and prolongs the growing season of plants in this region [46]. The reason for the vegetation improvement in southeast China and South Asia may be that the government pays more attention to ecological protection, such as China’s the Grain for Green project and Pakistan’s afforestation program. The area with degradation trend accounts for 20.3%. In Southeast Asia, although the vegetation coverage is very high, there is a slight trend of degradation. This may be attributed to measures such as deforestation and reclamation aimed at expanding the planting area for cash crops and food crops in Southeast Asian countries, and large-scale development of forest resources and export logs in pursuit of temporary economic benefits [47].
The “six economic corridors” are economic belts with the goal of interconnection and interoperability that are supported by node cities along “the Belt and Road”, and jointly built with countries along the route [48]. The analysis of the ecological foundation will contribute to advancing the sustainable development of the regional ecological environment and provide substantial support for establishing a green “the Belt and Road”. Therefore, a buffer of 100 km was made for the “six economic corridors”, and the mean value of NDVI in 30 years was calculated for the six regions. The findings indicate that the vegetation coverage of the China–Indochina–Peninsula Economic Corridor is superior, and the mean value of NDVI is 0.83; the second is the Bangladesh China–India–Myanmar Economic Corridor, which has an average NDVI of 0.79. This is followed by the China–Mongolia–Russia Economic Corridor, with an average NDVI of 0.78. The New Eurasian Land Bridge has an average NDVI value of 0.69. On the other hand, the vegetation coverage of the China–Pakistan Economic Corridor and China–Central Asia–West Asia Economic Corridor is notably lower, with average NDVI values of 0.44 and 0.42, respectively, indicating poorer vegetation coverage in these areas compared to the other corridors mentioned above. The variation in annual NDVI maximum over time was further examined. Figure 5 illustrates the trend of NDVI variation in six regions over the past 30 years, from 1986 to 2015. It is evident that there were significant differences in vegetation coverage along the six economic corridors, with an overall upward trend. The NDVI of the China–Mongolia–Russia Economic Corridor and the New Eurasian Land Bridge, located in a high latitude area, exhibited significant fluctuations over time, indicating a slight upward trend. The vegetation coverage of the China–Central Asia–West Asia Economic Corridor, Bangladesh–China–India–Myanmar Economic Corridor, and China–Indochina Peninsula Economic Corridor exhibited a slight fluctuation increase. The most obvious improvement in vegetation cover was the China–Pakistan Economic Corridor. Several regions experienced obvious NDVI trough in 2008, which may be because 2008 was one of the 10 warmest years since 1850, and extreme weather and natural disasters occurred frequently around the world, especially in Asia, which inhibited the growth of vegetation [49].
Node cities play a crucial role in the development of economic corridors and serve as the primary link for interconnection. Based on the existing research [50], 61 node cities were selected in the passing area of the “six economic corridors” (Figure 4), and the nodal cities were used as the center to make a 30-km buffer zone to analyze the mean value of NDVI and its changing trend of surrounding vegetation in 30 years. Improvement and degradation are determined according to slope plus or minus. Fifteen of the buffer zones are in non-vegetation areas and are not analyzed, while 20 of the remaining 46 zones show degradation trend (Table 2). Among them, the node cities along the China–Mongolia–Russia Economic Corridor and the New Eurasian Land Bridge in the high-latitude region generally show a degradation trend. The vegetation cover of node cities along China–Indochina Peninsula Economic Corridor and Bangladesh–China–India–Myanmar economic corridor has an obvious improvement trend. It has been shown that the Silk Road Economic Belt as a whole showed a warming trend from 1980 to 2014, while precipitation mainly decreased [51]; the increase in temperature and decrease in precipitation contributed to the growth of forest ecosystems [44], so Southeast Asia and South Asia mostly showed an improvement. The high-latitude region of Siberia is located in the hinterland of the continent, and the reduction in precipitation will inhibit the growth of vegetation, which may be the reason for the decreasing trend of vegetation cover in the high-latitude region. The vegetation cover of the three capital cities (Moscow, Berlin, and Warsaw) in high latitudes, has shown an improving trend; the dominant factors considered in vegetation cover at different spatial scales are different, and the combined influence of climatic and non-climatic (human activities, etc.) factors should be considered at national or urban scales [52]; the expansion of cities will have some impact on vegetation cover, which is mostly negative in developing countries. However, some studies have shown that urban sprawl can also have a positive impact on the environment with increased management of urban green spaces [53]. Therefore, the impact of human activities on ecology is not solely negative; in fact, it may even contribute to the improvement of the ecological environment as economic development reaches a certain level [5].

3.2. Environmental Stress Analysis

The maximum partial correlation coefficients of NDVI and temperature, precipitation and radiation were calculated by the method of selecting the maximum partial correlation coefficient to analyze the vegetation stress by climate, and the lag effect of vegetation response to climate was also considered. The value range of the partial correlation coefficient was between −1 and 1, and a negative number indicated a negative correlation and a positive number indicated a positive correlation, and the larger the value, the higher the correlation. t-test was used to test the significance of the partial correlation coefficient, and the significance level α was set as 0.05. When p > 0.05, the partial correlation was considered insignificant, as shown in Figure 5.
The results showed that temperature, precipitation and radiation simultaneously control vegetation growth in high latitudes, but the effect of precipitation on vegetation growth was weaker than that of air temperature and radiation. In South Asia and Southeast Asia, vegetation growth was negatively correlated with precipitation and radiation, and positively correlated with air temperature (Figure 6). In Central Asia and West Asia, there was a weak negative correlation with precipitation and a weak positive correlation with radiation, while air temperature mostly failed the significance test, indicated that non-climatic factors, such as human activities, extreme weather and natural disasters, should be considered in the analysis of vegetation cover in Central Asia and West Asia.
Different types of vegetation exhibit varied responses to climate, and the driving factors of vegetation growth are closely linked to plant physiological characteristics and their corresponding climatic environment [11]. The average partial correlation coefficients of NDVI with temperature, precipitation, and radiation in evergreen coniferous forests were 0.37, −0.04, and 0.60, respectively. The evergreen coniferous forests were mainly distributed in the high altitude area of middle latitude. As the temperature in this area was relatively low, temperature and radiation became the main stress factors for its growth and were not sensitive to precipitation change. Deciduous coniferous forests were mainly distributed in high latitude area, so radiation and temperature were the main climate driving factors for its growth, and the average partial correlation coefficient was 0.70 and 0.51, respectively. Meanwhile, the growth of deciduous coniferous forest was affected by precipitation, and the average partial correlation coefficient was 0.36. Evergreen broad-leaved forests were widely distributed in tropical rainforests in low-dimensional areas. Due to sufficient precipitation and sunshine in this area, there was no significant correlation between radiation and vegetation growth, with an average partial correlation coefficient of −0.06. However, the increase in precipitation will inhibit vegetation growth, with an average partial correlation coefficient of −0.21. Shrub, savanna and grassland were not sensitive to precipitation, and the mean partial correlation coefficients were 0.07, 0.17 and 0.15, respectively. The irrigation system provided water supply for farmland, so precipitation had no direct effect on the growth of farmland, with a mean bias correlation coefficient of −0.01. Deciduous broadleaf and mixed forests were affected by temperature, precipitation and radiation.
The mean partial correlation coefficients of NDVI with temperature, precipitation and radiation in the node cities were further extracted as shown in Table 3, where Nan is not passing the significance test. The vegetation cover around cities is influenced by human activities, such as the reduction in vegetation cover area brought by urban expansion. From the table, it can be seen that the partial correlation between NDVI and climatic factors in some cities shows insignificant and the partial correlation coefficient is lower than the value of non-urban areas in the same region, which indicates that when considering the drivers of urban vegetation cover change, not only meteorological factors can be introduced, but also human activity coercion accounts for a large proportion. The cities of Akduka, Karaganda, Astana, Ufa, Warsaw, Rotterdam, Ulaanbaatar, Karasnoyarcos, Novosibirsk, Chita, and Moscow are located along the New Asia–Europe Continental Bridge Economic Corridor and the China–Mongolia–Russia Economic Corridor, and are located in areas with relatively high latitudes, so they are more influenced by temperature and radiation. Central Asia and West Asia are deep in the continental hinterland, with scarce precipitation and mainly arid and semi-arid climate. The vegetation growth in cities such as Shimkent, Almaty, Tashkent, Mare, Tehran, Tabriz, Ankara, Erzurum, and Diyarbakır along the China–Central Asia–West Asia Economic Corridor show the opposite trend to the temperature, among which the NDVI of Shimkent, Almaty, Mare, Tabriz, and The skewed correlation between NDVI and precipitation in Ankara did not pass the significance test, indicating that precipitation inhibits vegetation growth in this region and vegetation cover changes may be more influenced by human activities. The China–South China Economic Corridor and the Bangladesh–China–India–Myanmar Economic Corridor are mostly located in Southeast Asia, where the tropical rainforest climate and tropical monsoon climate are dominant, with abundant sunshine and high temperatures throughout the year, and the cities of Myitkyina, Mandalay, and Chittagong have negative correlations between temperature and radiation and NDVI. These results describe the specific spatial pattern of environmental stress on vegetation growth and the main meteorological factors of vegetation stress in nodal cities, which provide a reference for understanding the causes of climate change-driven vegetation growth and promoting sustainable regional ecological development.

3.3. Lag Effect Analysis

Based on the long-term GIMMS NDVI3g time series and CRU meteorological data, we obtained the lag effect of vegetation response to temperature, precipitation, and radiation. Regional statistics were then conducted according to different vegetation types. The results show that the lag effect of the same vegetation type on the response of different meteorological elements is different, and the lag effect of different vegetation types on the response of the same meteorological elements is different.
The lag effect of vegetation growth on temperature response is illustrated in Figure 7a. It is evident that vegetation growth in the middle and high latitudes (30 N–90 N) exhibits the strongest correlation with temperature during the same period, without any apparent lag effect. However, in low latitude areas (0–30 N) such as Southeast Asia and South Asia, the lag effect was more than 2 months in most regions. Those who failed the significance test were mostly located in Central Asia and South Asia. The temperature decreases from the equator to the poles, and the appropriate temperature for vegetation growth needs increases with the increase in latitude. Therefore, in the middle and high latitudes, most vegetation does not show the lag effect of temperature response, and the vegetation is significantly affected by the temperature in the same month, while in the areas with high temperature all year round, the response of vegetation to temperature has the lag effect. In some arid and semi-arid areas (such as Central Asia and West Asia), the increase in temperature will accelerate soil water evaporation, lead to drought, and inhibit the growth of vegetation. There is no lag effect of vegetation on temperature in this area. Most forest ecosystems have no lag effect on temperature. The proportion of evergreen coniferous forest, deciduous coniferous forest, deciduous broad-leaved forest, mixed forest and shrub forest that do not show lag effect is 92%, 100%, 87%, 94% and 97%, respectively. Evergreen broad-leaved forest showed a long time lag for temperature, with no lag accounting for 14%, lag for 3 months accounting for 41%, and an average lag of 1.9 months. In addition, farmland also shows a lag effect in response to temperature, with a lag of 3 months accounting for 35%, with an average lag of 1.3 months.
The lag effect of vegetation growth on precipitation response is illustrated in Figure 7b. Southeast Asia, South Asia, West Asia, and Central Asia all exhibit a short lag in response time to precipitation. However, the reasons for this phenomenon may vary. Most areas of Southeast Asia and South Asia have abundant precipitation and inhibit the growth of vegetation, while Central Asia and West Asia are dominated by arid and semi-arid climate, with scarce precipitation and a lag of more than one month, which shows that the vegetation growth in these regions is directly controlled by water. At the same time, it demonstrates that vegetation growth in arid and semi-arid areas is primarily influenced by the precipitation of the previous month rather than the current month. Studies have shown that the response time lag of the grassland ecosystem to precipitation in arid and semi-arid areas is one month [54]. The response of most forest ecosystems to precipitation showed a long time lag. The deciduous coniferous forest lagged for 2 months accounting for 46%, and the lagged for 3 months accounting for 48%, with an average lag of 2.4 months; in deciduous broad-leaved forest, 41% lagged for 2 months and 33% lagged for 2 months, with an average lag of 2 months; the mixed forest lagged for two months, accounting for 32%, and two months, accounting for 54%, with an average lag of 2.3 months.
The lag effect of vegetation growth on radiation response is illustrated in Figure 7c. It is observed that the lag effect tends to be longer in the middle and high latitudes, typically lasting 2–3 months. This suggests that the radiation intensity during the initial 2–3 months plays a crucial role in vegetation growth. This may be attributed to the relatively low average radiation levels during the growing season in these regions compared to others. Consequently, vegetation growth necessitates more solar radiation for photosynthesis, and the early months of radiation facilitate carbon sequestration through photosynthesis, thereby providing favorable conditions for vegetation growth during this period. The deciduous broadleaf forest, mixed forest and shrub forest all showed lagging effects, with an average lag of 2.2 months, 1.9 months and 2.7 months, respectively; grassland also showed lagging effects, with a lag of 3 months accounting for 48%; compared with these vegetation, the lagging effect of evergreen broadleaf forest was relatively weak, with no lagging phenomenon accounting for 27%, with an average lag of 1.4 months, and evergreen broadleaf forest was mainly distributed in the low-latitude region, which has sufficient light, which will play a certain inhibitory effect on the growth of vegetation, and the radiation in that month directly affects the growth of vegetation.

4. Discussion

The study area demonstrates a slight improvement in vegetation coverage, with high-latitude regions showing a more significant trend of vegetation enhancement (Figure 4). The growth of vegetation in this locality is primarily influenced by temperature and radiation (Figure 6) [55]. As a result, the increase in temperature in high-latitude regions plays a crucial role in enhancing vegetation coverage, aligning with the prevailing perspective that global warming is causing substantial changes in vegetation across most Northern Hemisphere regions [3]. However, urban centers located in high latitude areas generally exhibit a degradation trend (Table 2), indicating that factors beyond climate also impact vegetation coverage around cities. Therefore, when promoting economic corridor development, it is essential to carefully manage the interaction between economic and social progress and ecological conservation, tailoring strategies to specific contexts to effectively advance the green “the Belt and Road” [48,56].
The response of vegetation within the “six economic corridors” to climate variables demonstrates spatial diversity, aligning with findings from prior studies [17,57]. Factors like soil composition, vegetation species, soil moisture levels, and elevation play a role in shaping the distribution of temperature, precipitation, and radiation. Consequently, vegetation displays varying responses to climate elements across diverse climatic zones, geographical areas, and seasonal variations, resulting in unique regional attributes [29].
In the research process, we conducted an analysis of the lag effect of vegetation response to climate factors and identified the main driving factors for different vegetation types. Our results indicate that the lag effect varies for the same vegetation type in response to different meteorological elements, as well as for different vegetation types in response to the same meteorological elements (Figure 7) [58]. Vegetation growth in high latitude areas is primarily influenced by radiation and temperature [59]. In Southeast Asia, precipitation and radiation during the same period inhibit vegetation growth without showing a lag effect.
There are two primary driving factors for vegetation growth. The first factor is climate [60,61], which provides the necessary conditions for vegetation growth. The second factor is human activities and natural disturbances, such as agricultural irrigation, land use change, and natural disasters [62,63]. However, since our focus is primarily on studying the response of vegetation growth to climate factors, we will not analyze the impact of human activities and natural disasters on regional vegetation growth in this study. In addition to climate factors, NDVI is also influenced by other factors such as soil type, soil moisture, altitude, and terrain. Therefore, it should be comprehensively analyzed in conjunction with these other factors [64,65]. In areas where there are significant changes in vegetation growth characteristics, it may be beneficial to consider using higher spatial resolution data and incorporating more influencing factors into the analysis [66].
We focused on examining the lag effect between vegetation index and climate factors, which reflects the correlation and time delay of vegetation response to climate factors over a long time scale. However, our study did not differentiate the varying responses of vegetation growth to different climate conditions [67]. For instance, both water limitation and water abundance occur simultaneously on a global scale and have distinct impacts on vegetation growth [68], thus future research should consider these factors separately when investigating the relationship between vegetation and climate. Furthermore, the degree of correlation between vegetation and climate change fluctuates over time, and the influence of environmental factors varies at different stages, leading to differing response times as well [69].
This study investigated the impact of a single factor on vegetation growth. Changes in vegetation growth are typically the result of interactions between multiple factors, which could be further explored in future research [70,71]. Previous studies have demonstrated that the explanatory power of the interaction between various factors on NDVI changes is significantly greater than that of any single factor alone. The underlying mechanisms of the delayed effect of climate on vegetation change are not fully understood; however, related studies have suggested that warming-induced greening may increase vegetation transpiration, leading to a reduction in soil water content [72]. Additionally, warming accelerates snowmelt runoff and diminishes soil water supply in subsequent seasons, thereby influencing vegetation growth.
This study mainly focused on the universal laws of vegetation response to climate change; however, vegetation activity exhibits complexity in response to climate change. Studies have indicated that as temperatures rise, the impact of temperature on vegetation activities becomes increasingly pronounced [73]. Elevated temperatures can enhance photosynthesis until reaching the optimal threshold [74], beyond which it may intensify vegetation respiration, nutrient depletion, water evapotranspiration, and hinder dry matter accumulation [75]. Seasonal variations also influence vegetation responses to climate change, with temperature increases in winter and spring fostering photosynthesis, extending the growth period, and supporting vegetation growth and nutrient accumulation. Conversely, rising autumn temperatures may have a detrimental effect on NDVI [38]. The effects of maximum and minimum temperatures on vegetation activities vary across different regions, with some studies suggesting a positive correlation between maximum temperature and vegetation NDVI in humid, cold northern areas, and a negative correlation in temperate, arid regions [60]. The relationship between NDVI and minimum temperature exhibits greater complexity [60]. Moisture levels play a regulatory role in vegetation activity, with increased moisture potentially inhibiting vegetation through heightened cloud cover and relative humidity [76]. Consequently, there is a call for more localized investigations into the intricate interplay between vegetation and climate.
To enhance the investigation of vegetation response along the “six economic corridors” to climate variables, this research utilized extensive NDVI data spanning from 1986 to 2015. While this study benefitted from a substantial time frame and sample size, a limitation arose due to the potential saturation of NDVI in regions with dense vegetation cover [77], leading to reduced sensitivity in areas like Southeast Asia. Although the utilization of Enhanced Vegetation Index (EVI) data could address this issue, the current availability of EVI data is limited to the MODIS product, which commenced in 2000 and offers a significantly shorter temporal coverage compared to the NDVI dataset employed in this analysis. Prospects for future research improvement lie in the advancement of EVI-related products.

5. Conclusions

Understanding the relationship between regional changes in NDVI and climate factors is essential for predicting regional vegetation changes and effectively managing ecological restoration [70]. In this study, we utilized the GIMMS NDVI3g dataset from 1986 to 2015 and meteorological data from the CRU dataset to conduct univariate linear regression and partial correlation analysis. This allowed us to examine the temporal and spatial distribution patterns of vegetation cover, environmental stress, and the lag effect of vegetation growth response to environmental stress in our study area. Additionally, we analyzed the trend of vegetation change and identified the main climate driving forces around node cities. Based on the results in this work, the following main conclusions were summarized:
(1)
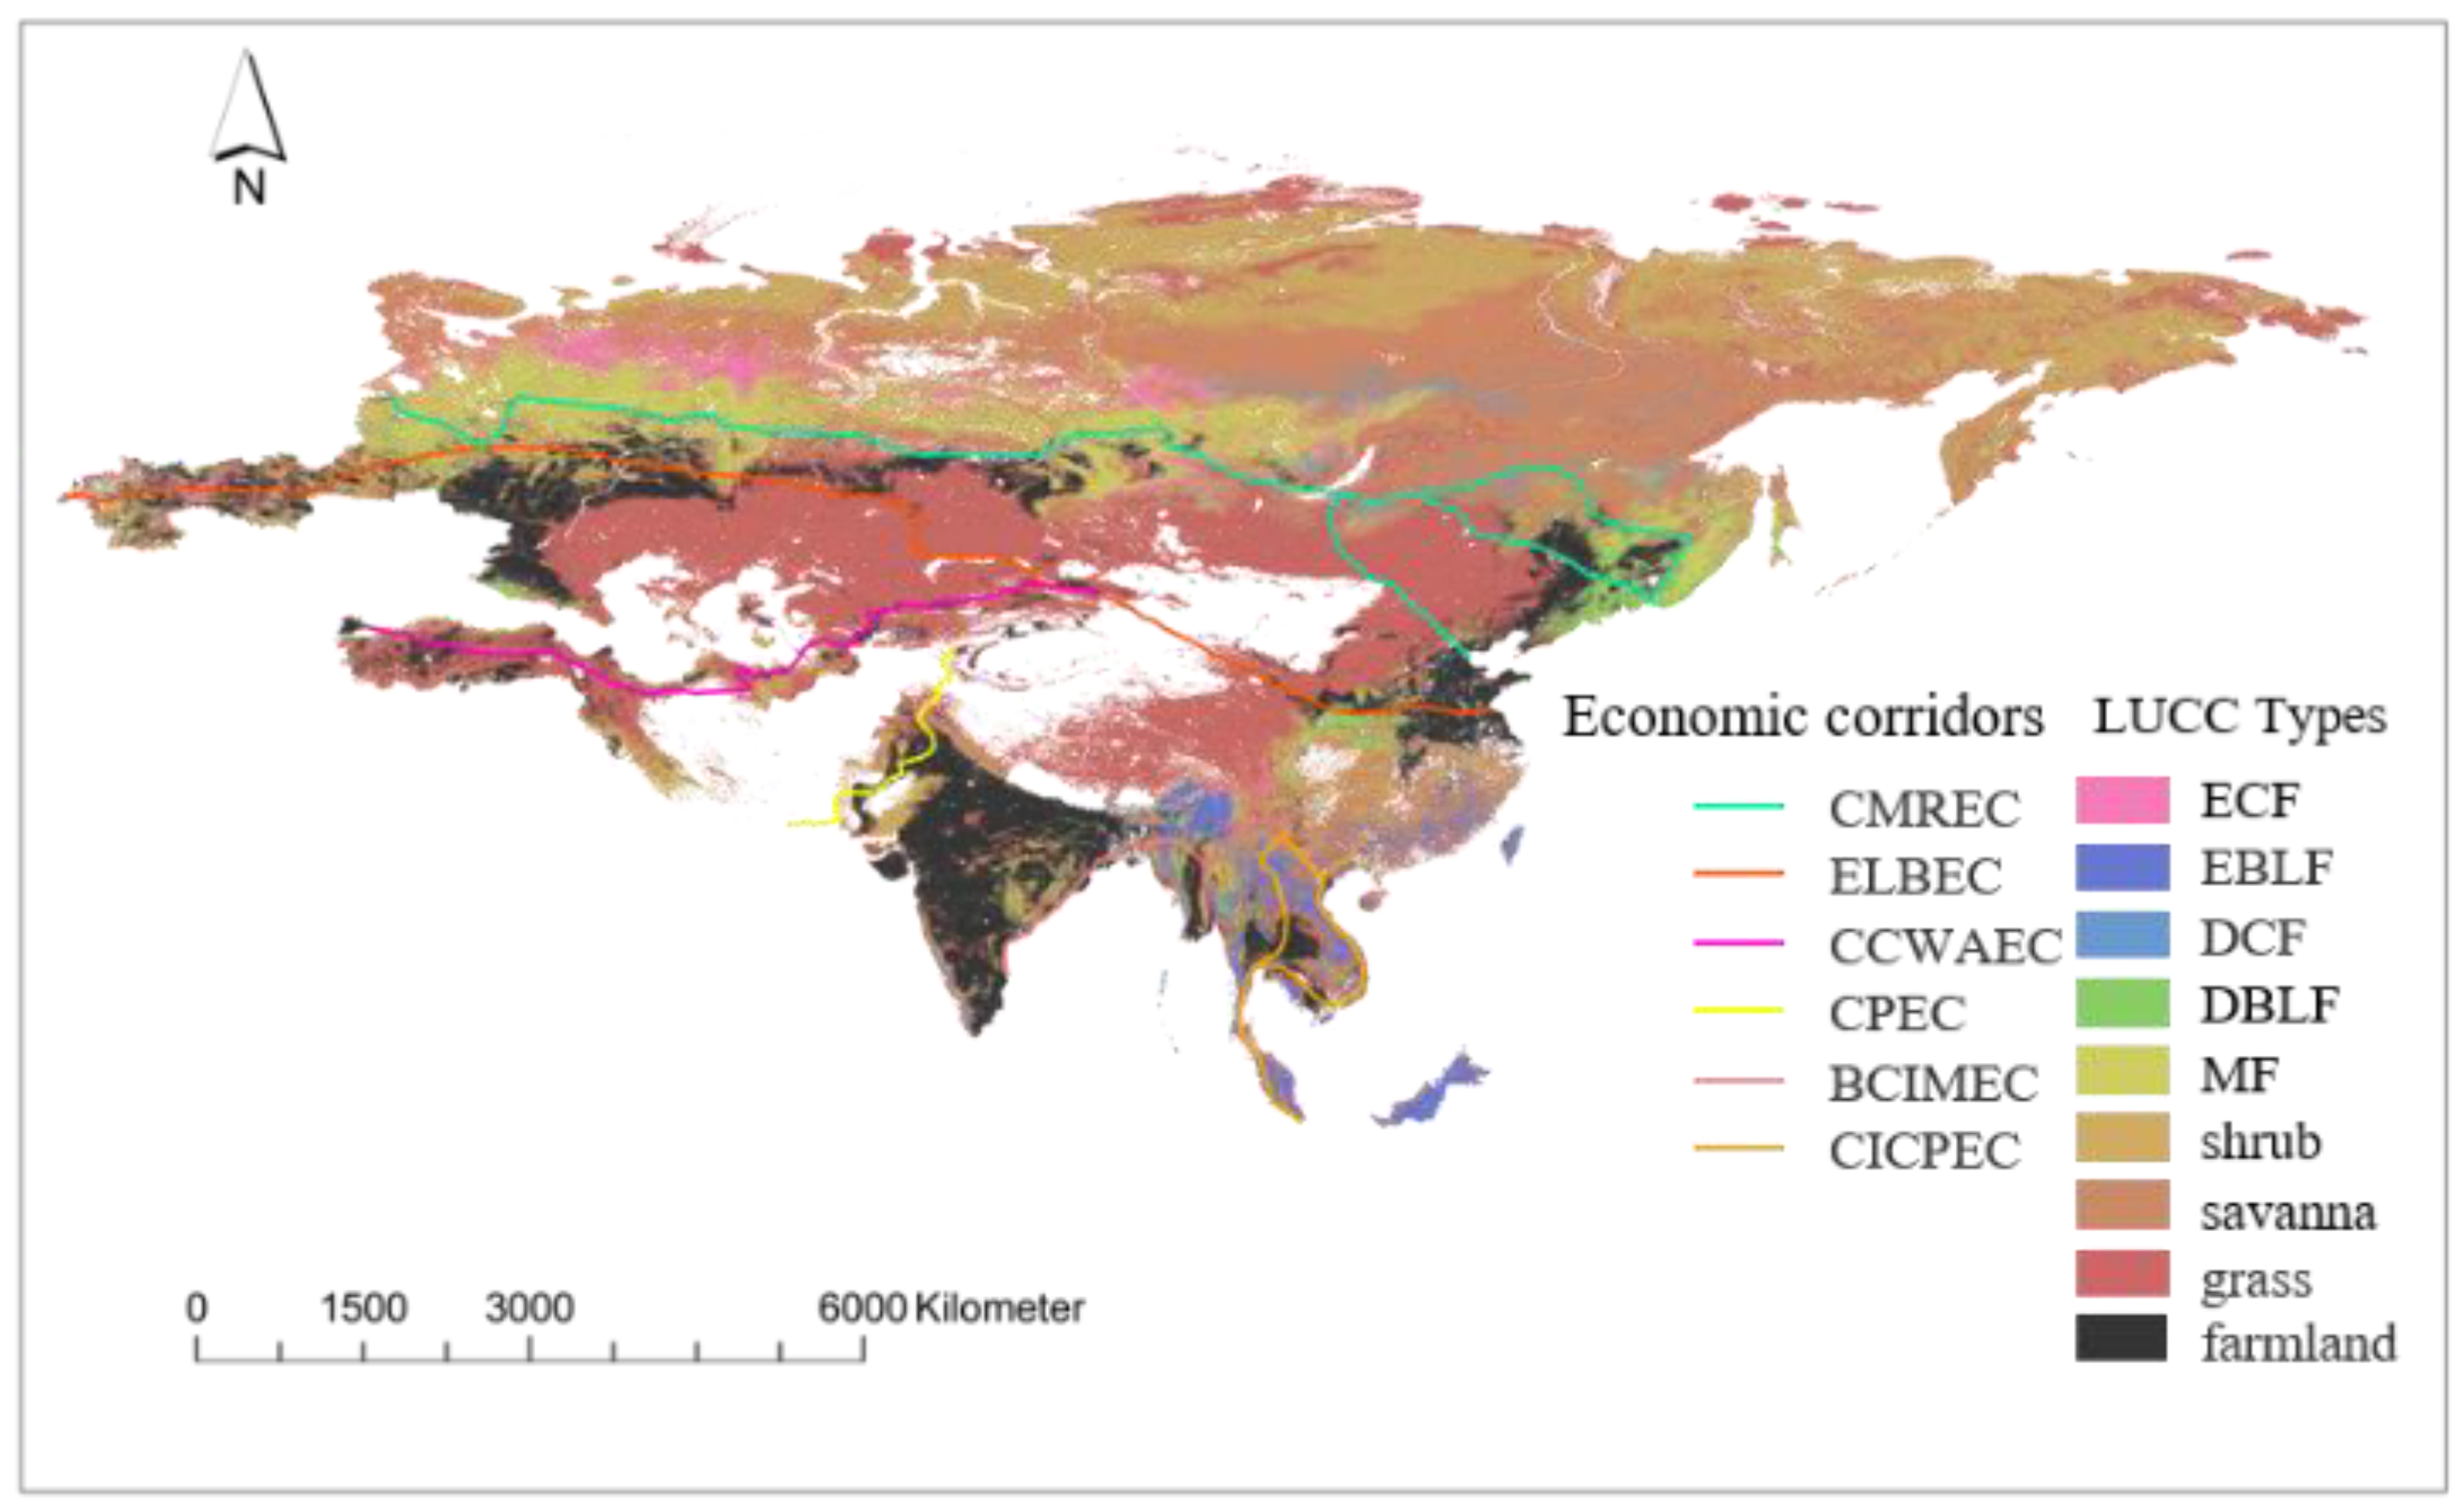
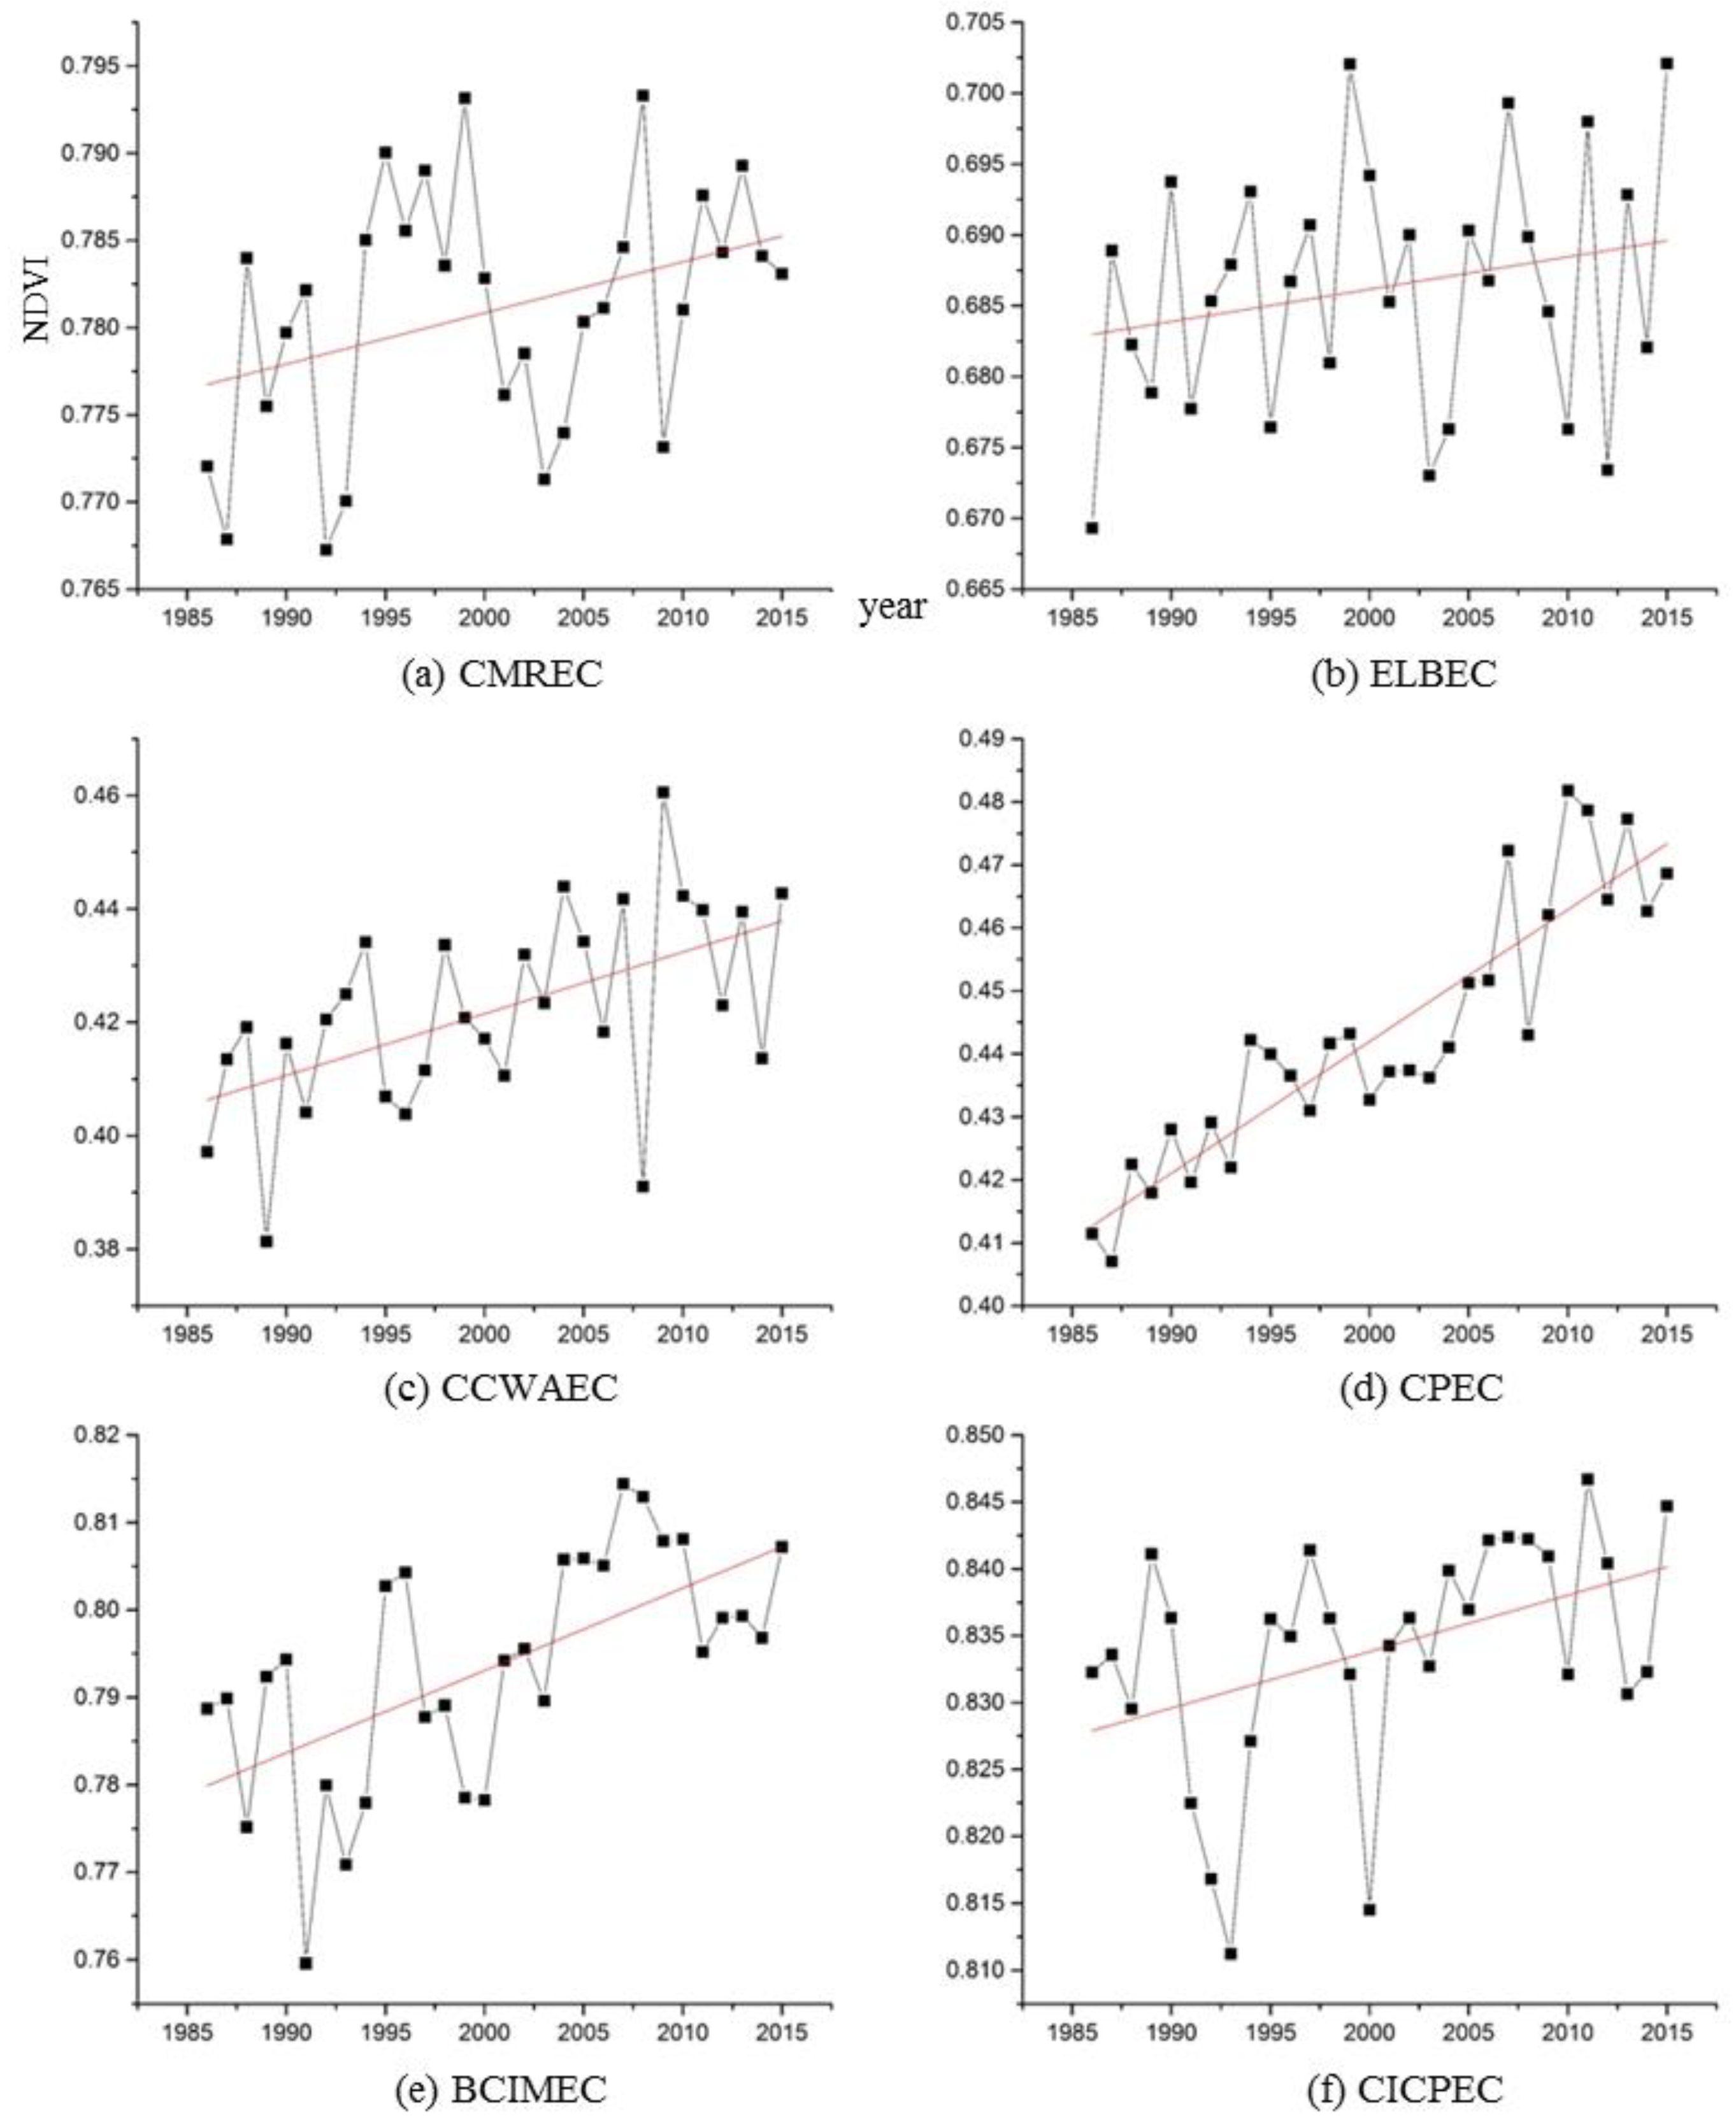
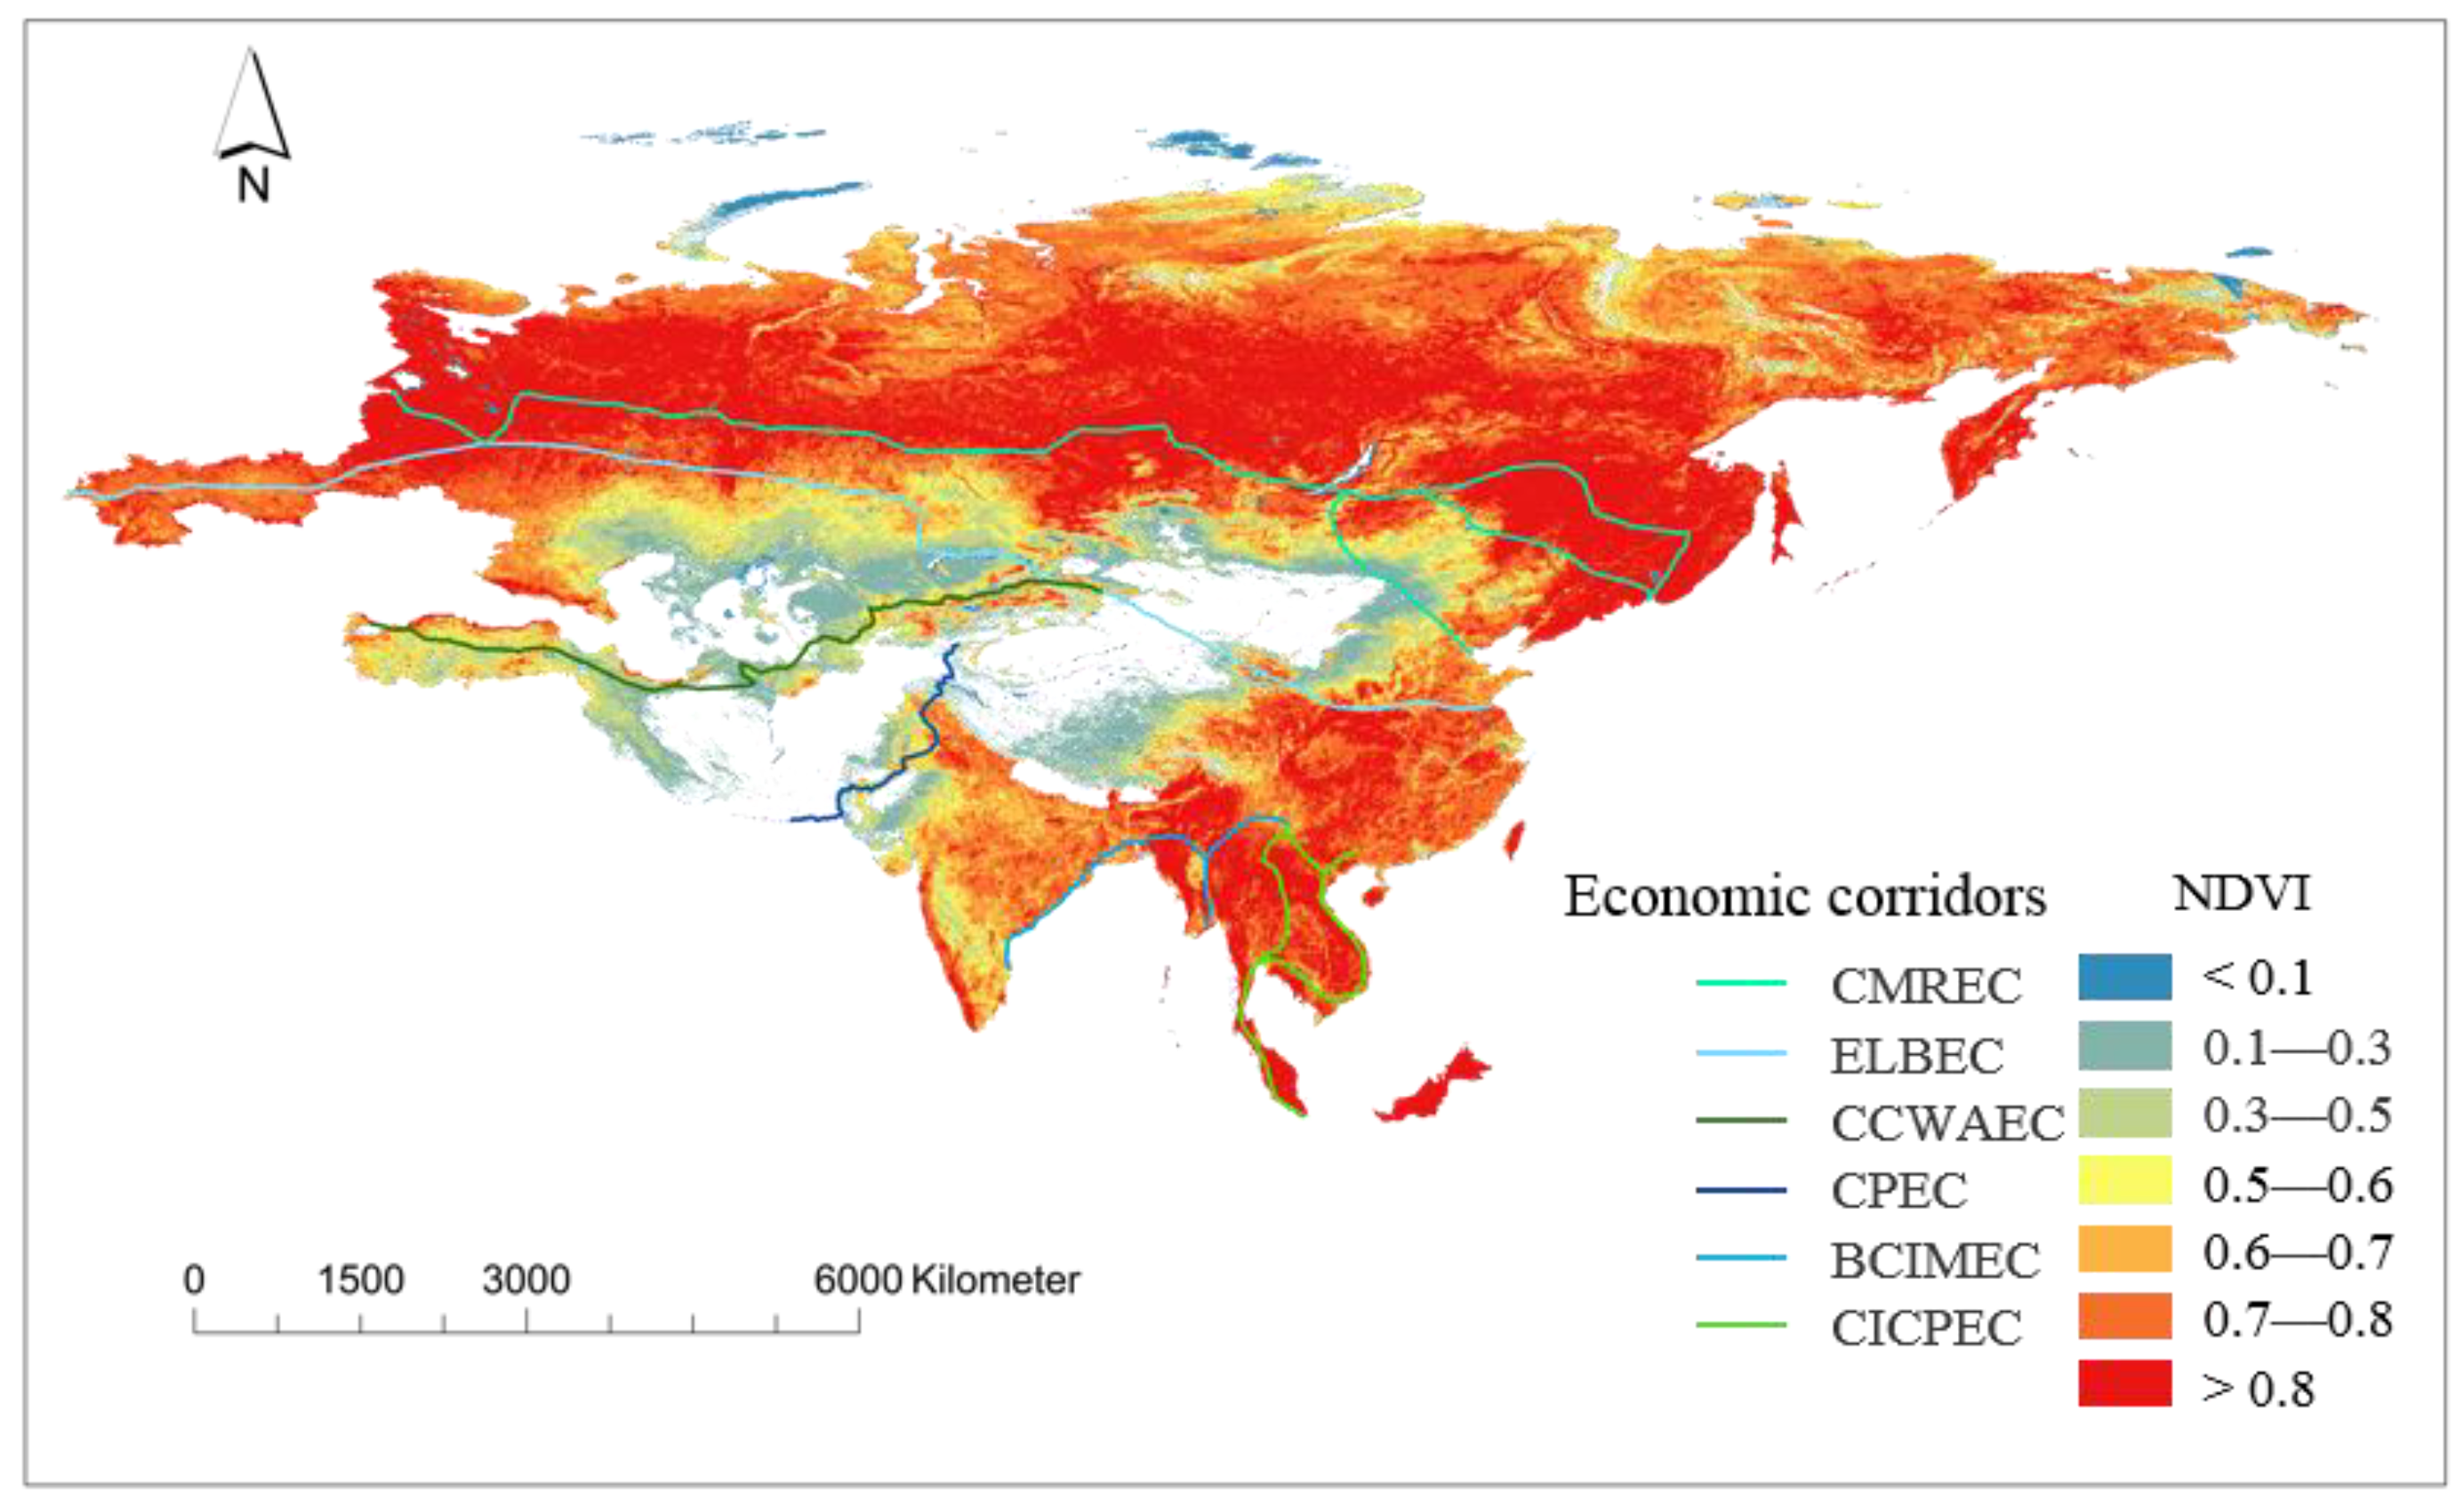
The vegetation coverage in the study area is generally good, with high-value areas having an average annual NDVI greater than 0.8 accounting for 35.1% of the total, which is the largest proportion. The area with an annual average NDVI greater than 0.7 and less than 0.8 accounted for 23.1%, while the area with an annual average NDVI greater than 0.5 and less than 0.7 accounted for 25.3%. Only 16.5% of the area had an annual average NDVI less than 0.5. However, there are significant regional differences in vegetation coverage, with Southeast Asia having the best coverage and mostly averaging above 0.8 in terms of annual NDVI; Central Asia and West Asia have the worst coverage, with most areas averaging below 0.5 annually. Specifically, the China–Indochina Peninsula Economic Corridor has the best vegetation coverage, with an average NDVI of 0.83; followed by the Bangladesh–China–India–Myanmar Economic Corridor at a mean NDVI of 0.79; then by the China–Mongolia–Russia Economic Corridor at a mean NDVI of 0.78; New Eurasian Continental Bridge Economic Corridor at a mean NDVl of 0.69; finally, the China–Pakistan Economic Corridor and China–Central Asia–West Asia Economic Corridor have particularly poor vegetation coverage, averaging only 0.44 and 0.42, respectively, in terms of their annual NDVI values.
(2)
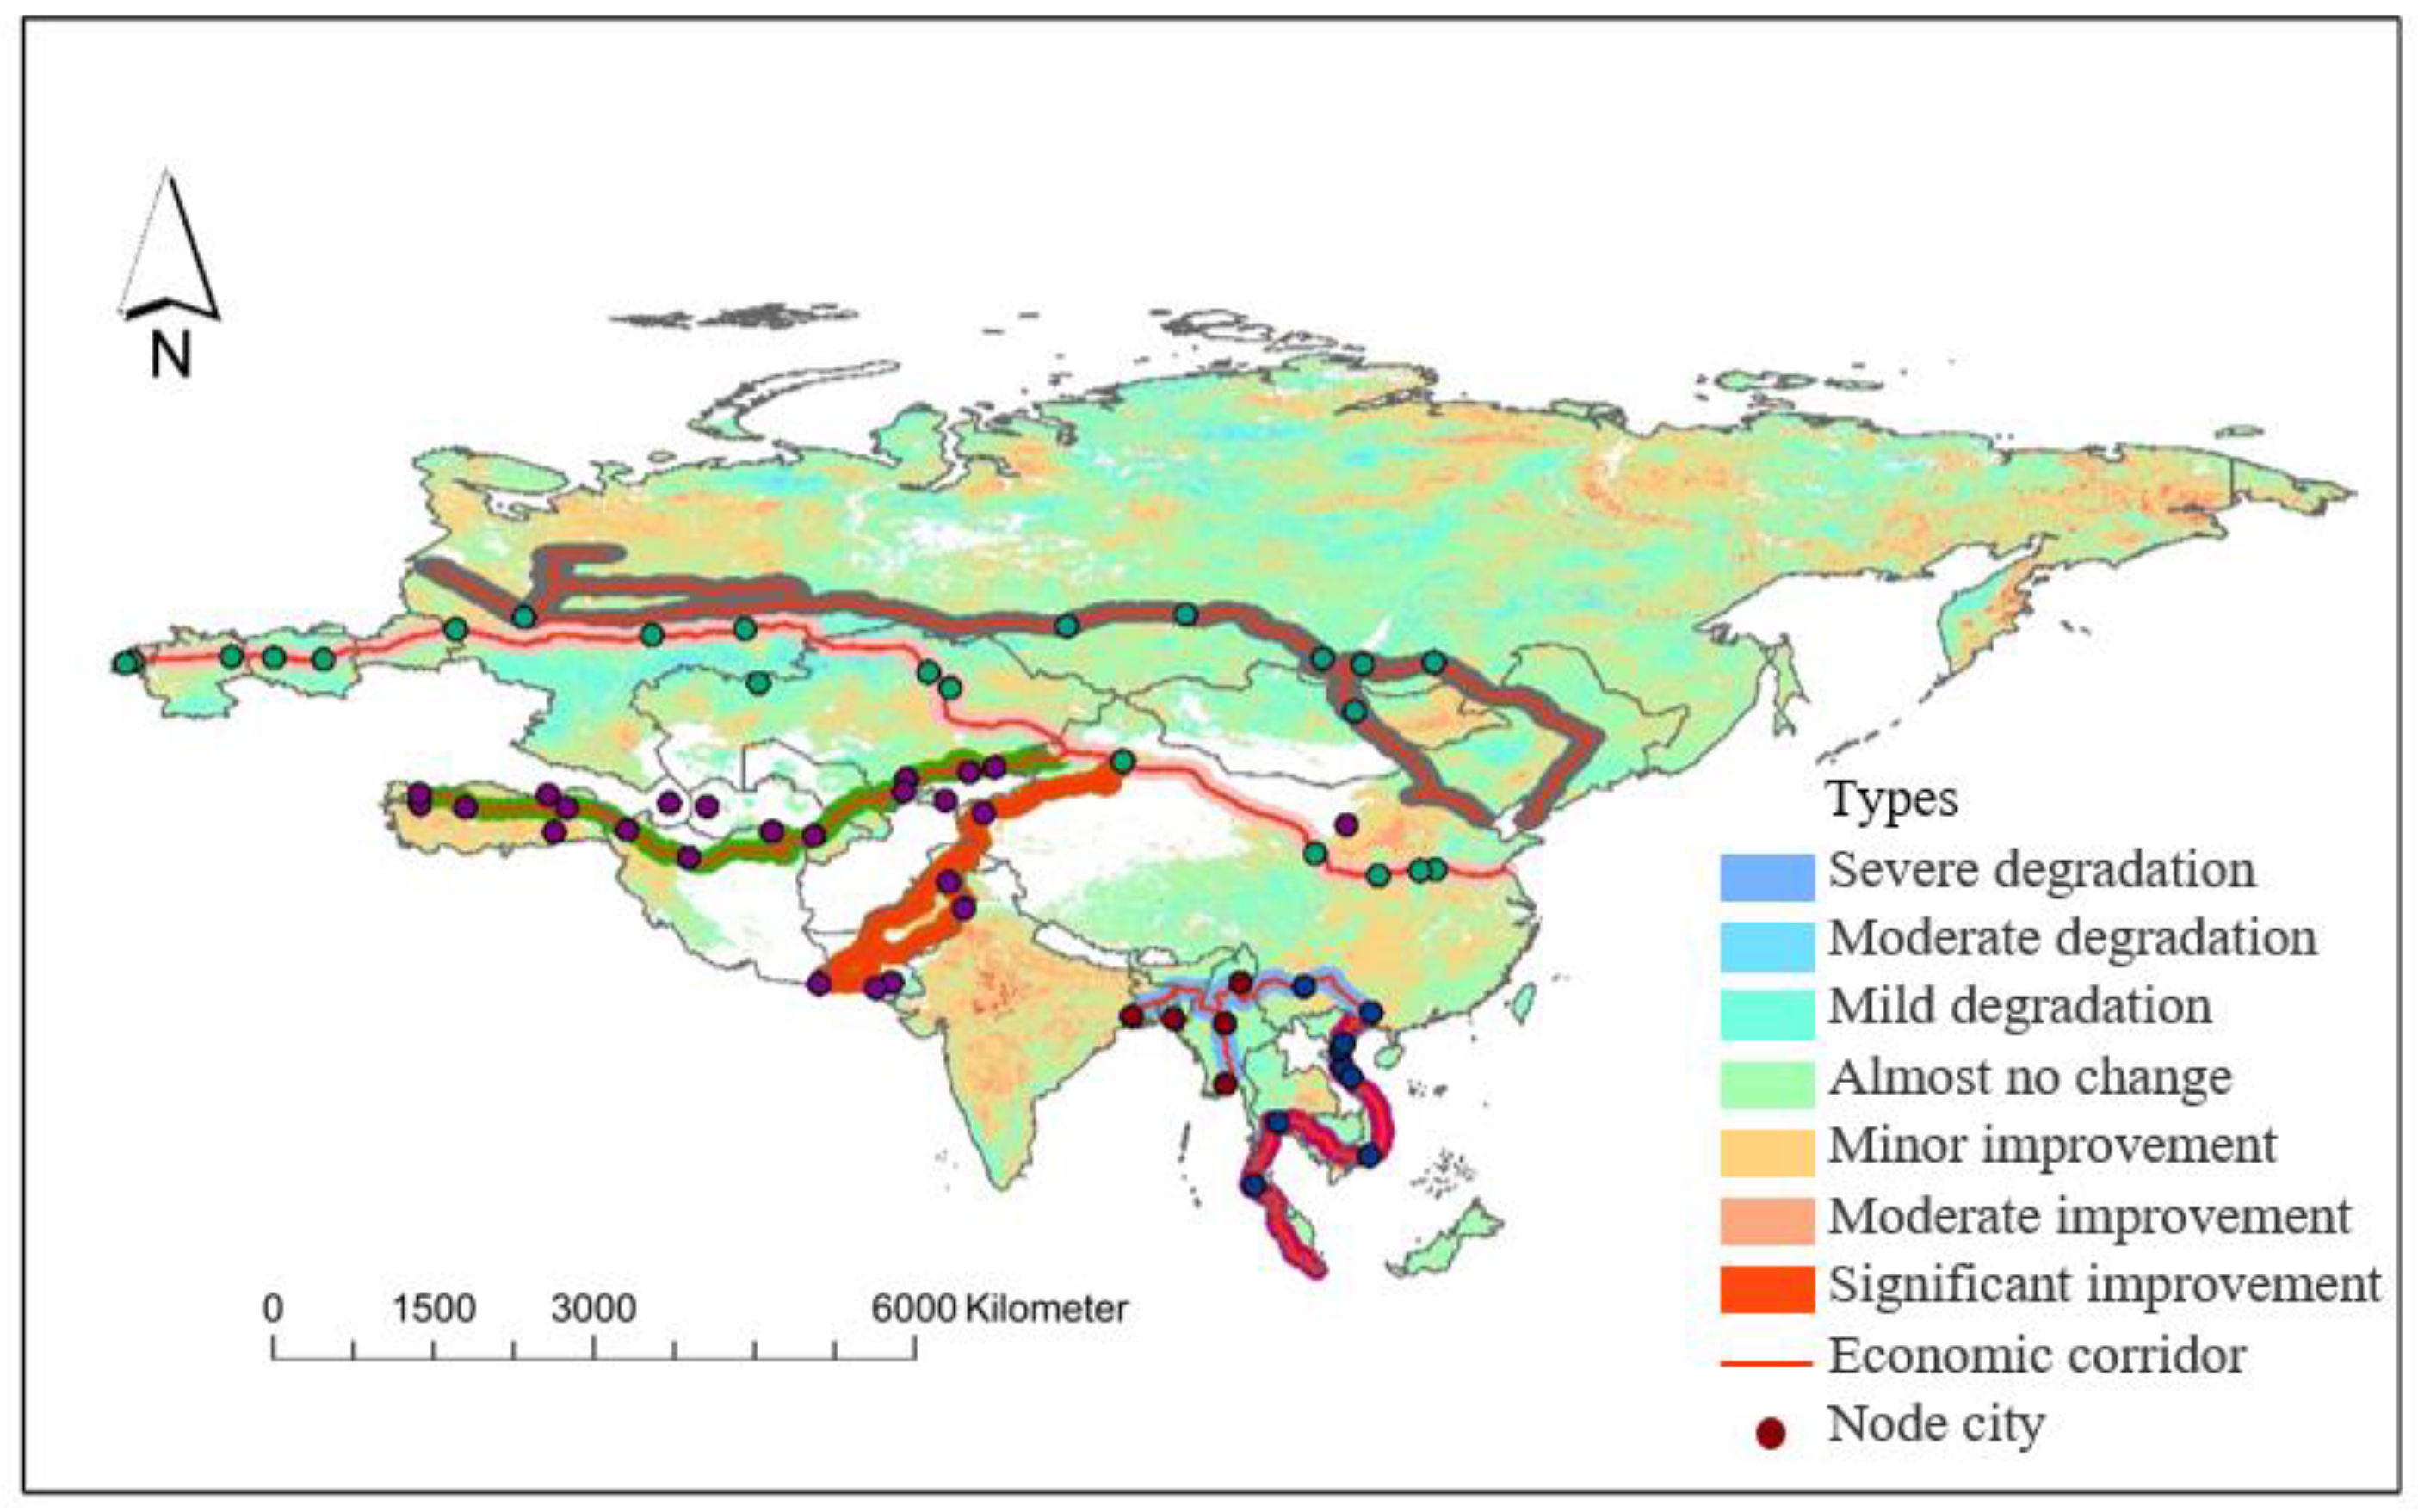
The majority of the area exhibited relatively stable vegetation coverage, representing the largest proportion at 40.1%. Approximately 39.6% of the regions displayed varying degrees of improvement, with the most significant enhancements observed in South Asia, southeastern China, and high latitude Siberia. Conversely, 20.3% of the area showed a trend of degradation, with Southeast Asia experiencing a slight decline in vegetation coverage. The China–Mongolia–Russia Economic Corridor and the New Eurasian Continental Bridge Economic Corridor demonstrated a slight improvement trend. The vegetation cover in the China–Central Asia–West Asia Economic Corridor, the Bangladesh–China–India–Myanmar Economic Corridor, and the China–Indochina Peninsula Economic Corridor exhibited a slight fluctuation increase. Notably, the most pronounced improvement in vegetation cover was observed in the China–Pakistan Economic Corridor.
(3)
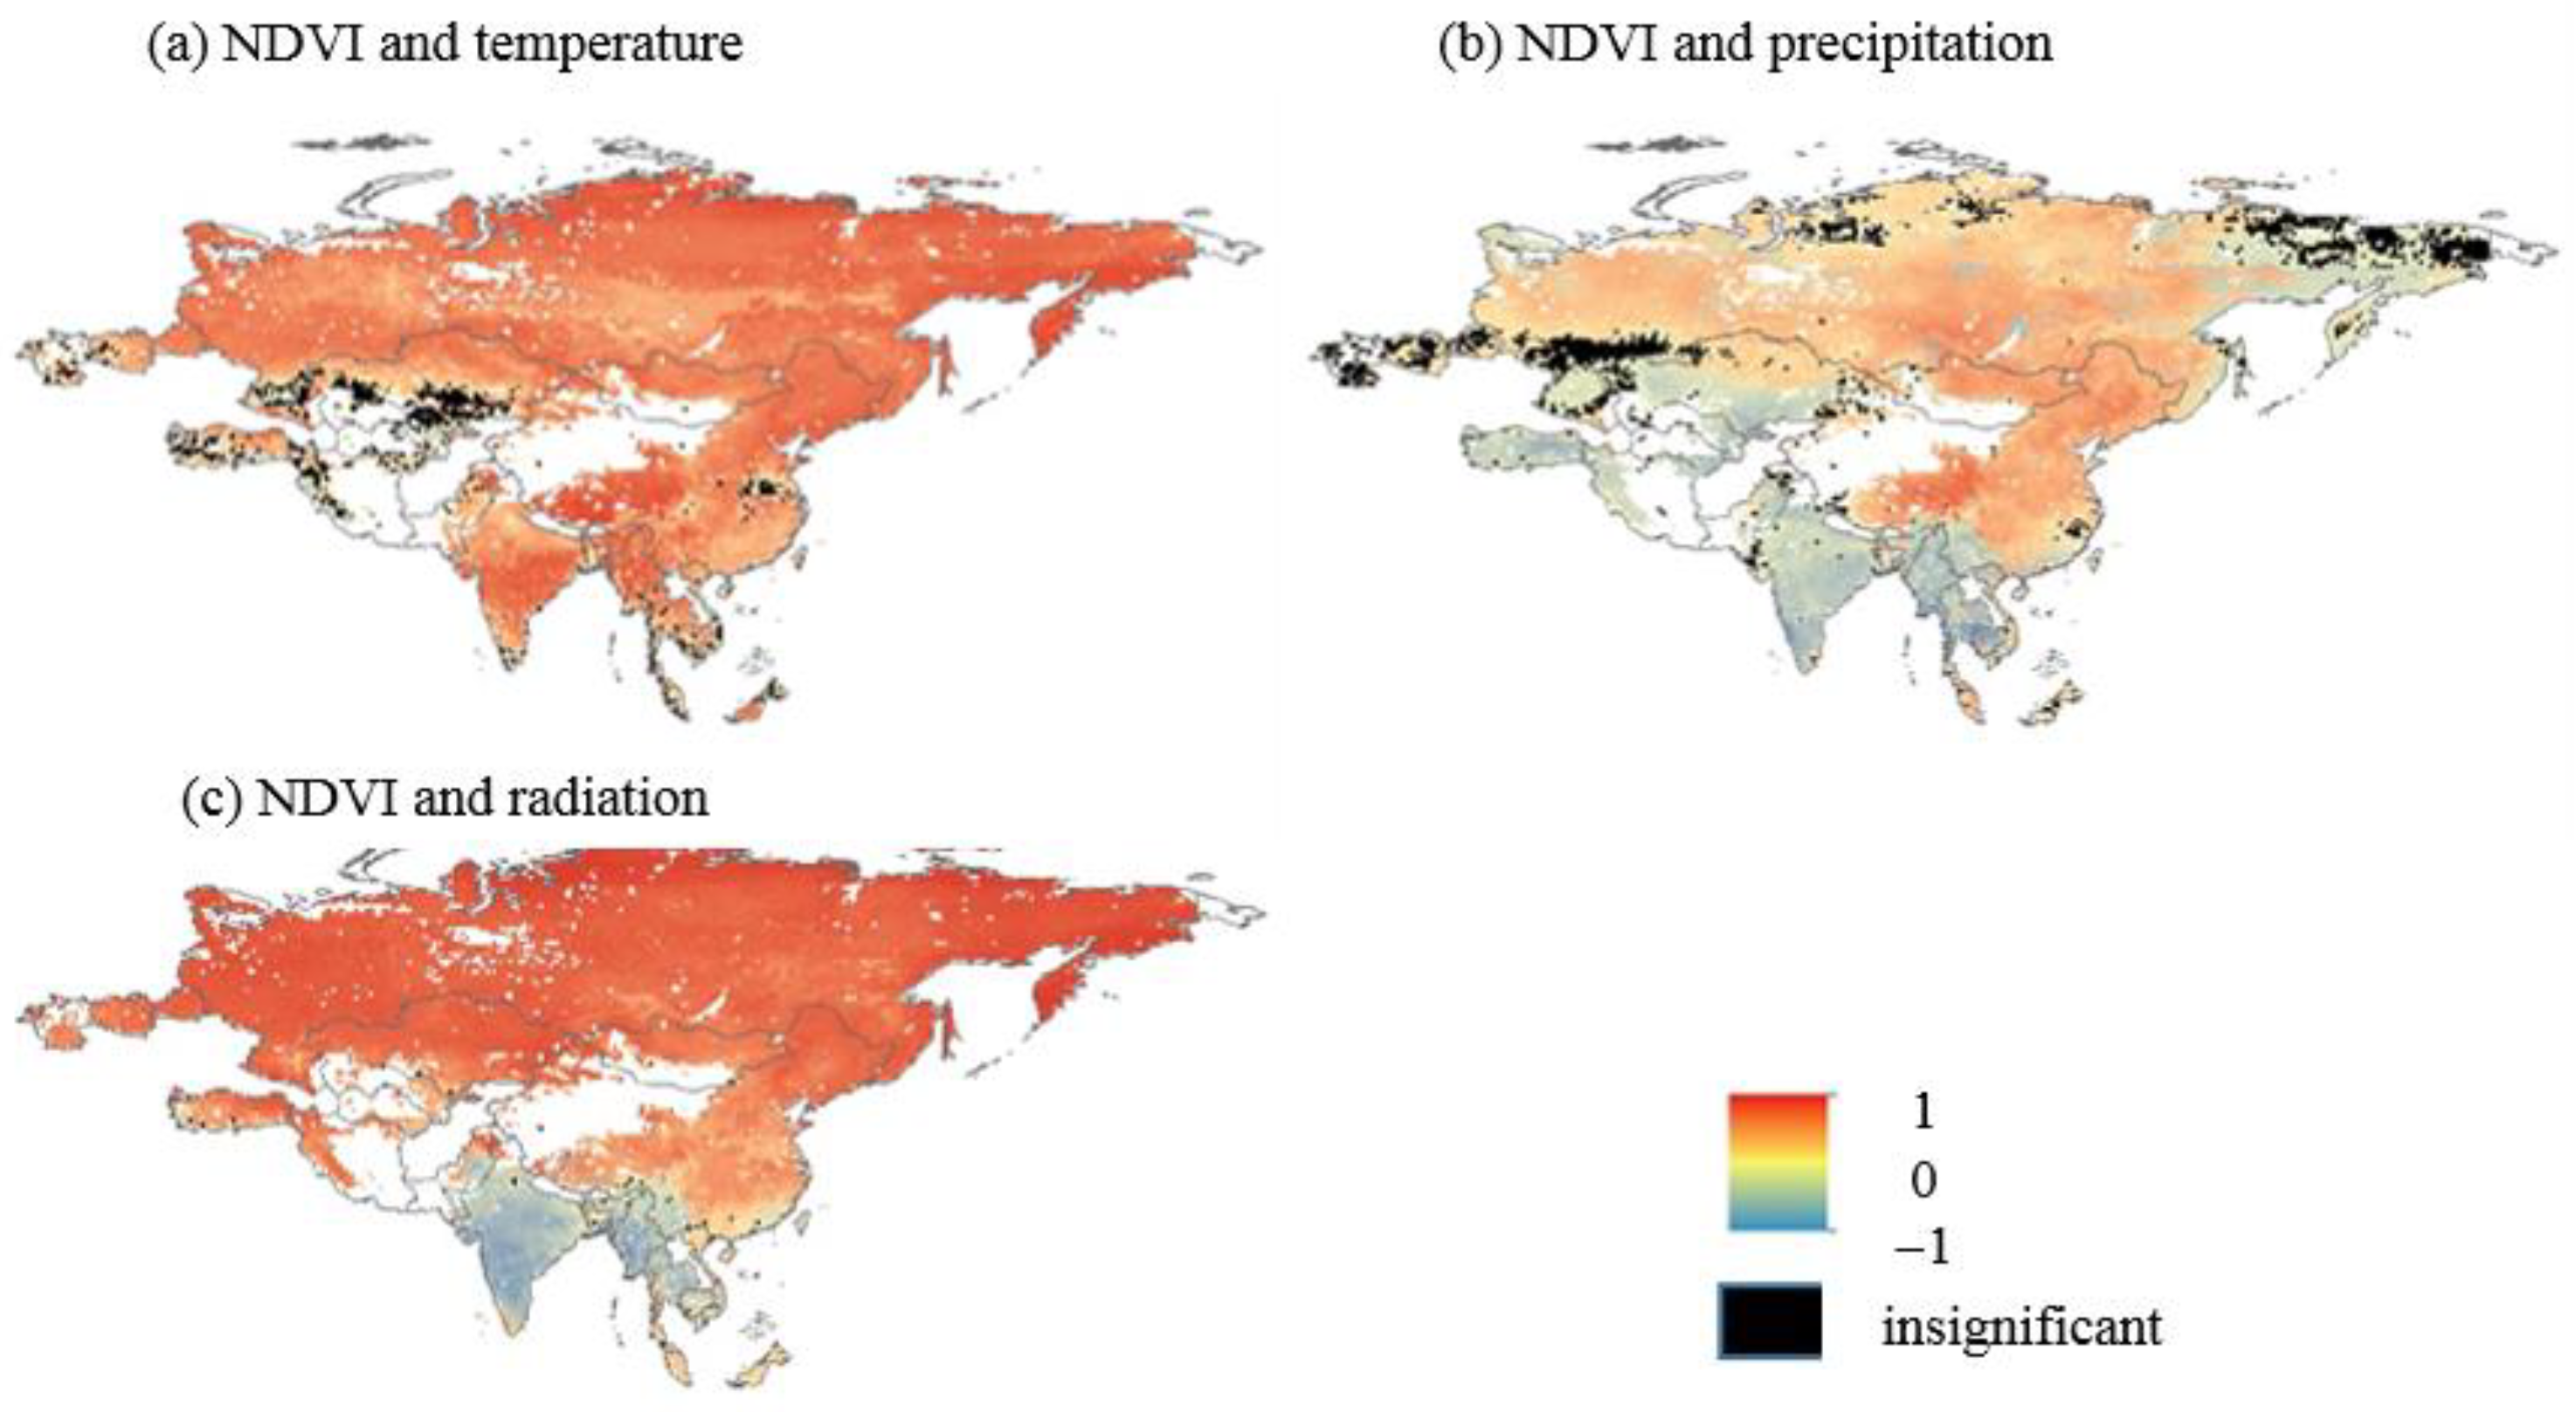
In regions with high latitudes, vegetation growth is influenced by air temperature, precipitation, and radiation, with precipitation having a relatively weaker impact compared to air temperature and radiation. In South Asia and Southeast Asia, vegetation growth is negatively associated with precipitation and radiation, while positively correlated with air temperature. Central Asia and West Asia exhibit a weak negative correlation with precipitation and a weak positive correlation with radiation, with most temperature data not meeting significance thresholds. Evergreen coniferous forests are predominantly found in high-altitude areas of middle latitudes, where temperature and radiation are the primary stressors affecting growth, with average partial correlation coefficients of 0.37 and 0.60, respectively, and limited sensitivity to precipitation changes. Deciduous coniferous forests, prevalent in high-latitude regions, are primarily driven by radiation and air temperature, with average partial correlation coefficients of 0.70 and 0.51, respectively. Precipitation also influences the growth of deciduous coniferous forests, with an average partial correlation coefficient of 0.36. Evergreen broad-leaved forests, found in tropical rainforests in low-lying areas, experience inhibited growth with increased precipitation, indicated by an average partial correlation coefficient of −0.21. Deciduous broad-leaved forests and mixed forests face combined stress from air temperature, precipitation, and radiation. Further analysis of urban areas along these lines reveals that factors influencing changes in urban vegetation cover include meteorological conditions as well as human activities.
(4)
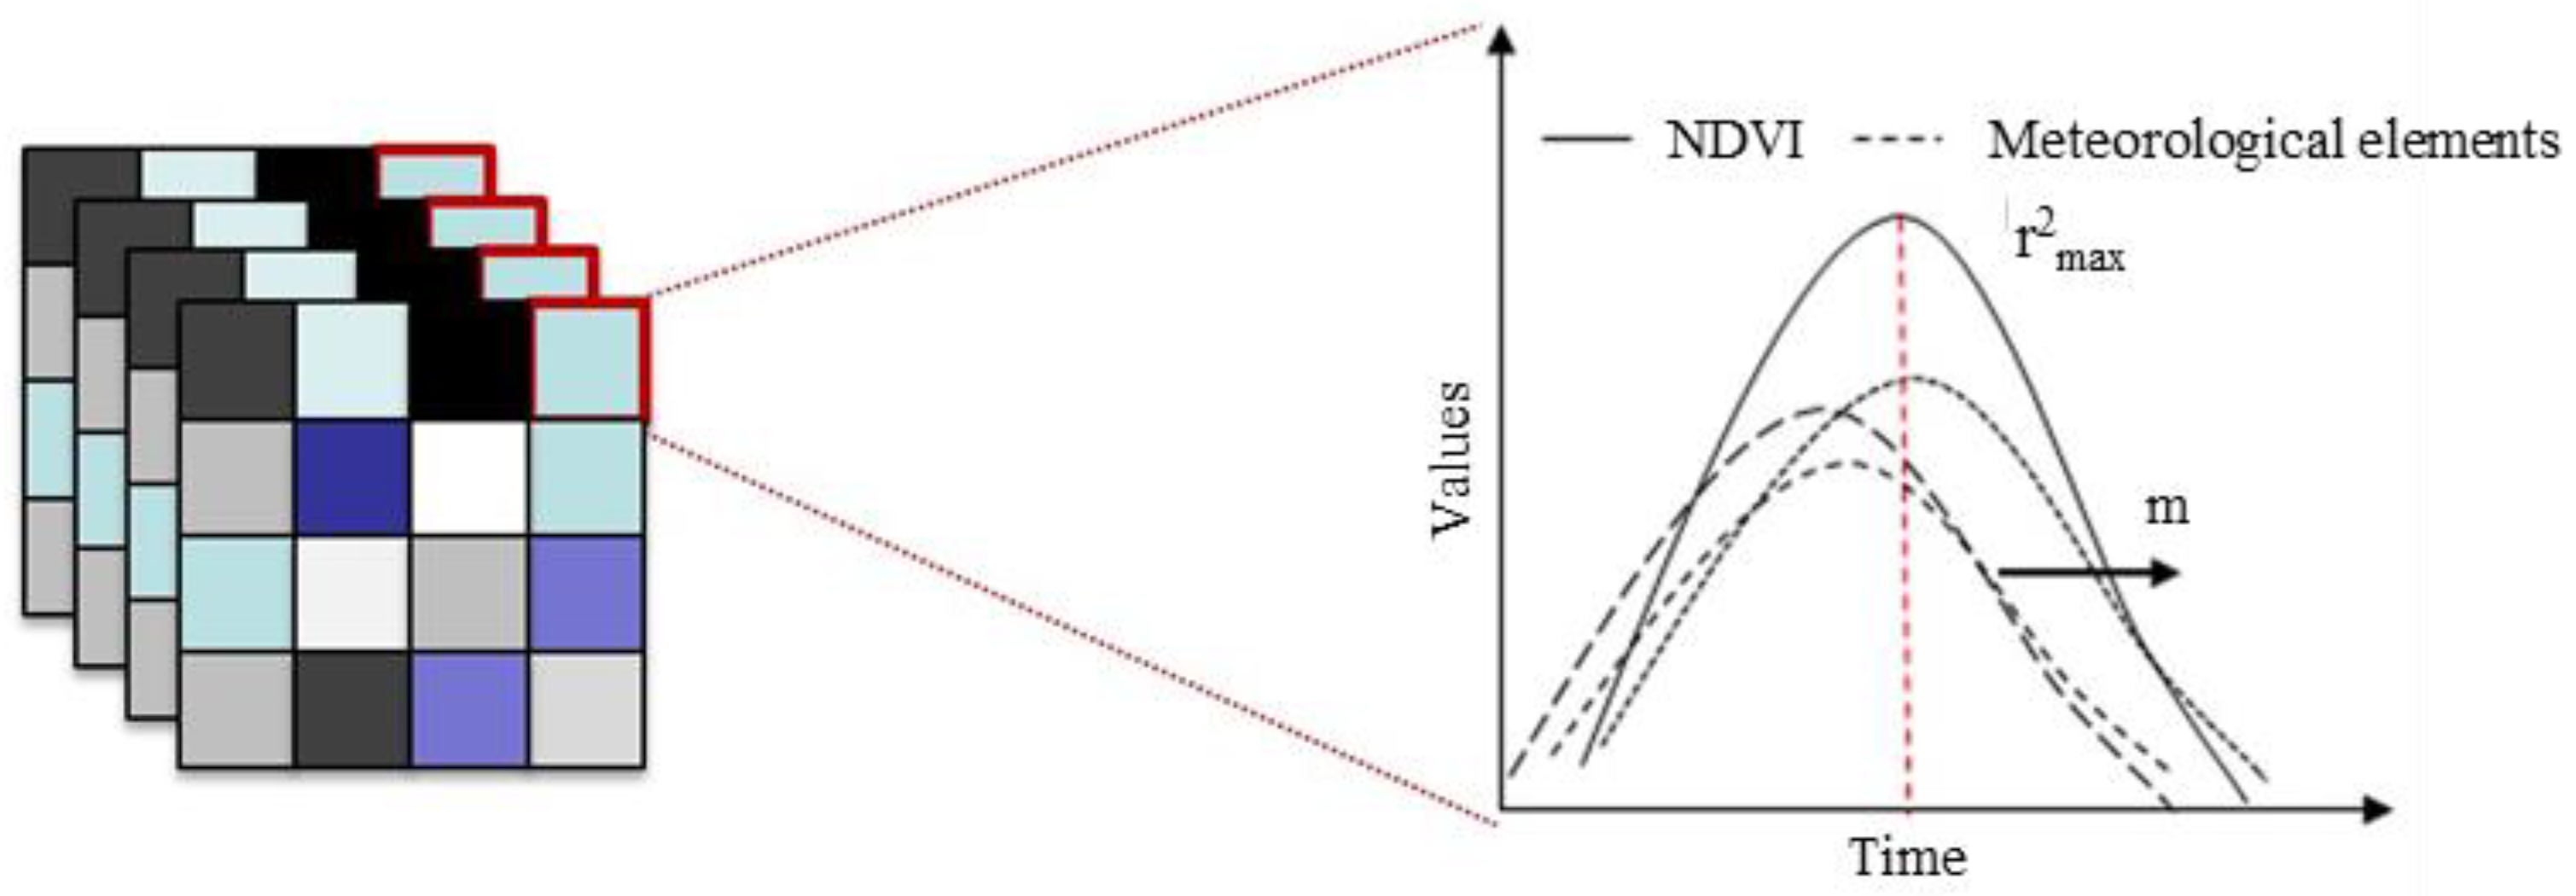
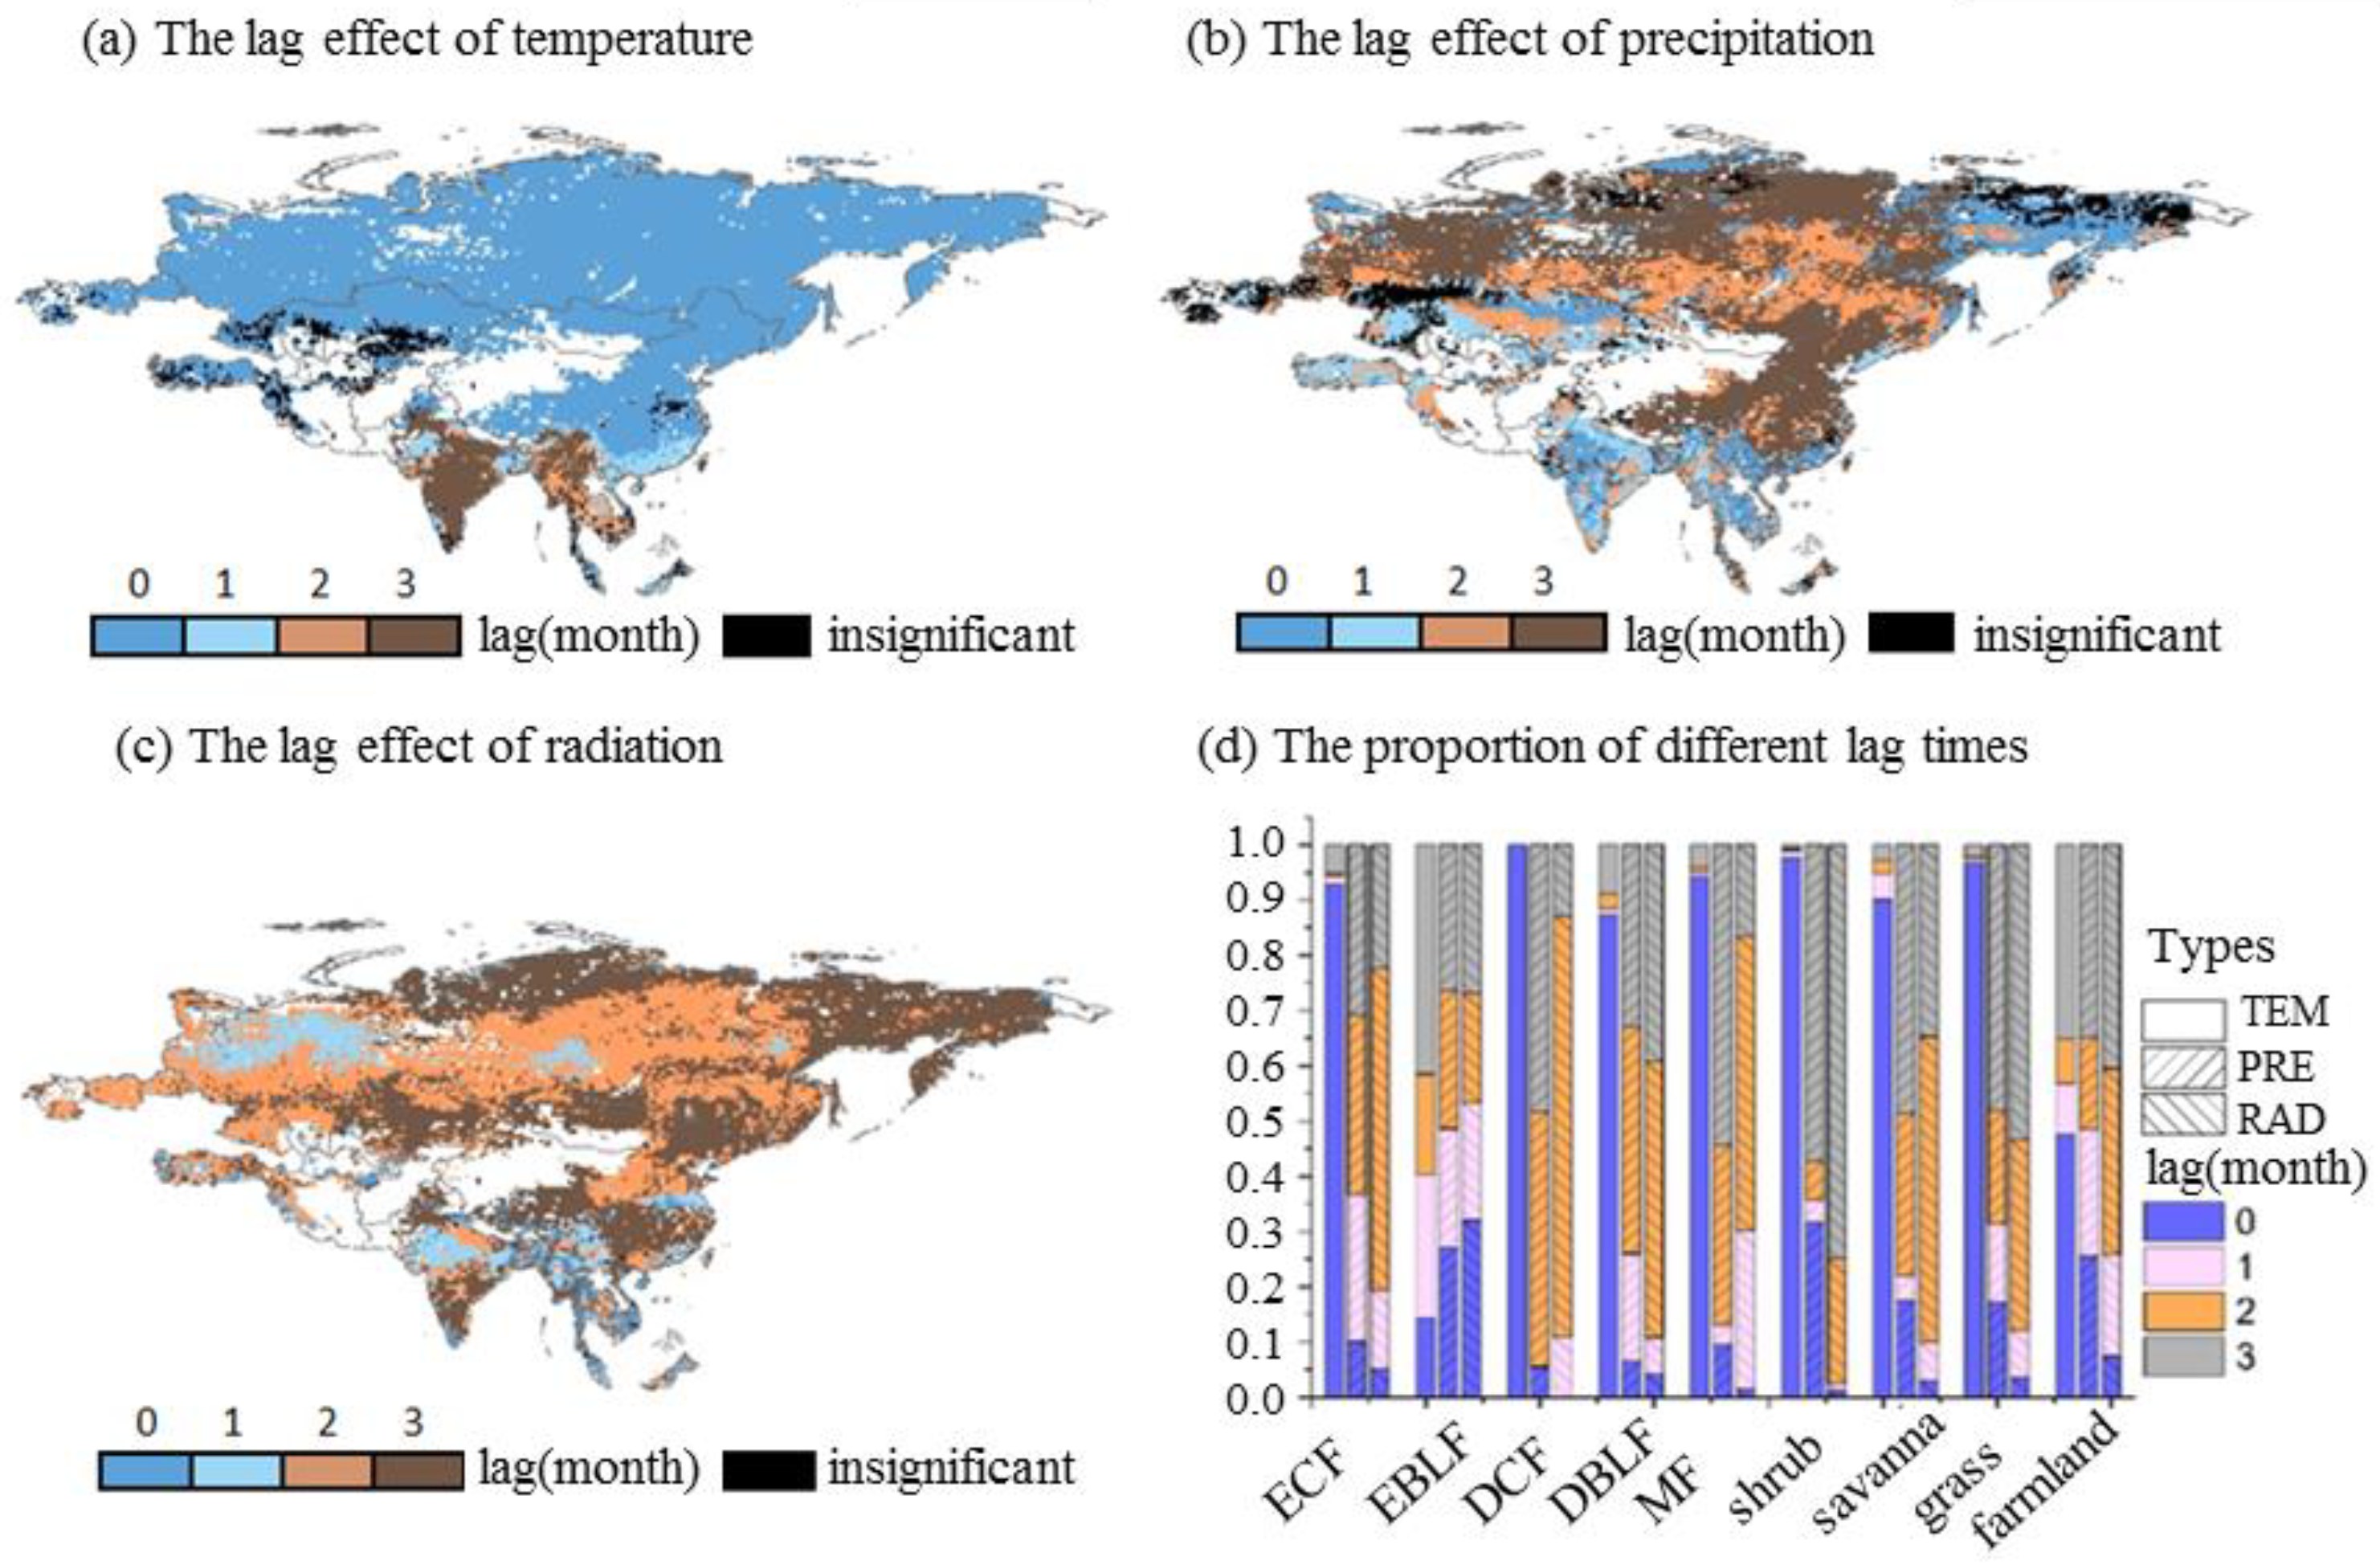
The response of the same vegetation type to different meteorological elements is different, and the response of different vegetation types to the same meteorological elements is also different. With the exception of evergreen broad-leaved forests, most forest ecosystems do not exhibit a hysteresis effect on air temperature. On average, the response of evergreen broad-leaved forests to air temperature lags behind by 1.9 months. Similarly, farmland typically shows a lagged response to air temperature, with an average delay of 1.3 months. In terms of precipitation, most forest ecosystems demonstrate a prolonged time lag in their response. Deciduous coniferous forests, for example, exhibit an average time lag of 2.4 months in response to precipitation, while deciduous broad-leaved forests and mixed forests show average delays of 2 and 2.3 months, respectively. Furthermore, the response of deciduous broad-leaved forests, mixed forests, and shrub forests to radiation is delayed by an average of 2.2, 1.9, and 2.7 months, respectively. Grasslands exhibit a response lag of 2.4 months to radiation. In contrast, evergreen broad-leaved forests show a relatively shorter response lag to radiation, with an average delay of 1.4 months.

Author Contributions

Conceptualization, X.Z. and J.Y.; methodology, X.Z. and J.Y.; software, H.A. and X.Z.; validation, H.A. and J.Y.; formal analysis, J.Y.; investigation, H.A.; resources, H.A.; data curation, X.Z.; writing—original draft preparation, X.Z. and J.Y.; writing—review and editing, H.A. and J.Y.; visualization, J.Y.; supervision, X.Z.; project administration, H.A.; funding acquisition, H.A. All authors have read and agreed to the published version of the manuscript.

Funding

This research was funded by the Postdoctoral Fellowship Program of CPSF (Grant No. GZC20232570).

Institutional Review Board Statement

Not applicable.

Informed Consent Statement

Not applicable.

Data Availability Statement

Data are contained within the article.

Acknowledgments

We thank the anonymous reviewers for their valuable comments.

Conflicts of Interest

The authors declare no conflict of interest.

References

  1. Walther, G.R.; Post, E.; Convey, P.; Menzel, A.; Parmesan, C.; Beebee, T.J.; Fromentin, J.M.; Hoegh-Guldberg, O.; Bairlein, F. Ecological responses to recent climate change. Nature 2002, 416, 389–395. [Google Scholar] [CrossRef] [PubMed]
  2. Walker, B.; Steffen, W.; Bondeau, A.; Bugmann, H.; Campbell, B.M.; Canadell, F.; Chapin, T.; Cramer, W.; Ehleringer, J.; Elliott, T.; et al. The Terrestrial Biosphere and Global Change: Implications for Natural and Managed Ecosystems. Q. Rev. Biol. 1997, 400, 522–523. [Google Scholar] [CrossRef]
  3. Parmesan, C.; Yohe, G. A globally coherent fingerprint of climate change impacts across natural systems. Nature 2003, 421, 37–42. [Google Scholar] [CrossRef] [PubMed]
  4. Naiqing, P.; Xiaoming, F.; Bojie, F.; Shuai, W.; Fei, J.; Shufen, P. Increasing global vegetation browning hidden in overall vegetation greening: Insights from time-varying trends. Remote Sens. Environ. 2018, 214, 59–72. [Google Scholar]
  5. Clement, A.; Anja, K.; Matteo, M.; Francesco, V. Phenological Metrics Derived over the European Continent from NDVI3g Data and MODIS Time Series. Remote Sens. 2013, 6, 257. [Google Scholar] [CrossRef]
  6. Menzel, A.; Fabian, P. Growing season extended in Europe. Nature 1999, 397, 659. [Google Scholar] [CrossRef]
  7. Gao, J.; Jiao, K.; Wu, S.; Ma, D.; Zhao, D.; Yin, Y.; Dai, E. Past and future effects of climate change on spatially heterogeneous vegetation activity in China. Earth’s Future 2017, 5, 679–692. [Google Scholar] [CrossRef]
  8. Jingyun, F.; Yongchang, S.; Hongyan, L.; Shilong, P. Vegetation-climate relationship and its application in the division of vegetation zone in China. Acta Bot. Sin. 2002, 44, 1105–1122. [Google Scholar]
  9. Levine, J.M. A trail map for trait-based studies. Nature 2016, 529, 163–164. [Google Scholar] [CrossRef]
  10. Huete, A. Vegetation’s responses to climate variability. Nature 2016, 531, 181–182. [Google Scholar] [CrossRef]
  11. Wu, D.; Zhao, X.; Liang, S.; Zhou, T.; Huang, K.; Tang, B.; Zhao, W. Time-lag effects of global vegetation responses to climate change. Glob. Chang. Biol. 2015, 21, 3520–3531. [Google Scholar] [CrossRef] [PubMed]
  12. Jong, R.D.; Bruin, S.D.; Wit, A.D.; Schaepman, M.E.; Dent, D.L. Analysis of monotonic greening and browning trends from global NDVI time-series. Remote Sens. Environ. 2011, 115, 692–702. [Google Scholar] [CrossRef]
  13. Chu, H.; Venevsky, S.; Wu, C.; Wang, M. NDVI-based vegetation dynamics and its response to climate changes at Amur-Heilongjiang River Basin from 1982 to 2015. Sci. Total Environ. 2019, 650, 2051–2062. [Google Scholar] [CrossRef] [PubMed]
  14. Testa, S.; Mondino, E.C.B.; Pedroli, C. Correcting MODIS 16-day composite NDVI time-series with actual acquisition dates. Eur. J. Remote Sens. 2014, 47, 285–305. [Google Scholar] [CrossRef]
  15. Tang, Z.; Ma, J.; Peng, H.; Wang, S.; Wei, J. Spatiotemporal changes of vegetation and their responses to temperature and precipitation in upper Shiyang river basin. Adv. Space Res. 2017, 60, 969–979. [Google Scholar] [CrossRef]
  16. Li, S.; Zhang, Y.; Wang, C.; Wang, T.; Yan, J. Coupling effects of climate change and ecological restoration on vegetation dynamics in the Qinling-Huaihe region. Prog. Geogr 2021, 40, 1026–1036. [Google Scholar] [CrossRef]
  17. Lamchin, M.; Lee, W.-K.; Jeon, S.W.; Wang, S.W.; Lim, C.H.; Song, C.; Sung, M. Long-term trend and correlation between vegetation greenness and climate variables in Asia based on satellite data. Sci. Total Environ. 2018, 618, 1089–1095. [Google Scholar] [CrossRef] [PubMed]
  18. Beck, H.E.; McVicar, T.R.; van Dijk, A.I.; Schellekens, J.; de Jeu, R.A.; Bruijnzeel, L.A. Global evaluation of four AVHRR–NDVI data sets: Intercomparison and assessment against Landsat imagery. Remote Sens. Environ. 2011, 115, 2547–2563. [Google Scholar] [CrossRef]
  19. Chen, X.; Wu, D.; Huang, X.; Lv, F.; Brenner, M.; Jin, H.; Chen, F. Vegetation response in subtropical southwest China to rapid climate change during the Younger Dryas. Earth-Sci. Rev. 2020, 201, 103080. [Google Scholar] [CrossRef]
  20. He, B.; Chen, A.; Wang, H.; Wang, Q. Dynamic response of satellite-derived vegetation growth to climate change in the Three North Shelter Forest Region in China. Remote Sens. 2015, 7, 9998–10016. [Google Scholar] [CrossRef]
  21. Fan, Z.; Fan, B.; Yue, T. Terrestrial ecosystem scenarios and their response to climate change in Eurasia. Sci. China Earth Sci. 2019, 62, 1607–1618. [Google Scholar] [CrossRef]
  22. Chen, Z.; Wang, W.; Cescatti, A.; Forzieri, G. Climate-driven vegetation greening further reduces water availability in drylands. Glob. Chang. Biol. 2023, 29, 1628–1647. [Google Scholar] [CrossRef] [PubMed]
  23. Piao, S.; Fang, J.; Zhou, L.; Guo, Q.; Henderson, M.; Ji, W.; Li, Y.; Tao, S. Interannual variations of monthly and seasonal normalized difference vegetation index (NDVI) in China from 1982 to 1999. J. Geophys. Res. Atmos. 2003, 108. [Google Scholar] [CrossRef]
  24. Zhou, L.; Kaufmann, R.; Tian, Y.; Myneni, R.; Tucker, C. Relation between interannual variations in satellite measures of northern forest greenness and climate between 1982 and 1999. J. Geophys. Res. Atmos. 2003, 108, ACL 3-1–ACL 3-16. [Google Scholar] [CrossRef]
  25. Liang, S.; Yi, Q.; Liu, J. Vegetation dynamics and responses to recent climate change in Xinjiang using leaf area index as an indicator. Ecol. Indic. 2015, 58, 64–76. [Google Scholar]
  26. Jiang, P.; Ding, W.; Yuan, Y.; Ye, W.; Mu, Y. Interannual variability of vegetation sensitivity to climate in China. J. Environ. Manag. 2022, 301, 113768. [Google Scholar] [CrossRef] [PubMed]
  27. Sun, J.; Cheng, G.; Li, W.; Sha, Y.; Yang, Y. On the variation of NDVI with the principal climatic elements in the Tibetan Plateau. Remote Sens. 2013, 5, 1894–1911. [Google Scholar] [CrossRef]
  28. Zhao, M.-S.; Fu, C.-B.; Yan, X.-D. Study on the relationship between different ecosystems and climate in China using NOAA/AV HRR data. Acta Geogr. Sin. Chin. Ed. 2001, 56, 296–305. [Google Scholar]
  29. Sun, H.; Wang, C.; Niu, Z. Analysis of the vegetation cover change and the relationship between NDVI and environmental factors by using NOAA time series data. J. Remote Sens. 1998, 2, 210–216. [Google Scholar]
  30. Cui, L.; Shi, J.; Yang, Y.; Fan, W. Ten-day response of vegetation NDVI to the variations of temperature and precipitation in eastern China. Acta Geogr. Sin. 2009, 64, 850–860. [Google Scholar]
  31. Craine, J.M.; Nippert, J.B.; Elmore, A.J.; Skibbe, A.M.; Hutchinson, S.L.; Brunsell, N.A. Timing of climate variability and grassland productivity. Proc. Natl. Acad. Sci. USA 2012, 109, 3401–3405. [Google Scholar] [CrossRef] [PubMed]
  32. Wang, X.; Piao, S.; Ciais, P.; Li, J.; Friedlingstein, P.; Koven, C.; Chen, A. Spring temperature change and its implication in the change of vegetation growth in North America from 1982 to 2006. Proc. Natl. Acad. Sci. USA 2011, 108, 1240–1245. [Google Scholar] [CrossRef]
  33. Wang, H.; Li, Z.; Cao, L.; Feng, R.; Pan, Y. Response of NDVI of natural vegetation to climate changes and drought in China. Land 2021, 10, 966. [Google Scholar] [CrossRef]
  34. Chen, T.; De Jeu, R.A.M.; Liu, Y.Y.; van der Werf, G.; Dolman, A. Using satellite based soil moisture to quantify the water driven variability in NDVI: A case study over mainland Australia. Remote Sens. Environ. 2014, 140, 330–338. [Google Scholar] [CrossRef]
  35. Harris, I.P.; Jones, P.D.; Osborn, T.J.; Lister, D.H. Updated high-resolution grids of monthly climatic observations—The CRU TS3.10 Dataset. Int. J. Climatol. 2014, 34, 623–642. [Google Scholar] [CrossRef]
  36. Pinzon, J.E.; Tucker, C.J. A Non-Stationary 1981–2012 AVHRR NDVI3g Time Series. Remote Sens. 2014, 6, 6929–6960. [Google Scholar] [CrossRef]
  37. Yin, L.; Wang, X.; Feng, X.; Fu, B.; Chen, Y. A comparison of SSEBop-model-based evapotranspiration with eight evapotranspiration products in the Yellow River Basin, China. Remote Sens. 2020, 12, 2528. [Google Scholar] [CrossRef]
  38. Piao, S.; Nan, H.; Huntingford, C.; Ciais, P.; Friedlingstein, P.; Sitch, S.; Peng, S.; Ahlström, A.; Canadell, J.G.; Cong, N. Evidence for a weakening relationship between interannual temperature variability and northern vegetation activity. Nat. Commun. 2014, 5, 5018. [Google Scholar] [CrossRef]
  39. Friedl, M.A.; Mciver, D.K.; Hodges, J.C.F.; Zhang, X.Y.; Muchoney, D.; Strahler, A.H.; Woodcock, C.E.; Gopal, S.; Schneider, A.; Cooper, A. Global land cover mapping from MODIS: Algorithms and early results. Remote Sens. Environ. 2002, 83, 287–302. [Google Scholar] [CrossRef]
  40. Hou, W.; Gao, J.; Wu, S.; Dai, E. Interannual variations in growing-season NDVI and its correlation with climate variables in the southwestern karst region of China. Remote Sens. 2015, 7, 11105–11124. [Google Scholar] [CrossRef]
  41. Anderson, L.O.; Malhi, Y.; Aragão, L.E.O.C.; Ladle, R.; Arai, E.; Barbier, N.; Phillips, O. Remote sensing detection of droughts in Amazonian forest canopies. New Phytol. 2010, 187, 733–750. [Google Scholar] [CrossRef] [PubMed]
  42. Gessner, U.; Naeimi, V.; Klein, I.; Kuenzer, C.; Klein, D.; Dech, S. The relationship between precipitation anomalies and satellite-derived vegetation activity in Central Asia. Glob. Planet. Chang. 2013, 110, 74–87. [Google Scholar] [CrossRef]
  43. Mao, P.; Zhang, J.; Li, M.; Liu, Y.; Wang, X.; Yan, R.; Shen, B.; Zhang, X.; Shen, J.; Zhu, X. Spatial and temporal variations in fractional vegetation cover and its driving factors in the Hulun Lake region. Ecol. Indic. 2022, 135, 108490. [Google Scholar] [CrossRef]
  44. Hartfield, K.; Leeuwen, W.J.D.V.; Gillan, J.K. Remotely Sensed Changes in Vegetation Cover Distribution and Groundwater along the Lower Gila River. Land 2020, 9, 326. [Google Scholar] [CrossRef]
  45. Yan, J.; Zhang, G.; Ling, H.; Han, F. Comparison of time-integrated NDVI and annual maximum NDVI for assessing grassland dynamics. Ecol. Indic. 2022, 136, 108611. [Google Scholar] [CrossRef]
  46. Jeong, S.J.; Chang-Hoi, H.O.; Gim, H.J.; Brown, M.E. Phenology shifts at start vs. end of growing season in temperate vegetation over the Northern Hemisphere for the period 1982–2008. Glob. Chang. Biol. 2011, 17, 2385–2399. [Google Scholar] [CrossRef]
  47. Xia, N.; Li, M.; Cheng, L. Mapping Impacts of Human Activities from Nighttime Light on Vegetation Cover Changes in Southeast Asia. Land 2021, 10, 185. [Google Scholar] [CrossRef]
  48. Jiaoe, W.; Han, W.; Jingjuan, J. China’s international aviation transport to the Belt and Road Initiative area. Prog. Geogr. 2015, 34, 554–562. [Google Scholar]
  49. Yuqing, X.; Qiuju, M.; Yongping, S. The Year 2008: Global Warming Continued, Extreme Events Occurred Frequently. Adv. Clim. Chang. Res. 2009, 5, 56. [Google Scholar]
  50. Zheng, Z.; Jiahao, W.; Jing, Z. A spatial analysis of urban economic connections among the node cities along the “One Belt and One Road” in China. J. Arid Land Resour. Environ. 2018, 32, 12–18. [Google Scholar]
  51. Xinliang, X.U. Spatio-temporal characteristics of climate change in the Silk Road Economic Belt. Resour. Sci. 2016, 38, 80–86. [Google Scholar] [CrossRef]
  52. Chen, X.; Li, B.L. Global scale assessment of the relative contribution of climate and non-climate factors on annual vegetation change. Geofizika 2010, 27, 37–43. [Google Scholar]
  53. Zhou, D.; Zhao, S.; Liu, S.; Zhang, L. Spatiotemporal trends of terrestrial vegetation activity along the urban development intensity gradient in China’s 32 major cities. Sci. Total Environ. 2014, 488–489, 136–145. [Google Scholar] [CrossRef] [PubMed]
  54. Rundquist, B.C.; Harrington, J.A. The Effects of Climatic Factors on Vegetation Dynamics of Tallgrass and Shortgrass Cover. Geocarto Int. 2000, 15, 33–38. [Google Scholar] [CrossRef]
  55. Pei, Z.; Fang, S.; Yang, W.; Wang, L.; Khoi, D.N. The Relationship between NDVI and Climate Factors at Different Monthly Time Scales: A Case Study of Grasslands in Inner Mongolia, China (1982–2015). Sustainability 2019, 11, 7243. [Google Scholar] [CrossRef]
  56. Esteban, M. The China-Pakistan Corridor: A transit, economic or development corridor. Strateg. Stud. 2016, 36, 63–74. [Google Scholar]
  57. Kong, D.; Zhang, Q.; Singh, V.P.; Shi, P. Seasonal vegetation response to climate change in the Northern Hemisphere (1982–2013). Glob. Planet. Chang. 2017, 148, 1–8. [Google Scholar] [CrossRef]
  58. Daham, A.; Han, D.; Rico-Ramirez, M.; Marsh, A. Analysis of NVDI variability in response to precipitation and air temperature in different regions of Iraq, using MODIS vegetation indices. Environ. Earth Sci. 2018, 77, 389. [Google Scholar] [CrossRef]
  59. Guo, L.; Zuo, L.; Gao, J.; Jiang, Y.; Wu, S. Revealing the Fingerprint of Climate Change in Interannual NDVI Variability among Biomes in Inner Mongolia, China. Remote Sens. 2020, 12, 1332. [Google Scholar] [CrossRef]
  60. Peng, S.; Piao, S.; Ciais, P.; Myneni, R.B.; Chen, A.; Chevallier, F.; Dolman, A.J.; Janssens, I.A.; Peuelas, J.; Zhang, G. Asymmetric effects of daytime and night-time warming on Northern Hemisphere vegetation. Nat. Publ. Group 2013, 501, 88–92. [Google Scholar] [CrossRef]
  61. Peteet, D. Sensitivity and rapidity of vegetational response to abrupt climate change. Proc. Natl. Acad. Sci. USA 2000, 97, 1359–1361. [Google Scholar] [CrossRef] [PubMed]
  62. Bala, G. Combined climate and carbon-cycle effects of large-scale deforestation. Proc. Natl. Acad. Sci. USA 2007, 104, 6550–6555. [Google Scholar] [CrossRef] [PubMed]
  63. Zhang, Y.; Liang, S. Changes in forest biomass and linkage to climate and forest disturbances over Northeastern China. Glob. Chang. Biol. 2014, 20, 2596–2606. [Google Scholar] [CrossRef] [PubMed]
  64. Jiang, S.; Chen, X.; Smettem, K.; Wang, T. Climate and land use influences on changing spatiotemporal patterns of mountain vegetation cover in southwest China. Ecol. Indic. 2021, 121, 107193. [Google Scholar] [CrossRef]
  65. Krishnaswamy, J.; John, R.; Joseph, S. Consistent response of vegetation dynamics to recent climate change in tropical mountain regions. Glob. Change Biol 2014, 20, 203–215. [Google Scholar] [CrossRef] [PubMed]
  66. Wu, Y.; Yang, J.; Li, S.; Guo, C.; Yang, X.; Xu, Y.; Yue, F.; Peng, H.; Chen, Y.; Gu, L.; et al. NDVI-Based Vegetation Dynamics and Their Responses to Climate Change and Human Activities from 2000 to 2020 in Miaoling Karst Mountain Area, SW China. Land 2023, 12, 1267. [Google Scholar] [CrossRef]
  67. Piao, S.; Yin, G.; Tan, J.; Cheng, L.; Huang, M.; Li, Y.; Liu, R.; Mao, J.; Myneni, R.B.; Peng, S. Detection and attribution of vegetation greening trend in China over the last 30 years. Glob Chang. Biol. 2015, 21, 1601–1609. [Google Scholar] [CrossRef]
  68. Shen, Q.; Gao, G.; Fu, B.; Lü, Y. Responses of shelterbelt stand transpiration to drought and groundwater variations in an arid inland river basin of Northwest China. J. Hydrol. 2015, 531, 738–748. [Google Scholar] [CrossRef]
  69. Qiong, C.; Qiang, Z.; Haifeng, Z. Spatial disparity of NDVI response in vegetation growing season to climate change in the Three-River Headwaters Region. Ecol. Environ. Ences 2010, 19, 1284–1289. [Google Scholar]
  70. Rogier, D.J.; Jan, V.; Achim, Z.; Michael, S. Shifts in Global Vegetation Activity Trends. Remote Sens. 2013, 5, 1117–1133. [Google Scholar] [CrossRef]
  71. Bogaert, J.; Zhou, L.; Tucker, C.J.; Myneni, R.B.; Ceulemans, R. Evidence for a persistent and extensive greening trend in Eurasia inferred from satellite vegetation index data. J. Geophys. Res. Atmos. 2002, 107, ACL 4-1–ACL 4-14. [Google Scholar] [CrossRef]
  72. Wu, Y.; Tang, G.; Gua, H.; Liu, Y.; Yang, M.; Sun, L. The variation of vegetation greenness and underlying mechanisms in Guangdong province of China during 2001–2013 based on MODIS data. Sci. Total Environ. 2018, 653, 536–546. [Google Scholar] [CrossRef] [PubMed]
  73. Piao, S.; Wang, X.; Ciais, P.; Zhu, B.; Wang, T.; Liu, J. Changes in satellite-derived vegetation growth trend in temperate and boreal Eurasia from 1982 to 2006. Glob. Chang. Biol. 2011, 17, 3228–3239. [Google Scholar] [CrossRef]
  74. Michaletz, S.T.; Cheng, D.; Kerkhoff, A.J.; Enquist, B.J. Convergence of terrestrial plant production across global climate gradients. Nature 2014, 512, 39–43. [Google Scholar] [CrossRef] [PubMed]
  75. Brohan, P.; Kennedy, J.J.; Harris, I.; Tett, S.F.; Jones, P.D. Uncertainty estimates in regional and global observed temperature changes: A new data set from 1850. J. Geophys. Res. Atmos. 2006, 111. [Google Scholar] [CrossRef]
  76. He, L.; Chen, J.M.; Pan, Y.; Birdsey, R.; Kattge, J. Relationships between net primary productivity and forest stand age in US forests. Glob. Biogeochem. Cycles 2012, 26. [Google Scholar] [CrossRef]
  77. Zhengxing, W.; Chuang, L.; Alfredo, H. From AVHRR-NDVI to MODIS-EVI: Advances in vegetation index research. Acta Ecol. Sin. 2003, 23, 979–987. [Google Scholar]
Figure 1. Vegetation types.
Sustainability 16 03303 g001
Figure 2. Calculation of environmental stress and lagging effects.
Sustainability 16 03303 g002
Figure 3. Annual average of NDVI for countries along the “six economic corridors” from 1986 to 2015. (When the NDVI value is greater than 0, a higher NDVI value closer to 1 indicates denser vegetation cover. Conversely, when the NDVI is close to zero, it may indicate either bare land or an urbanized area).
Sustainability 16 03303 g003
Figure 4. Trends in NDVI changes for countries along the “six economic corridors” from 1986 to 2015.
Sustainability 16 03303 g004
Figure 5. Average NDVI within the 100 km buffer zone of the economic corridor from 1986 to 2015.
Sustainability 16 03303 g005
Figure 6. Partial correlation coefficient between NDVI and climate elements.
Sustainability 16 03303 g006
Figure 7. The lag effect of NDVI and climate factors.
Sustainability 16 03303 g007
Table 1. Statistics of NDVI changes for countries along the “six economic corridors” from 1986 to 2015.
Slope RangeChange RangeTypesArea Proportion (%)
<−0.009<−0.27Severe degradation0.5
−0.009~−0.0045−0.27~−0.135Moderate degradation1.5
−0.0045~−0.001−0.135~−0.03Mild degradation18.3
−0.001~0.001−0.03~0.03Almost no change40.1
0.001~0.00450.03~0.135Minor improvement35.0
0.0045~0.0090.135~0.27Moderate improvement4.1
>0.009>0.27Significant improvement0.5
Table 2. NDVI and its change trend statistics of node cities.
Node CityNDVI SlopeNode CityNDVISlope
Zhengzhou0.6720 −0.0028 Erzurum0.5390 0.0012
Luoyang0.7177 0.0015 Bursa0.7223 0.0005
Xi’an0.7356 −0.0033 Diyarbakir0.5560 0.0055
Aktogay0.5118 0.0004 Istanbul0.6819 −0.0004
Karaganda0.4376 0.0008 Mandalay0.5204 0.0005
Astana0.5142 −0.0009 Yangon0.6720 0.0032
Ulyanovsk0.7934 −0.0041 Chattogram0.8403 0.0012
Smolensk0.7857 0.0011 Calcutta0.7498 0.0018
Warsaw0.7416 0.0010 Kunming0.7572 0.0025
Poznan0.6738 −0.0002 Nanning0.7458 0.0014
Berlin0.7720 0.0008 Ha Tinh0.0012 0.0063
Utrecht0.7725 −0.0006 Ninh Binh0.0017 0.0068
Rotterdam0.7258 −0.0011 Phang-Nga0.9110 0.0007
Bishkek0.5928 −0.0028 Kashgar0.4569 −0.0027
Shymkent0.5996 −0.0001 Islamabad0.6278 0.0017
Almaty0.3559 0.0002 Lahore0.7424 0.0039
Tashkent0.5057 0.0035 Ulan Bator0.4515 −0.0008
Ashgabat0.4785 0.0010 Ulan-Ude0.5727−0.0034
Turkmenabat0.1803 −0.0024 Irkutsk0.7410 −0.0018
Mary0.3960 −0.0012 Krasnoyarsk0.7676 −0.0005
Tehran0.2994 −0.0023 Novosibirsk0.7973 0.0006
Tabriz0.3230 0.0019 Chita0.8280 −0.0015
Ankara0.4240 0.0024 Moscow0.8822 0.0007
Table 3. Partial correlation coefficient between NDVI and meteorological factors in node cities.
Node CityTemperaturePrecipitationRadiationNode CityTemperaturePrecipitationRadiation
Zhengzhou0.39 0.32 0.39 Myitkyina−0.40 0.62 −0.32
Luoyang0.35 0.51 0.45 Mandalay−0.48 0.77 −0.60
Xi’an0.27 Nan 0.35 Chattogram−0.04 0.80 −0.63
Lanzhou0.43 0.48 0.39 Calcutta0.00 0.00 0.06
Aktogay0.04 0.50 0.78 Kunming−0.37 0.48 −0.25
Karaganda0.18 0.55 0.78 Nanning0.35 0.46 0.23
Astana0.22 0.63 0.76 Thanh HoaNan 0.07 0.29
Ufa−0.11 0.64 0.79 Dong HoiNan 0.17 0.19
Ulyanovsk0.18 0.62 0.78 Ninh BinhNan −0.11 Nan
SmolenskNan 0.66 0.80 Bien HoaNan −0.30 0.19
WarsawNan 0.36 0.68 Phang-Nga−0.29 0.00 0.17
Rotterdam0.13 0.40 0.74 KashgarNan 0.33 0.54
Yinchuan0.45 0.61 0.67 Islamabad−0.28 0.52 0.31
Chimkent−0.46 Nan 0.42 Lahore−0.31 Nan −0.25
Almaty−0.31 Nan 0.69 Ulan Bator0.46 0.65 0.61
Tashkent−0.40 0.20 0.53 Ulan UdeNan 0.41 0.47
Mary−0.51 Nan 0.53 Irkutsk0.41 0.62 0.70
Tehran−0.14 0.26 0.73 Krasnoyarsk0.47 0.55 0.68
Tabriz−0.26 Nan 0.73 Novosibirsk0.25 0.62 0.73
Ankara−0.33 Nan 0.46 Chita0.37 0.57 0.67
Erzurum−0.36 0.60 0.79 Moscow0.23 0.59 0.83
Diyarbakir−0.29 −0.30 0.39
Disclaimer/Publisher’s Note: The statements, opinions and data contained in all publications are solely those of the individual author(s) and contributor(s) and not of MDPI and/or the editor(s). MDPI and/or the editor(s) disclaim responsibility for any injury to people or property resulting from any ideas, methods, instructions or products referred to in the content.

