Abstract
In the current stage of urbanization in China, urban construction has gradually shifted from incremental construction dominated by real estate to stock transformation based on improving urban quality. The evaluation of urban renewal projects is crucial for decision-making and resource allocation. However, there is no consensus on the evaluation indicators and methods. This study evaluates the current status of urban quality using the MABAC method based on numerical indicators. It evaluates the improvement of urban quality using the VIKOR method based on public satisfaction indicators. It is found that the comprehensive weights and subjective weights of the five first-level indicators in the evaluation index system of urban quality improvement in Shandong Province, namely blue–green space improvement, air cleanliness improvement, road traffic improvement, life service improvement, and governance capacity improvement, are quite different. The weight distribution of these indicators needs to be adjusted and optimized, especially for improving living services, as well as secondary indicators such as black and odorous water treatment, urban clean heating, the number of public vehicles per 10,000 people in the city, the 15 min living circle, the renovation of old residential areas, and the construction of urban intelligent management platforms. Based on the comprehensive evaluation results, an attempt is made to propose a more scientific evaluation index system, providing valuable references for urban renewal management.
1. Introduction
Urban areas in China are expanding rapidly due to fast economic growth and the agglomeration effect of the urban population. Shandong Province is a densely populated urban area in northern China, and the Shandong Peninsula urban agglomeration is a typical example of China’s urbanization process. The external expansion leads to the gradual deterioration of infrastructure and buildings in the city center through the construction of a new administrative district nearby rather than using the existing urban center [1]. This has led to the gradual deterioration of the infrastructure and buildings in the city center [2]. The earliest recorded example of deliberate urban renewal dates back to the 17th century; the redevelopment of Les Halles marked the beginning of a new era of urban planning in Europe. However, it was not until the 19th century that urban renewal became more widespread [3]. Haussmann’s Paris, a widely disseminated model that many European and American cities have adopted, became a model for complex urban development strategies [4].
In some cases, these efforts successfully transformed cities into more attractive and livable places, while in others, they destroyed historic neighborhoods and displaced local residents. The United States was among the first countries to develop specific national programs for urban renewal [5]. The urban renewal programs in European cities during the 1960s were similar in many ways to those in North America but also had some significant differences [6]. These programs often involved the demolition of old buildings, the construction of new ones, and the creation of public spaces and parks. However, the focus in Europe was often more on preserving historic architecture and heritage. In the 1980s, many cities in the West began to adopt a postmodern approach to urban policy, which focused on “careful urban renewal” [7,8]. In the United States, the approach to urban renewal underwent a significant shift in the 1970s, focusing on community-based planning and development [9].
China’s urban renewal can be traced back to the urban construction work after the founding of the People’s Republic of China in 1949, with the main content being improving environmental sanitation, developing urban transportation, renovating municipal facilities, and building workers’ houses. In the early 1980s, with the launch of economic reforms, China began attracting foreign investment and technology, leading to urban construction and renewal. Urban renewal entered a peak period in the 1990s. Large-scale demolition and reconstruction activities took place in many cities. In the 2000s, the focus of urban renewal shifted from purely infrastructure construction to including attention to the human environment and sustainable development. In the past decade, urban renewal has focused on improving urban quality and residents’ living standards, protecting traditional culture and historical heritage, and transforming old urban areas into landscape areas with cultural characteristics [10]. The 14th Five-Year Plan for National Economic and Social Development of the People’s Republic of China and the Outline of the Vision Goals for 2035 propose to accelerate the transformation of urban development methods, coordinate urban planning and construction management, implement urban renewal actions, and promote urban spatial structure optimization and quality improvement. Urban renewal and quality improvement are necessary links for developing new urbanization. All provinces have issued action plans for improving urban quality [11]. In August 2019, the General Office of the People’s Government of Shandong Province (2021) issued a notice on issuing the three-year action plan for improving urban quality in Shandong Province [12]. Urban renewal research is an essential and growing field of study that seeks to understand the impact of urban renewal projects on cities and their communities.
2. Literature Review
Urban quality is considered one of the most important aspects of maintaining any urban development [13]. Early urban renewal mainly improved the urban infrastructure, and current urban renewal pays more attention to improving the living environment and the quality of life [10].There are many prjects and famous cases of urban renewal in big cities, including urban area renewal such as Dazhalan in Beijingfang—Historic District Renewal [14], London Dockland Port Area—Old Industrial Zone Renewal [15], Tokyo Roppongi—Central Business District Renewal [16], and historical building renewal such as of the Cooper’s Muller Museum in Germany [17], Shanghai Baoshan Energy Exhibition Hall [18], etc. The evaluation of these successful cases is often limited to the evaluation of the renovation area or the single building itself, ignoring the contribution and relevance of the renovation project and the improvement of the overall quality of the city [19], and focusing on the post-evaluation period [20].
Some scholars began to pay attention to urban quality involving more comprehensive factors, such as systematic [21] and comprehensive benefits [22], and conducted relevant research on evaluating the effect of urban renewal. Ng proposed five basic principles of encouraging participation, building community character, advancing equity, improving the environment, and enlivening the economy. Various quality-of-life indicators related to these five principles evaluated the quality-of-life perceptions for urban regeneration in Hong Kong [23]. Jihad and Chuloh extracted the planning elements (Urban Environment, Transportation, Social/Cultural, Economic, and Sustainability Sector) for sustainable urban regeneration in Dubai with AHP [24].
There are also some unsatisfactory cases in the urban renewal process, such as the excessive pursuit of modern style, the neglect or even destruction of traditional residential buildings in the city, and low citizen satisfaction after renewal. Therefore, prior decision-making for urban renewal is critical.
The research on the prior decision-making for urban renewal mainly uses various decision-making theoretical models to conduct a multi-dimensional evaluation of urban renewal. Doğan established a new urban renewal approach prioritizing the participation of the local society with the capability to resolve problems with the contributions of government, private sectors, and society, and visualized the results on a satellite map by using Geographical Information System (GIS)-supported geostatistical analysis methods [25]. Zheng thought the multi-scale feature of urban renewal initiatives added uncertainty and complexity to decision-making. He proposed a multi-scale model that supports decision-making in realizing sustainable urban renewal [26]. Manupati proposed a multi-criteria decision-making (MCDM) approach for urban renewal and demonstrated it with a real-life case in South India [27]. Some scholars have also conducted related research on urban sustainability and urban quality assessment [28,29,30].
The multi-attribute decision-making method is widely used in the evaluation research of various disciplines [31]. One of the research directions in recent years is the integrated evaluation of mixed indicators such as real numbers, interval numbers, and uncertain linguistic variables [32,33,34]. The existing research rarely involves the evaluation of urban renewal and quality improvement, and the evaluation indicators are mainly real and interval numbers or the integrated evaluation of the two. Taking 16 cities in Shandong Province as an example, this paper uses the MABAC method based on objective indicators, uses the VIKOR method based on a mass satisfaction survey and probabilistic language term set to evaluate the quality improvement in these cities comprehensively, and compares and analyzes the evaluation results based on objective indicators and mass satisfaction.
3. Methods
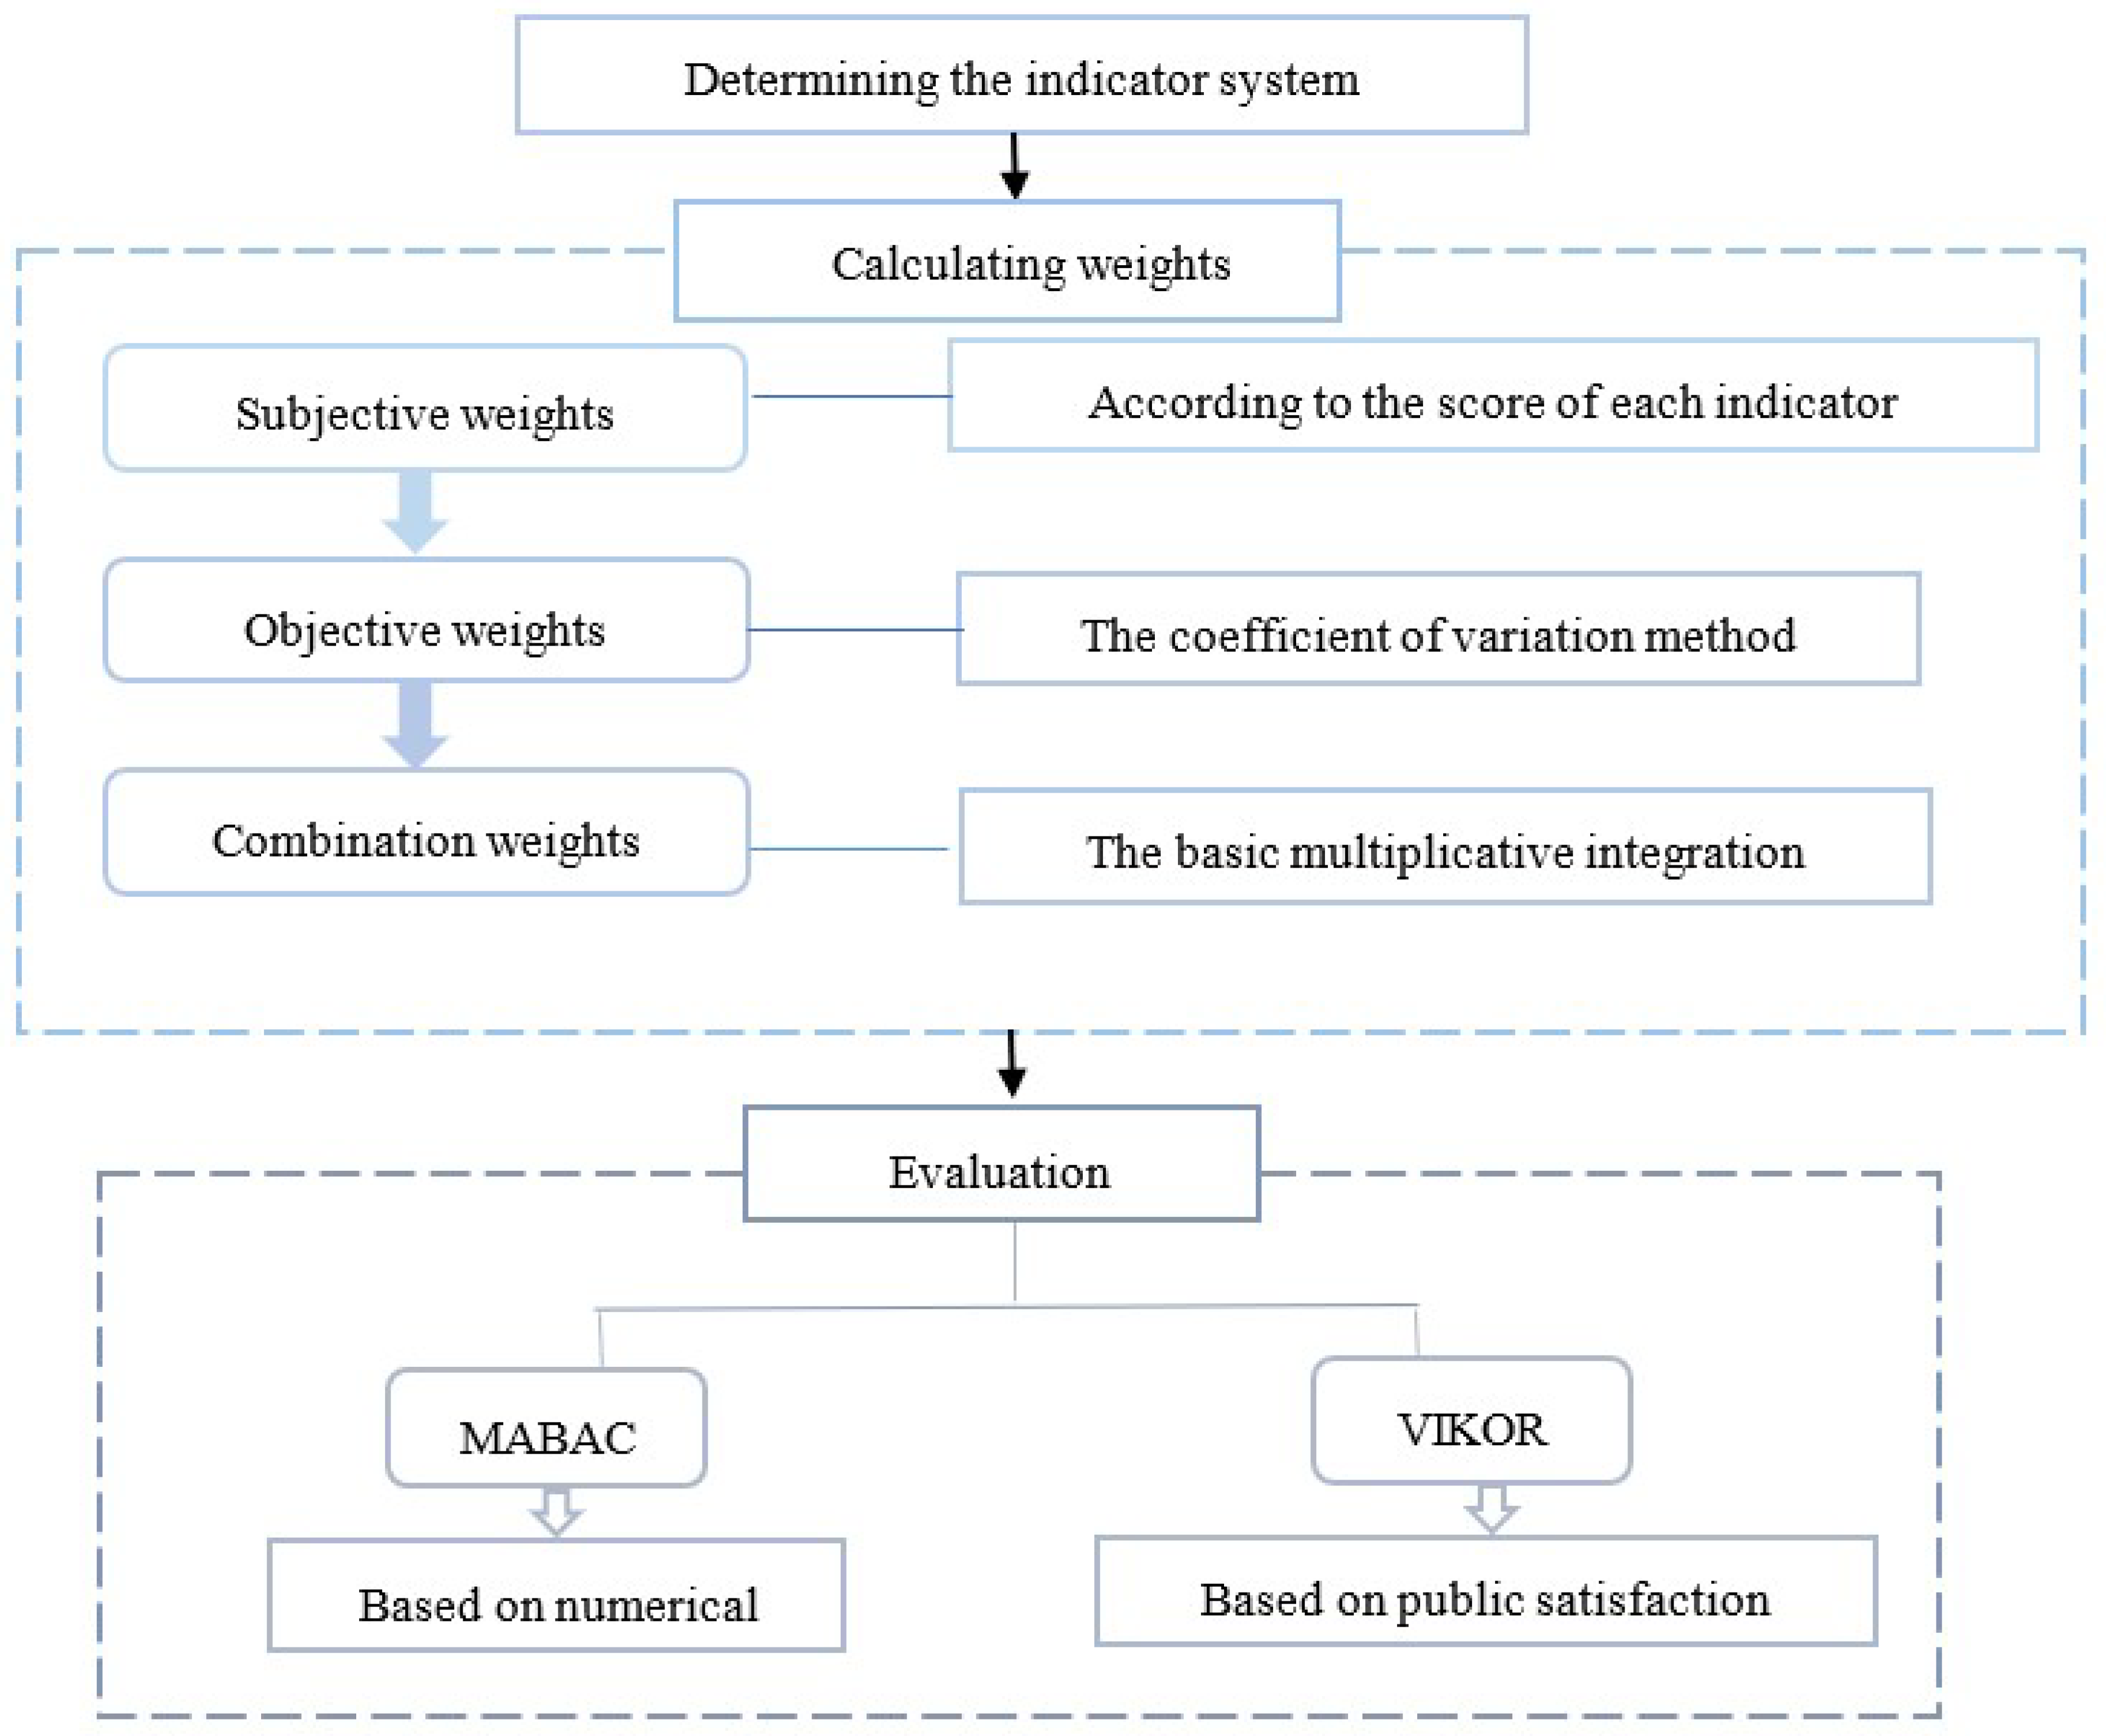
First, an evaluation index system was established, various indicators were standardized [35,36], and then indicator weights were determined through a combination of subjective and objective weights. The subjective weight was determined according to the proportion of the scores of each indicator in the Shandong Province Urban Quality Improvement Action Evaluation Index System, and the objective weight was calculated using the coefficient of variation method. Finally, the quality improvement in 16 cities was evaluated using the multi-attribute boundary approximation region comparison method and the intuitionistic fuzzy multi-attribute decision-making method. Figure 1 illustrates the research roadmap used in this study. The basic model is as follows:
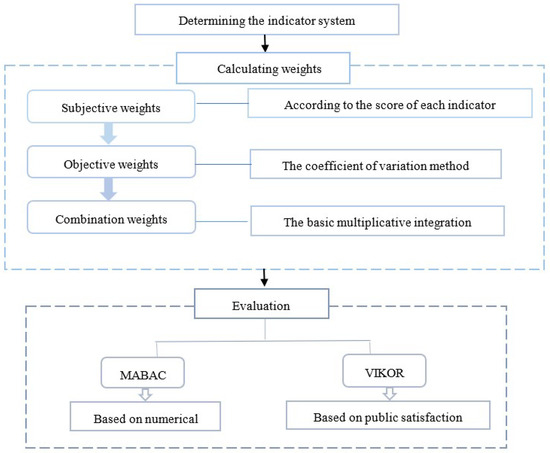
Figure 1.
Research roadmap.
3.1. Multi-Attribute Boundary Approximate Region Comparison Method (MABAC)
The main advantage of the multi-attribute boundary approximate region comparison method (MABAC) is that it allows for a more comprehensive comparison of multiple attributes than traditional methods [37]. This makes assessing the relative performance of different items or services easier based on multiple criteria. Additionally, MABAC efficiently identifies the best combination of attributes for a given task [38]. There are few studies on the decision-making application of MABAC [39]. Evaluating urban quality improvement involves uncertain information fusion and decision-makers’ behavioral characteristics. Many factors are affected by uncertainty. MABAC is less affected by index weight, and the evaluation results are more robust [40]. This paper applies the MABAC method to study the comprehensive evaluation of urban quality improvement based on the bounded rational behavior of decision-makers.
The calculation process is as follows:
Step 1: Standardize the decision matrix’s benefit and cost attribute values using Formulas (1) and (2), respectively.
where is the original evaluation value of i alternatives under the j attribute in the decision matrix, represents the standardized evaluation value in the decision matrix, m denotes the number of alternatives, and n is the number of attributes. , .
Step 2: Construct a weighted standardized decision moment from Formula (3), where is the weight of attribute .
Step 3: Construct the boundary approximation region matrix from Formula (4).
Step 4: Calculate the distance to the boundary approximation region from Formula (5).
Step 5: Calculate the total distance from each solution to the boundary approximation region according to Formula (6).
Step 6: Obtain the ranking of each scheme according to the descending order of the total distance.
3.2. Intuitionistic Fuzzy Multi-Attribute Decision-Making Method (VIKOR)
VIKOR is a compromise decision-making method based on the TOPSIS method [41]. It provides a more accurate representation of decision-makers’ preferences and beliefs and helps reduce decision-making subjectivity [42,43].
The calculation process is as follows:
Step 1: Construct an initial decision matrix , where is evaluating each attribute by a probabilistic uncertain linguistic term set.
Step 2: Determine positive and negative ideal solutions. For scenario set , determine each attribute’s best and worst values.
The positive and negative ideal solutions under the benefit-type attribute are respectively
The positive and negative ideal solutions under the cost-type attribute are respectively
The positive ideal solution and the negative ideal solution are
Step 3: Calculate the group effect value and the maximum individual regret value . This is calculated by using the score value of the probabilistic uncertain language term set.
Step 4: Calculate the compromise function value .
where is the decision mechanism coefficient, the reinforcement group effect mechanism , and the reinforcement individual regret mechanism . If the compromise equilibrium mechanism is adopted, then . The smaller the value of is, the smaller the distance from the positive ideal solution is, and the better the scheme is.
Step 5: Sort the candidate schemes.
- (1)
- Under the mechanism of enhancing group utility, the optimal solution is the one with the smallest corresponding in the set of compromise solutions;
- (2)
- Under the mechanism of strengthening individual regret, the optimal solution is the one with the smallest corresponding in the set of compromise solutions;
- (3)
- Under the compromise equilibrium mechanism, the optimal solution is the one with the minimum value of .
3.3. Coefficient of Variation Method
The attribute value is normalized data.
- (1)
- If is an interval number,
- (2)
- If is a triangular fuzzy number,
- (3)
- If is a language variable, first convert it into the corresponding triangular fuzzy number, then calculate the median value.
- (4)
- Calculate the average value of the j indicators.
- (5)
- Calculate the mean square deviation of the j indicators.
- (6)
- Calculate the coefficient of variation for the j indicators.
- (7)
- Normalize the coefficient of variation of each indicator to obtain the weights of each indicator.
4. An Empirical Study on the Evaluation of Urban Quality Improvement in Shandong Province
4.1. Study Area and Data
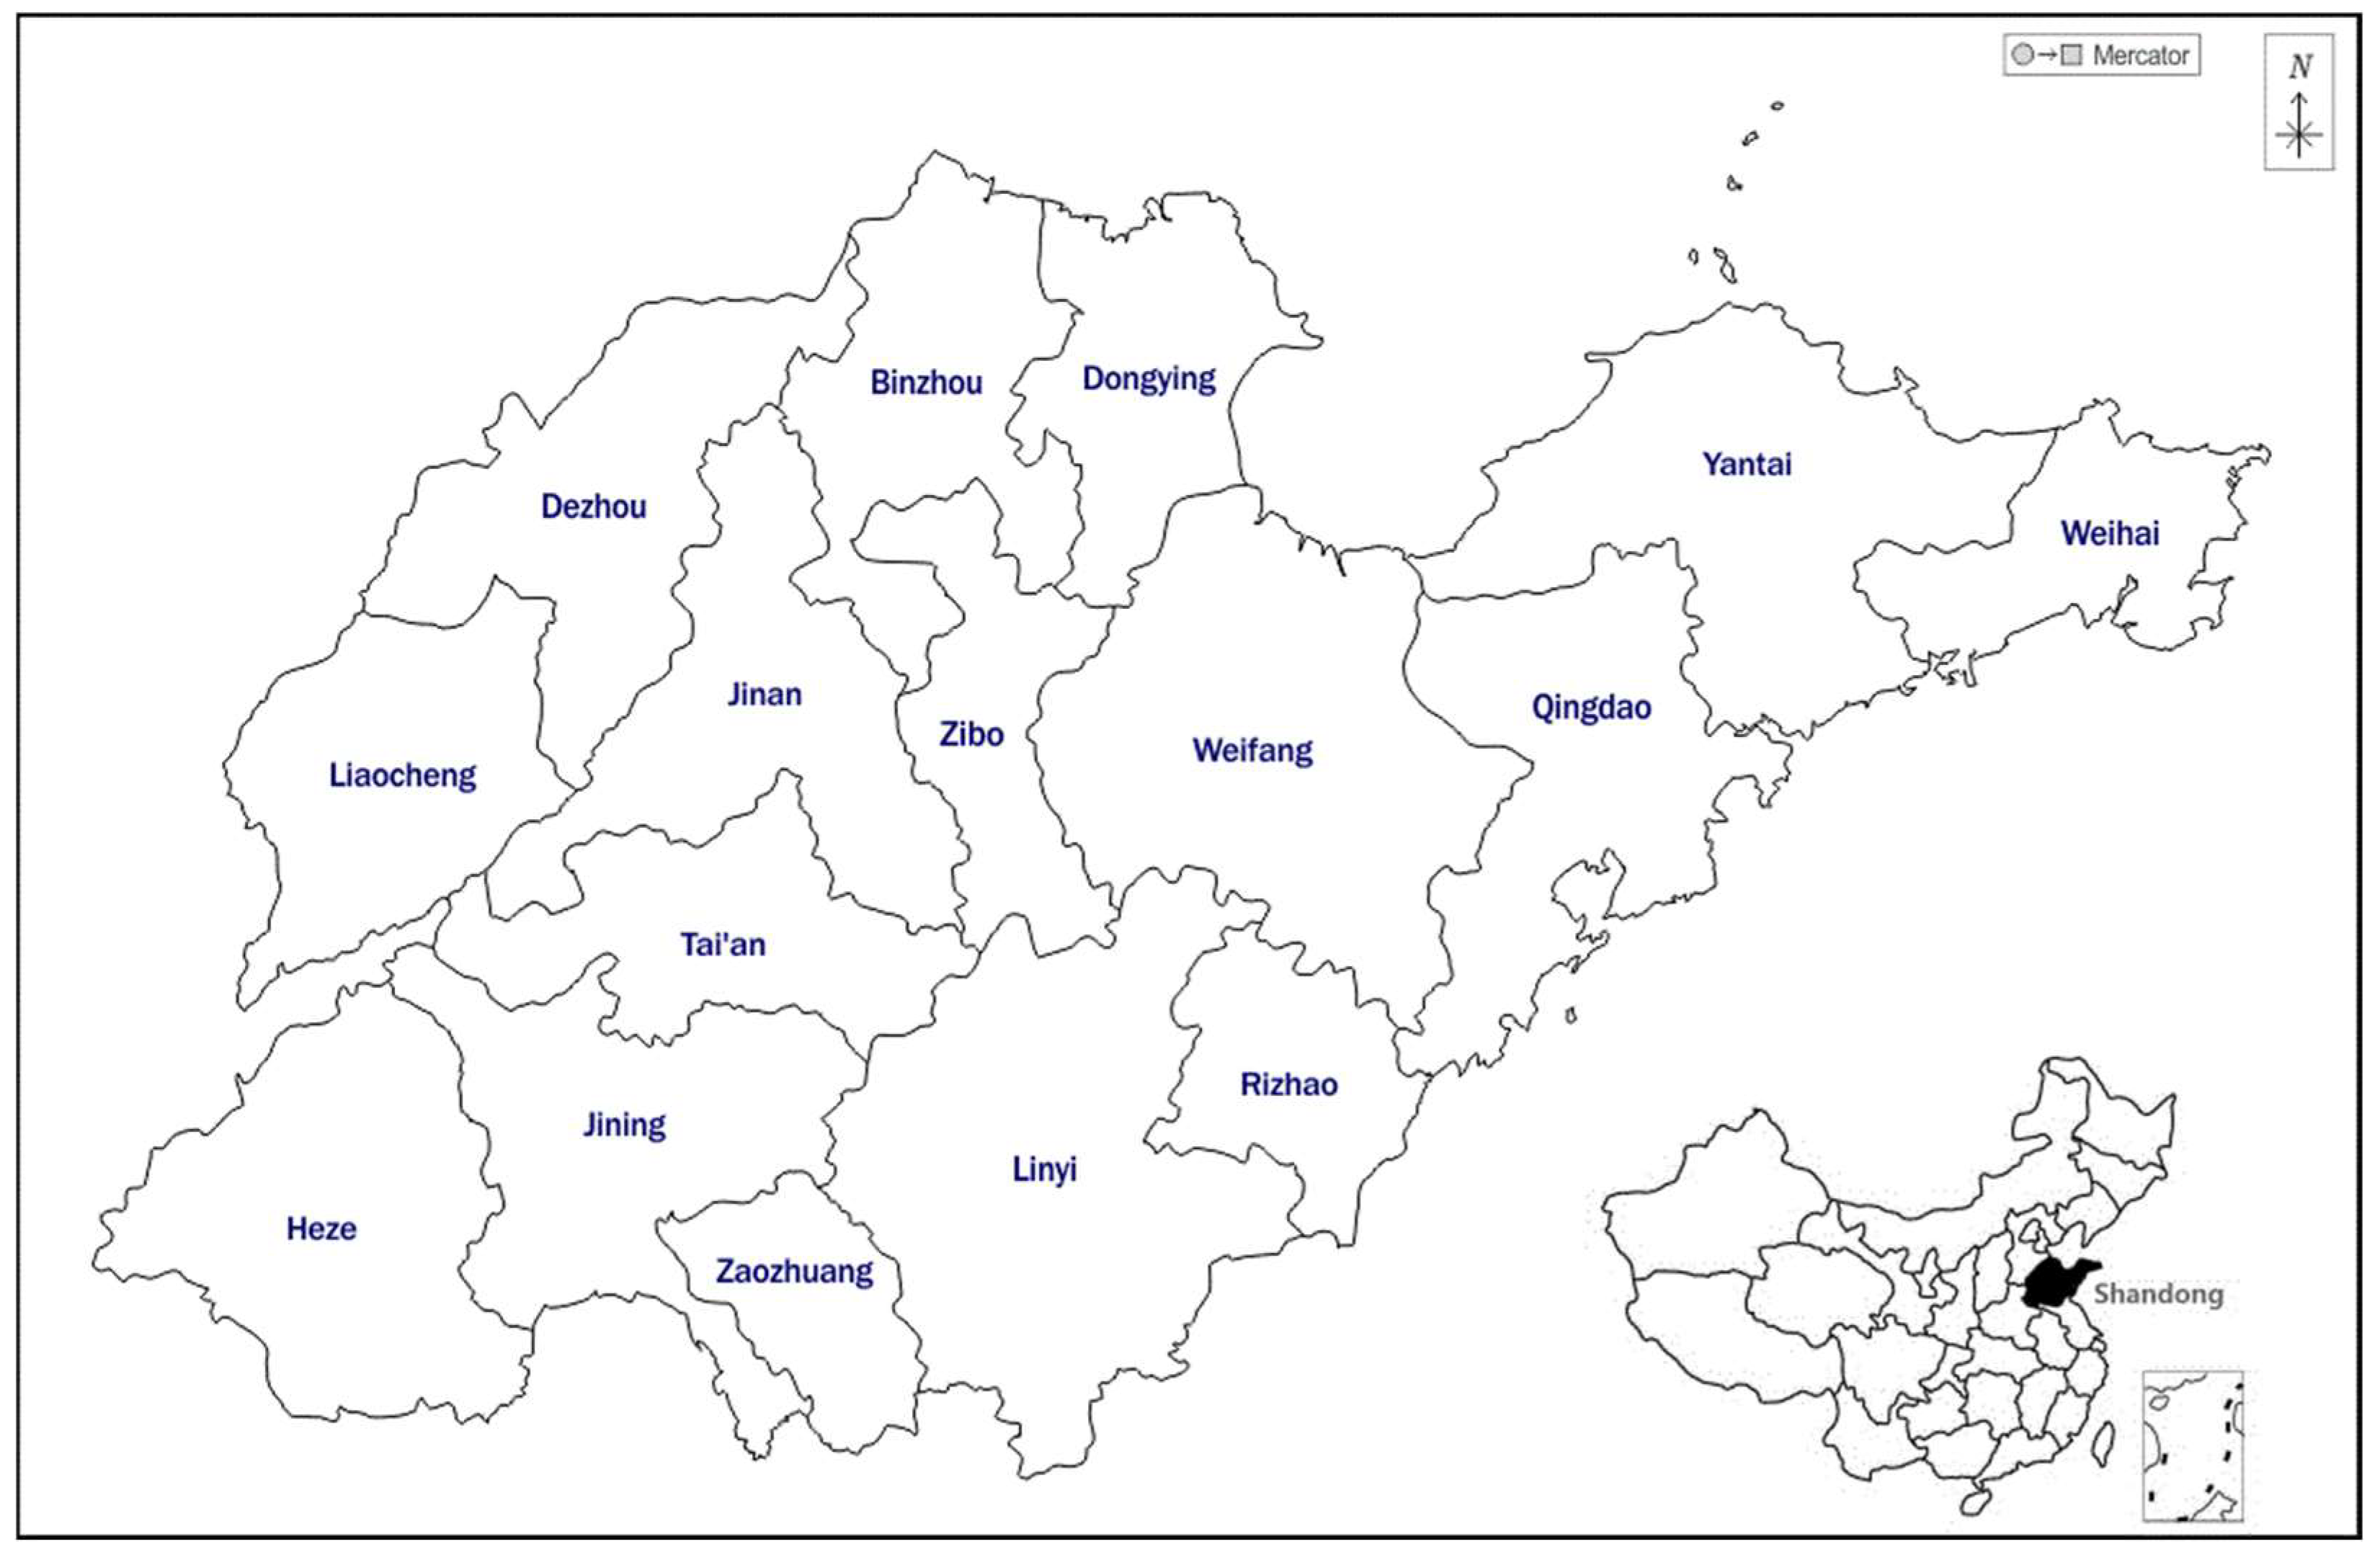
The 16 cities in Shandong Province are taken as an example, as shown in Figure 2. Located in eastern China and the lower reaches of the Yellow River, by the end of 2021, Shandong Province had a permanent resident population of 101.527 million, ranking second in the country in terms of total population and being one of the two provinces with a population over 100 million. The urbanization rate of the permanent resident population reached 63.94%. The main reason for choosing cities in Shandong Province as the research object is that the urban population in Shandong has reached 65.59 million, ranking second in China, and the relevant data are detailed. In 2021, the Department of Housing and Urban-Rural Development of Shandong Province organized a comprehensive evaluation of the quality improvement work for all 16 cities. The evaluation data were collected in 2020, and on-site evaluations and public satisfaction surveys were conducted until the end of August 2021.
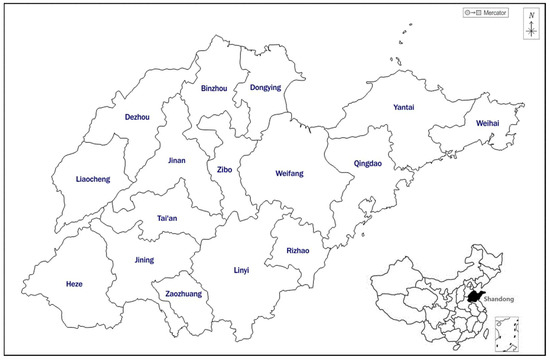
Figure 2.
Study area.
The data for this study are sourced from the “Research Report on the Evaluation of Urban Quality Improvement in Shandong Province in 2020”. The report establishes a primary indicator system comprising ten indicators, including eight indicator evaluations, one satisfaction survey, and one bonus item. The evaluation indicators come from the “Shandong Province Urban Quality Improvement Action Evaluation Indicator System” and the “Urban Physical Examination Work Plan of the Ministry of Housing and Urban-Rural Development of the People’s Republic of China”. The total score of indicator evaluation is 80 points, satisfaction is 20 points, and an additional 10 points are set for the bonus item. The bonus item mainly focuses on the achievements of national and provincial demonstration cities, which are not highly relevant to this research work. Therefore, the following research adopts 9 primary evaluation indicators and 26 secondary indicators. The indicator system is shown in Table 1. Among the secondary indicators, 14 indicators are provided by relevant provincial departments, inspection teams score 6 indicators during on-site evaluations, and 6 satisfaction indicators are obtained through random telephone surveys of residents in 16 main urban areas of cities with a sample size of 50 valid questionnaires per city. The three change options for satisfaction surveys are “improvement, unchanged, and deterioration”, corresponding to the satisfaction evaluation of “satisfied, average, and unsatisfied”.

Table 1.
Evaluation index system of urban quality improvement in Shandong Province.
Satisfaction evaluation is an uncertain linguistic term description that needs to be transformed into probabilistic linguistic terms [44]. The transformation method is as follows:
Suppose is a finite set consisting of an odd number of linguistic terms. Then, a probability linguistic term set is defined as
where represents the possibility degree of linguistic evaluation information , satisfying . represents the subscript of , and represents the number of linguistic terms in .
4.2. Weight Calculation Results
4.2.1. Subjective Weights
The subjective weight of indicators is directly allocated according to the score of each indicator of the research report. See Table 1 for details.
4.2.2. Objective Weights
The coefficient of variation method, abbreviated as CV, is a commonly used approach to calculate weights based on the relative dispersion of data. Compared to more complex weighting methods, the CV method is relatively simple and easy to implement. It can also be applied to various types of data, including continuous and discrete variables.
Table 2 shows the scoring data for quality improvement evaluation indicators of cities in Shandong Province. The data from C1 to C20 represent the scores of 16 city evaluation indicators. C21 to C26 are the probabilistic linguistic term sets converted from satisfaction survey results with uncertain linguistic terms using the formula (22). The objective weight is calculated by CV, and the specific values are shown in Table 1.
Table 2.
Evaluation data on urban quality improvement in Shandong Province.
4.2.3. Combined Weights
Subjective weights consider experts’ experience, knowledge, and personal preferences, capturing factors that objective data cannot fully reflect. However, they rely on qualitative judgments and may introduce biases in the evaluation process. Objective weights are based on quantitative data and scientific methods, using statistical analysis and mathematical models to determine the weight of each criterion. However, objective weights are also influenced by potential limitations and biases, such as the quality and accuracy of the data used. Combining both approaches can achieve a more balanced and comprehensive assessment by considering both quantitative and qualitative factors.
The primary multiplicative integration method [45] is used for the combination weights. For specific values, see Table 1.
where is the subjective weight and is the objective weight.
4.2.4. Weight Analysis
According to the comprehensive weight calculation results, it can be seen that the weight proportion of the first-level indicators from large to small is as follows: A2 > A4 > A1 > A7 > A8 > A6 > A3 > A5. However, the proportion of subjective weight in order is A1 > A4 > A2 > A5 > A6 > A3 > A8 > A7. The score distribution of the current evaluation index system is inconsistent with the comprehensive weight. The weight ratio comparison chart is shown in Figure 3. Among these, the comprehensive weight and subjective weight of A2, A3, A4, A5, and A6 are quite different, indicating that the score distribution of these five first-level indicators needs to be adjusted and optimized, especially for the A5 life service promotion index, so the objective weight is 0, and the discrimination in the evaluation process is not high.
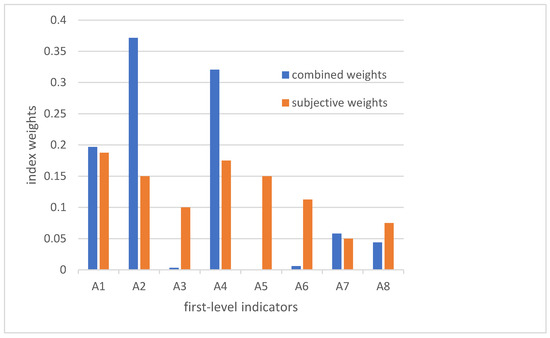
Figure 3.
Comparison between subjective weights and combined weights for first-level indicators.
The weight proportion of secondary indicators from large to small is C5 (sewage treatment quality improvement and efficiency), C6 (sponge city construction), C10 (urban built-up area road network density), C11 (parking facility construction), C1 (urban design coverage and implementation), C13 (pipe gallery construction), C2 (historical and cultural block and historical building protection and utilization), C8 (urban safety development), C7 (greenway construction), C19 (civilized city building), C3 (city appearance detail beautification), C20 (integrity system construction), C17 (construction of domestic waste classification and treatment system), and C9 (dust control and road cleaning). Compared with the subjective weight proportion of secondary indicators, the score distribution of secondary indicators in the current evaluation index system is also inconsistent with the comprehensive weight. The weight ratio comparison chart is shown in Figure 4. Among these, the comprehensive weights and subjective weights of C1, C3, C4, C5, C6, C8, C9, C10, C12, C14, C15, C16, C17, and C20 are quite different, indicating that the score distribution of these secondary indicators needs to be adjusted and optimized, especially for the C4, C8, C12, C14, C15, and C16 indicators, for which the objective weight is 0, and there is no discrimination in the evaluation process.
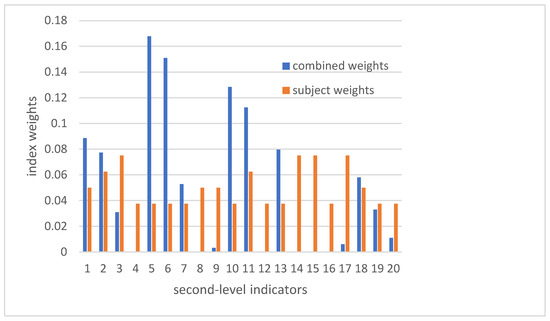
Figure 4.
Comparison of subjective weights and combined weights for second-level indicators.
4.3. Evaluation Results
4.3.1. Evaluation Based on the Numerical Index
The MABAC method aggregates the information from 20 numerical indicators, allowing the calculation of the total distance from each city to the approximate border area. For the specific numbers, see Table 3 for values and ranking.
Table 3.
Evaluation ranking based on numerical index and mass satisfaction.
4.3.2. Evaluation Based on Mass Satisfaction Index
The VIKOR method is used to aggregate the information from six probabilistic linguistic indicators, and the maximum group utility value , the maximum individual regret value , and the compromise equilibrium mechanism value (ν = 0.5) of 16 cities are obtained. See Table 3 for details.
It can be seen that according to the optimal scheme criterion 1 of the VIKOR method, the city with the minimum value for the maximum group effect and the maximum individual regret value is Linyi, and − so Linyi is the best among the 16 cities based on mass satisfaction. According to the optimal scheme criterion of the VIKOR method, the optimal solution for other cities is solved, and finally, the evaluation ranking of urban quality improvement based on mass satisfaction is obtained.
4.3.3. Analysis of Evaluation Results
The evaluation based on the MABAC method and 20 numerical indicators is mainly for evaluating the current situation of urban quality, while the evaluation based on the VIKOR method and 6 satisfaction indicators is for describing the improvement in urban quality.
Table 4 shows that Weifang, Linyi, Zibo, and Weihai are all in the top eight based on the ranking of the MABAC method and the ranking of the satisfaction index. Weifang and Linyi are in the top 4, and Zibo and Weihai are in the 5–8 ranks. Zaozhuang, Rizhao, Dezhou, and Liaocheng are all in the last eight rankings based on the MABAC method and satisfaction index, and Liaocheng is in the last four.
Table 4.
Ranking of evaluation results.
From a geographical perspective, most of the top eight cities based on the MABAC ranking and satisfaction index ranking are located in the central and eastern regions of Shandong Province, and only Heze ranks fifth in the western cities based on the satisfaction index ranking.
4.3.4. Analysis of Evaluation Data
According to the quality improvement evaluation data for each city in Table 2, the final indicators of each city, which is the indicators with a large improvement space, is summarized in Table 5.
Table 5.
Final-ranked indicators for each city.
It can be seen from Table 5 that Jinan, Qingdao, Weifang, and Tai’an rank low in only one indicator. In contrast, Zibo, Yantai, Jining, Weihai, and Linyi rank low in two indicators, indicating that all departments pay more attention to improving urban quality and achieving good results. Zaozhuang and Rizhao lagged in three indicators, Dongying in four, Dezhou in five, and Liaocheng, Binzhou, and Heze in six. The four cities of Dezhou, Liaocheng, Binzhou, and Heze also need to mobilize relevant departments and intensify their efforts to improve the weak indicators of urban quality.
5. Discussion
5.1. Optimization of Indicator Weights
The analysis of indicator weight distribution indicates that it is necessary to adjust the score distribution of primary and secondary indicators, primarily the life service improvement indicators in the primary indicators. The objective weight should be corrected to more accurately reflect the actual performance. Optimizing indicator weights can be achieved through the following strategies:
- (1)
- Expert consultation: Seeking the opinions of relevant domain experts can provide valuable insights into the relative importance of each indicator.
- (2)
- Stakeholder participation: Involving various stakeholders, including government officials, urban planners, and residents, in the evaluation process ensures a comprehensive and inclusive assessment. This approach helps capture different perspectives and priorities, resulting in a more balanced weight allocation.
- (3)
- Data-driven analysis: Conducting comprehensive data analysis by reviewing historical data provides objective evidence for determining the weight of each indicator.
- (4)
- Regular review and adjustment: The distribution of indicator weights should be periodically reviewed and adjusted to reflect evolving priorities. This ensures the assessment system remains relevant and aligned with the city’s changing needs.
5.2. Optimization of the Indicator System
Based on the analysis of the index weight distribution, it is evident that specific indicators require adjustments and optimization to accurately reflect their importance in evaluating a city’s performance. The optimization of the evaluation index system applied in the evaluation of urban quality improvement in Shandong Province in 2021 is as follows:
- (1)
- In the primary indicators, improvement in life services is a critical indicator that requires high attention. All cities achieved full marks in this indicator, indicating significant progress in developing life services. Revising the indicator to “community facility improvement” is recommended to assess urban development more comprehensively. Similarly, some secondary indicators need scrutiny to ensure a scientific assessment process. For example, we should consider replacing the secondary indicators of black and odorous water body treatment, clean heating in cities, number of public transportation vehicles per thousand people, 15 min living circle, and construction of intelligent city management platforms with indicators such as reuse rate of recycled water, ratio of excellent air quality days, ratio of electric vehicle charging stations to electric vehicles, coverage rate of community elderly care facilities, retrofitting rate of elevators in existing residential buildings, and coverage rate of three-dimensional data in the City Information Model (CIM) platforms.
- (2)
- A suggestion is to modify the primary indicator “safety operation improvement” to “resilience enhancement of infrastructure”. Additionally, to measure the safety development of cities more specifically, it is recommended to split the corresponding secondary indicators into the following three specific indicators: the number of safety production accidents in housing and municipal engineering, the completion rate of renovation for old gas pipelines, and the radius of the coverage of urban fire stations.
5.3. Research Method
In comparing this study with previous research, the MABAC method, based on numerical indicators, allows for a quantitative assessment of urban quality, and the VIKOR method, focusing on public satisfaction indicators, brings in the subjective perspective and provides a more comprehensive evaluation. There is a significant difference between the comprehensive weight and subjective weight of some indicators, indicating that there may be a mismatch between objectively measured indicators and public perception. Therefore, more detailed evaluation methods need to be adopted.
6. Conclusions
According to the research results of the evaluation work, the specific problems that exist in each city are as follows:
- (1)
- Zaozhuang and Dezhou still need to complete the preparation of the overall urban design. Liaocheng and Heze have achieved the overall urban design results but must complete the approval process. Urban design implementation in most critical urban areas is slow or has yet to be implemented. Cities should take adequate measures to promote the formulation and approval of overall urban designs and accelerate the implementation of urban designs in critical areas. Relevant departments should improve the mechanism for formulating and approving overall urban designs and strengthen the organization and management of critical urban design formulation and implementation.
- (2)
- The influent weighted BOD concentration of the sewage treatment plants in Zibo and Dongying is slightly lower than the annual target requirements, and that in Zaozhuang, Jining, Weihai, Linyi, Dezhou, and Liaocheng is far from the annual target requirements. The proportions of built-up area and built-up area of sponge cities in Jinan, Qingdao, Zibo, Dongying, Yantai, Jining, Rizhao, Dezhou, Liaocheng, and Heze are less than 25%, and the proportions in Zibo, Jining, Rizhao and Liaocheng are less than 20%. Sewage treatment and sponge city construction in the blue and green space promotion index must catch up. It is suggested that the construction of the sponge city should be coordinated, the area of the sponge city should be increased, and the improvement of sewage treatment quality and efficiency should be accelerated. Relevant departments need to strengthen policy support, provide economic incentives and technical assistance, and encourage businesses and residents to participate in sponge city construction and improvement of wastewater treatment.
- (3)
- The road network density of built-up areas in 12 cities, namely Jinan, Zaozhuang, Dongying, Yantai, Jining, Weihai, Rizhao, Linyi, Dezhou, Liaocheng, Binzhou, and Heze, is less than 8 km/km2, and that in 5 cities, namely Dongying, Dezhou, Liaocheng, Binzhou, and Heze, is less than 7 km/km2. The road network density of 11 cities is lower than that in 2019. Zibo, Tai’an, Weihai, Rizhao, Dezhou, Liaocheng, Binzhou, and Heze should introduce more effective and specific preferential policies to speed up the construction of parking facilities. Zibo, Dongying, Yantai, Weifang, Dezhou, Liaocheng, Binzhou, Heze, and eight other cities have a significant gap in the construction of comprehensive pipe galleries, among which Binzhou has completed less than 30% of the tasks determined in the relevant documents of the provincial government. It is recommended that the density of road networks in developed urban areas be increased and more investment be made in road construction. This can be achieved by planning new roads, expanding existing roads, and implementing measures such as optimizing traffic organization and signal control. These efforts aim to increase the number and connectivity of roads within urban areas. Furthermore, it is crucial to strengthen project management and supervision and accelerate the construction of comprehensive utility tunnels. Measures should be taken to ensure that the work progresses according to plan. Additionally, expediting the construction of parking facilities, including underground parking lots, multi-story parking buildings, temporary parking spaces, and other public parking areas, is crucial. Reasonable planning and layouts should be implemented to provide more convenient parking options in critical areas. Specific preferential policies need to be introduced to encourage the development of parking facilities. These may include tax exemptions, priority land supply, investment subsidies, and other measures to attract more investors and businesses to participate in parking facility construction.
This paper provides a comprehensive application of the MABAC and VIKOR methods to evaluate the effect of urban quality improvement. It is found that the comprehensive weight of some indexes in the current evaluation index system of urban quality improvement in Shandong Province is quite different from the subjective weight. The objective weight of some indexes is zero, which leads to no discrimination in the evaluation process. Optimizing the evaluation index system and adjusting the weight appropriately are suggested. Given the problems of different cities, the corresponding policy implications are put forward, including accelerating the preparation and approval of the urban overall design, accelerating the construction of sponge cities, improving the density of urban road networks and the speed of comprehensive pipe corridor construction, accelerating the construction of parking facilities, and preferential policies. Through these specific measures, the progress of urban quality improvement can be better promoted. This can be an excellent reference for urban planning and management decision-making.
The level and quality of urbanization in China among developing countries is relatively high. The research results of this article have significance for foreign cities that are still in the early stage of urbanization. The research approach can be replicated in other regions. The methods are not geographically limited and can be applied to different urban settings and contexts. To replace the data obtained from the reports used in this study, it is possible to consider using government reports, statistical databases, or other reliable organization surveys. This may involve surveys, interviews, or observations in other evaluated cities. The pursuit of sustainability in the indicator system can help other developing countries achieve more effective and equitable urbanization. Of course, this study also has its limitations. Firstly, taking cities in Shandong Province as an example may limit its promotion in other regions with different urban characteristics and development levels, especially abroad. Secondly, the data used in this study may have certain limitations in terms of availability and comparability. Collecting and analyzing urban quality data may be challenging, and the reliability and effectiveness of the data may affect the accuracy of assessment results.
Author Contributions
Conceptualization, D.L. and L.Q.; methodology, D.L. and B.L.; formal analysis, L.Q.; investigation, S.L.; writing—original draft preparation, D.L. and L.Q.; writing—review and editing, D.L. and C.L. supervision, C.L. and S.L. All authors have read and agreed to the published version of the manuscript.
Funding
This research was supported by the Shandong Innovation and Entrepreneurship Community for Carbon Peaking and Neutrality in Construction & Traffic Industry.
Institutional Review Board Statement
Not applicable.
Informed Consent Statement
Not applicable.
Data Availability Statement
The data presented in this study are available on request from the corresponding author.
Conflicts of Interest
The authors declare no conflict of interest.
References
- Chen, X.J.; Tan, Y.W.; Fan, X.Q. The spatial evolution of extended physical boundary areas of medium and small cities. J. Northwest Univ. 2017, 47, 289–295. [Google Scholar] [CrossRef]
- Abusaada, H.; Elshater, A.; Abd Elrahman, A.S. Articulating assemblage theory for salient urban atmospheres in children’s environments. Ain Shams Eng. J. 2021, 12, 2331–2343. [Google Scholar] [CrossRef]
- Couch, C. Urban Renewal: Theory and Practice; Red Globe Press: London, UK, 1990; pp. 49–78. [Google Scholar]
- Monclús, J. The Hispanic International Seminar on Urban Form (ISUF-H). A platform for dialogue between urban planners and urban form researchers in Spanish-speaking countries. Plan. Perspect. 2018, 37, 629–639. [Google Scholar] [CrossRef]
- Leo, G. Urban Renewal in European Countries: Its Emergence and Potentials; University of Pennsylvania Press: Philadelphia, PA, USA, 1964. [Google Scholar]
- González-Val, R. Historical urban growth in Europe (1300–1800). Pap. Refional Sci. 2019, 98, 1115–1137. [Google Scholar] [CrossRef]
- Musterd, S.; Ostendorf, W. Urban renewal policies in the Netherlands in an era of changing welfare regimes. Urban Res. Pract. 2023, 16, 92–108. [Google Scholar] [CrossRef]
- Chris, C.; Sykes, O.; Börstinghaus, W. Thirty years of urban regeneration in Britain, Germany and France: The importance of context and path dependency. Prog. Plan. 2011, 75, 1–52. [Google Scholar] [CrossRef]
- Sutton, S. Urban Revitalization in the United States: Policies and Practices. 2008. Available online: http://www.columbia.edu/cu/c2arl/pdf_files/USURRP_Phase_I_Final_Report.pdf (accessed on 15 December 2022).
- Yang, J.Q.; Chen, Y. Review on the development of urban regeneration in China from 1949 to 2019. City Plan. Rev. 2020, 44, 9–19+31. [Google Scholar]
- Xinhua News Agency. The Outline of the 14th Five-Year Plan for Economic and Social Development (2021–2025) and Long-Range Objectives through the Year 2035 of the People’s Republic of China. 2021. Available online: http://www.gov.cn/xinwen/2021-03/13/content_5592681.html (accessed on 17 December 2022).
- General Office of Shandong Provincial People’s Government. Notice of the General Office of the People’s Government of Shandong Province on Printing and Distributing the Three Year Action Plan for Improving Urban Quality in Shandong Province. 2019. Available online: http://m.sd.gov.cn/art/2019/8/27/art_2259_35386.html (accessed on 17 December 2022).
- Hamam, S.E.; Din Ahmed, S.; Hend, E.F.; Sarah, A.E. Principles of urban quality of life for a neighborhood. HBRC J. 2013, 9, 86–92. [Google Scholar] [CrossRef]
- Cheng, X.Q.; Zhang, H.X.; Yin, S.J. Renovating the Existing Buildings for the Elderly in a Community Revelation of the Construction of a Service Center for the Elderly in Dashilar Community in Beijing. Archit. J. 2018, 8, 62–67. [Google Scholar]
- Ding, F.; Wu, J. Analysis of Waterfront Regeneration and Its Significance Under the Background of Urban Renewal Ding Fan & Wu Jiang. Explor. Free. Views 2020, 7, 98–106+159. [Google Scholar]
- Luo, T.L. The community-driven mega-urban renewal with government coordination: A case study on the roppongi hills, Tokyo. Eco-City Green Build. 2016, 1, 66–74. [Google Scholar]
- Pintos, P. MKM Museum Küppersmühle Extension/Herzog & de Meuron. 2021. Available online: https://www.archdaily.com/968986/mkm-museum-kuppersmuhle-extension-herzog-and-de-meuron (accessed on 4 August 2022).
- Kokaistudios. Baoshan WTE exhibition center. Archit. Pract. 2021, 11, 62–69. [Google Scholar]
- Chu, H.; Xie, D.X.; Chang, H. The relationship between place development and residents’ sense of place: A case study of Lizhiwan historic district, Guangzhou. Hum. Geogr. 2019, 34, 54–62+72. [Google Scholar] [CrossRef]
- Lin, S.-H.; Huang, X.; Fu, G.; Chen, J.-T.; Zhao, X.; Li, J.-H.; Tzeng, G.-H. Evaluating the sustainability of urban renewal projects based on a model of hybrid multiple-attribute decision-making. Land Use Policy 2021, 108, 105570. [Google Scholar] [CrossRef]
- Gao, J.; Wu, X.X.; Zhang, Y. Research on systematic Urban Regeneration and Implementation Way: Based on The Complex Adaptive System Theory. Urban Dev. Stud. 2020, 27, 62–68. [Google Scholar]
- Li, J.F. Research on Mode Selection and Comprehensive Benefit Evaluation of Urban Renewal—A Case of Urban Village Transformation in Guangzhou; South China University of Technology: Guangzhou, China, 2019. [Google Scholar] [CrossRef]
- Ng, M.K. Quality of Life Perceptions and Directions for Urban Regeneration in Hong Kong. Soc. Indic. Res. 2005, 71, 441–465. [Google Scholar] [CrossRef]
- Jihad, A.; Chuloh, J. Extracting the Planning Elements for Sustainable Urban Regeneration in Dubai with AHP (Analytic Hierarchy Process). Sustain. Cities Soc. 2022, 76, 103496. [Google Scholar] [CrossRef]
- Dogan, U.; Gungor, M.K.; Bostanci, B.; Yilmaz, B.N. GIS Based Urban Renewal Area Awareness and Expectation Analysis Using Fuzzy Modeling. Sustain. Cities Soc. 2019, 54, 101945. [Google Scholar] [CrossRef]
- Zheng, W.; Shen, G.Q.; Wang, H.; Hong, J.; Li, Z.D. Decision support for sustainable urban renewal: A multi-scale model. Land Use Policy 2017, 69, 361–371. [Google Scholar] [CrossRef]
- Manupati, V.K.; Ramkumar, M.; Samanta, D. A multi-criteria decision making approach for the urban renewal in Southern India. Sustain. Cities Soc. 2018, 42, 471–481. [Google Scholar] [CrossRef]
- Ameen, R.F.M.; Mourshed, M. Urban sustainability assessment framework development: The ranking and weighting of sustainability indicators using analytic hierarchy process. Sustain. Cities Soc. 2019, 44, 356–366. [Google Scholar] [CrossRef]
- Feleki, E.; Vlachokostas, C.; Moussiopoulos, N. Characterisation of sustainability in urban areas: An analysis of assessment tools with emphasis on European cities. Sustain. Cities Soc. 2018, 43, 563–577. [Google Scholar] [CrossRef]
- D’Alpaos, C.; Andreolli, F. Urban quality in the city of the future: A bibliometric multicriteria assessment model. Ecol. Indic. 2020, 117, 106575. [Google Scholar] [CrossRef]
- Zhang, Z.Y.; Liao, H.C.; Tang, A.B. Renewable energy portfolio optimization with public participation under uncertainty: A hybrid multi-attribute multi-objective decision-making method. Appl. Energy 2021, 307, 118267. [Google Scholar] [CrossRef]
- Yang, G.J.; Zhou, X.H. Intuitionistic trapezoidal fuzzy multi-attribute decision making based on prospect theory and VIKOR. J. Nanjing Univ. Sci. Technol. 2022, 46, 642–648. [Google Scholar] [CrossRef]
- Li, W.W.; Yi, P.T.; Li, L.Y. Superiority-comparison-based transformation, consensus, and ranking methods for heterogeneous multi-attribute group decision-making. Expert Syst. Appl. 2022, 213, 119018. [Google Scholar] [CrossRef]
- Keshavarz-Ghorabaee, M.; Amiri, M.; Hashemi-Tabatabaei, M.; Zavadskas, E.K.; Kaklauskas, A. A New Decision-Making Approach Based on Fermatean Fuzzy Sets and WASPAS for Green Construction Supplier Evaluation. Mathematics 2020, 8, 2202. [Google Scholar] [CrossRef]
- Liu, P.D.; Teng, F. Assessment of urban ecosystem health in Dongying based on hybrid Todim. China population, resources and environment. China Popul. Resour. Environ. 2017, 27, 167–176. [Google Scholar]
- Liu, Z.M.; Wang, W.X.; Liu, P.D. Dynamic consensus of large group emergency decision-making under dual-trust relationship-based social network. Inf. Sci. 2022, 615, 58–89. [Google Scholar] [CrossRef]
- Pamucar, D.; Cirovic, G. The selection of transport and handling resources in logistics centers using Multi-Attributive Border Approximation area Comparison (MABAC). Expert Syst. Appl. 2015, 42, 3016–3028. [Google Scholar] [CrossRef]
- Tešić, D.; Radovanović, M.; Božanić, D.; Pamucar, D.; Milić, A.; Puška, A. Modification of the DIBR and MABAC Methods by Applying Rough Numbers and Its Application in Making Decisions. Information 2022, 13, 353. [Google Scholar] [CrossRef]
- Sun, R.X.; Hu, J.H.; Zhou, J.D.; Chen, X.H. A Hesitant fuzzy linguistic projection-based MABAC method for patients’ Prioritization. Int. J. Fuzzy Syst. 2017, 20, 2144–2160. [Google Scholar] [CrossRef]
- Wang, W.M.; Xu, H.Y.; Zhu, J.J. Large-scale DEMATEL decision making method under interval information. Syst. Eng. Theory Pract. 2021, 41, 1585–1597. [Google Scholar]
- Opricovic, S. Multicriteria Optimization of Civil Engineering Systems. Ph.D. Thesis, University of Belgrade, Belgrade, Serbia, 1998. [Google Scholar]
- Liu, Y. Theory of Probabilistic Uncertain Linguistic and Its Application in Real Estate Project Investment Decision; Hunan University of Science and Technology: Xiangtan, China, 2020. [Google Scholar]
- Yang, H.; Zhang, X.; Fu, K.; Sun, X.; Hou, S.; Tan, Y. Comprehensive evaluation of urban water supply security based on the VIKOR-TOPSIS method. Environ. Sci. Pollut. Res. 2023, 30, 8363–8375. [Google Scholar] [CrossRef] [PubMed]
- Wu, Z.; Xu, J. Possibility Distribution-Based Approach for MAGDM With Hesitant Fuzzy Linguistic Information. IEEE Trans. Cybern. 2016, 46, 694–705. [Google Scholar] [CrossRef]
- Rong, L.L.; Liu, P.D. Research and application of evaluation method based on the hybrid indexes type. Shandong Sci. 2014, 27, 93–102+109. [Google Scholar] [CrossRef]


Disclaimer/Publisher’s Note: The statements, opinions and data contained in all publications are solely those of the individual author(s) and contributor(s) and not of MDPI and/or the editor(s). MDPI and/or the editor(s) disclaim responsibility for any injury to people or property resulting from any ideas, methods, instructions or products referred to in the content. |
© 2024 by the authors. Licensee MDPI, Basel, Switzerland. This article is an open access article distributed under the terms and conditions of the Creative Commons Attribution (CC BY) license (https://creativecommons.org/licenses/by/4.0/).