Abstract
While energy-related sectors remain significant contributors to greenhouse gas (GHG) emissions, biogas production from waste through anaerobic digestion (AD) helps to increase renewable energy production. The biogas production players focus efforts on optimising the AD process to maximise the methane content in biogas, improving known technologies for biogas production and applying newly invented ones: H2 addition technology, high-pressure anaerobic digestion technology, bioelectrochemical technology, the addition of additives, and others. Though increased methane concentration in biogas gives benefits, biogas upgrading still needs to reach a much higher methane concentration to replace natural gas. There are many biogas upgrading technologies, but almost any has methane slip. This research conducted a life cycle assessment (LCA) on membrane-based biogas upgrading technology, evaluating biomethane production from biogas with variable methane concentrations. The results showed that the increase in methane concentration in the biogas slightly increases the specific electricity consumption for biogas treatment, but heightens methane slip with off-gas in the biogas upgrading unit. However, the LCA analysis showed a positive environmental impact for treating biogas with increasing methane concentrations. This way, the LCA analysis gave a broader comprehension of the environmental impact of biogas upgrading technology on GHG emissions and offered valuable insights into the environmental implications of biomethane production.
1. Introduction
Among human activities, the energy-related sectors remain the most significant contributors to greenhouse gas (GHG) emissions. Most energy is still derived from fossil fuels, which consist of carbon-embodied products. Thus, carbon dioxide (CO2) as GHG flows to the atmosphere in large quantities. According to the statistical data of the International Energy Agency, GHG emissions from these sectors account for almost 3/4 of GHG emissions into the atmosphere annually [1]. The CO2 gas emissions of the energy sector only account for up to 65%, and those numbers have not decreased in the last five years [2,3]. In the 2023 report on CO2 emissions, the IEA announced that after CO2 emissions had shrunk by over 5% in 2020 as the COVID-19 pandemic cut energy demand, those emissions in 2021 rebounded to past pre-pandemic levels. Last year’s increase in CO2 emissions followed exceptional oscillations in energy demand [1]. Dealing with such constantly increasing GHG emissions, the world faces the critical challenge of mitigating them to avoid the worst effects of climate change, which are impacted by the growing energy demand year after year [4]. Global concern about the increasing utilisation of fossil fuels and rising GHG emissions has become more significant in international policies. In dealing with an increase in CO2 emissions, science suggests new technologies for carbon capture that help reduce the CO2 emitted into the atmosphere, and scientists are also constantly working on improving known technologies [5,6]. These technologies also help waste management facilities fulfil the European Commission Directive EC 31/1999 (European Commission, 1999) [7], which mandates that all landfill gas must be captured and flared.
In recent years, the importance of sustainable waste management as a means for mitigating environmental degradation caused by anthropogenic activities has become increasingly apparent [8]. The main objective of waste management systems is to deal with energy and material recovery and discard residues. It is also the task of a regulatory arrangement to conserve the environment and find the appropriate technology and standards for effective operations in handling waste. So far, degradable waste transformation into energy has counted on a lot of available techniques. According to the standard method of technology, we can assort those techniques into groups: the group of chemical and mechanical treatment, the group of biochemical conversion (ethanol fermentation, anaerobic digestion (AD), etc.), the group of thermal conversion (gasification, incineration, pyrolysis, etc.) and the group of new trends in Waste-to-Energy (WtE) technologies [9]. The necessity and regulations, the possibility of implementing a specific technology at a desired location for building, the WtE conversion’s effectiveness, financial ability, and other particular circumstances play a role in selecting what technology suits WtE. Waste management technologies, such as incineration and landfilling, have been shown to have significant environmental impacts, such as the emission of greenhouse gases [10,11]. In addressing these issues, the AD process has been widely adopted as a sustainable method of waste management and renewable energy production [12,13,14].
AD is a natural process whereby microorganisms break down organic matter under conditions without oxygen, producing valuable by-products such as biogas and digestate as fertiliser. Fundamentally [15], the biogas produced from the AD process comprises methane (CH4) (35–75%) and carbon dioxide (CO2) (15–50%) mixture with several contaminants such as hydrogen sulphide (H2S), ammonia, siloxanes, water vapour, oxygen, and nitrogen. However, such quality biogas still has limited usage and must be upgraded to a higher methane content, seeking to replace natural gas [16]. When the methane concentration increases after removing CO2 and other impurities, the upgraded biogas is called biomethane. Biogas upgrading technologies can be installed in almost any biogas production sector: wastewater treatment facilities, waste management facilities such as landfills, and agricultural anaerobic digestion plants, whether existing or newly built [17,18]. Biomethane with a high CH4 concentration meets natural gas quality and, as a renewable fuel, can be broadly used as a substitute for fossil fuel in transportation, heating, and electricity generation [19]. In the case of gas pipe injection, methane concentration has to be above 85% [17,20], depending on the country’s requirements for natural gas where biomethane has been produced.
Nonetheless, researchers have still focused efforts on optimising the AD process to maximise the CH4 content in biogas produced [21,22,23], improving known technologies for biogas production and applying newly invented ones, such as H2 addition technology, high-pressure anaerobic digestion technology, bioelectrochemical technology, the addition of additives and other technologies [24]. The review of such technologies confirms that the methane concentration in biogas was 87% or even 92.5%, which can be obtained [25]. The operational parameters of the AD system, such as temperature, hydraulic retention time (HRT), and organic loading rate (OLR), also affect the methane concentration in biogas. The optimum operating conditions for AD systems depend on the specific type of substrate used and the desired methane production rate. Lanko I. et al. [26] have found that thermophilic conditions (55–60 °C) were more suitable for the digestion of energy crops and animal manure, while the digestion of food waste and sewage sludge had greater performance under mesophilic conditions (35–40 °C). The hydraulic retention time (HRT) and organic load rate (OLR) also played a role and were critical parameters affecting the methane concentration in biogas. For example, a waste mix containing higher organic concentrations led to biogas with a higher methane content [27,28]. Environmental conditions, such as pH and alkalinity, also affected the methane concentration in biogas.
On the way towards renewable energy, the number of biogas plant installations has constantly increased in Europe [29]. According to the Europe Biogas Association Statistical Report 2022 [30], the present situation in the biomethane domain shows that the demand for biomethane for all final uses was substantial: in 2021, the sector’s growth was unprecedented, with a 20% increase in biomethane production, the biomethane industry smashed all records of previous years, and Europe had 1023 production plants at the beginning of 2022. This figure is a stepping stone for the decarbonisation of the whole EU economy, considering the decarbonisation potential of biomethane because biomethane has a much lower carbon footprint than fossil fuels [31,32]. However, the environmental benefits of biomethane production to be investigated depend on the specific circumstances of the production process and the energy systems it displaces. Investigations into biomethane’s environmental benefits have started since biogas and biomethane production began, time after time, applying the life cycle assessment (LCA) approach. LCA has undergone development phases since the 1970s, 1980s, and early 1990s and has been developed into a powerful modelling tool. It became a widely accepted model of the environmental performance of waste management systems [33,34], allowing evaluation and comparison of the environmental impact of different waste management strategies. LCA can be applied to assessing the environmental impact of a single product or system over its entire life cycle [35,36]. That also makes LCA a comparative tool for the environmental impact assessment of biomethane upgrading technologies. In this case, the boundaries of the considered process, including raw material extraction, transportation, processing, distribution, use, and disposal, should be defined [34]. An LCA of biomethane production can also help to determine the environmental benefits and potential trade-offs of biomethane compared to other energy systems. Several recent studies have conducted LCA of biomethane production from different organic waste substrates, such as bread waste, food waste and sewage sludge, and compared the performance of different biomethane production pathways, such as biogas upgrading to bioethanol and biomethane [14,37,38,39,40], and even direct use of biogas and biomethane as a fuel [41]. These studies have considered the environmental benefits and trade-offs of biomethane production, such as reduced GHGs, improved waste management, and reduced dependence on fossil fuels, as well as the environmental impacts of biomethane production, such as energy use, nutrient losses, and emissions to air, water, and soil. The results of these studies have shown that biomethane production from organic waste can have significant environmental benefits compared to the baseline scenario of fossil fuel use, such as reduced GHGs and improved waste management [42,43]. It is still possible to find studies that have been investigating the environmental performance of AD systems in different regions under various conditions [44,45,46]. This undoubtedly shows a lasting interest in biogas production and puts it under scrutiny [47,48,49,50]. For example, a study by Bian R. et al. [51] evaluated the potential of biogas production from waste in China and found that AD could reduce GHG emissions compared to incineration and landfilling. Similarly, an earlier study by Jacobs A. et al. [52] evaluated the environmental impacts of biogas production from maise and sugar beet in Europe and found that AD’s environmental benefits depended on energy and nutrient recovery efficiencies. Furthermore, the CH4 concentration of biogas produced during AD has been identified as a critical parameter affecting the AD process’s energy balance and environmental performance [15]. Besides the direct reduction of GHG emissions by applying carbon capture technologies, biomethane production technologies also have a positive environmental impact as they prevent methane emissions, a greenhouse gas 25 times more powerful than CO2 [53]. According to statistical data, CH4 emitted into the environment amounts to 16% of GHG emissions. Agricultural activities, waste management, energy use, and biomass burning are the most significant sources of CH4 emissions in the world. So, biomethane’s use as renewable energy is widely claimed to mitigate global warming effects and reduce fossil fuel dependency. From this point of view, biogas and biomethane are considered promising options to reduce GHG emission problems since they can be produced from all kinds of feedstock in the agricultural sector and various organic solid waste streams. The potential of biomethane production from organic waste substrates has been investigated in different regions, including Europe, where renewable energy targets have been set to reduce GHG emissions and promote sustainable energy [52].
Despite the increasing interest in biogas production, biogas upgrading technologies, and biomethane production, there is very little research about the environmental impact of different methane concentrations in the biogas produced while upgrading it. We did not come across studies on the environmental assessment of biomethane production when biogas with different methane content is upgraded, especially when the methane content in biogas production plays a major role among other parameters [15]. It is also essential to consider the economic benefits of biomethane production because it can provide a new source of income for farmers and waste management facilities and create jobs in the biomethane production and distribution sectors. Using biomethane as a fuel can reduce dependence on imported fossil fuels and enhance energy security. In sum, biomethane production from organic waste has the potential to provide multiple environmental, economic, and social benefits. Policies and incentives that support the development of biomethane production and utilisation can help promote its widespread adoption and contribute to a more sustainable and resilient energy system [25,54]. So, it is important to carefully assess the environmental impacts of different biomethane production pathways to maximise the benefits and minimise the drawbacks.
Our research focused on a life cycle assessment of membrane-based biogas upgrading technology, comparing biomethane production with different methane concentrations in biogas. The LCA analysis provided a broader comprehension of the environmental impact of GHG emissions while applying biogas upgrading technology. The same or similar analysis, relying on our methodology, can also be applied to further investigations of the environmental impact created by other biogas upgrading technologies and all the results compared.
Our study aimed to provide valuable insights into the environmental implications of biomethane production, which can inform decision-makers about waste management and energy production policies. This paper presents comprehensive insights regarding the environmental impact of biomethane production, focusing on methane emissions and energy balance when biogas with variable methane concentrations is upgraded [55,56].
2. Materials and Methods
2.1. LCA Boundaries
The LCA boundaries determine processes to be considered per the selected FU. In our research, biogas upgrading has been chosen as the system’s primary function, and the system’s boundaries have been limited to the biogas processing system’s onsite construction and production phases. Therefore, we have incorporated the ‘gate-to-gate’ system boundary instead of ‘cradle-to-grave’ because we focused on the biogas upgrading technology only (compression, biogas separation and emissions). In our case, the LCA of the biogas upgrading system was applied to evaluate the permeable membrane biogas upgrading unit construction, biomethane production and maintenance (inputs and outputs) phases. The system expansion method was applied for functional equivalence of elementary flows in the biogas upgrading system. At the same time, the upstream processes associated with the upgrading system have been excluded due to data constraints. The LCA system boundary is shown in Figure 1.
Figure 1.
The simplified process diagram of the biogas plant with the LCA boundaries of the biogas upgrading system.
2.2. Functional Unit
In LCA research, the functional unit (FU) expresses the quantified function of the system to which all the inputs and outputs of the product system are normalised [57], and determining FU is a vital step of any life cycle assessment. Our research determined the FU to be 1 m3 of biochemically obtained methane (bioCH4) in the raw biogas production process. In this study, we focussed on two aspects of the biogas upgrading system: electricity consumption of the biogas upgrading unit and methane slip from the biogas upgrading process, when methane concentration in biogas varied in the range of 50–80% in steps of 10%. Impurities, such as H2S and water vapour, were neglected since they were almost permanently removed upstream in the biogas production stage, whether via prevailed technology-condenser an active carbon filter or other technologies [58]. The quality and composition of the biomethane we produced matched the local requirements for natural gas injection into the gas grid [59].
2.3. The Biogas Plant for Experiments
We performed our research in a low-scale biogas plant built for student education at the vocational training centre in Lithuania. The educational biogas plant consisted of a single dome-shaped anaerobic fermenter where biogas was produced and partially stored under the dome, a biogas dryer of water vapour condensing type, and an activated carbon filter for hydrogen sulphur removal. This plant runs as a cogeneration plant, providing up to 100 kW of electricity and 142 kW of heat power per hour. The three-stage membrane-based biogas upgrading system has been installed for the experiment and educational purposes of the training centre. Figure 1 shows a simplified process diagram of the entire system set.
2.4. Process Diagram of the Three-Stage Membrane Upgrading System and Its Working Principle
Figure 1 also depicts the process diagram of a simple and equipment-less setup of the three-stage upgrading system. The simplified upgrading system comprises a non-lubricated piston compressor for the biogas pressure increase to the appropriate operating pressure of 16 bar and a three-stage permeable fibre membrane set (one membrane of 3500 capacity and 50 CO2/CH4 selectivity at every stage). Thus, the membranes require clean gas; the gas filter of 0.001 µm was installed downstream of the compressor to protect the membranes from hard particles of active carbon dust not entering the membranes. In addition, the heat exchanger was installed because the compressor and compressed biogas needed to be cooled. The off-gas permeating the third membrane stage was vented to the atmosphere, and the upgraded biogas, as biomethane, was redirected to the cogeneration plant.
Gas separation membranes work according to the principle of selective permeation through the membrane surface. The selectivity parameter represents the permeability ratio of the faster permeable gas to the slower permeable gas. The permeating rate of each gas depends on its solubility in the membrane material and the gas diffusion rate. Gases with high solubility and small molecules pass through the membrane very quickly. Less-soluble gases with larger molecules take more time to permeate the membrane. In addition, different membrane materials separate differently, and membrane selectivity also determines the energy needed to support gas separation [60,61]. The driving force needed to separate gases is achieved using a partial pressure gradient. In the case of biogas upgrading, carbon dioxide and CH4 are separated. Carbon dioxide permeates through the membrane very quickly, while methane tends to be held back. The separation capability through the membrane is unaffected by process conditions, even with partial pressures, which is the case in biogas upgrading. In our experiment, we set 16 bar pressure because the upgrading unit requires fewer membranes and performs better under higher pressure. This pressure limit was also set because of the country’s natural gas pipe installation requirements for urban areas [59]. The membrane-based biogas upgrading process is smooth and continuous. At first, compressed biogas enters the first-stage membrane unit, where mostly CO2 gas and some CH4 gas permeate the fibre’s films of the membrane. The retentate gas, consisting of a high concentration of CH4 and a bit of CO2 gas, further enters the second-stage membrane unit, where CO2 gas only permeates a membrane and almost pure CH4 gas reaches the membrane outlet. The permeated CO2 gas from the first membrane stage enters the third stage membrane unit, where it finally permeates the fibre’s films and is emitted to the atmosphere as off-gas. The retentate gas from the third stage and the permeate gas from the second stage recirculate to the compressor. Depending on membrane characteristics and operation conditions, the emitted off-gas contains a small amount of CH4 gas residue. In our research, we controlled the CH4 concentration in the emitted off-gas. The limit of 0.5% of the entire CH4 amount in biogas was set and kept by a control system. The CH4 concentration in the biomethane was set and controlled at >96.5%.
2.5. Measurements and Instruments
The biogas flow was measured continuously with a FOX THERMAL FT1 DN40 mass flowmeter (Fox Thermal, Marina, CA, USA, measurement accuracy: ±1.5% of reading ±0.5% of full scale). The biomethane flow was measured continuously with a FOX THERMAL FT1 DN25 mass flowmeter (Fox Thermal, Marina, CA, USA, measurement accuracy: ±1.5% of reading ±0.5% of full scale). The biogas and biomethane concentrations were measured continuously with an AWIFLEX multichannel analyser (Awite Bioenergie, Langenbach, Germany; measurement range and accuracy: CH4 0–100%, ±0.2%; CO2 0–100%, ±0.2%; O2 0–25%, ±0.2%). The electricity consumption of the biogas upgrading unit was measured continuously with a ULYS TD80 ETHERNET energy meter (CHAUVIN ARNOUX ENERGY, Antony, Cedex, France, measurement range and accuracy: active energy class B in compliance with EN 50470-3 [62]).
2.6. Biogas Preparation for the Experiments
In our research, we performed four experiments at the biogas plant and collected the data for the life cycle assessment of the biogas upgrading system. The biogas plant produces biogas out of milk whey and a small amount of meat processing residues (up to 2% of the fermenter’s daily feeding dose). The capacity of biogas produced depends on the feedstock supply. The biogas plant had the highest production on regular working days, but production dropped on days off because the farm staff could not feed the fermenter smoothly throughout the week. For this reason, the biogas production varied from 38 Nm3/h up to a nominal biogas plant capacity of ~50 Nm3/h. The biogas produced consisted of 50% CH4 on average. This CH4 content in biogas composition was taken as a reference for our investigation.
The biogas composition with a higher CH4 content for the experiments was prepared in the upgrading unit. At the entry of the biogas upgrading unit, the biogas produced in the biogas plant was blended with some share of upgraded biogas taken from downstream of the upgrading unit (Figure 1). The biogas conditioning line was installed for that purpose. The blended biogas flow was kept constant at 35 Nm3/h. This flow value of biogas was chosen considering the biogas plant’s minimal capacity to provide a stable and reliable biogas flow to the biogas upgrading system for all the experiments’ performance under the same flow conditions. Four experiments were performed with methane contents in biogas of 50%, 60%, 70%, and 80% and named CM-50, CM-60, CM-70, and CM-80, respectively. Table 1 shows the measured input parameters of the biogas upgrading unit, and Table 2 shows the measured output parameters of the biogas upgrading unit.

Table 1.
Measured input parameters of the biogas upgrading unit.
Table 2.
Measured output parameters of the biogas upgrading unit.
The performance efficiency of the membrane-based biogas upgrading system was analysed by measuring the methane concentration upstream and downstream of the upgrading unit. The specific electricity consumption for biogas upgrading was counted, and methane slip with off-gas was considered the main and determining source of emissions. The upgraded biogas has then been compressed, stored, and used onsite as transport fuel.
2.7. LCA Technique
Life cycle assessment has been employed for the analysis of the environmental evaluation of this real-scale membrane-based biogas upgrading system following ISO 14044 [63]. The LCA was conducted following the environmental impact categories using the CML-I baseline model [64]: Abiotic depletion, Abiotic depletion (fossil fuels), Global warming (GWP100a), Ozone layer depletion (ODP), Human toxicity, Freshwater aquatic ecotoxicity, Marine aquatic ecotoxicity, Terrestrial ecotoxicity, Photochemical oxidation, Acidification and Eutrophication. The Primary Energy demand from renewable and non-renewable resources, specified by Ecoinvent as Cumulative Energy Demand (CED) (Swiss Centre for Life Cycle Inventories, 2009), was determined based on the composition of the ENSTO energy mix [65]. Four major steps of LCA were conducted: goal and scope determination, inventory analysis, impact assessment, and an interpretation of the results phase. The SimaPro 8 LCA Software, developed by Pre’ Consultants BV, Amersfoort, Netherlands, was used to identify the product system’s environmental impact [66]. Our study analysed the methane slip in a biogas upgrading plant based on three-stage permeable membrane technology, expecting a reduction of the environmental footprint.
2.7.1. Goal and Scope
The goal of applying LCA in our study was to take a critical view of identifying and evaluating the life cycle environmental impacts of a biogas upgrading unit when biogas yield is permanent but CH4 content in biogas changes. The electricity consumption and gas emissions with off-gas flow from the biogas upgrading plant were initially measured, and later the collected data were compared. The study scope ensured that life cycle assessment was performed consistently, upholding our focus on the analysis of environmental loads caused by a modern membrane-based biogas upgrading system and considering a holistic view of operational expenditures such as energy balance and GHG emissions for a bioCH4 production unit obtained from raw biogas.
2.7.2. Life Cycle Inventory
The Life Cycle Inventory (LCI) comprises the system inventory, considering everything within a described biogas upgrading boundary for LCA. The LCI, as described in Table 3, shows the features with the quantitative terms against the selected functional unit. The activity data were quantified for 15 years by 8200 h/year, including operation and maintenance energy consumption, emissions, upgrading capacity, membrane lifetime, and yearly production. The biomethane production process includes electrical energy for biogas compressing and cooling. Ecoinvent v3 [67] has been used for the unit process datasets. Inventory input data for the investigated biogas conversion experiments were modelled by introducing the specific values of energy and material requirements as well as the specific biomethane yields [68]. Regarding the emissions to the atmosphere from the biogas upgrading processes, it is considered that the direct emissions mainly depend on the treatment of biogas, where specific emissions (nitrogen oxides and sulphur oxide) originate from electricity production.
Table 3.
Inventory for FU of 1 m3 bioCH4.
3. Results and Discussion
3.1. Specific Electricity Consumption of Biogas Upgrading Unit
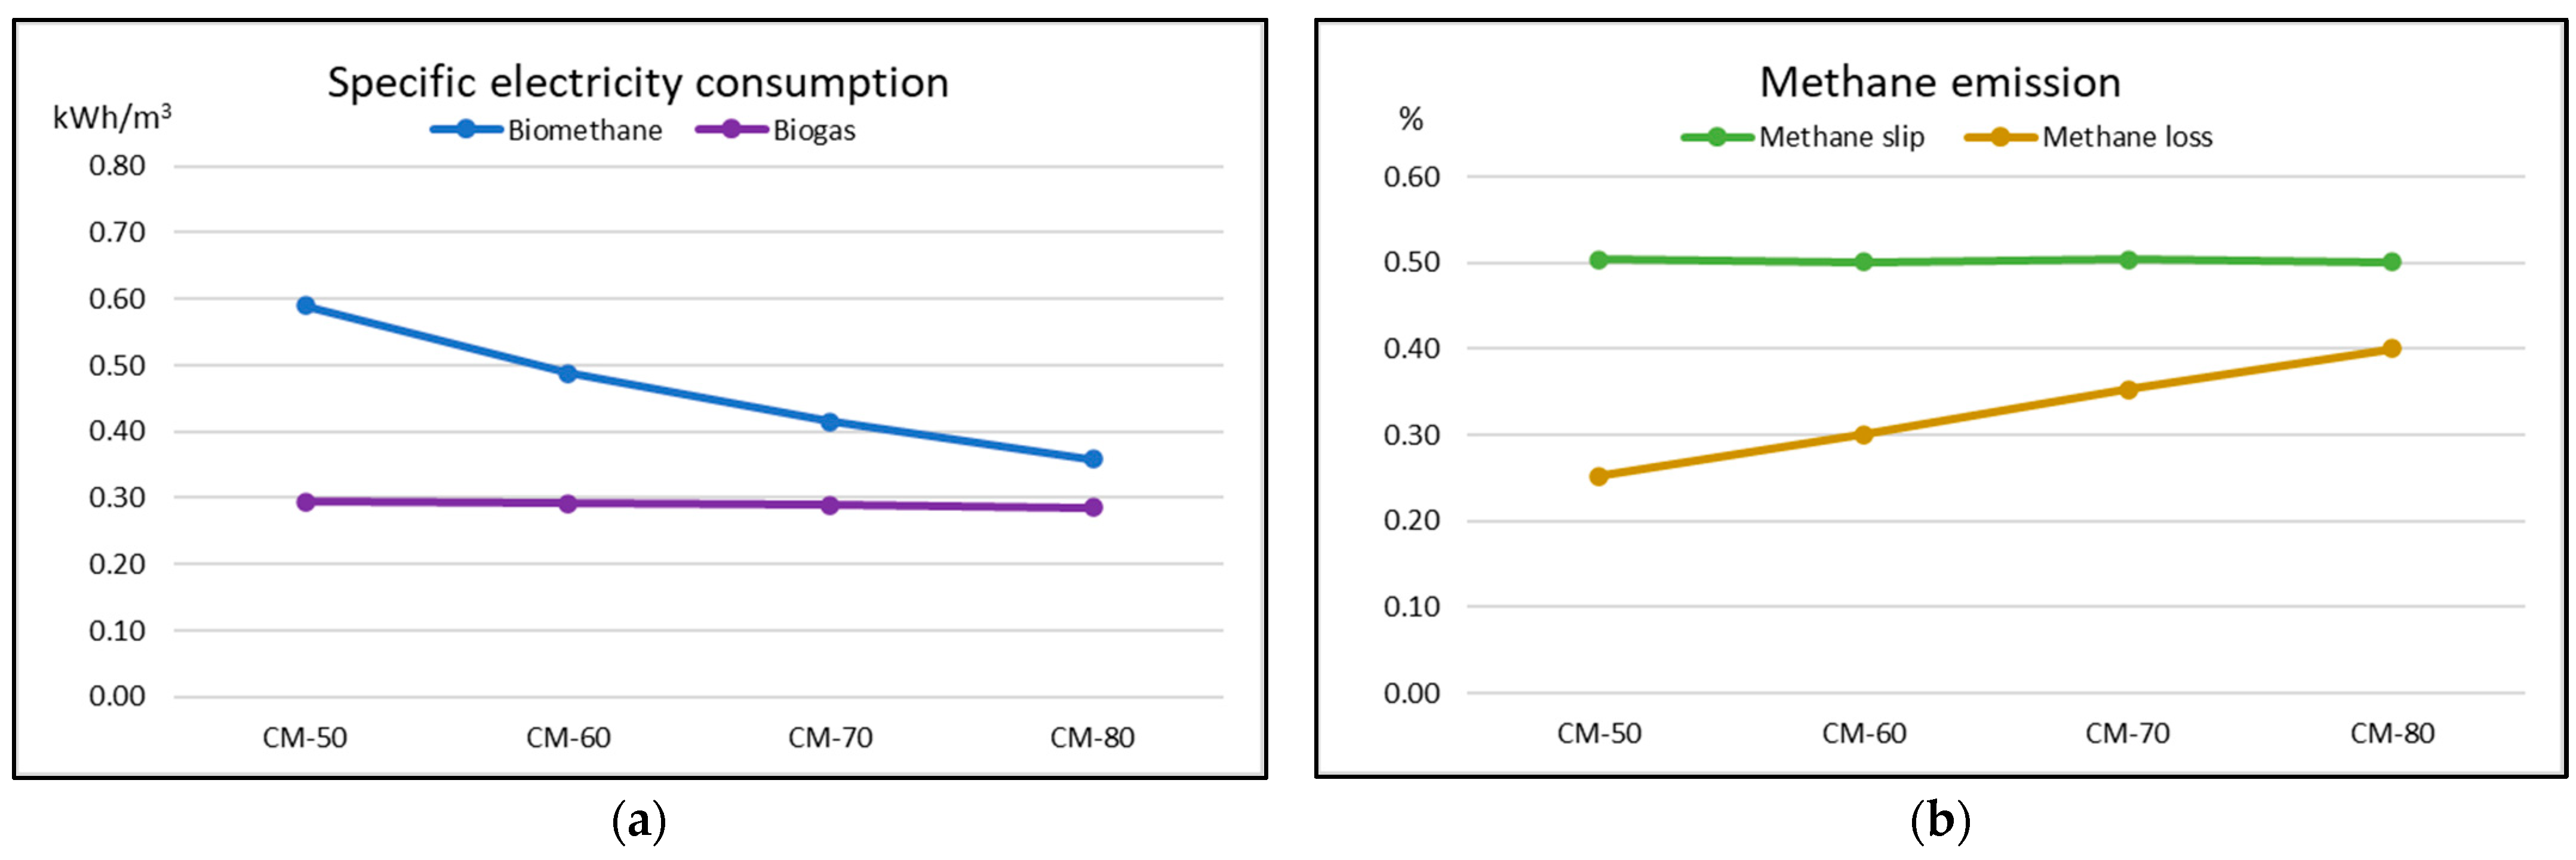
We conducted four continuous experiments with different methane concentrations in raw biogas by identifying and evaluating a biogas upgrading unit’s life cycle environmental impacts when biogas yield is permanent, but CH4 content in biogas varies. The life cycle assessment we performed had two parts. In the first part, we had to identify the main contributors to the environmental impact generated by the biogas upgrading plant based on hollow-fibre permeable membrane technology. The equipment, input and output flows, consumed resources, and environmental emissions were counted in this investigation phase for inventory evaluation. The second part was to compare the environmental impact of electricity consumption and methane slip in the membrane upgrading technology in terms of life cycle assessment. We considered these two contributors (electricity and methane slip) as the main contributors and investigated their changes when biogas with different methane content was upgraded. The electricity consumption and gas emissions with off-gas flow from the biogas upgrading plant were initially measured, and later the collected data were compared. According to the methodology, all other biogas upgrading parameters were stable, monitored and controlled by the biogas upgrading plant control system throughout the entire experiment. Figure 2 shows electricity consumption and the methane emission with off-gas at different methane concentrations in raw biogas in experiments CM-50, CM-60, CM-70, and CM-80 when the biogas flows to the biogas upgrading equipment were constant in all experiments.
Figure 2.
Methane losses with off-gas and electricity consumption at different methane concentrations in raw biogas: (a) change in electricity consumption, (b) change in methane emission.
The electricity measurement results (Figure 2a) showed that the increasing methane concentration in the biogas did not influence the electricity consumption of the investigated biogas upgrading technology under the investigation conditions. The electricity consumption was relatively stable in all the experiments, showing a slightly decreasing tendency when considering specific electricity consumption. This consumption was 0.294 kWh per one Nm3 of raw biogas upgraded in experiment CM-50 and varied in other experiments in the range of 0.292–0.286 kWh per one Nm3 of raw biogas upgraded. It is in the range of a similar study on biogas upgrading [69]. However, the specific electricity consumption of FU (1 m3 of bioCH4 obtained from raw biogas) shows that electricity consumption decreased while the methane concentration (Figure 2b) in raw biogas increased. The reduction in specific electricity consumption was 17.3%, 15.0% and 13.5% in every next experiment: CM-60, CM-70 and CM-80, respectively. Such a decrease in electricity is a good sign because lower energy consumption for biomethane production positively impacts the environment and reduces global energy demand. An analysis of the literature on electricity consumption in biogas upgrading showed that there are several studies where authors investigate and compare the electricity consumption of different biogas upgrading technologies. L. Lombardi and G. Francini [70] performed a study on five biogas-to-biomethane upgrading technologies where electricity consumption was analysed: high-pressure water scrubbing, amine scrubbing, potassium carbonate scrubbing, pressure swing adsorption, and membrane permeation. The authors collected all the data for their study from real-scale biogas upgrading plants and calculated the specific electricity consumption related to 1 m3 of biogas. The results of membrane permeation technology were very similar to those of our investigation. According to the authors, 1 m3 of biogas upgraded requires 0.2–0.3 kWh of electricity at a methane slip of 0.5% and a methane concentration in biogas ~55%. Each year the mix of energy used for electricity production utilises an increasing amount renewable energy [71,72,73,74]. Therefore, the share of methane emissions from electricity production will decrease further. However, the results of the investigated biomethane production system are still very highly dependent on non-renewable energy sources.
3.2. Methane Loss of Biogas Upgrading Unit
The results of the experiments on methane losses showed an increase in methane loss when the methane concentration in raw biogas has been increasing (Figure 2b). Every step of the increased methane concentration in biogas by 10% influenced an increase in methane loss with off-gas when we count methane loss related to the biogas used for biomethane upgrading. In experiment CM-60, the methane slip rose by 19.3%, in experiment CM-70 by 17.1%, and in experiment CM-80 by 13.8%. This methane loss could be predicted because it relates to the permeable membrane’s physical characteristic-selectivity, i.e., its ability to separate two gas components [75]. Selectivity is also treated as a material feature of the polymer. If a higher methane concentration is present in the gas mixture, more methane permeates the membrane surface and goes out with off-gas, harming the environment. According to L. Lombardi and G. Francini’s [70] research on real-scale biogas upgrading plants, methane slip varies from 0.1% up to 5% depending on the upgrading technology used and biogas source. The authors evaluated the methane loss as a loss of methane content in raw biogas, and the methane slip of membrane separation was counted at an average of 1.0%. In our research, the methane slip of 0.5% was set as a value to be monitored and controlled in every experiment. So, in this case, in our investigation, the biogas upgrading plant was operated in methane slip freeze mode, allowing constant methane slip for FU. However, even with low methane slip, according to Torben Kvist and Nabin Aryal [76], methane loss is a common flaw for many biogas upgrading technologies. For example, water scrubber-based plants demonstrate higher CH4 loss, whereas amine-based technology ensures a lower loss. Among the upgrading plants, membrane and amine-based technologies guarantee fewer CH4 losses but show higher methane concentrations in biomethane than water scrubber-based technologies.
Nevertheless, methane emissions from biogas plants have been intensively investigated in order to control the possible emissions. The Intergovernmental Panel on Climate Change (IPCC) proposed a tentative static method to estimate CH4 emissions [77]. So far, the methane loss from the gas-producing facility of the biogas plant (not taking into account biogas utilisation and open or not gastight-covered digestate storage tanks) is assumed to be 1% CH4 associated with the overall CH4 production rate from the biogas plant [78]. Therefore, regular monitoring of CH4 emissions is necessary to control the emissions and make biogas plants environmentally friendly.
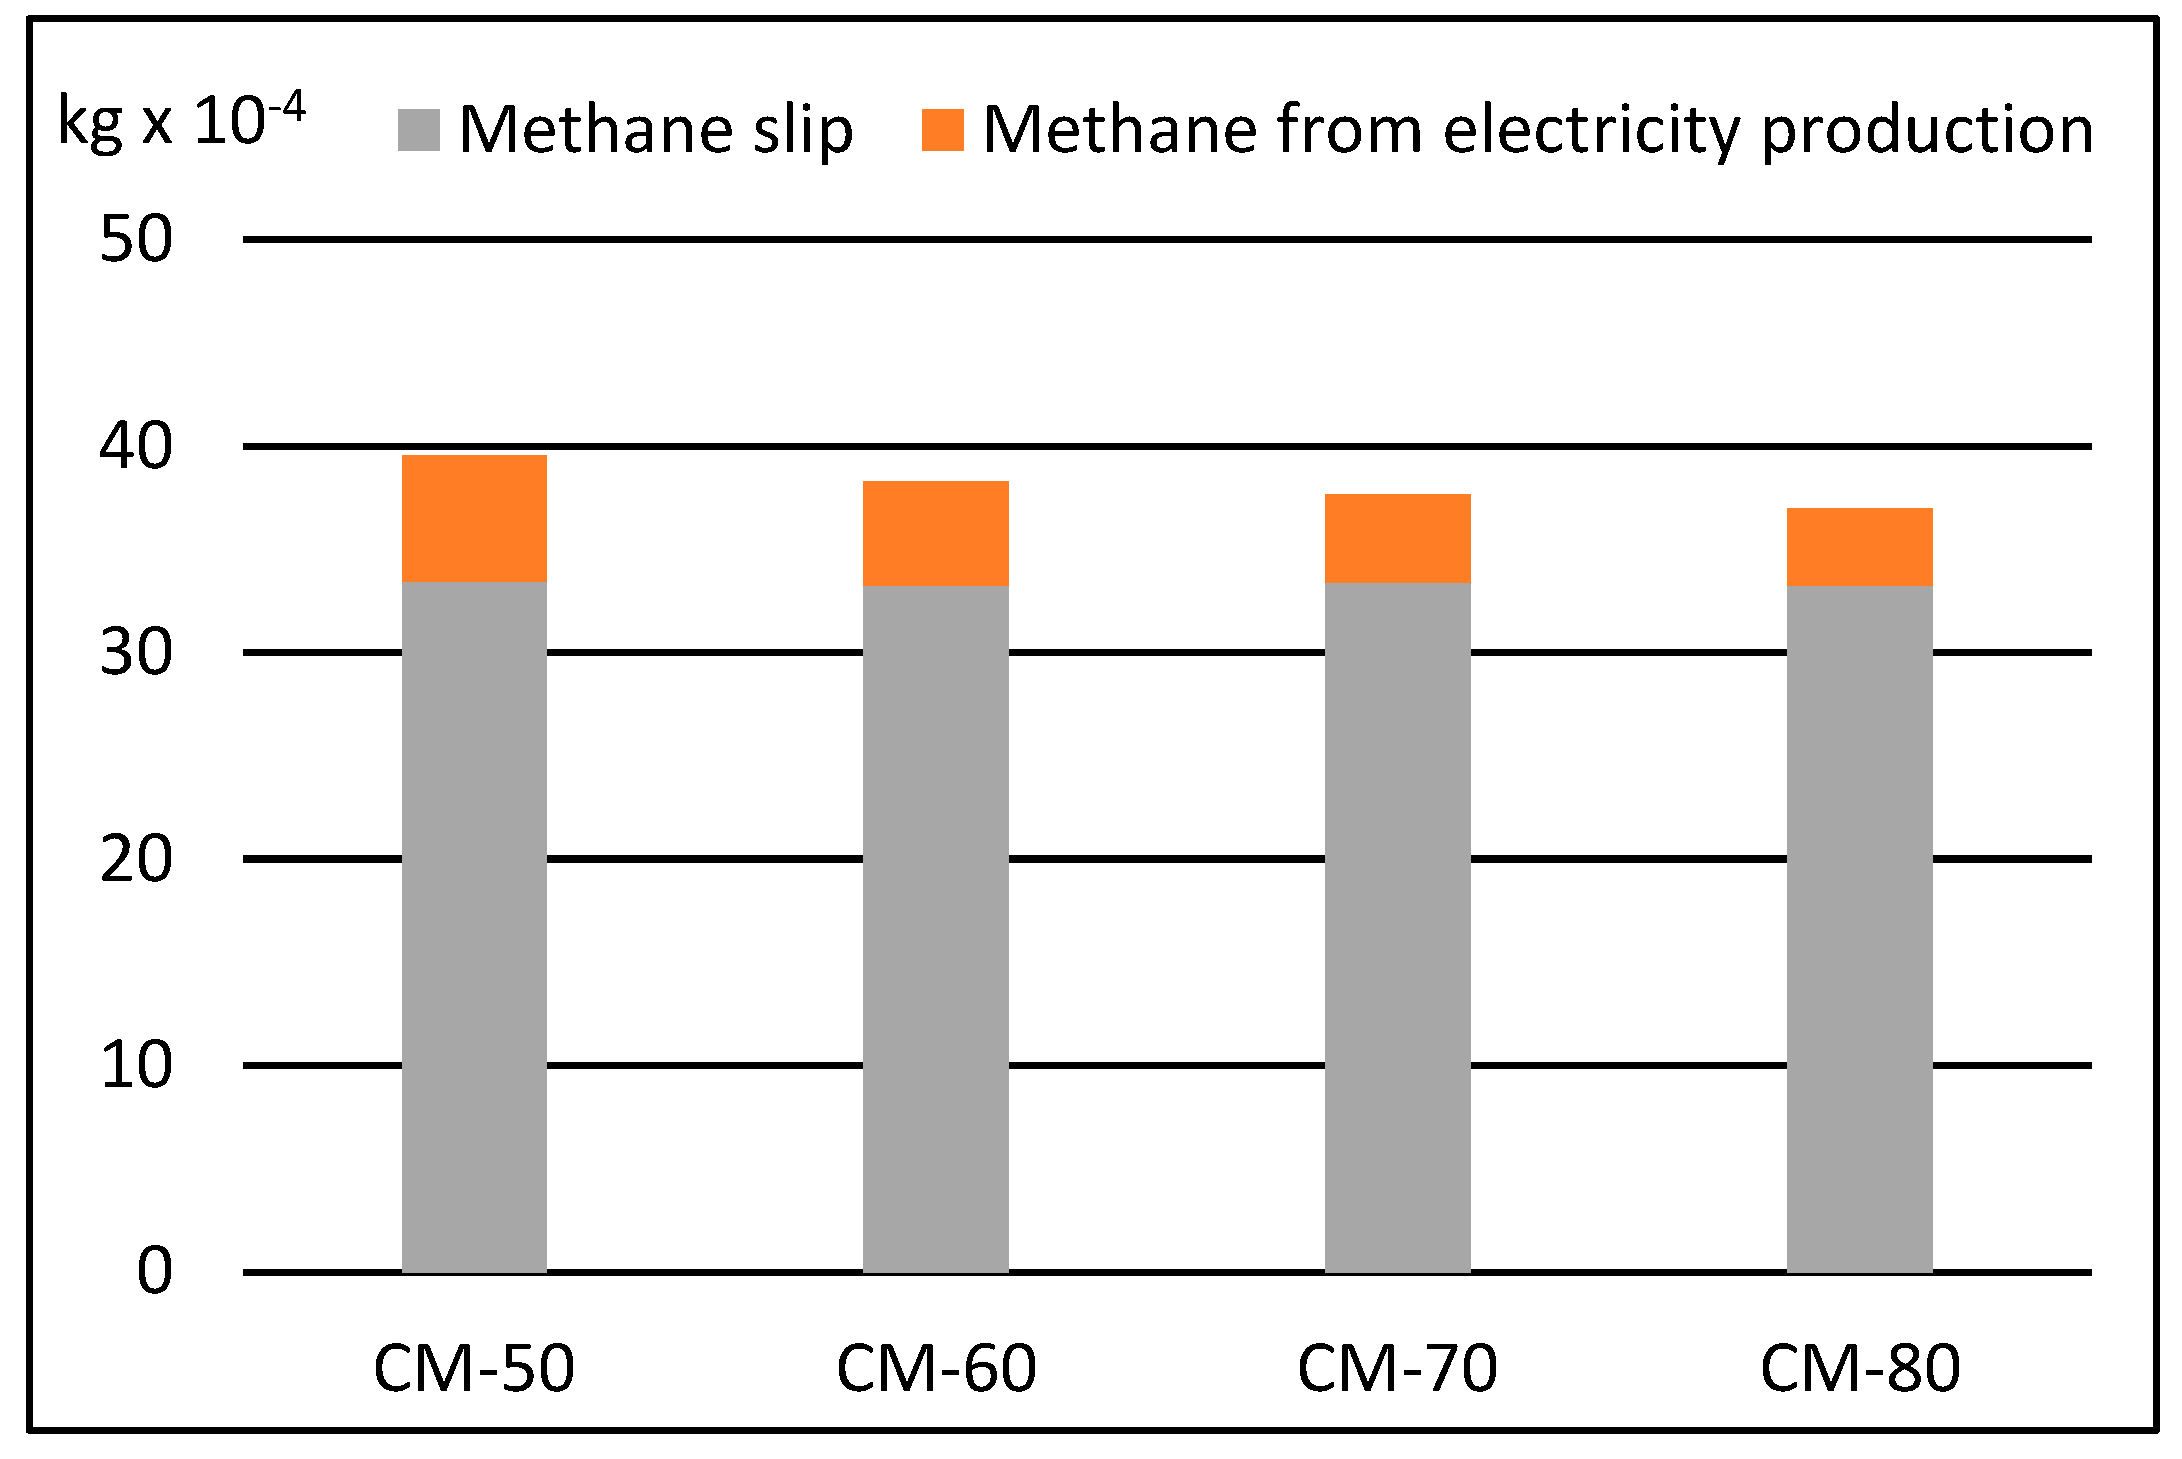
According to an inventory evaluation of LCA, the calculation of the cumulative methane emissions included methane slip and methane emissions from all the equipment manufacturing and energy production processes. Figure 3 illustrates the breakdown of methane losses at different methane concentrations in raw biogas.

Figure 3.
The breakdown of total methane emission at different methane concentrations in raw biogas.
This cumulative methane emission was counted for a FU of 1 m3 of the bioCH4 potential in raw biogas. However, we evaluated the total methane emissions to the atmosphere for two shares: the emissions from methane slip and the emissions from electricity production, because methane emissions from other processes were more than 1000 times less and did not influence cumulative methane emissions. We made this decision based on a similar LCA evaluation performed by C. Florio et al. [79], where the authors took into account input flows with an even higher cut-off of 4%. Meanwhile, in our investigation, we applied a cut-off of 0.1%, considering it to be more accurate in further impact assessment calculations. The breakdown of the methane emissions showed that the methane emissions share from electricity production varied with a decreasing tendency depending on the methane concentration in biogas. Being at a share of 15.4% in experiment CM-50, the methane loss dropped in experiment CM-80 and consisted of 10.0%, while the methane concentration in the biogas increased from 50% to 80%. In contrast, the emission with methane slip was constant and did not depend on methane concentration in raw biogas. So, methane slip is a significant variable to consider in sustainable biogas upgrading technology. The system’s boundaries can be expanded to explore this variable further, including the biogas production of the anaerobic digestion process.
3.3. Life Cycle Assessment of the Biogas Upgrading
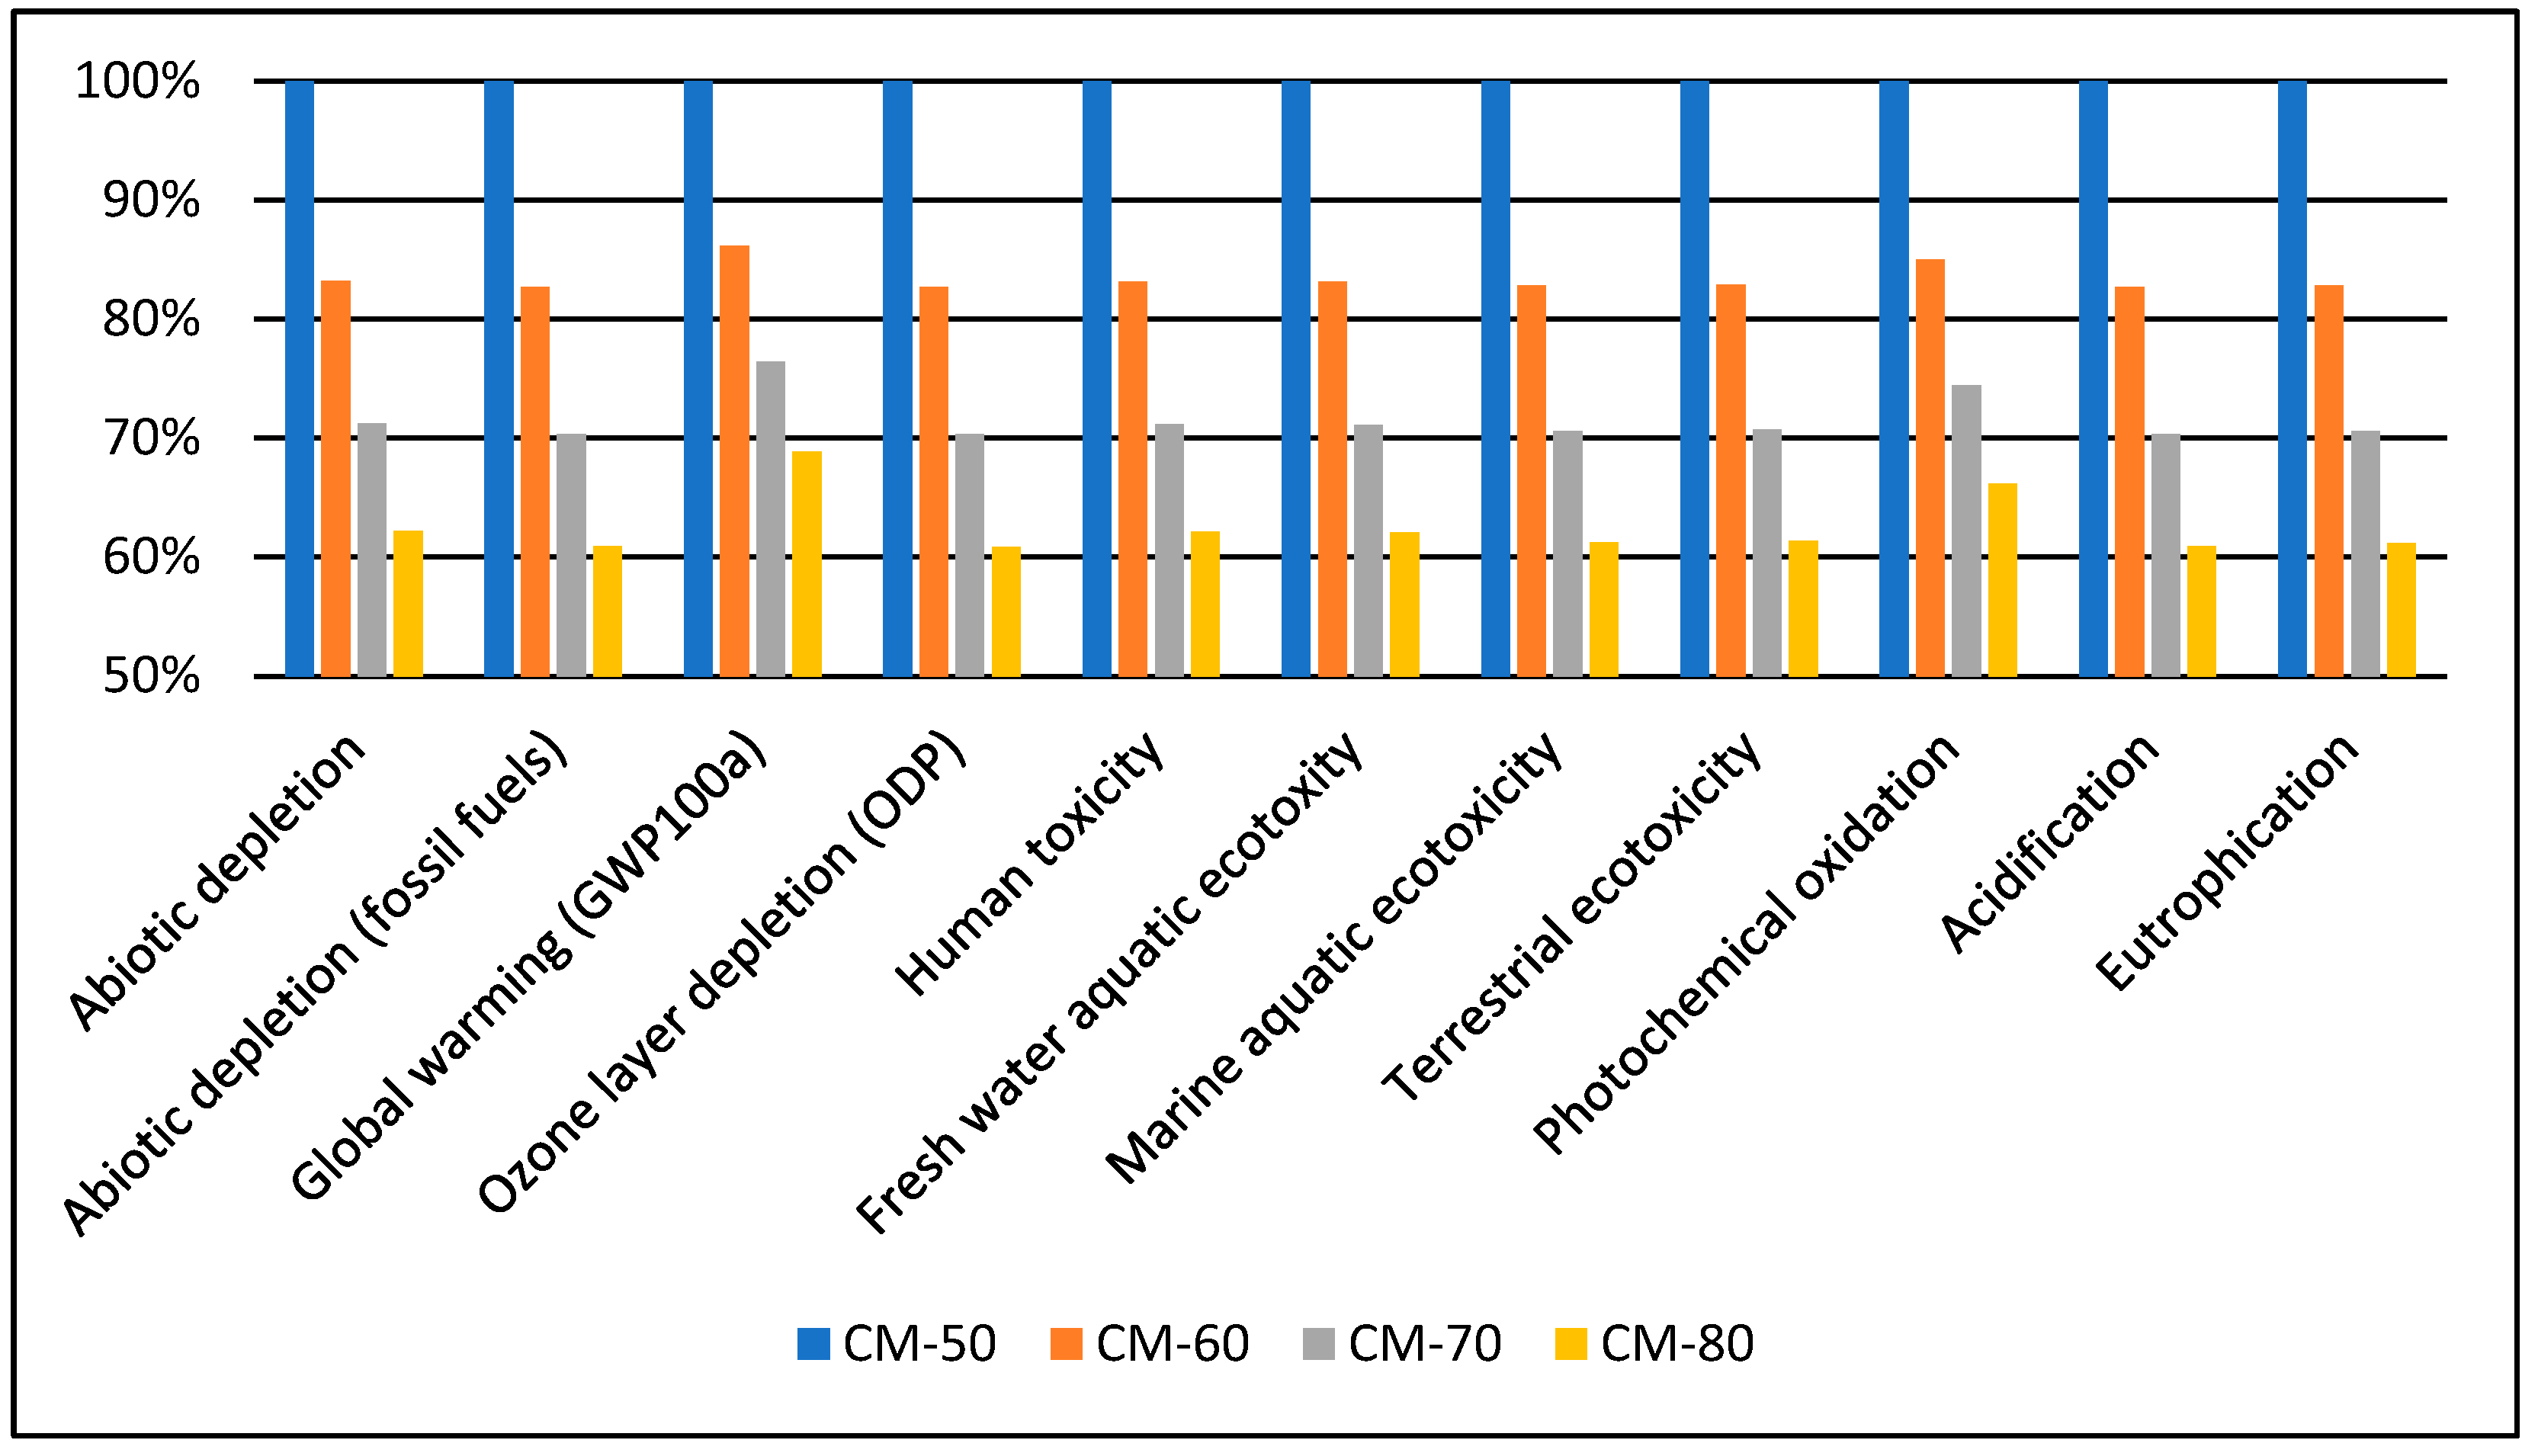
The biogas upgrading experiments are compared in eleven environmental impact categories (Table 4 and Figure 4). Table 4 shows the total impacts evaluated in impact categories for the different methane concentrations in raw biogas, referring to a functional unit of 1 m3 of bioCH4 (or total methane potential in biogas). The biogas upgrading process impacts every category, and these impacts drop in every subsequent experiment when the methane concentration in raw biogas rises. In terms of numbers, the impact categories show considerable differences, so the diagram of the higher impact of 100% for every category was applied (Figure 4), allowing a better understanding of comparing the numbers with very different decimal multipliers.
Table 4.
The total impacts in impact categories for the different methane concentrations in biogas.

Figure 4.
The changes in impact categories for the different methane concentrations in raw biogas. The highest impact for a category = 100%.
The impact of 100% is related to experiment CM-50. Every subsequent experiment shows a positive influence on every impact category when the methane concentration in raw biogas increased. The impact’s largest decrease of more than 39% was seen in the categories of abiotic depletion (fossil fuels), ozone layer depletion (ODP), and acidification. The impact’s lowest decrease was assessed in the categories of global warming (GWP100a) and photochemical oxidation, dropping by 31% and 34%, respectively. It is not easy to compare the results with other studies because of the different LCA boundaries the researchers apply for their studies and because a different inventory is considered [70,80]. Recognising the advantage of membrane separation, C. Florio et al. [79] summarised the ReCiPe Midpoint (H)-characterised impacts calculated for the different upgrading technologies based on chemical and water scrubbing, cryogenic separation, membrane separation, and adsorption of adsorbent materials. In this comparison, the authors concluded that the membrane separation technology generates the lowest impacts on all the investigated categories among the upgrading technologies. In contrast, the other biogas upgrading technologies cause higher impacts on global warming and fossil resource depletion. A breakdown of the impacts of reference experiment CM-50 and final experiment CM-80 is provided in the next section to obtain a clearer understanding of each component’s impact on the processes.
3.4. The Inventory Breakdown and Its Impact on Categories
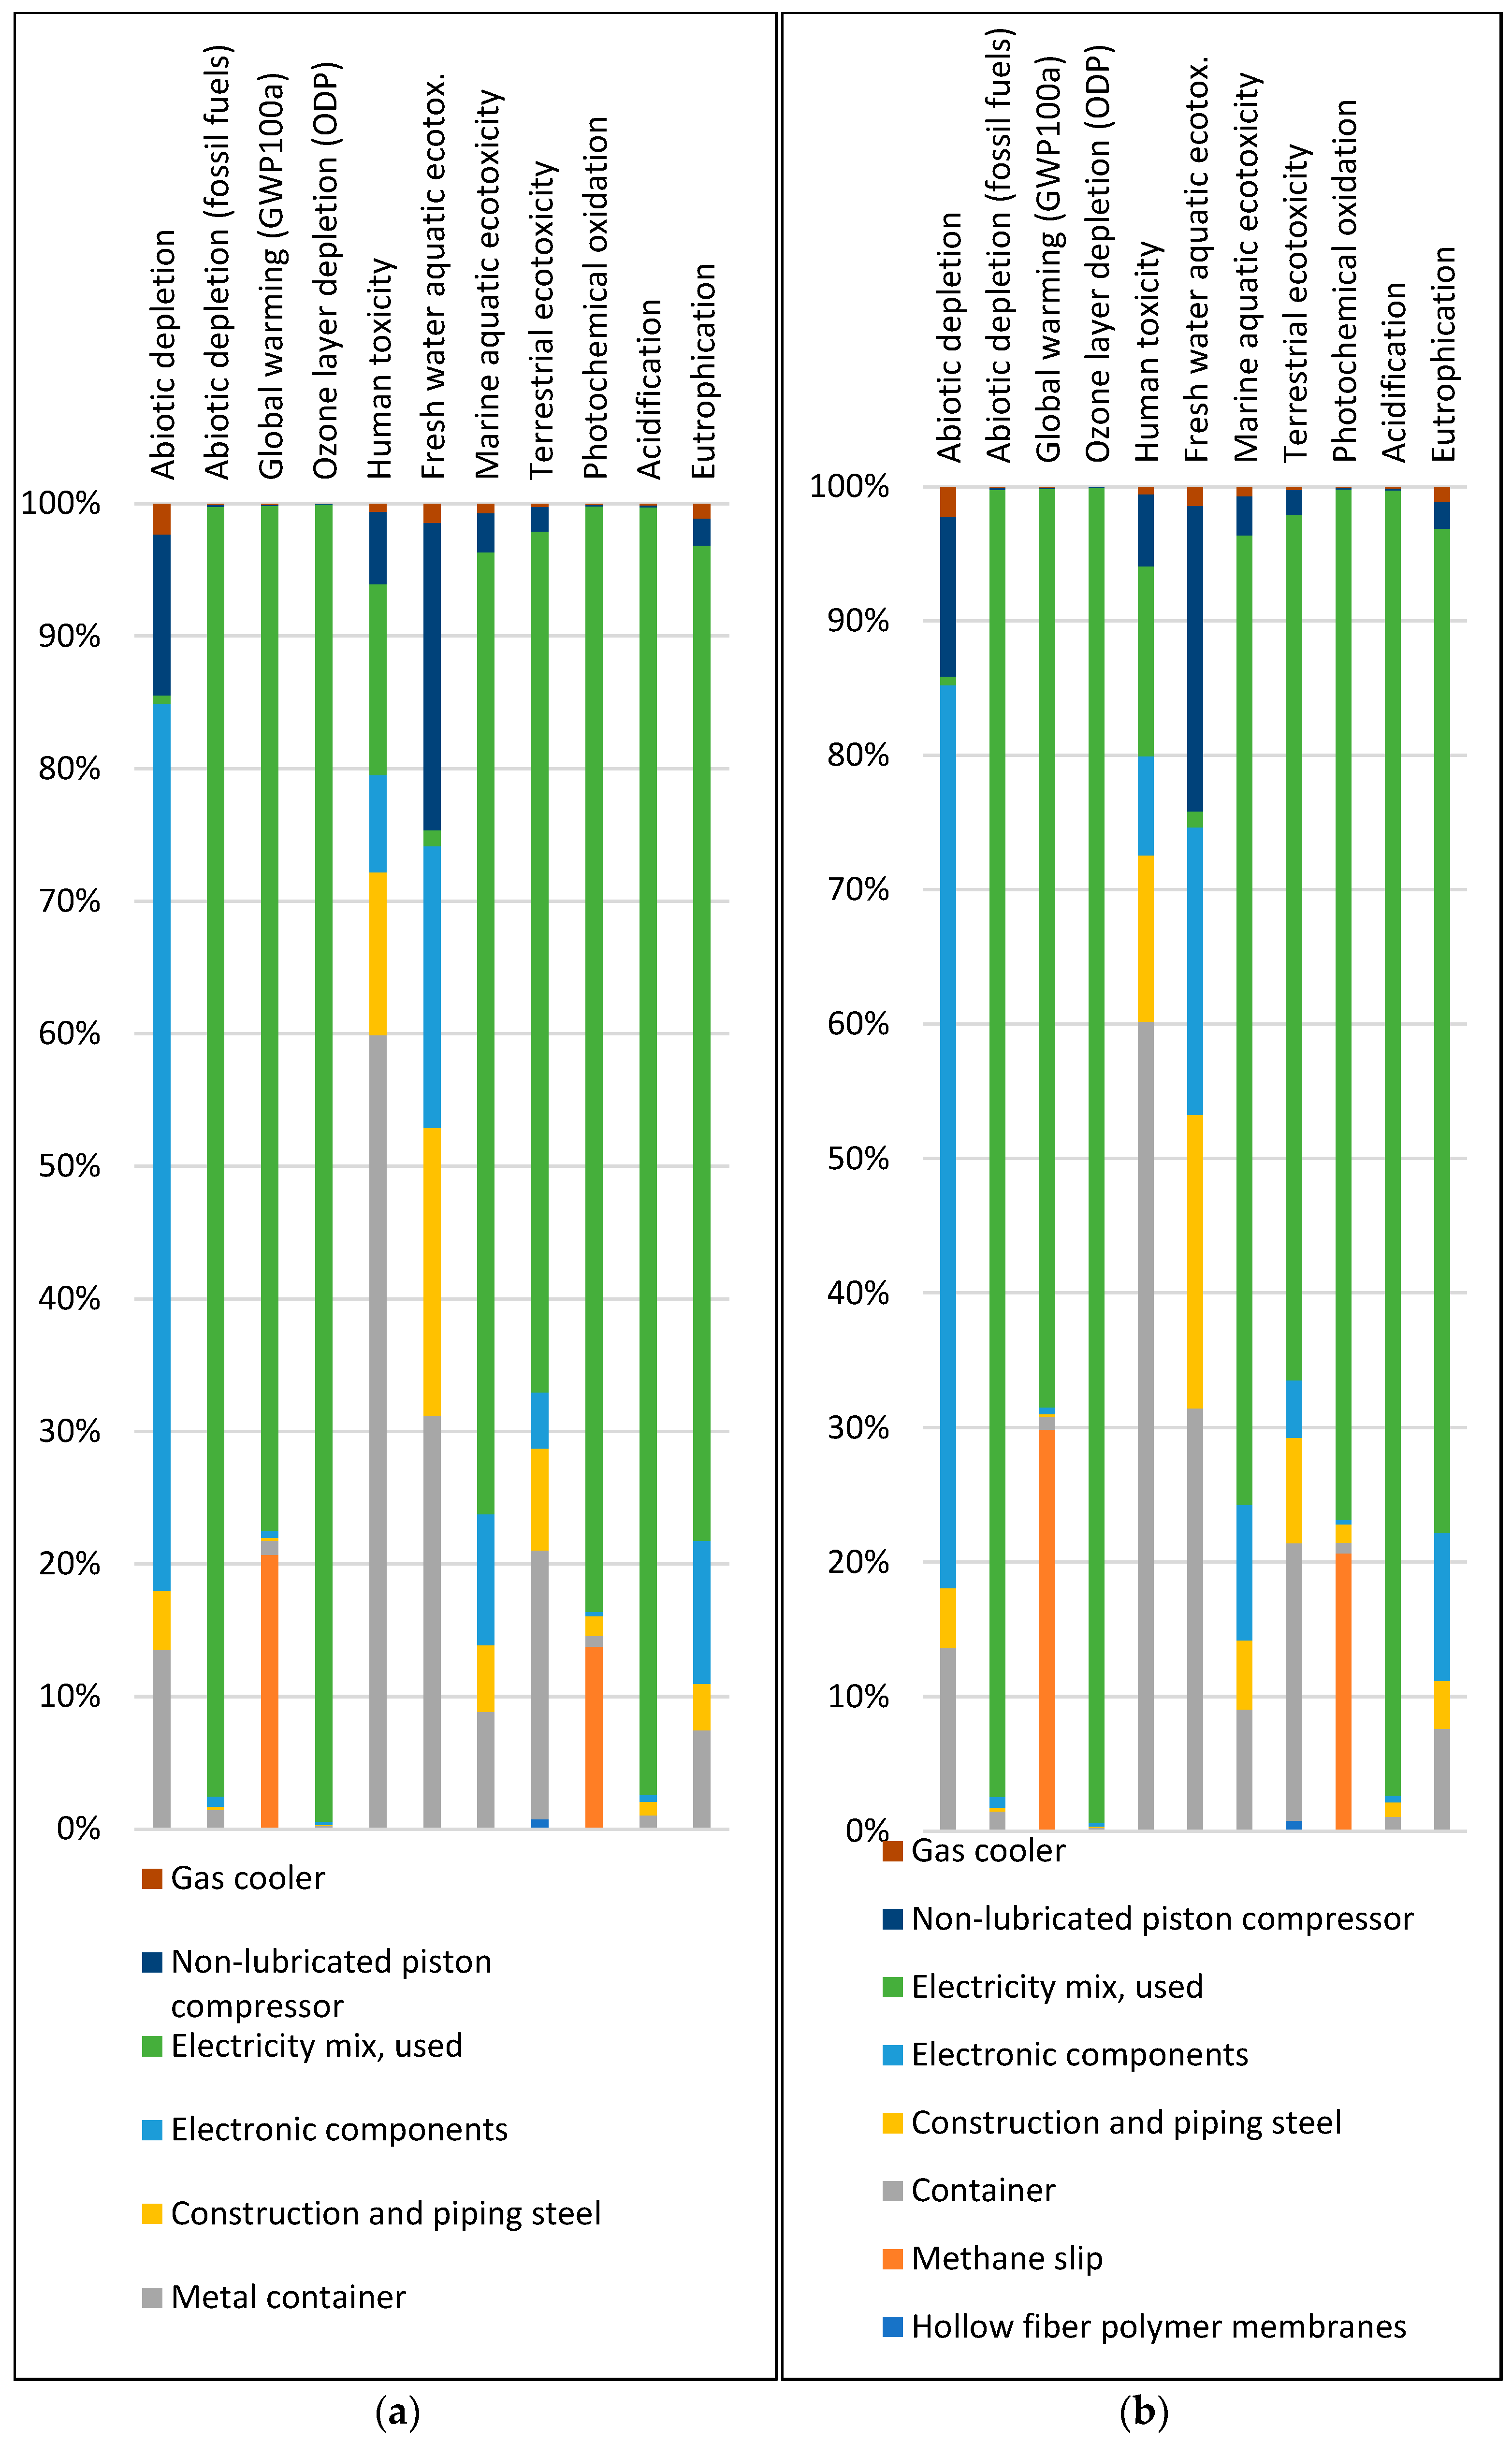
The inventory breakdown in every impact category of the CM-50 experiment can be seen in Figure 5a, and the inventory breakdown in every impact category of the CM-80 is depicted in Figure 5b.
Figure 5.
(a) The inventory breakdown of CM-50; (b) The inventory breakdown of CM-80.
The results of the life cycle assessment in both experiments showed that for 8 out of the 11 analysed categories, the parameter of electricity consumed stood out significantly. The highest impact above 97% was found in the categories of abiotic depletion (fossil fuels), ozone layer depletion, and acidification. In the categories of global warming, marine aquatic ecotoxicity, terrestrial ecotoxicity, photochemical oxidation, and eutrophication, electricity impacts were a bit lower but varied between 60 and 80%. All those categories are subject to electricity produced from a large share of fossil fuels. C. Florio et al.‘s study on different biogas upgrading technologies [79] also concluded that for their investigated production system, despite even being based on biomass, the results are still very highly dependent on non-renewable energy sources. This is because biomass must be processed and transported to the destination points where it is used up, and these processes still require non-renewable energy. Although non-renewable sources are used, it is optimistic that the impact of electricity will decrease because an ongoing transfer from fossil fuels to renewable energy will mitigate the impact of electricity production in existing biogas upgrading systems [71]. Meanwhile, methane gas emitted into the atmosphere is the primary contributor in only two categories: global warming and photochemical oxidation, where electricity also plays a role. The results show that electricity and methane emissions acted in opposite directions, showing that electricity consumption for biogas upgrading relatively decreased, while methane slip increased when methane concentration in raw biogas rose. Despite the increase in methane slip, the total impact of both shares dropped in experiment CM-80, showing the positive impact of increasing methane concentration in raw biogas on global warming and photochemical oxidation categories for permeable membrane upgrading technology. The infrastructure (compressor, gas cooler, container, construction, piping steel, and electronic components) impacted with lowering tendencies on the impact categories because they were only related to rising methane concentrations in raw biogas. The most significant factor in the impact of the infrastructure came from the electronic components used for the manufacturing of biogas upgrading equipment.
Finally, the results show that improving biogas production by increasing methane concentration could help reduce the overall impact of biogas upgrading technology based on hollow fibre permeable membrane biogas upgrading technology.
4. Conclusions
This research, conducted in a real-scale biomethane production plant, allowed us to evaluate the environmental impact of biogas upgrading technology based on permeable membrane separation under conditions when biomethane is produced from biogas with different methane concentrations.
The results showed that the increasing methane concentration in the biogas when the same biogas flow was treated actually did not influence the electricity consumption of the investigated biogas upgrading technology but increased methane slip with off-gas. Despite the higher methane emissions to the atmosphere, the LCA showed a positive environmental impact for treating biogas with increasing methane concentrations. This benefit was reached because more biomethane was produced while treating the same amount of biogas. The environment will gain more credits in the future if the ongoing replacement of electricity obtained from fossil fuels with electricity obtained from renewable energy sources takes place. Further investigations could be carried out on other prevailing biogas upgrading technologies to assess the environmental impact of increased methane concentrations in raw biogas. It would fill the gap in knowledge about the environmental impact of higher methane concentrations in biogas for biomethane production technologies and provide us with more parameters regarding sustainability while choosing biogas upgrading technologies. The results of our research can also be helpful for the economic assessment of methane emissions, especially when it comes to releasing financial support programmes for bio-methane production related to the reduction of GHG emissions.
Author Contributions
Conceptualization, K.V., K.N. and E.B.; methodology, E.B.; investigation, E.B.; resources, E.B. and K.V.; writing—original draft preparation, E.B.; writing—review and editing, K.V. and K.N. All authors have read and agreed to the published version of the manuscript.
Funding
This research received no external funding.
Institutional Review Board Statement
Not applicable.
Informed Consent Statement
Not applicable.
Data Availability Statement
The data presented in this study are available on request from the corresponding author.
Acknowledgments
The authors acknowledge the support received from Vytautas Magnus University, Agriculture Academy.
Conflicts of Interest
The authors declare no conflicts of interests.
References
- CO2 Emissions in 2023—Analysis. Available online: https://www.iea.org/reports/co2-emissions-in-2023 (accessed on 14 March 2024).
- IPCC Report on Climate Change 2022: Mitigation of Climate Change. Available online: https://www.ipcc.ch/report/sixth-assessment-report-working-group-3/ (accessed on 14 March 2024).
- Cabernard, L.; Pfister, S.; Hellweg, S. Improved Sustainability Assessment of the G20’s Supply Chains of Materials, Fuels, and Food. Environ. Res. Lett. 2022, 17, 034027. [Google Scholar] [CrossRef]
- UNEP Emissions Gap Report 2022. Available online: https://www.unep.org/resources/emissions-gap-report-2022 (accessed on 14 March 2024).
- Albers, A.; Collet, P.; Benoist, A.; Hélias, A. Back to the Future: Dynamic Full Carbon Accounting Applied to Prospective Bioenergy Scenarios. Int. J. Life Cycle Assess. 2020, 25, 1242–1258. [Google Scholar] [CrossRef]
- Albers, A.; Avadí, A.; Benoist, A.; Collet, P.; Hélias, A. Modelling Dynamic Soil Organic Carbon Flows of Annual and Perennial Energy Crops to Inform Energy-Transport Policy Scenarios in France. Sci. Total Environ. 2020, 718, 135278. [Google Scholar] [CrossRef] [PubMed]
- Council Directive 1999/31/EC of 26 April 1999 on the Landfill of Waste. Available online: https://eur-lex.europa.eu/legal-content/EN/TXT/PDF/?uri=CELEX:31999L0031 (accessed on 14 March 2024).
- Panagiotakis, I.; Dermatas, D. New European Union Soil Strategy: A Potential Worldwide Tool for Sustainable Waste Management and Circular Economy. Waste Manag. Res. 2022, 40, 245–247. [Google Scholar] [CrossRef] [PubMed]
- Rasheed, T.; Anwar, M.T.; Ahmad, N.; Sher, F.; Khan, S.U.-D.; Ahmad, A.; Khan, R.; Wazeer, I. Valorisation and Emerging Perspective of Biomass Based Waste-to-Energy Technologies and Their Socio-Environmental Impact: A Review. J. Environ. Manag. 2021, 287, 112257. [Google Scholar] [CrossRef] [PubMed]
- De Medeiros Engelmann, P.; Dos Santos, V.H.J.M.; Da Rocha, P.R.; Dos Santos, G.H.A.; Lourega, R.V.; De Lima, J.E.A.; Pires, M.J.R. Analysis of Solid Waste Management Scenarios Using the WARM Model: Case Study. J. Clean. Prod. 2022, 345, 130687. [Google Scholar] [CrossRef]
- Abubakar, I.R.; Maniruzzaman, K.M.; Dano, U.L.; AlShihri, F.S.; AlShammari, M.S.; Ahmed, S.M.S.; Al-Gehlani, W.A.G.; Alrawaf, T.I. Environmental Sustainability Impacts of Solid Waste Management Practices in the Global South. Int. J. Environ. Res. Public Health 2022, 19, 12717. [Google Scholar] [CrossRef]
- Baral, K.R.; Jégo, G.; Amon, B.; Bol, R.; Chantigny, M.H.; Olesen, J.E.; Petersen, S.O. Greenhouse Gas Emissions during Storage of Manure and Digestates: Key Role of Methane for Prediction and Mitigation. Agric. Syst. 2018, 166, 26–35. [Google Scholar] [CrossRef]
- Ali, J.; Rasheed, T.; Afreen, M.; Anwar, M.T.; Nawaz, Z.; Anwar, H.; Rizwan, K. Modalities for Conversion of Waste to Energy—Challenges and Perspectives. Sci. Total Environ. 2020, 727, 138610. [Google Scholar] [CrossRef]
- Esteves, E.M.M.; Herrera, A.M.N.; Esteves, V.P.P.; Morgado, C.D.R.V. Life Cycle Assessment of Manure Biogas Production: A Review. J. Clean. Prod. 2019, 219, 411–423. [Google Scholar] [CrossRef]
- Uddin, M.M.; Wright, M.M. Anaerobic Digestion Fundamentals, Challenges, and Technological Advances. Phys. Sci. Rev. 2023, 8, 2819–2837. [Google Scholar] [CrossRef]
- Le Pera, A.; Sellaro, M.; Pellegrino, C.; Limonti, C.; Siciliano, A. Combined Pre-Treatment Technologies for Cleaning Biogas before Its Upgrading to Biomethane: An Italian Full-Scale Anaerobic Digester Case Study. Appl. Sci. 2024, 14, 2053. [Google Scholar] [CrossRef]
- Farghali, M.; Osman, A.I.; Umetsu, K.; Rooney, D.W. Integration of Biogas Systems into a Carbon Zero and Hydrogen Economy: A Review. Environ. Chem. Lett. 2022, 20, 2853–2927. [Google Scholar] [CrossRef]
- Angenent, L.T.; Usack, J.G.; Sun, T.; Fink, C.; Molitor, B.; Labatut, R.; Posmanik, R.; Hörl, M.; Hafenbradl, D. Upgrading Anaerobic Digestion within the Energy Economy—The Methane Platform. In Resource Recovery from Water: Principles and Application; IWA Publishing: London, UK, 2022. [Google Scholar] [CrossRef]
- de Carvalho, F.S.; dos Santos Reis, L.C.B.; Lacava, P.T.; de Araújo, F.H.M.; de Carvalho, J.A., Jr. Substitution of Natural Gas by Biomethane: Operational Aspects in Industrial Equipment. Energies 2023, 16, 839. [Google Scholar] [CrossRef]
- Rasheed, R.; Tahir, F.; Yasar, A.; Sharif, F.; Tabinda, A.B.; Ahmad, S.R.; Wang, Y.; Su, Y. Environmental Life Cycle Analysis of a Modern Commercial-Scale Fibreglass Composite-Based Biogas Scrubbing System. Renew. Energy 2022, 185, 1261–1271. [Google Scholar] [CrossRef]
- Eljamal, R.; Maamoun, I.; Bensaida, K.; Yilmaz, G.; Sugihara, Y.; Eljamal, O. A Novel Method to Improve Methane Generation from Waste Sludge Using Iron Nanoparticles Coated with Magnesium Hydroxide. Renew. Sustain. Energy Rev. 2022, 158, 112192. [Google Scholar] [CrossRef]
- Cheong, W.L.; Chan, Y.J.; Tiong, T.J.; Chong, W.C.; Kiatkittipong, W.; Kiatkittipong, K.; Mohamad, M.; Daud, H.; Suryawan, I.W.K.; Sari, M.M.; et al. Anaerobic Co-Digestion of Food Waste with Sewage Sludge: Simulation and Optimization for Maximum Biogas Production. Water 2022, 14, 1075. [Google Scholar] [CrossRef]
- Cubero-Cardoso, J.; Maluf Braga, A.F.; Trujillo-Reyes, Á.; Alonso-Segovia, G.; Serrano, A.; Borja, R.; Fermoso, F.G. Effect of Metals on Mesophilic Anaerobic Digestion of Strawberry Extrudate in Batch Mode. J. Environ. Manag. 2023, 326, 116783. [Google Scholar] [CrossRef]
- Astorino, C.; De Nardo, E.; Lettieri, S.; Ferraro, G.; Pirri, C.F.; Bocchini, S. Advancements in Gas Separation for Energy Applications: Exploring the Potential of Polymer Membranes with Intrinsic Microporosity (PIM). Membranes 2023, 13, 903. [Google Scholar] [CrossRef]
- Zhao, J.; Li, Y.; Dong, R. Recent Progress towards In-Situ Biogas Upgrading Technologies. Sci. Total Environ. 2021, 800, 149667. [Google Scholar] [CrossRef]
- Lanko, I.; Hejnic, J.; Říhová-Ambrožová, J.; Ferrer, I.; Jenicek, P. Digested Sludge Quality in Mesophilic, Thermophilic and Temperature-Phased Anaerobic Digestion Systems. Water 2021, 13, 2839. [Google Scholar] [CrossRef]
- Li, Y.; Hua, D.; Xu, H.; Zhao, Y.; Jin, F.; Fang, X. Improving Biodegradability of Corn Stover Pretreated by Different Organic Acids: Investigation on the Hydrolysis/Acidification and Methanogenic Performance. Ind. Crops Prod. 2022, 177, 114395. [Google Scholar] [CrossRef]
- Bouaita, R.; Derbal, K.; Panico, A.; Iasimone, F.; Pontoni, L.; Fabbricino, M.; Pirozzi, F. Methane Production from Anaerobic Co-Digestion of Orange Peel Waste and Organic Fraction of Municipal Solid Waste in Batch and Semi-Continuous Reactors. Biomass Bioenergy 2022, 160, 106421. [Google Scholar] [CrossRef]
- Ignatowicz, K.; Filipczak, G.; Dybek, B.; Wałowski, G. Biogas Production Depending on the Substrate Used: A Review and Evaluation Study—European Examples. Energies 2023, 16, 798. [Google Scholar] [CrossRef]
- EBA Statistical Report 2022|European Biogas Association. Available online: https://www.europeanbiogas.eu/__trashed-3/ (accessed on 15 March 2024).
- Agonafer, T.D.; Eremed, W.B.; Adem, K.D. Biogas-Based Trigeneration System: A Review. Results Eng. 2022, 15, 100509. [Google Scholar] [CrossRef]
- Golmakani, A.; Ali Nabavi, S.; Wadi, B.; Manovic, V. Advances, Challenges, and Perspectives of Biogas Cleaning, Upgrading, and Utilisation. Fuel 2022, 317, 123085. [Google Scholar] [CrossRef]
- Morrissey, A.J.; Browne, J. Waste Management Models and Their Application to Sustainable Waste Management. Waste Manag. 2004, 24, 297–308. [Google Scholar] [CrossRef]
- Gentil, E.C.; Damgaard, A.; Hauschild, M.; Finnveden, G.; Eriksson, O.; Thorneloe, S.; Kaplan, P.O.; Barlaz, M.; Muller, O.; Matsui, Y.; et al. Models for Waste Life Cycle Assessment: Review of Technical Assumptions. Waste Manag. 2010, 30, 2636–2648. [Google Scholar] [CrossRef]
- Tukker, A. Life Cycle Assessment as a Tool in Environmental Impact Assessment. Environ. Impact Assess. Rev. 2000, 20, 435–456. [Google Scholar] [CrossRef]
- Li, C.; Li, J.; Ren, Q.; Zheng, Q.; Jiang, Z. Durability of Concrete Coupled with Life Cycle Assessment: Review and Perspective. Cem. Concr. Compos. 2023, 139, 105041. [Google Scholar] [CrossRef]
- Narisetty, V.; Nagarajan, S.; Gadkari, S.; Ranade, V.V.; Zhang, J.; Patchigolla, K.; Bhatnagar, A.; Kumar Awasthi, M.; Pandey, A.; Kumar, V. Process Optimization for Recycling of Bread Waste into Bioethanol and Biomethane: A Circular Economy Approach. Energy Convers. Manag. 2022, 266, 115784. [Google Scholar] [CrossRef]
- Soleymani Angili, T.; Grzesik, K.; Salimi, E.; Loizidou, M. Life Cycle Analysis of Food Waste Valorization in Laboratory-Scale. Energies 2022, 15, 7000. [Google Scholar] [CrossRef]
- Pasciucco, F.; Francini, G.; Pecorini, I.; Baccioli, A.; Lombardi, L.; Ferrari, L. Valorization of Biogas from the Anaerobic Co-Treatment of Sewage Sludge and Organic Waste: Life Cycle Assessment and Life Cycle Costing of Different Recovery Strategies. J. Clean. Prod. 2023, 401, 136762. [Google Scholar] [CrossRef]
- Bidart, C.; Wichert, M.; Kolb, G.; Held, M. Biogas Catalytic Methanation for Biomethane Production as Fuel in Freight Transport—A Carbon Footprint Assessment. Renew. Sustain. Energy Rev. 2022, 168, 112802. [Google Scholar] [CrossRef]
- Mallouppas, G.; Yfantis, E.A.; Ioannou, C.; Paradeisiotis, A.; Ktoris, A. Application of Biogas and Biomethane as Maritime Fuels: A Review of Research, Technology Development, Innovation Proposals, and Market Potentials. Energies 2023, 16, 2066. [Google Scholar] [CrossRef]
- D’Adamo, I.; Sassanelli, C. Biomethane Community: A Research Agenda towards Sustainability. Sustainability 2022, 14, 4735. [Google Scholar] [CrossRef]
- Gupta, R.; Miller, R.; Sloan, W.; You, S. Economic and Environmental Assessment of Organic Waste to Biomethane Conversion. Bioresour. Technol. 2022, 345, 126500. [Google Scholar] [CrossRef]
- Aravani, V.P.; Sun, H.; Yang, Z.; Liu, G.; Wang, W.; Anagnostopoulos, G.; Syriopoulos, G.; Charisiou, N.D.; Goula, M.A.; Kornaros, M.; et al. Agricultural and Livestock Sector’s Residues in Greece & China: Comparative Qualitative and Quantitative Characterization for Assessing Their Potential for Biogas Production. Renew. Sustain. Energy Rev. 2022, 154, 111821. [Google Scholar] [CrossRef]
- Kucher, O.; Hutsol, T.; Glowacki, S.; Andreitseva, I.; Dibrova, A.; Muzychenko, A.; Szeląg-Sikora, A.; Szparaga, A.; Kocira, S. Energy Potential of Biogas Production in Ukraine. Energies 2022, 15, 1710. [Google Scholar] [CrossRef]
- Norouzi, O.; Dutta, A. The Current Status and Future Potential of Biogas Production from Canada’s Organic Fraction Municipal Solid Waste. Energies 2022, 15, 475. [Google Scholar] [CrossRef]
- Tomczak, W.; Gryta, M.; Daniluk, M.; Żak, S. Biogas Upgrading Using a Single-Membrane System: A Review. Membranes 2024, 14, 80. [Google Scholar] [CrossRef]
- Francisco López, A.; Lago Rodríguez, T.; Faraji Abdolmaleki, S.; Galera Martínez, M.; Bello Bugallo, P.M. From Biogas to Biomethane: An In-Depth Review of Upgrading Technologies That Enhance Sustainability and Reduce Greenhouse Gas Emissions. Appl. Sci. 2024, 14, 2342. [Google Scholar] [CrossRef]
- Fajrina, N.; Yusof, N.; Ismail, A.F.; Aziz, F.; Bilad, M.R.; Alkahtani, M. A Crucial Review on the Challenges and Recent Gas Membrane Development for Biogas Upgrading. J. Environ. Chem. Eng. 2023, 11, 110235. [Google Scholar] [CrossRef]
- Gkotsis, P.; Kougias, P.; Mitrakas, M.; Zouboulis, A. Biogas Upgrading Technologies—Recent Advances in Membrane-Based Processes. Int. J. Hydrog. Energy 2023, 48, 3965–3993. [Google Scholar] [CrossRef]
- Bian, R.; Zhang, T.; Zhao, F.; Chen, J.; Liang, C.; Li, W.; Sun, Y.; Chai, X.; Fang, X.; Yuan, L. Greenhouse Gas Emissions from Waste Sectors in China during 2006–2019: Implications for Carbon Mitigation. Process Saf. Environ. Prot. 2022, 161, 488–497. [Google Scholar] [CrossRef]
- Jacobs, A.; Auburger, S.; Bahrs, E.; Brauer-Siebrecht, W.; Christen, O.; Götze, P.; Koch, H.-J.; Rücknagel, J.; Märländer, B. Greenhouse Gas Emission of Biogas Production out of Silage Maize and Sugar Beet—An Assessment along the Entire Production Chain. Appl. Energy 2017, 190, 114–121. [Google Scholar] [CrossRef]
- Mar, K.A.; Unger, C.; Walderdorff, L.; Butler, T. Beyond CO2 Equivalence: The Impacts of Methane on Climate, Ecosystems, and Health. Environ. Sci. Policy 2022, 134, 127–136. [Google Scholar] [CrossRef]
- Gustafsson, M.; Anderberg, S. Biogas Policies and Production Development in Europe: A Comparative Analysis of Eight Countries. Biofuels 2022, 13, 931–944. [Google Scholar] [CrossRef]
- Ghafoori, M.S.; Loubar, K.; Marin-Gallego, M.; Tazerout, M. Techno-Economic and Sensitivity Analysis of Biomethane Production via Landfill Biogas Upgrading and Power-to-Gas Technology. Energy 2022, 239, 122086. [Google Scholar] [CrossRef]
- Ó Céileachair, D.; O’Shea, R.; Murphy, J.D.; Wall, D.M. The Effect of Seasonal Biomass Availability and Energy Demand on the Operation of an On-Farm Biomethane Plant. J. Clean. Prod. 2022, 368, 133129. [Google Scholar] [CrossRef]
- Shinde, A.M.; Dikshit, A.K.; Odlare, M.; Thorin, E.; Schwede, S. Life Cycle Assessment of Bio-Methane and Biogas-Based Electricity Production from Organic Waste for Utilization as a Vehicle Fuel. Clean Technol. Environ. Policy 2021, 23, 1715–1725. [Google Scholar] [CrossRef]
- Becker, C.M.; Marder, M.; Junges, E.; Konrad, O. Technologies for Biogas Desulfurization—An Overview of Recent Studies. Renew. Sustain. Energy Rev. 2022, 159, 112205. [Google Scholar] [CrossRef]
- Ministry of Energy of the Republic of Lithuania 1-194 Regarding Approval of Natural Gas Quality Requirements. Available online: https://e-seimas.lrs.lt/portal/legalAct/lt/TAD/TAIS.457419/asr (accessed on 15 March 2024).
- Galizia, M.; Chi, W.S.; Smith, Z.P.; Merkel, T.C.; Baker, R.W.; Freeman, B.D. 50th Anniversary Perspective: Polymers and Mixed Matrix Membranes for Gas and Vapor Separation: A Review and Prospective Opportunities. Macromolecules 2017, 50, 7809–7843. [Google Scholar] [CrossRef]
- Baena-Moreno, F.M.; le Saché, E.; Pastor-Pérez, L.; Reina, T.R. Membrane-Based Technologies for Biogas Upgrading: A Review. Environ. Chem. Lett. 2020, 18, 1649–1658. [Google Scholar] [CrossRef]
- EN 50470-3:2022; Electricity Metering Equipment—Part 3: Particular Requirements—Static Meters for AC Active Energy (Class Indexes A, B and C). Slovenian Institute for Standardization (SIST): Ljubljana, Slovenia, 2022.
- ISO 14044:2006. Available online: https://www.iso.org/standard/38498.html (accessed on 15 March 2024).
- Leiden University Handbook on Life Cycle Assessment. Available online: https://www.universiteitleiden.nl/en/research/research-projects/science/cml-new-dutch-lca-guide (accessed on 15 March 2024).
- ENSTO The ENTSO-E Is Publishing the ENTSO-E Market Report 2023 and ENTSO-E Capacity Calculation and Allocation (CC&A) Report 2023. Available online: https://www.entsoe.eu/news/2023/06/30/the-entso-e-is-publishing-the-entso-e-market-report-2023-and-entso-e-capacity-calculation-and-allocation-cc-a-report-2023/ (accessed on 15 March 2024).
- Pre Consultants SimaPro|LCA Software for Informed Changemakers. Available online: https://simapro.com/ (accessed on 15 March 2024).
- Wernet, G.; Bauer, C.; Steubing, B.; Reinhard, J.; Moreno-Ruiz, E.; Weidema, B. The Ecoinvent Database Version 3 (Part I): Overview and Methodology. Int. J. Life Cycle Assess. 2016, 21, 1218–1230. [Google Scholar] [CrossRef]
- BRIGHT Tech: Biogas Upgrading: Membrane Technology. Available online: https://www.bright-renewables.com/technology/biogas-upgrading-membrane/ (accessed on 15 March 2024).
- Lóránt, B.; Tardy, G.M. Current Status of Biological Biogas Upgrading Technologies. Period. Polytech. Chem. Eng. 2022, 66, 465–481. [Google Scholar] [CrossRef]
- Lombardi, L.; Francini, G. Techno-Economic and Environmental Assessment of the Main Biogas Upgrading Technologies. Renew. Energy 2020, 156, 440–458. [Google Scholar] [CrossRef]
- IRENA World Energy Transitions Outlook 2023. Available online: https://www.irena.org/Digital-Report/World-Energy-Transitions-Outlook-2023 (accessed on 15 March 2024).
- IEA Renewables—Energy System. Available online: https://www.iea.org/energy-system/renewables (accessed on 15 March 2024).
- World Nuclear Association Renewable Energy and Electricity. Available online: https://world-nuclear.org/information-library/energy-and-the-environment/renewable-energy-and-electricity.aspx (accessed on 14 March 2024).
- Eurostat Preliminary 2022 Data for Energy Show Mixed Trends—Eurostat. Available online: https://ec.europa.eu/eurostat/web/products-eurostat-news/w/ddn-20230705-2 (accessed on 15 March 2024).
- Soto, C.; Palacio, L.; Muñoz, R.; Prádanos, P.; Hernandez, A. Recent Advances in Membrane-Based Biogas and Biohydrogen Upgrading. Processes 2022, 10, 1918. [Google Scholar] [CrossRef]
- Kvist, T.; Aryal, N. Methane Loss from Commercially Operating Biogas Upgrading Plants. Waste Manag. 2019, 87, 295–300. [Google Scholar] [CrossRef]
- Climate Change 2022: Impacts, Adaptation and Vulnerability. In Contribution of Working Group III to the Sixth Assessment Report of the Intergovernmental Panel on Climate Change; Shukla, P.R., Skea, J., Slade, R., Al Khourdajie, A., van Diemen, R., McCollum, D., Pathak, M., Some, S., Vyas, P., Fradera, R., et al., Eds.; IPCC: Geneva, Switzerland, 2022; ISBN 978-92-9169-160-9. [Google Scholar]
- Scheutz, C.; Fredenslund, A.M. Total Methane Emission Rates and Losses from 23 Biogas Plants. Waste Manag. 2019, 97, 38–46. [Google Scholar] [CrossRef]
- Florio, C.; Fiorentino, G.; Corcelli, F.; Ulgiati, S.; Dumontet, S.; Güsewell, J.; Eltrop, L. A Life Cycle Assessment of Biomethane Production from Waste Feedstock Through Different Upgrading Technologies. Energies 2019, 12, 718. [Google Scholar] [CrossRef]
- Lorenzi, G.; Gorgoroni, M.; Silva, C.; Santarelli, M. Life Cycle Assessment of Biogas Upgrading Routes. Energy Procedia 2019, 158, 2012–2018. [Google Scholar] [CrossRef]
Disclaimer/Publisher’s Note: The statements, opinions and data contained in all publications are solely those of the individual author(s) and contributor(s) and not of MDPI and/or the editor(s). MDPI and/or the editor(s) disclaim responsibility for any injury to people or property resulting from any ideas, methods, instructions or products referred to in the content. |
© 2024 by the authors. Licensee MDPI, Basel, Switzerland. This article is an open access article distributed under the terms and conditions of the Creative Commons Attribution (CC BY) license (https://creativecommons.org/licenses/by/4.0/).