

Towards Sustainable Material: Optimizing Geopolymer Mortar Formulations for 3D Printing: A Life Cycle Assessment Approach

 , , ,
, , ,
Abstract
1. Introduction
2. Materials and Methods
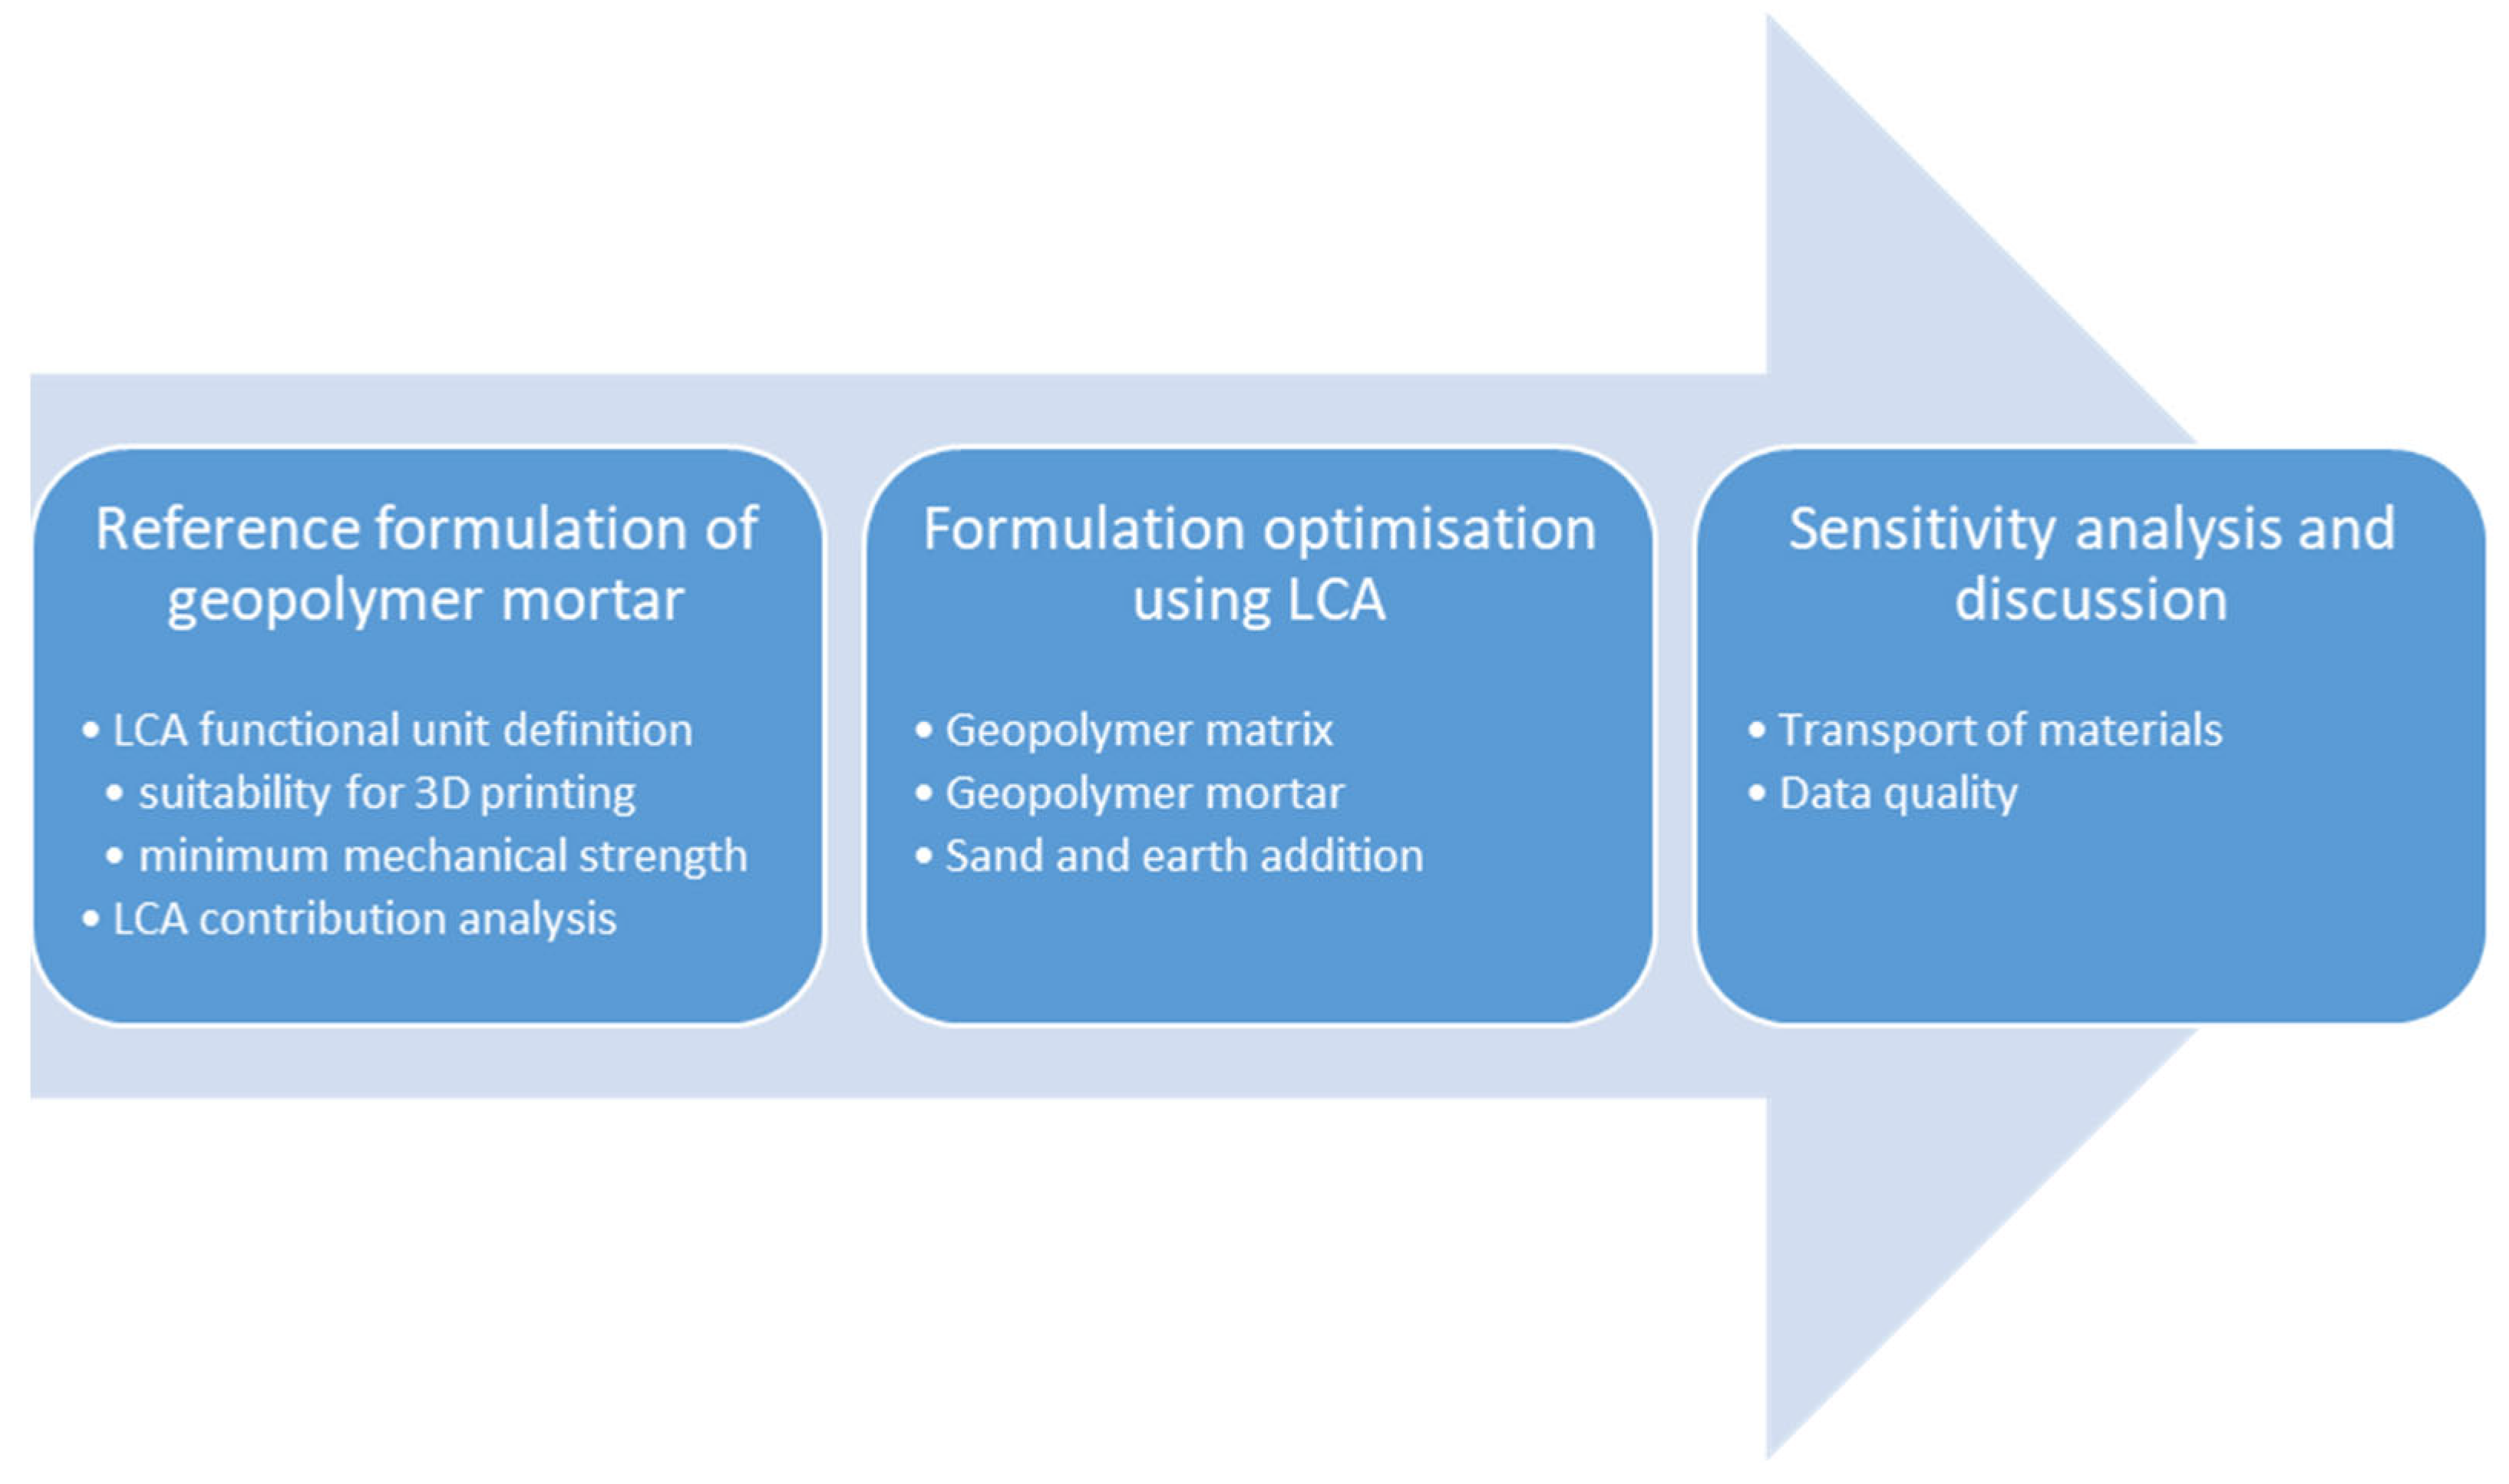
2.1. Methodological Approach
2.2. Raw Materials and Sample Preparation
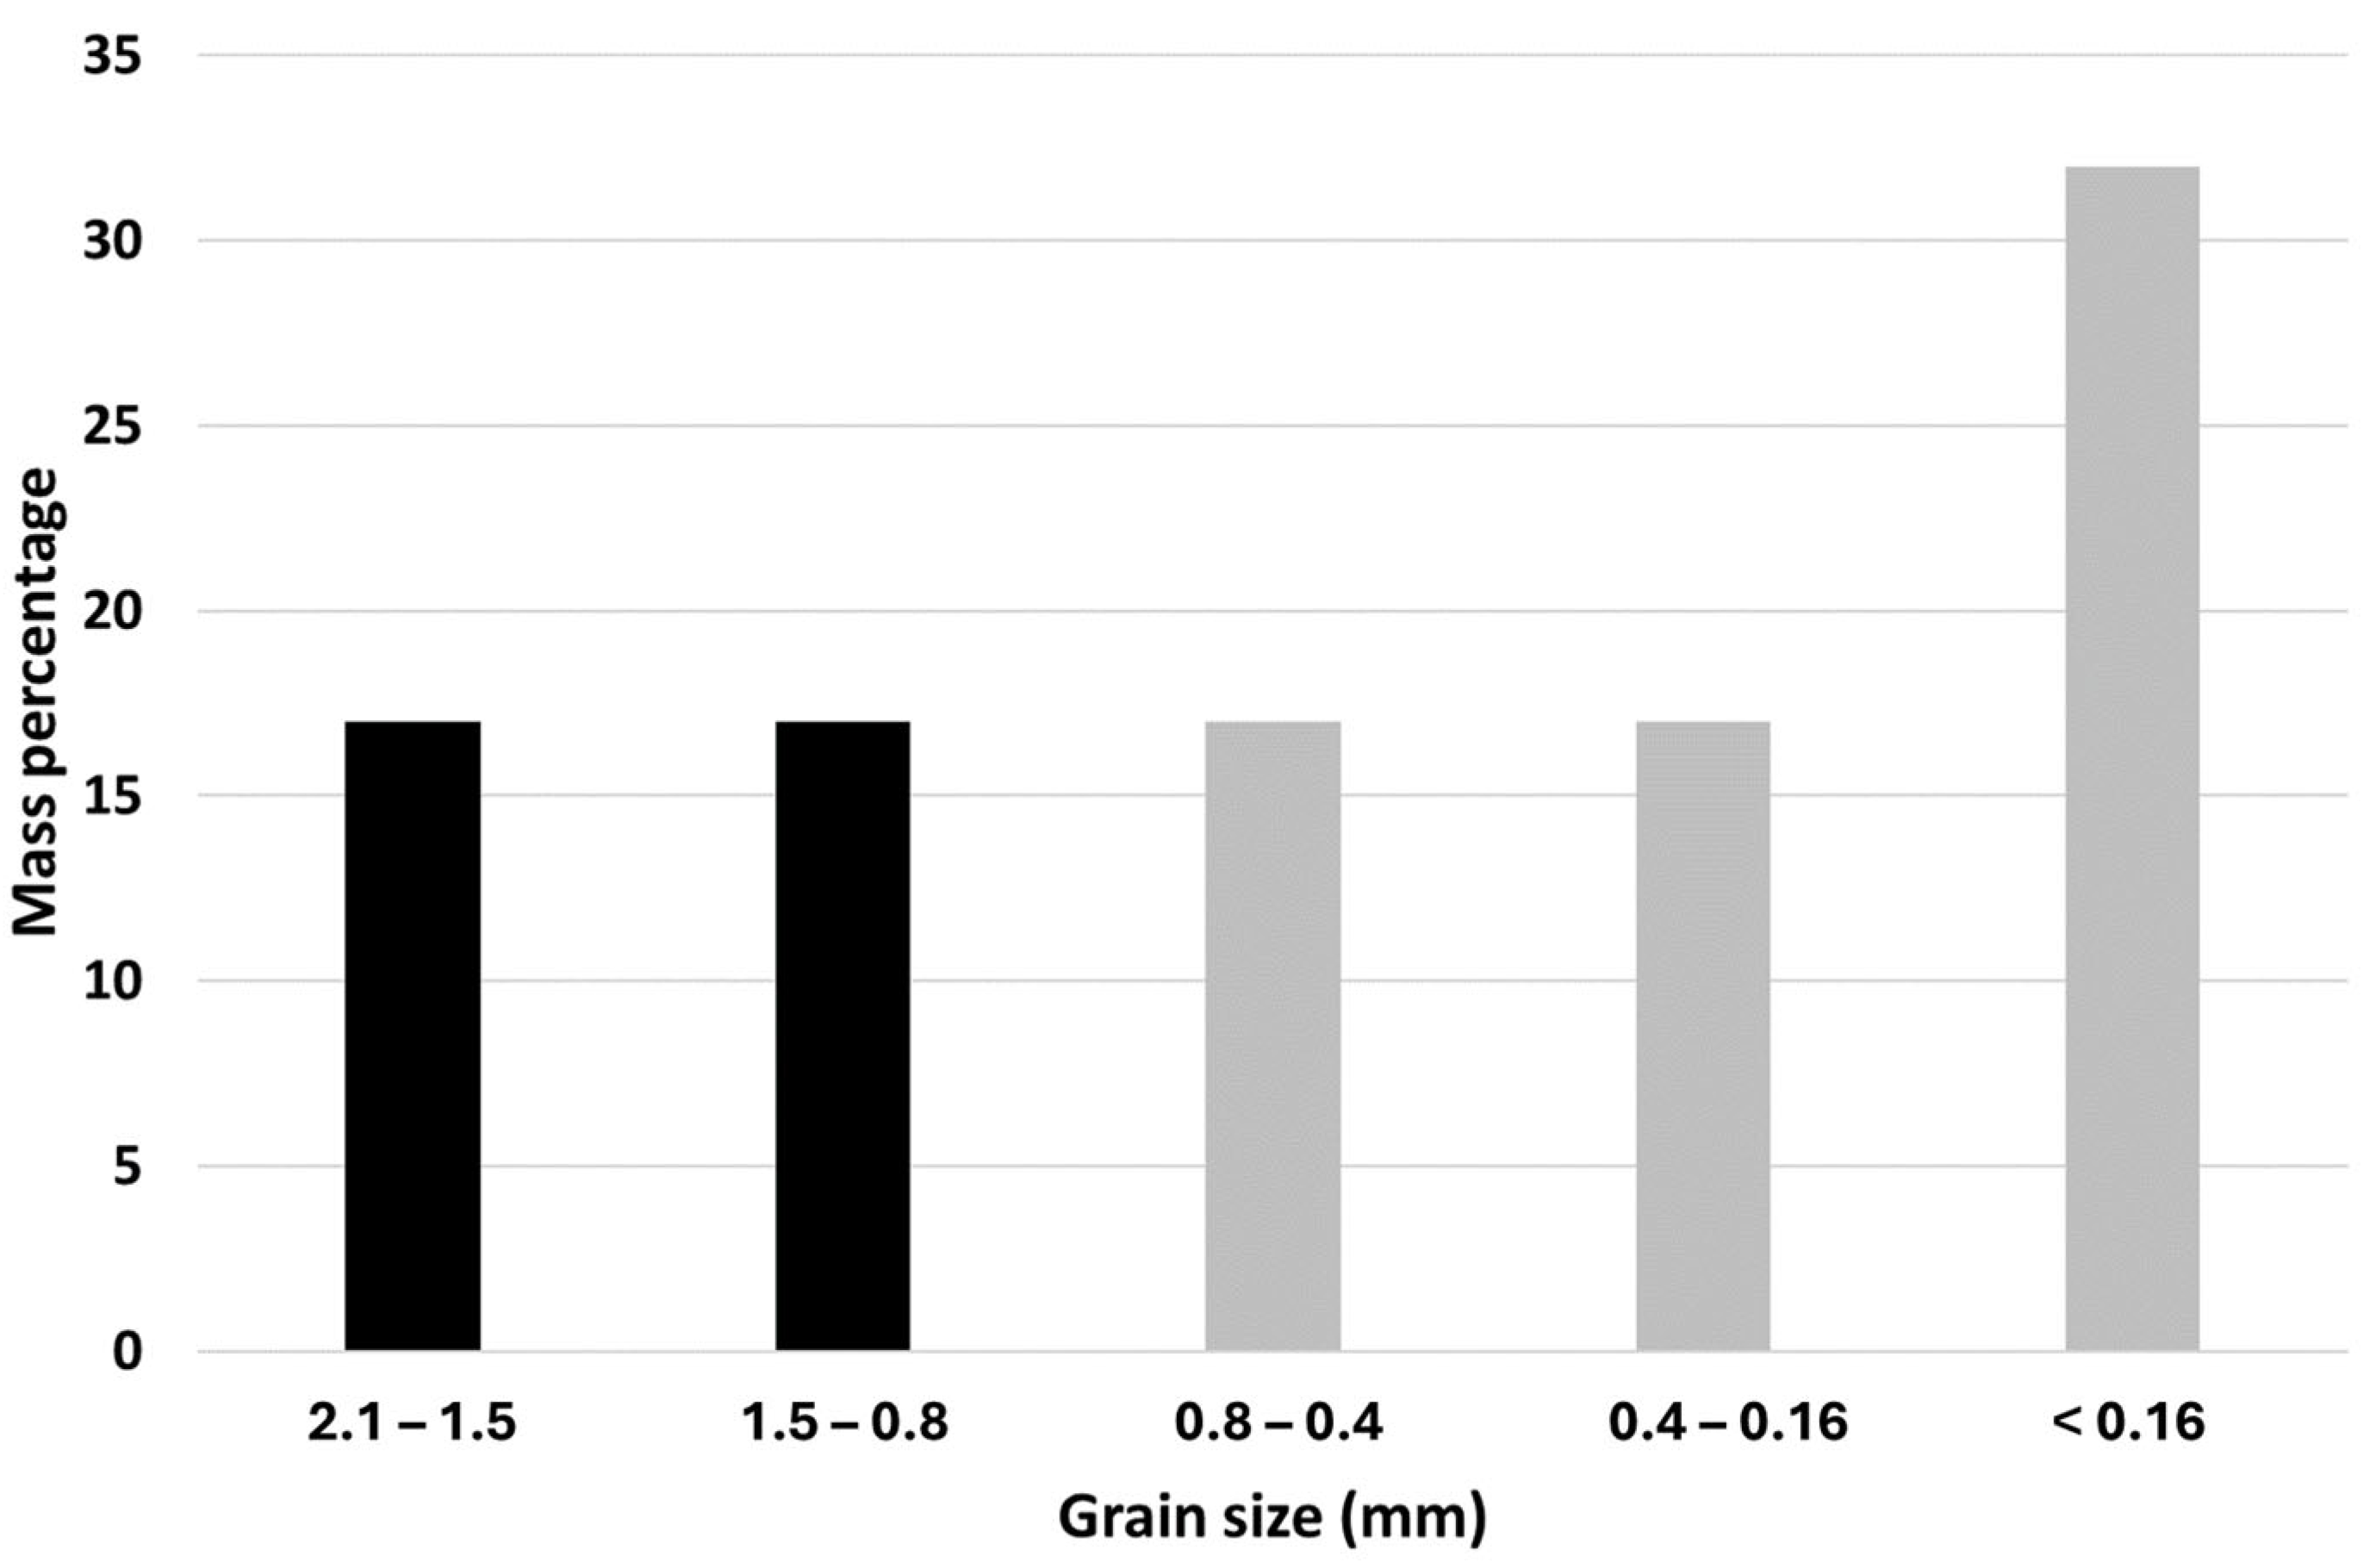
2.2.1. Raw Materials
2.2.2. Sample Preparation
2.3. Environmental Characterization
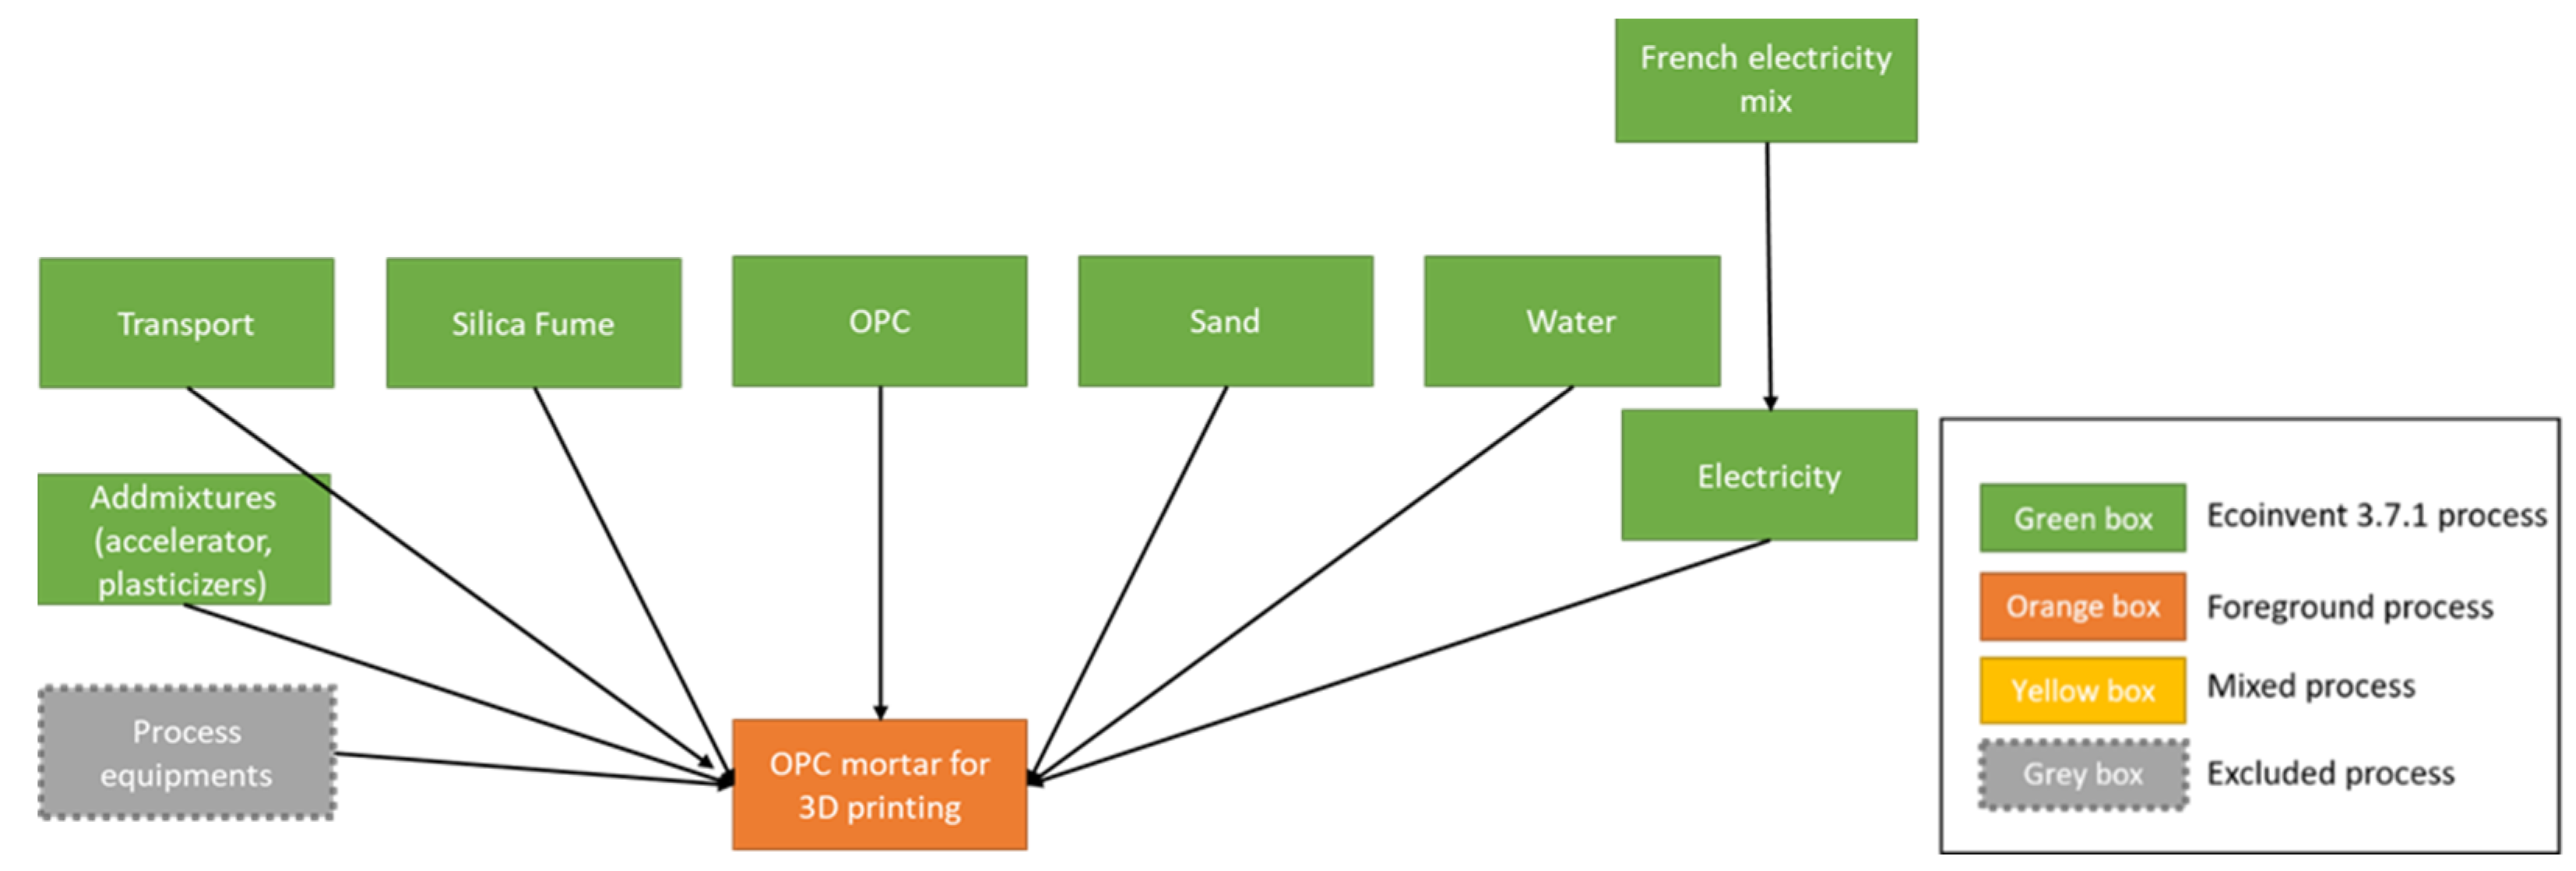
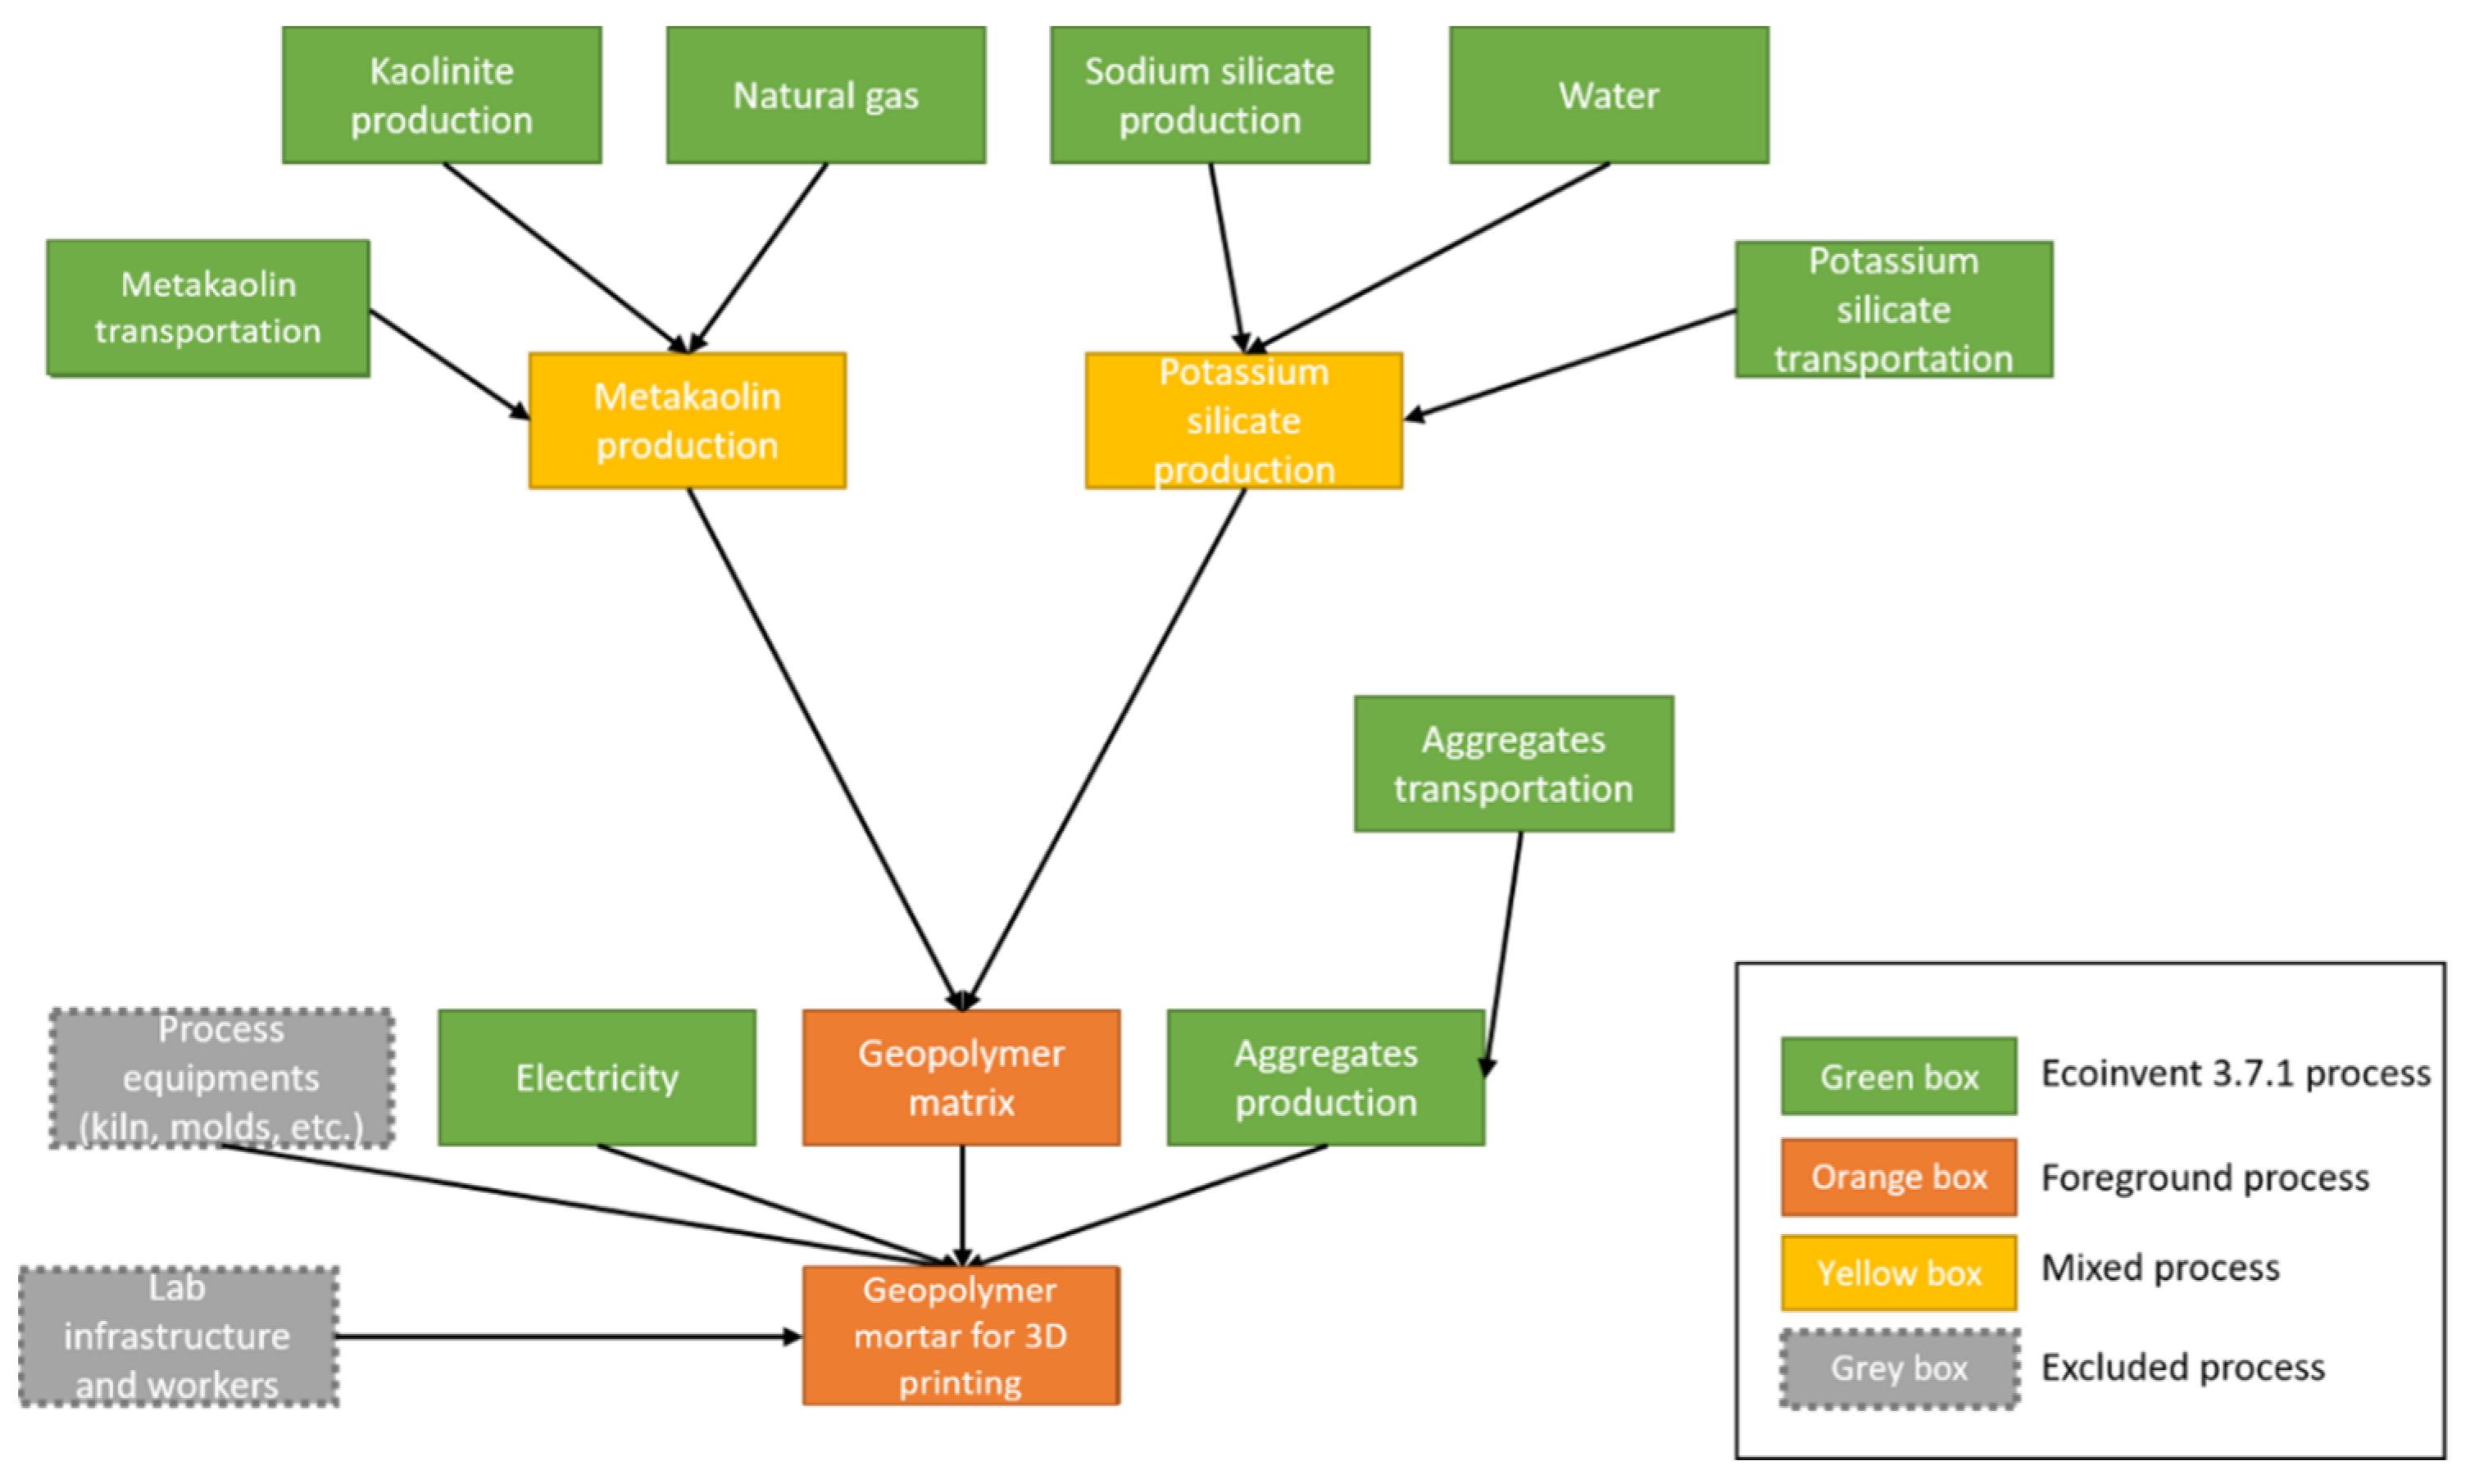
2.3.1. Environmental Assessment: Methodological Choices and Perimeter of the LCA for 3D Printing Geopolymer Mortars
2.3.2. Life Cycle Inventory of Individual Processes
- MK: Clérac—Champs sur Marne: 535 km.
- PSS: Ludwigshafen—Champs sur Marne: 504 km.
2.3.3. Environmental Indicators
3. Results
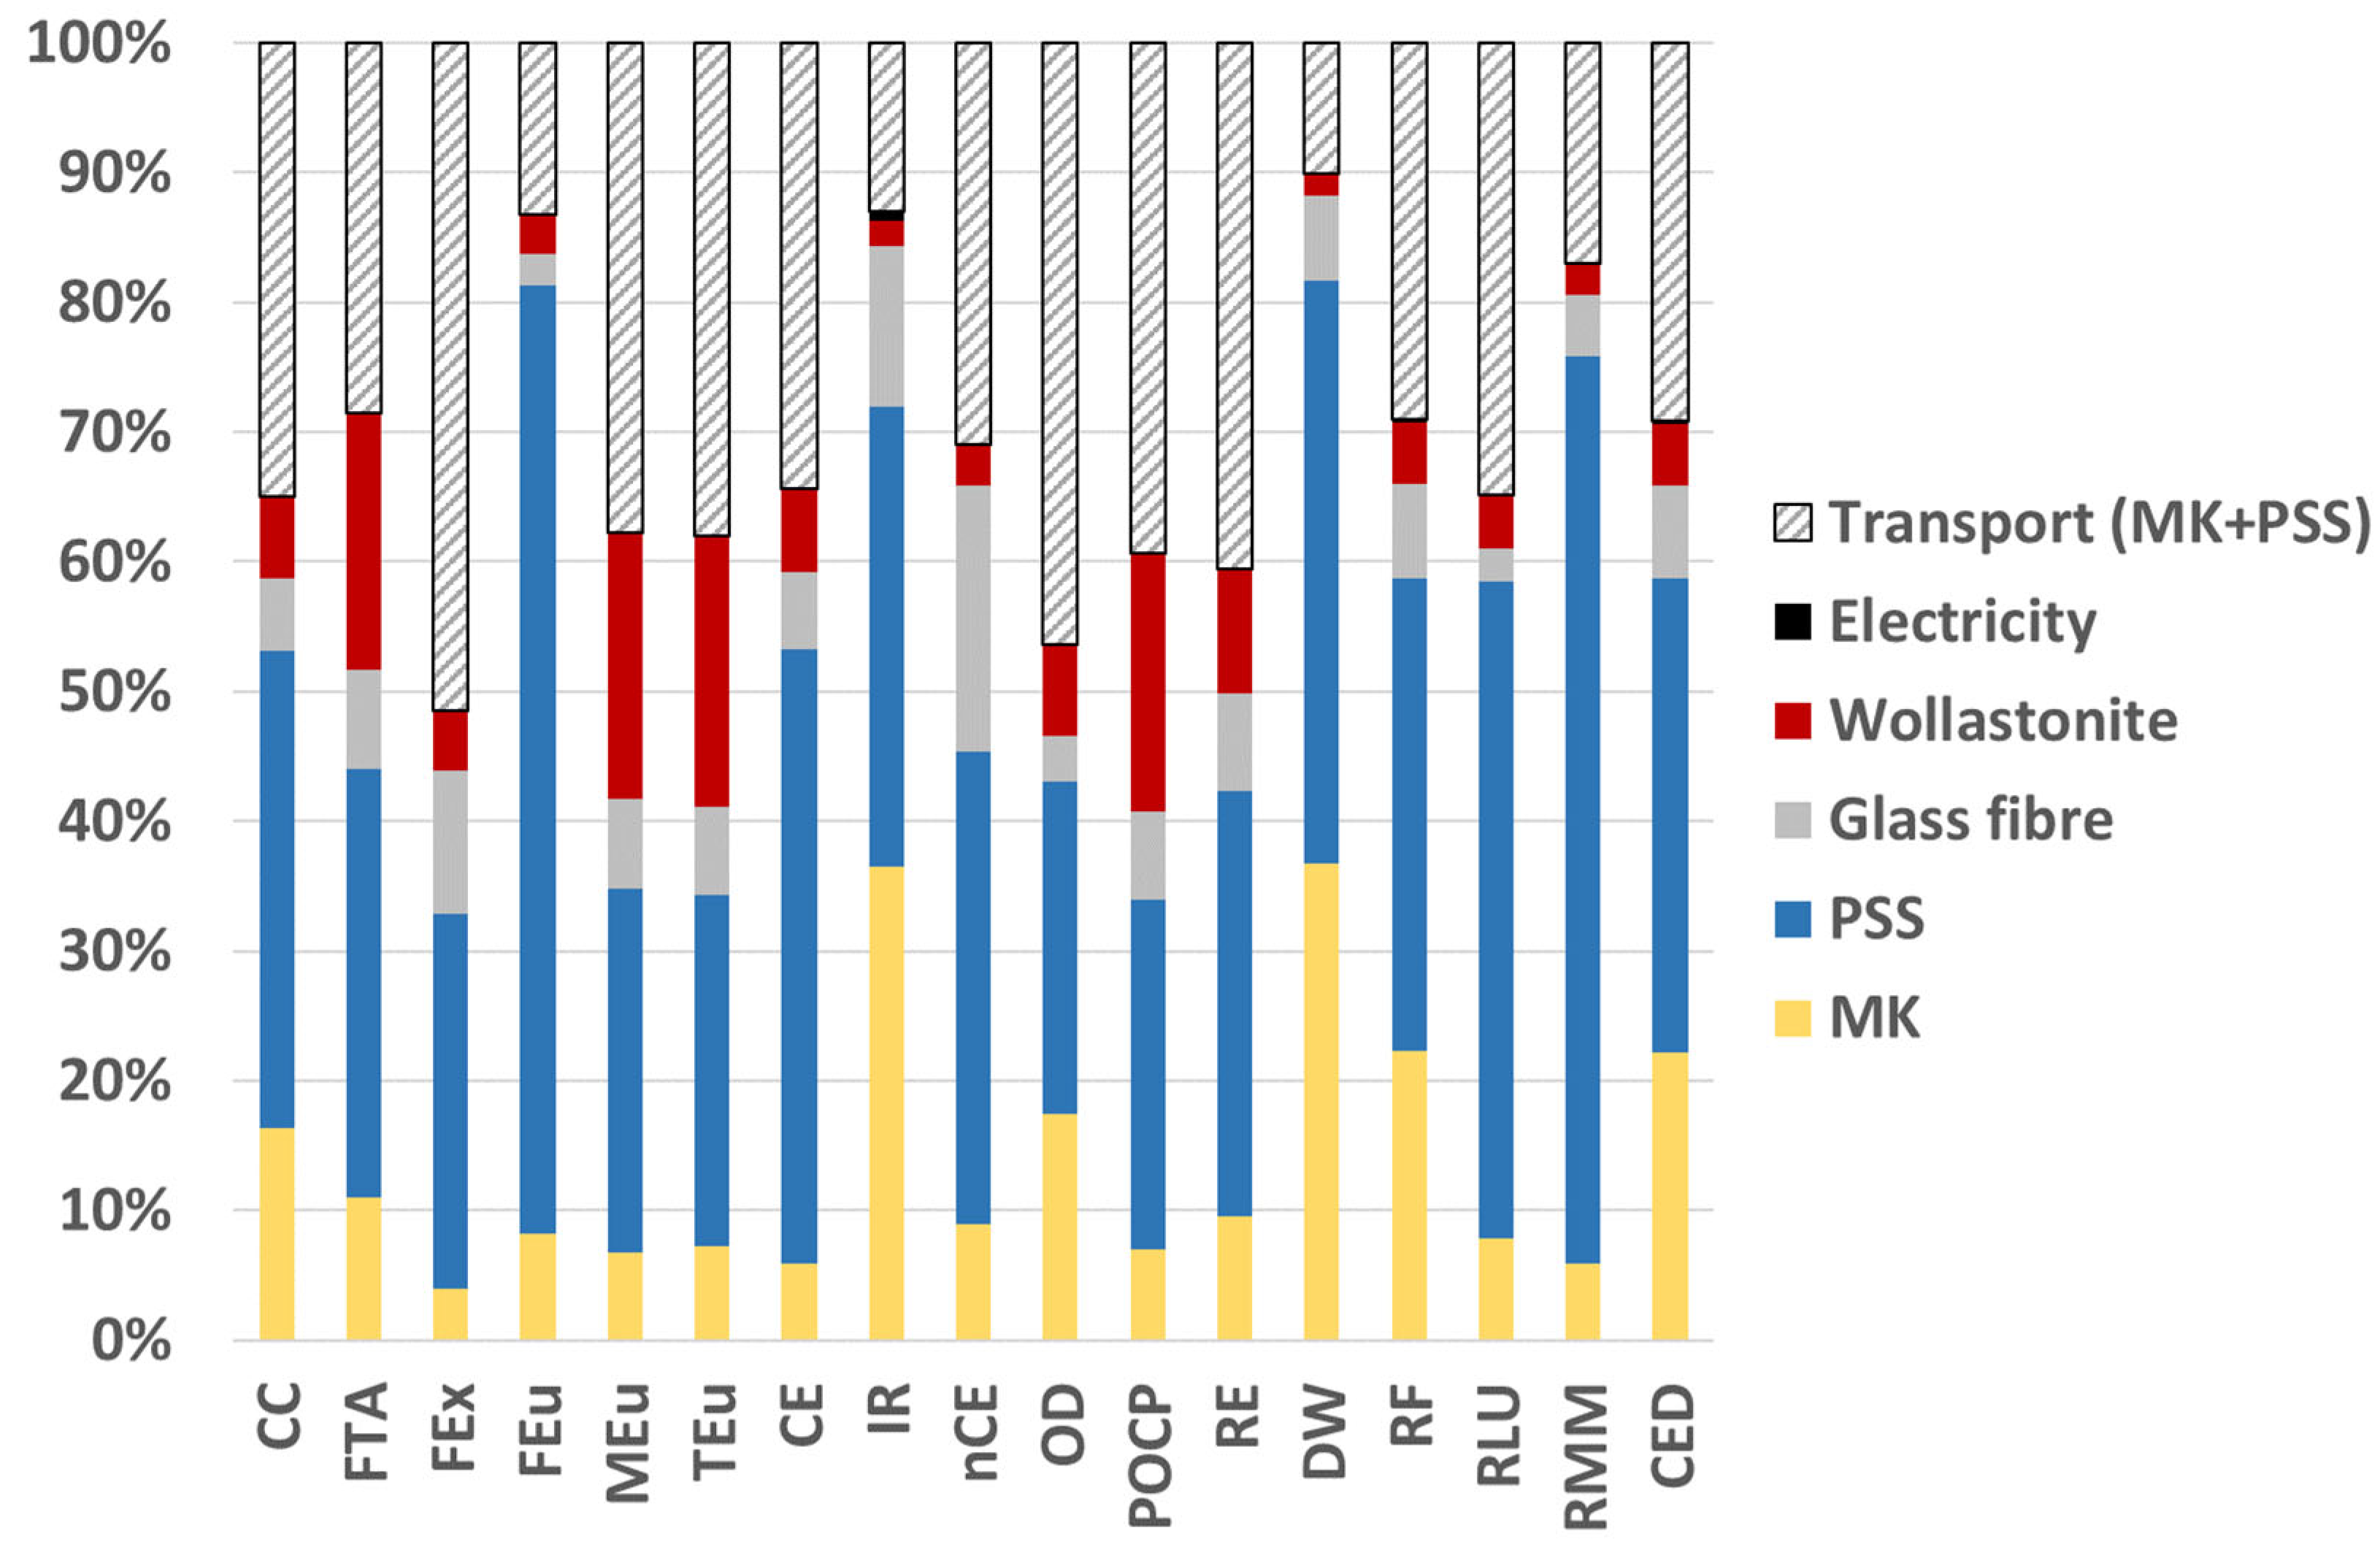
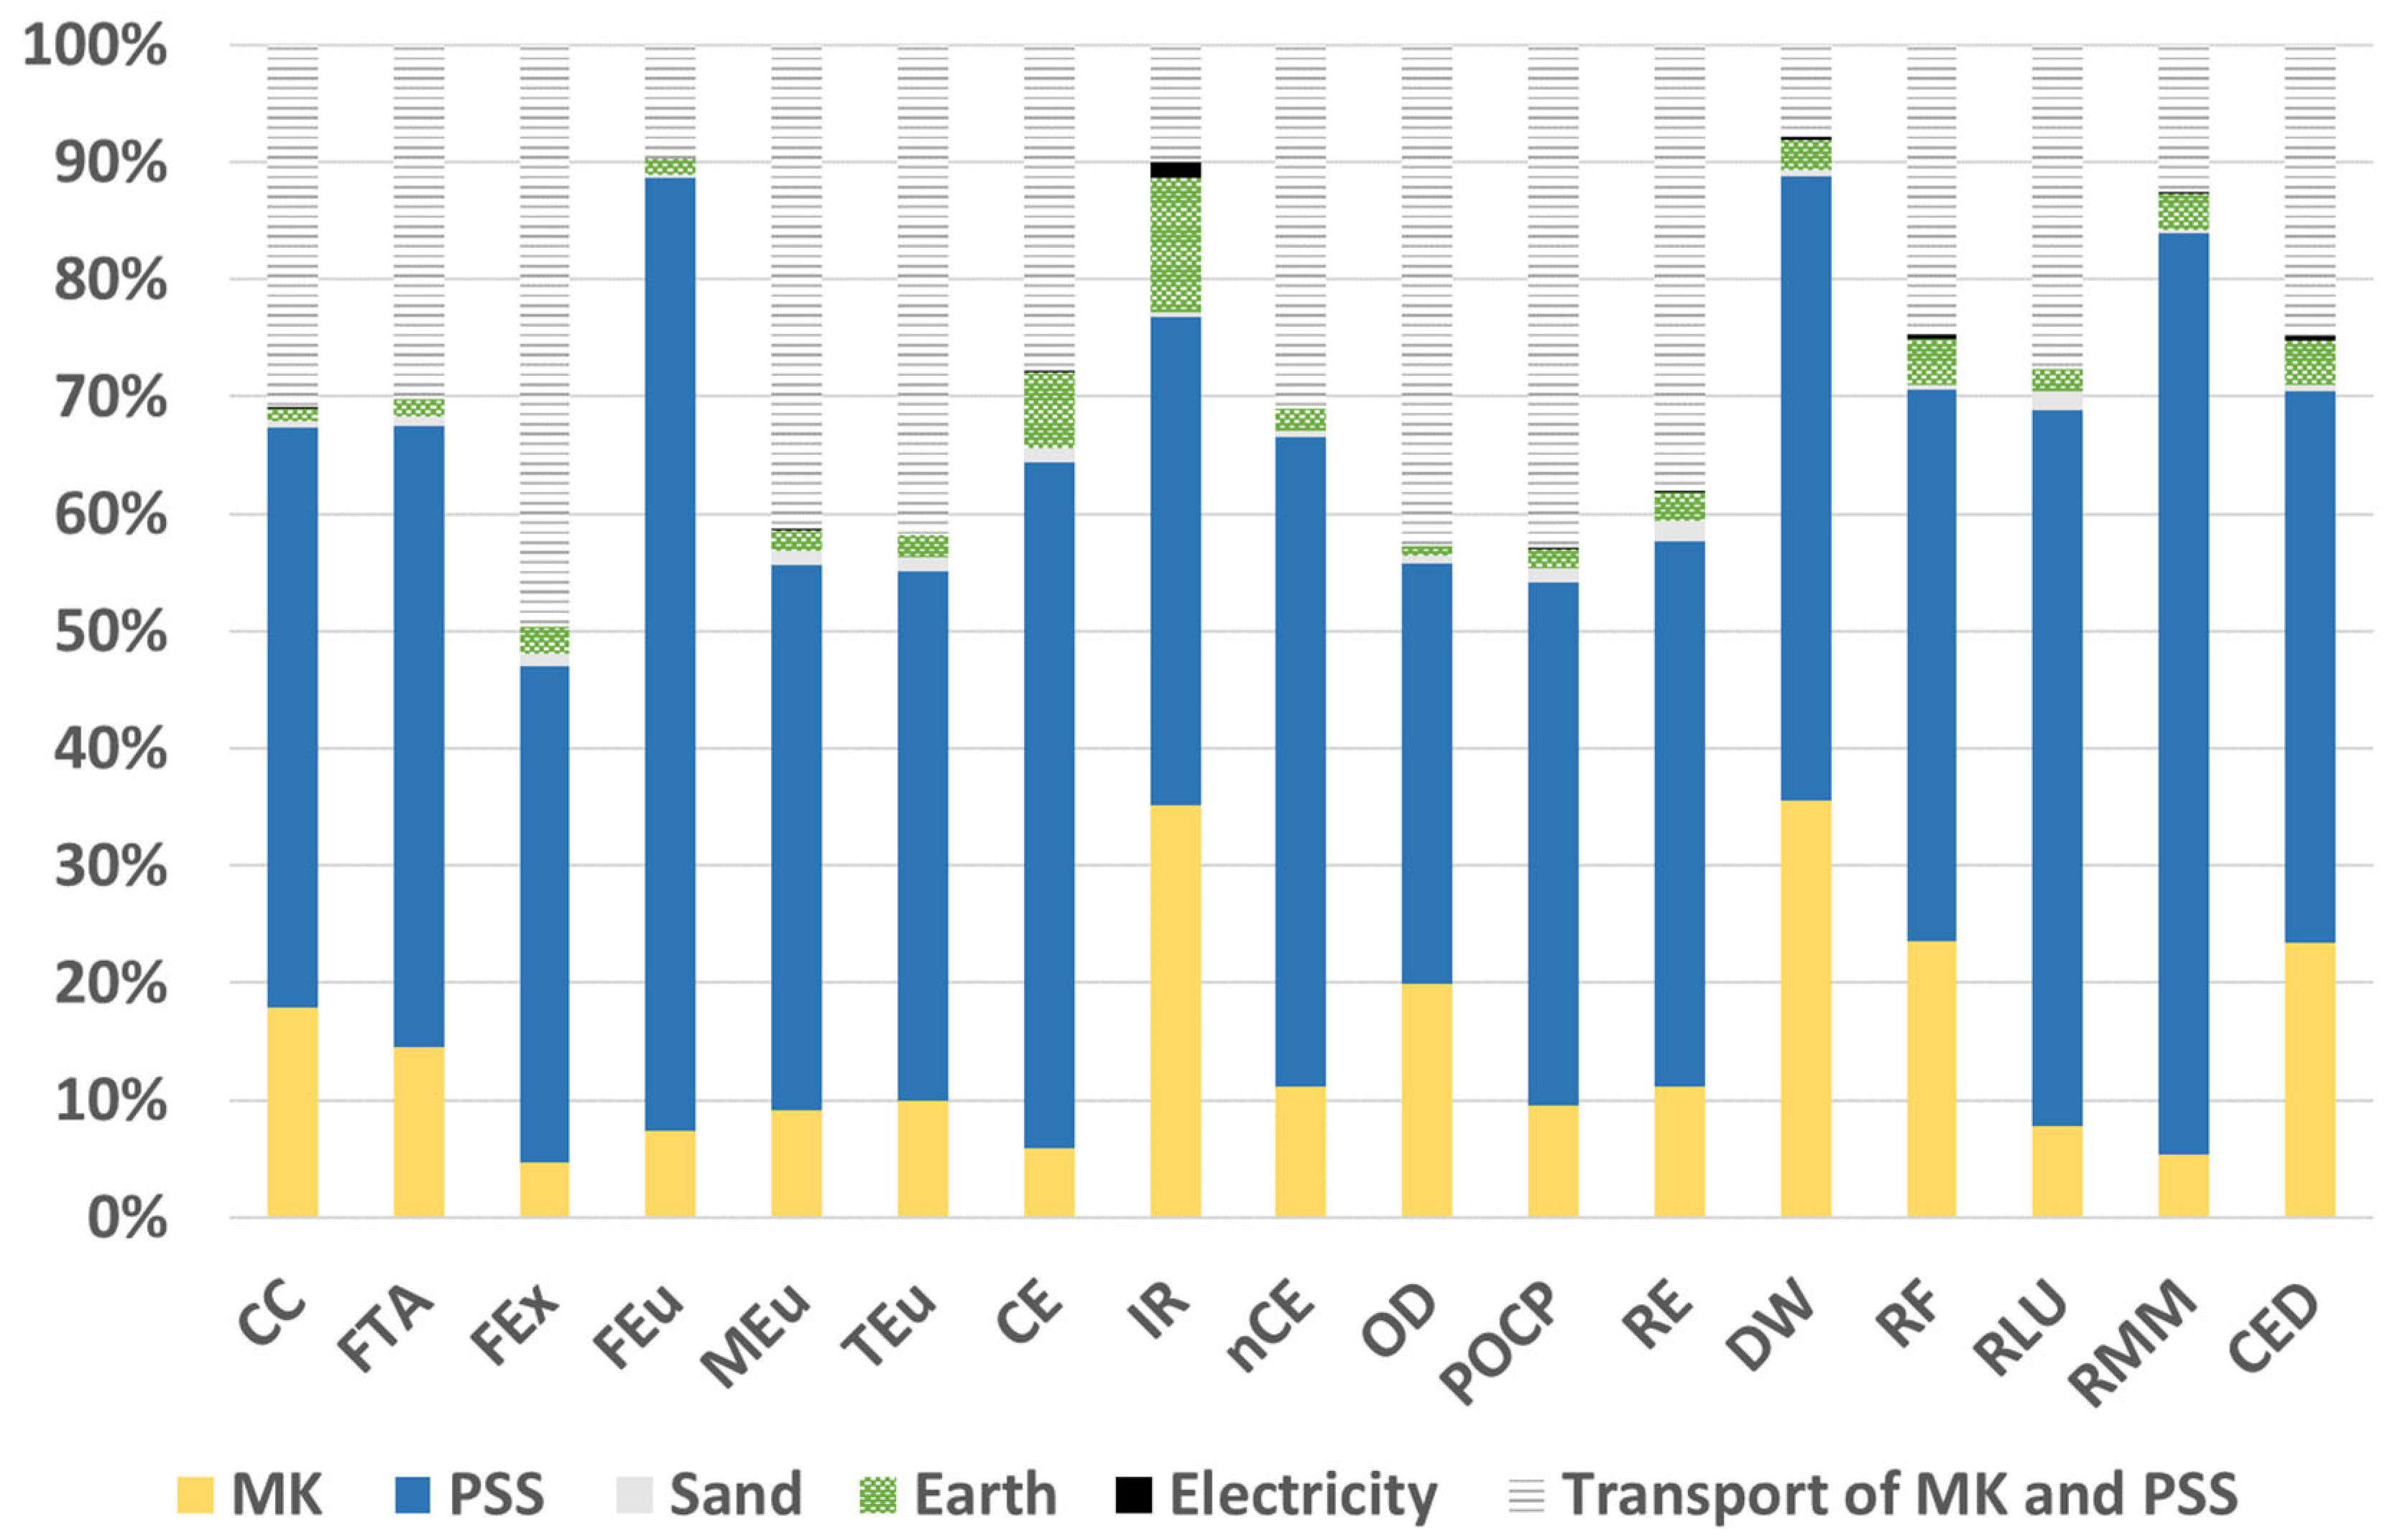
3.1. Environmental Impact Assessment of Elementary Processes of Geopolymer Mortars and Reference Situation
3.2. Optimization of the Geopolymer Formulation to Lower GHG Emissions
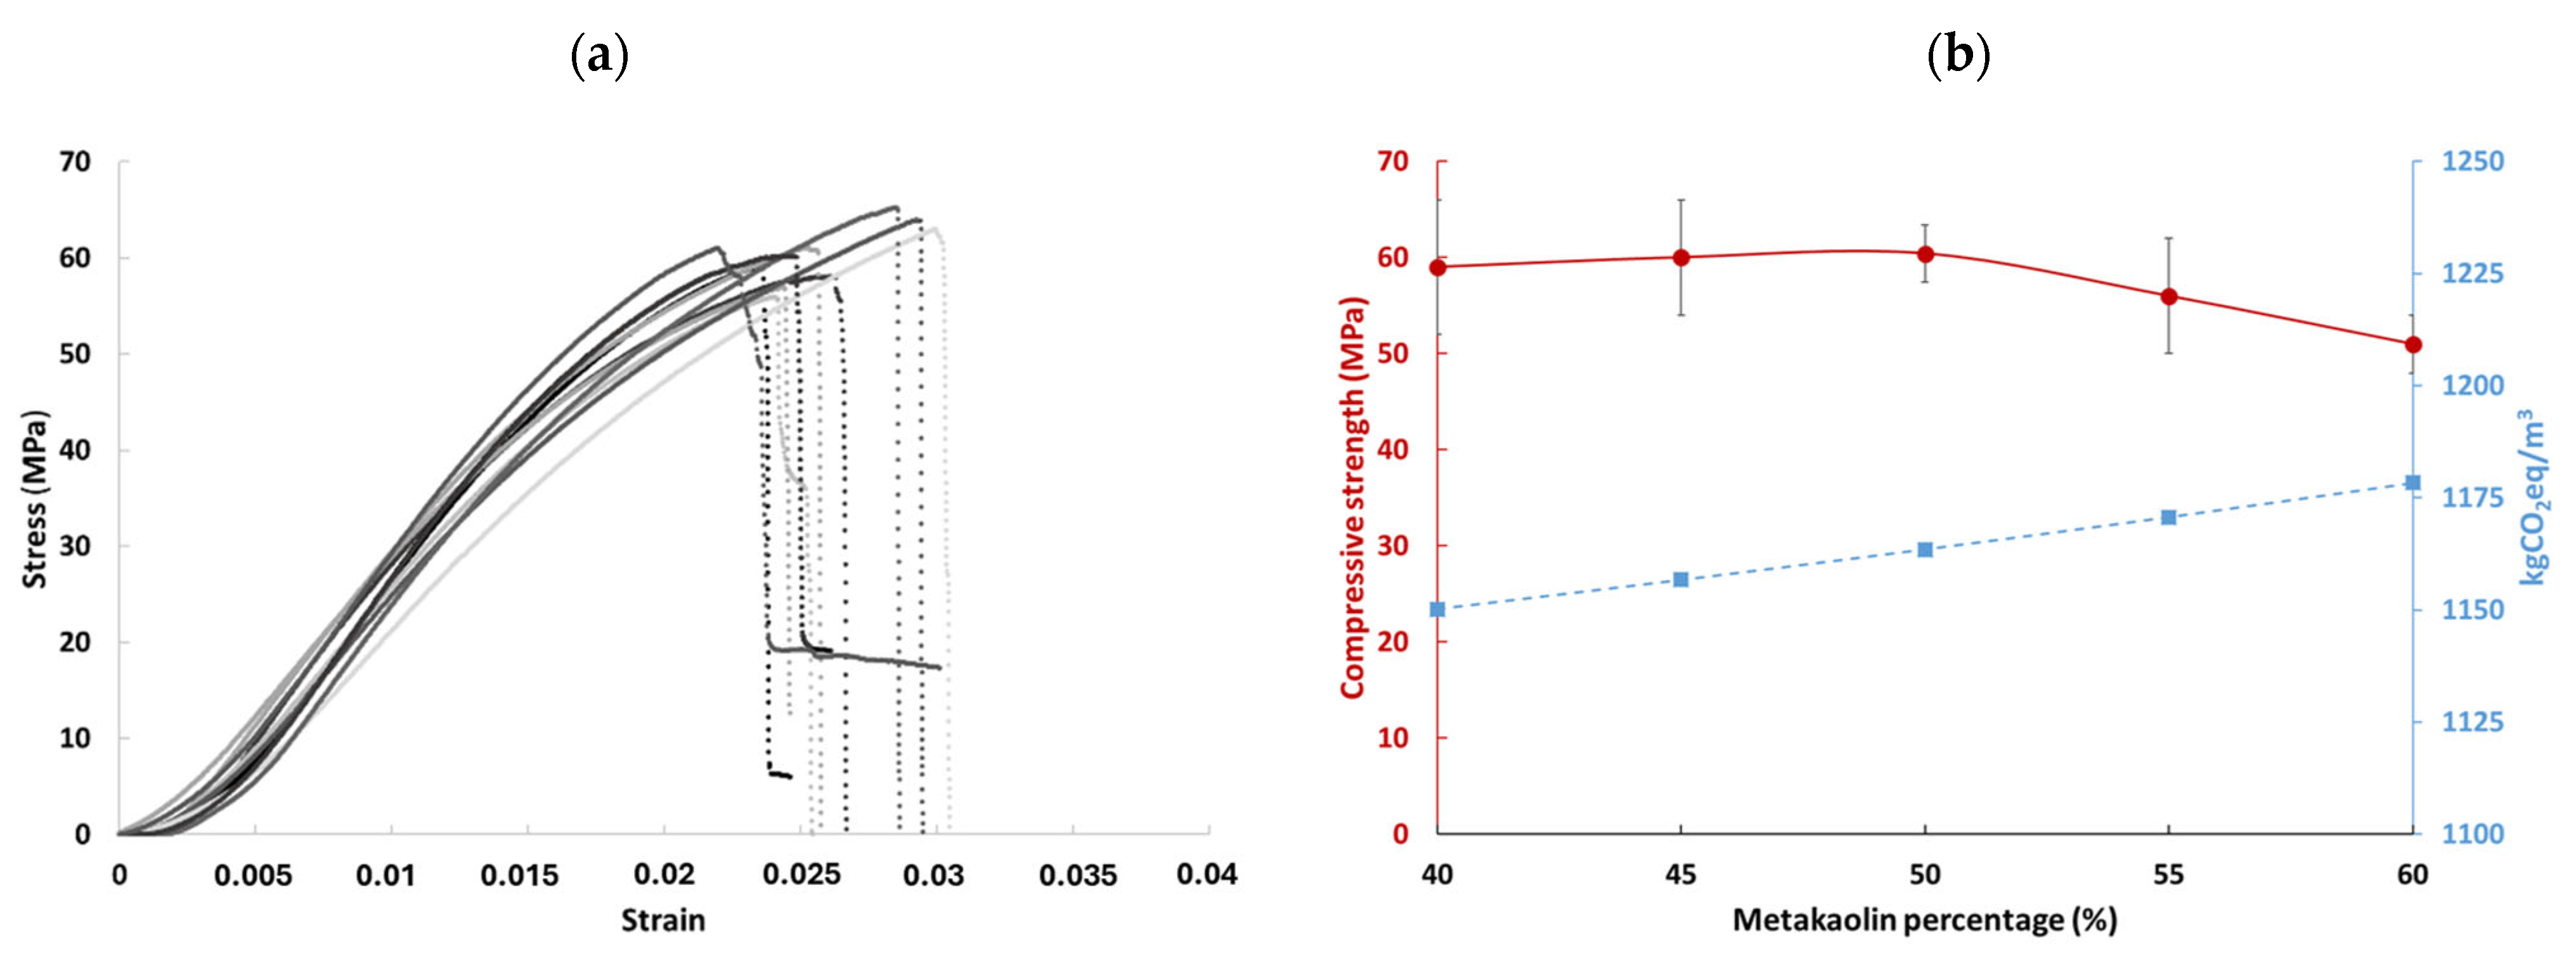
3.2.1. The Geopolymer Matrix
3.2.2. The Geopolymer Mortar
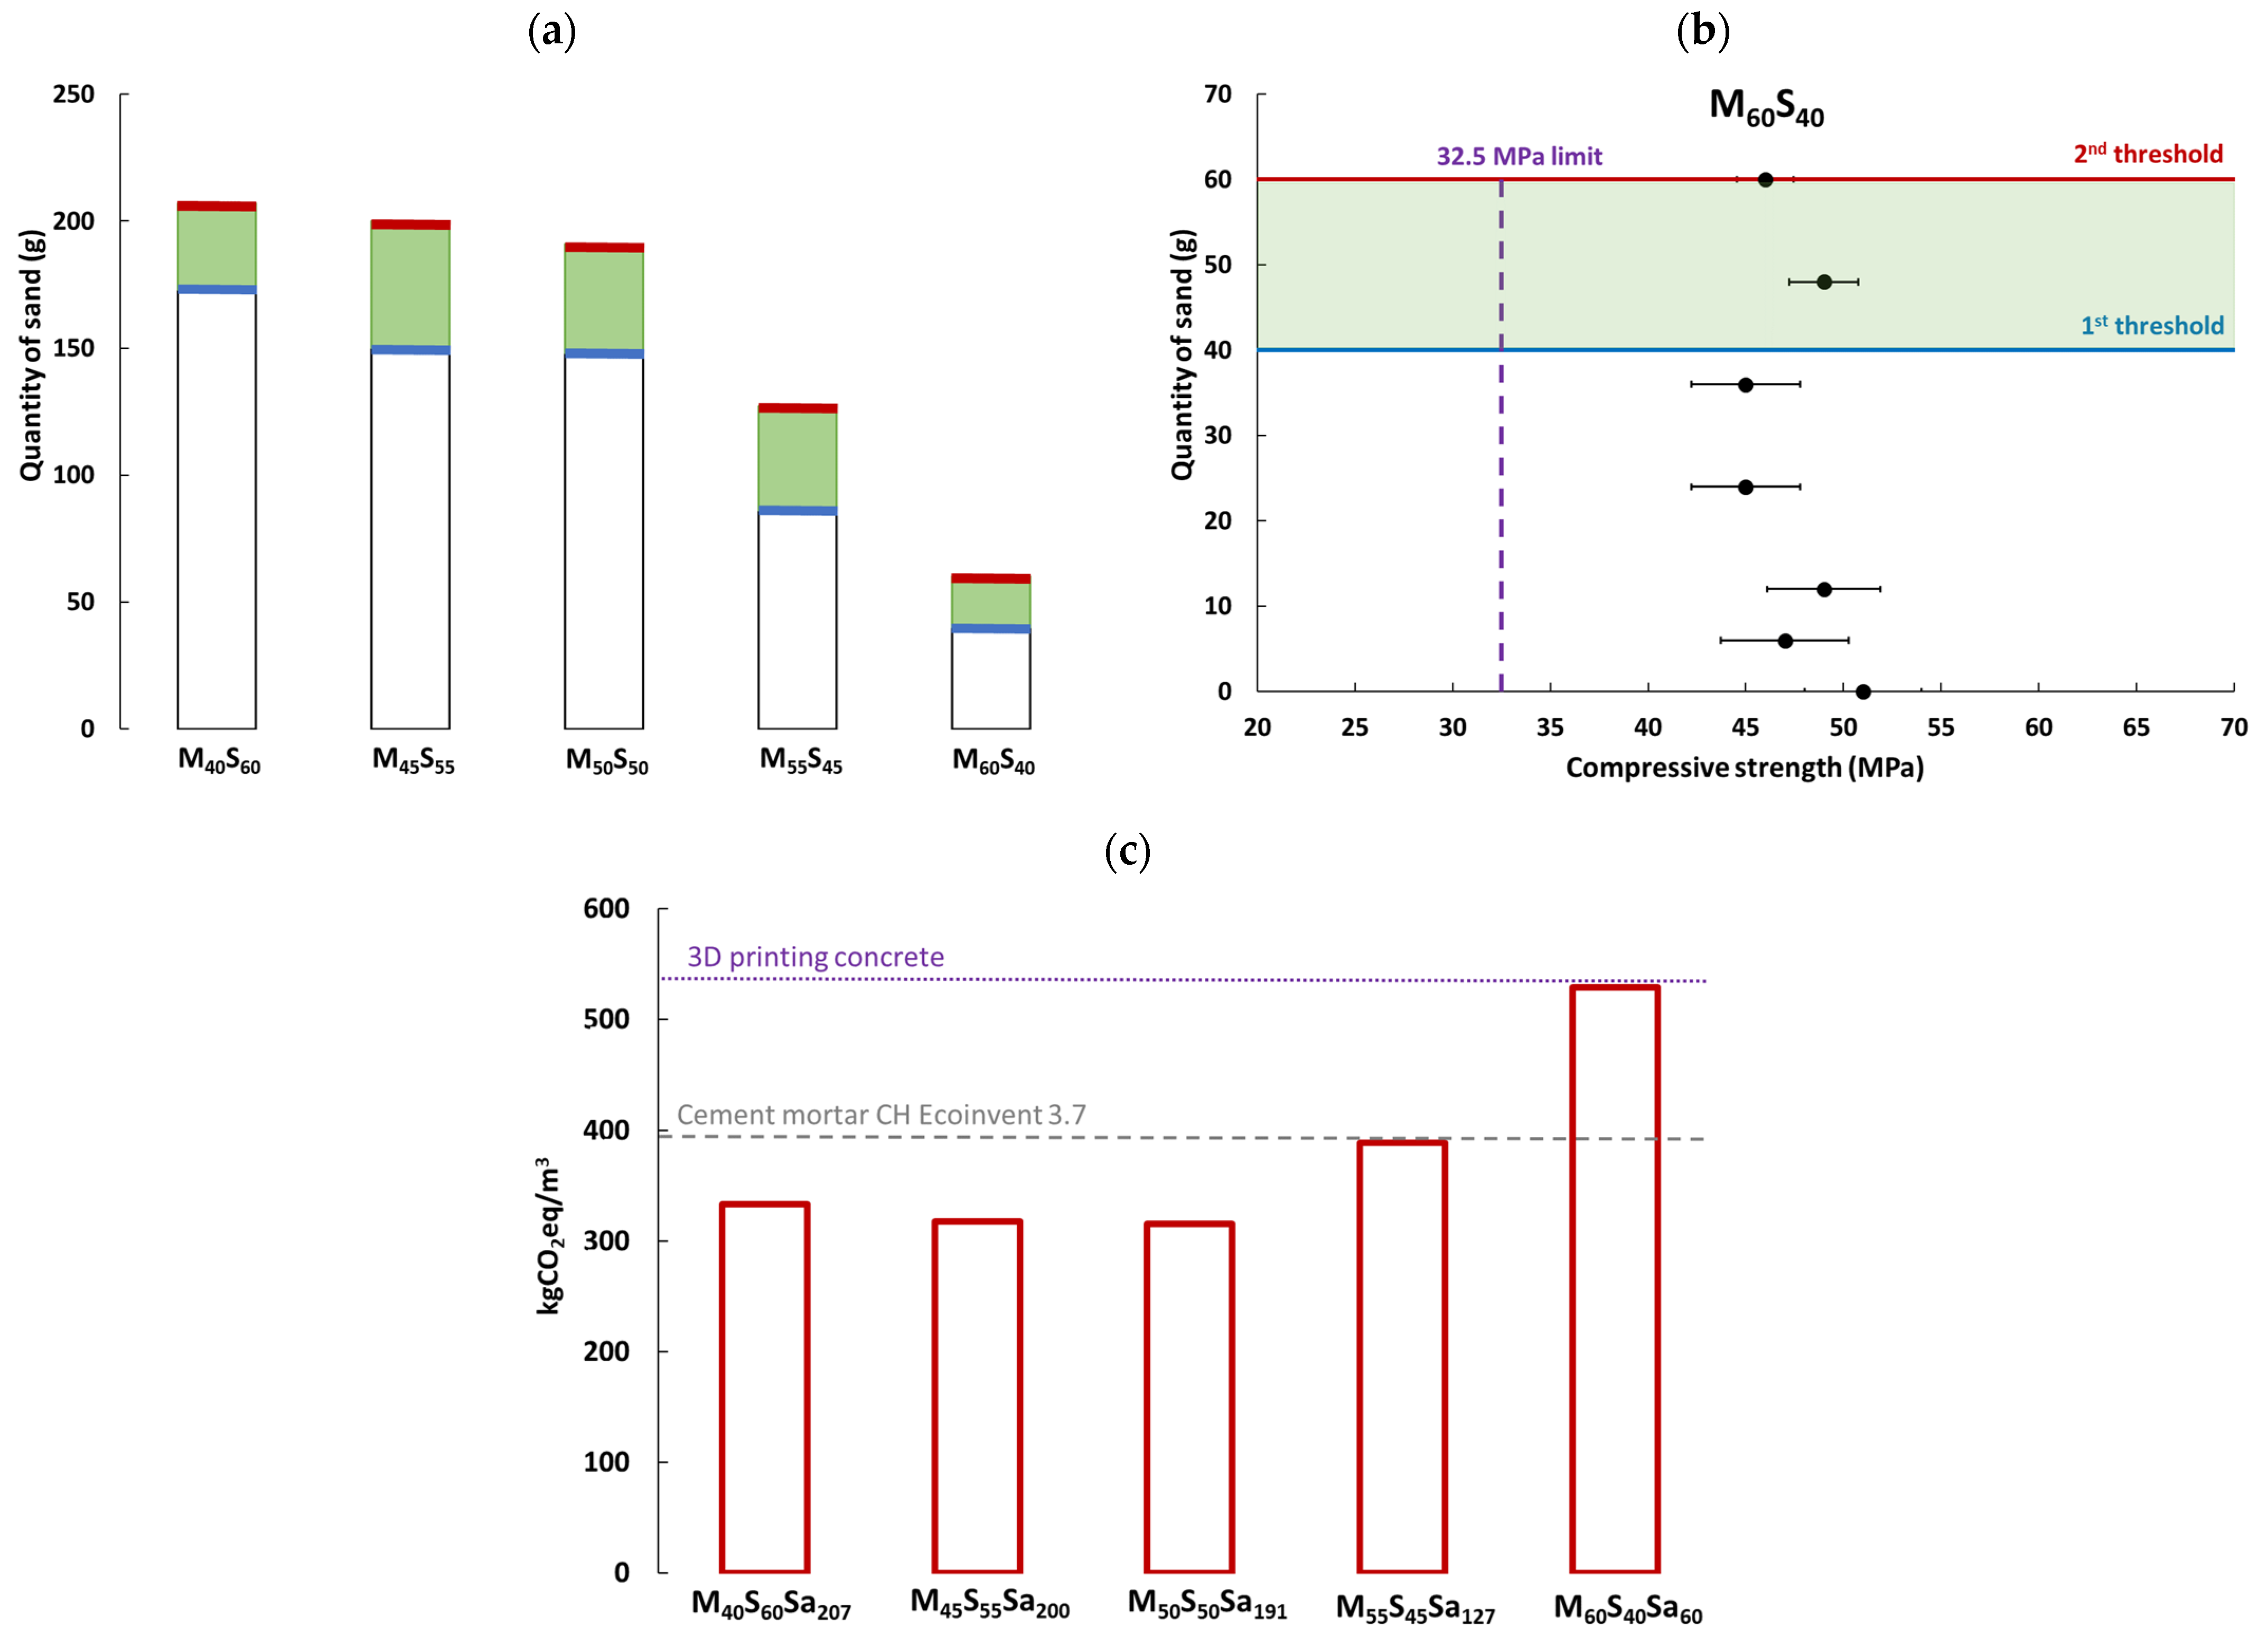
3.2.3. Optimization with Earth Addition
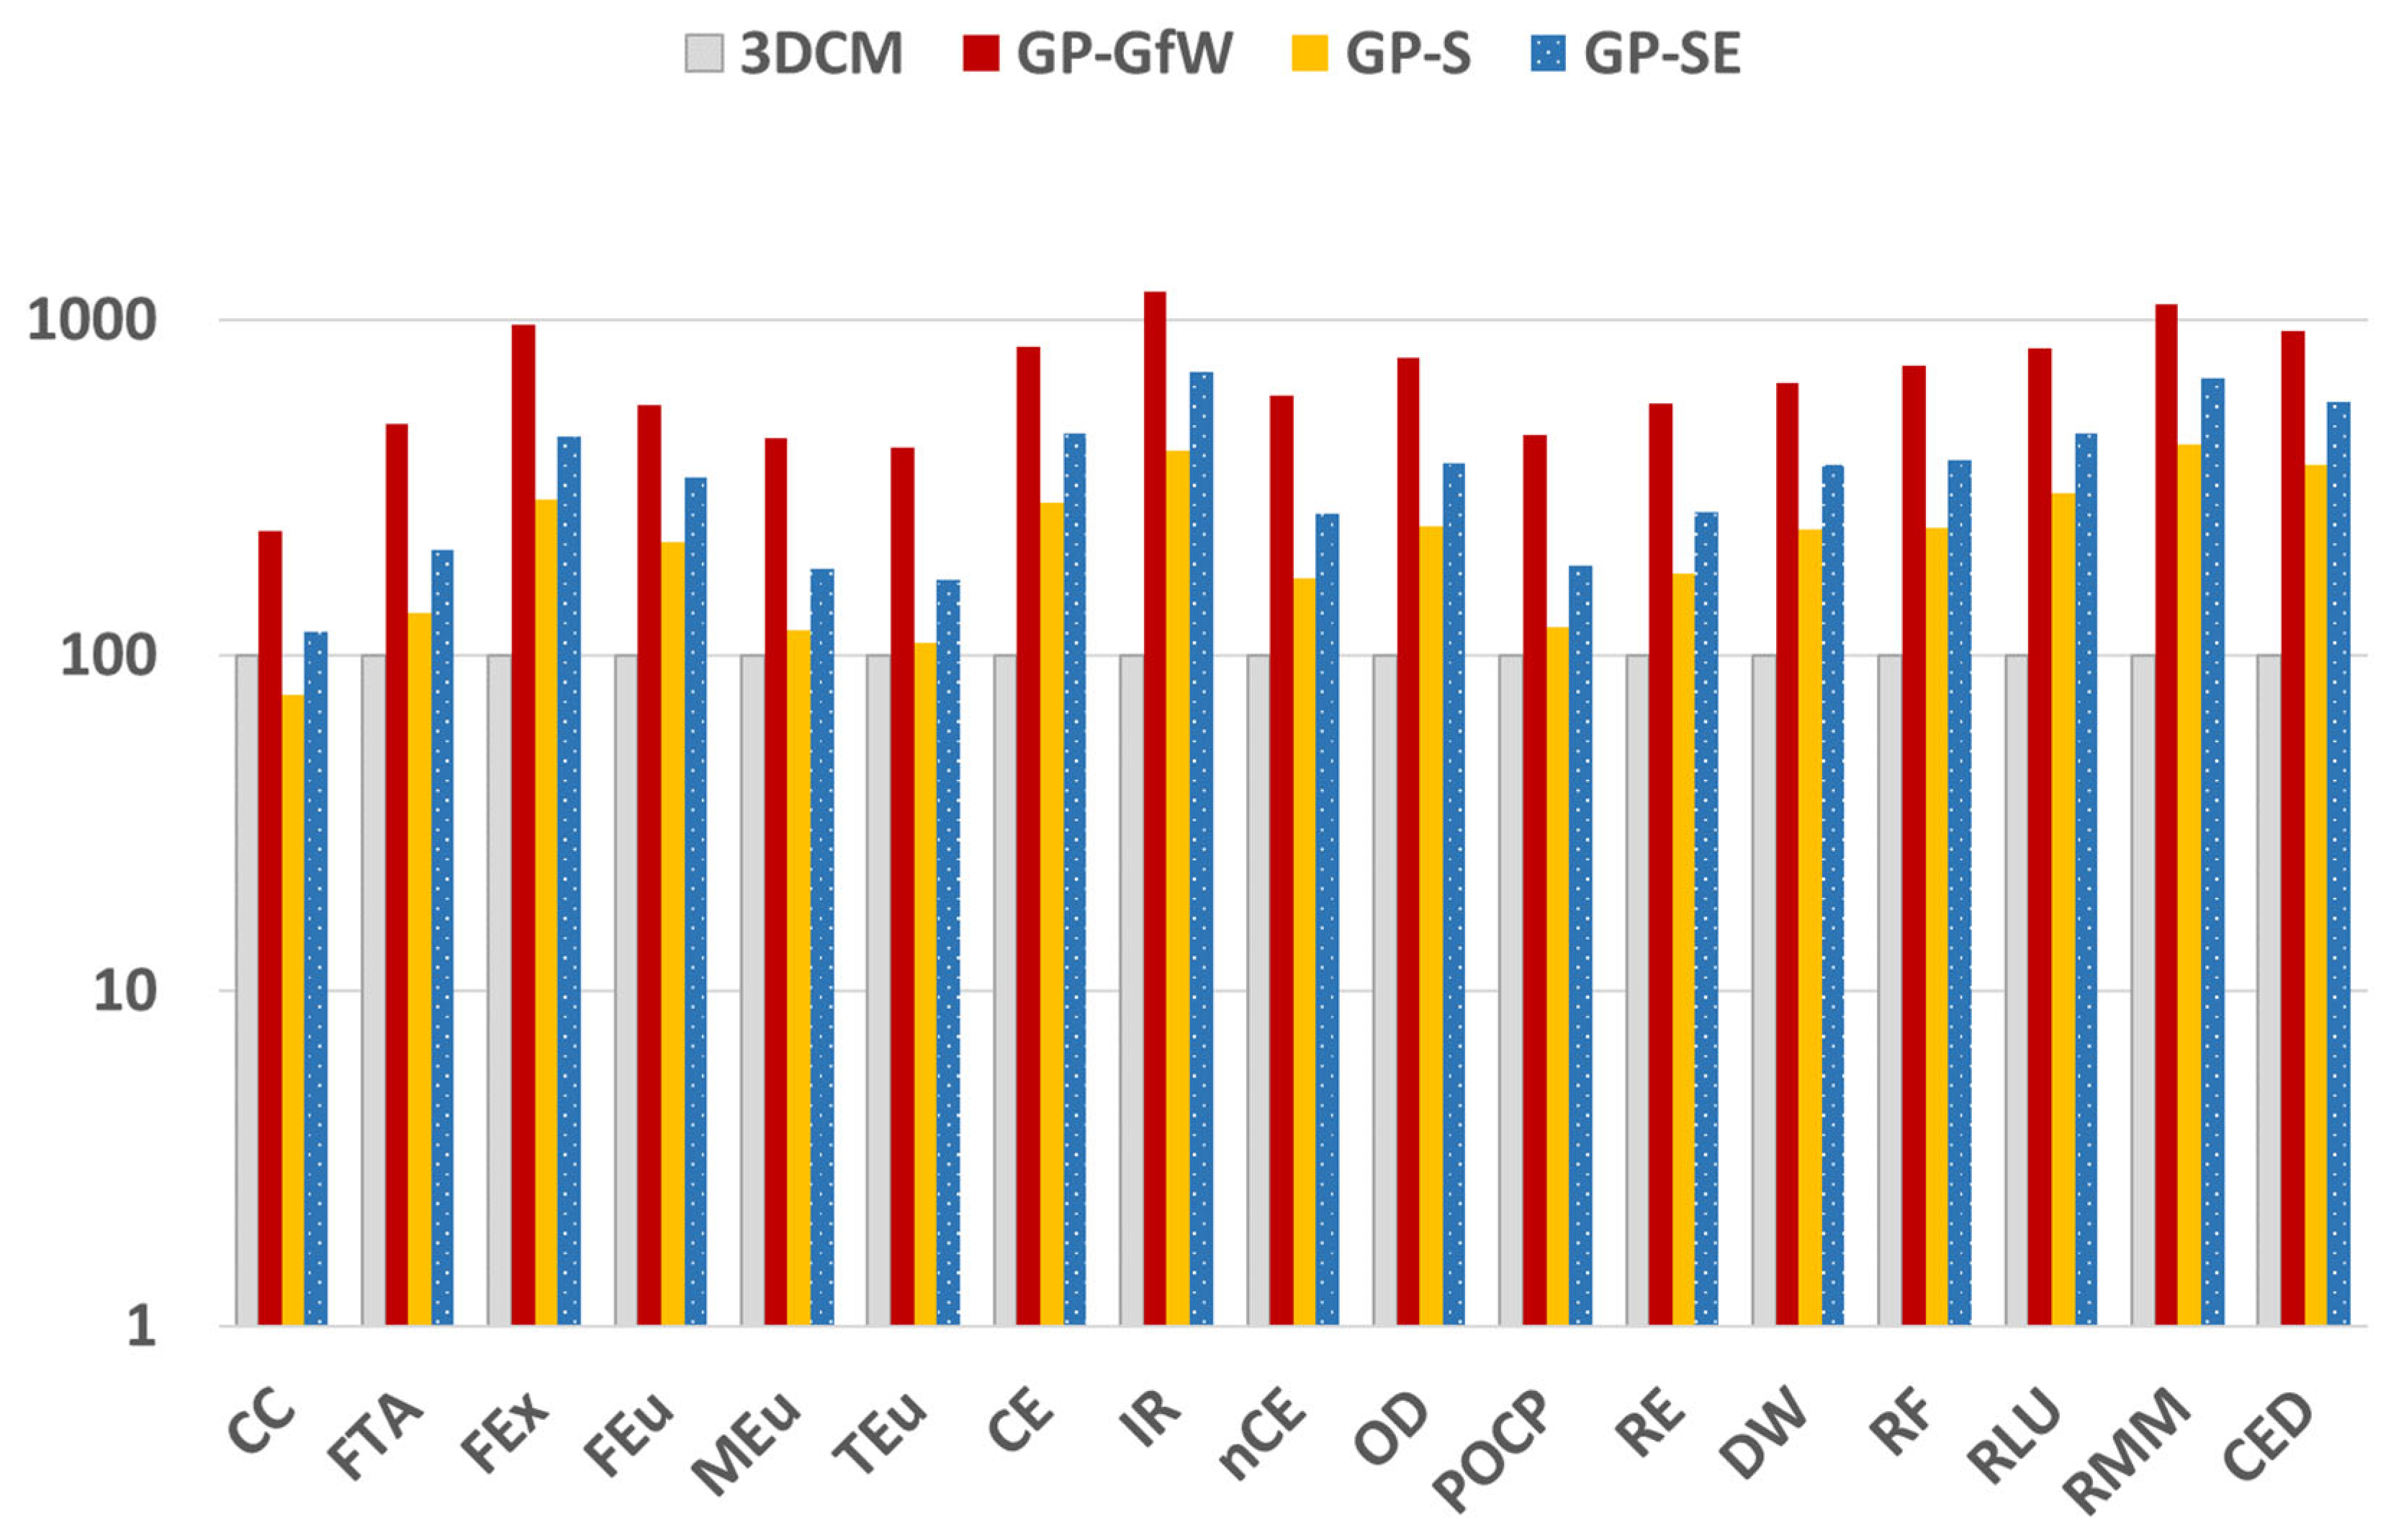
3.3. Comparison of the Optimized Geopolymer Formulation with Other Printing Materials
4. Discussion
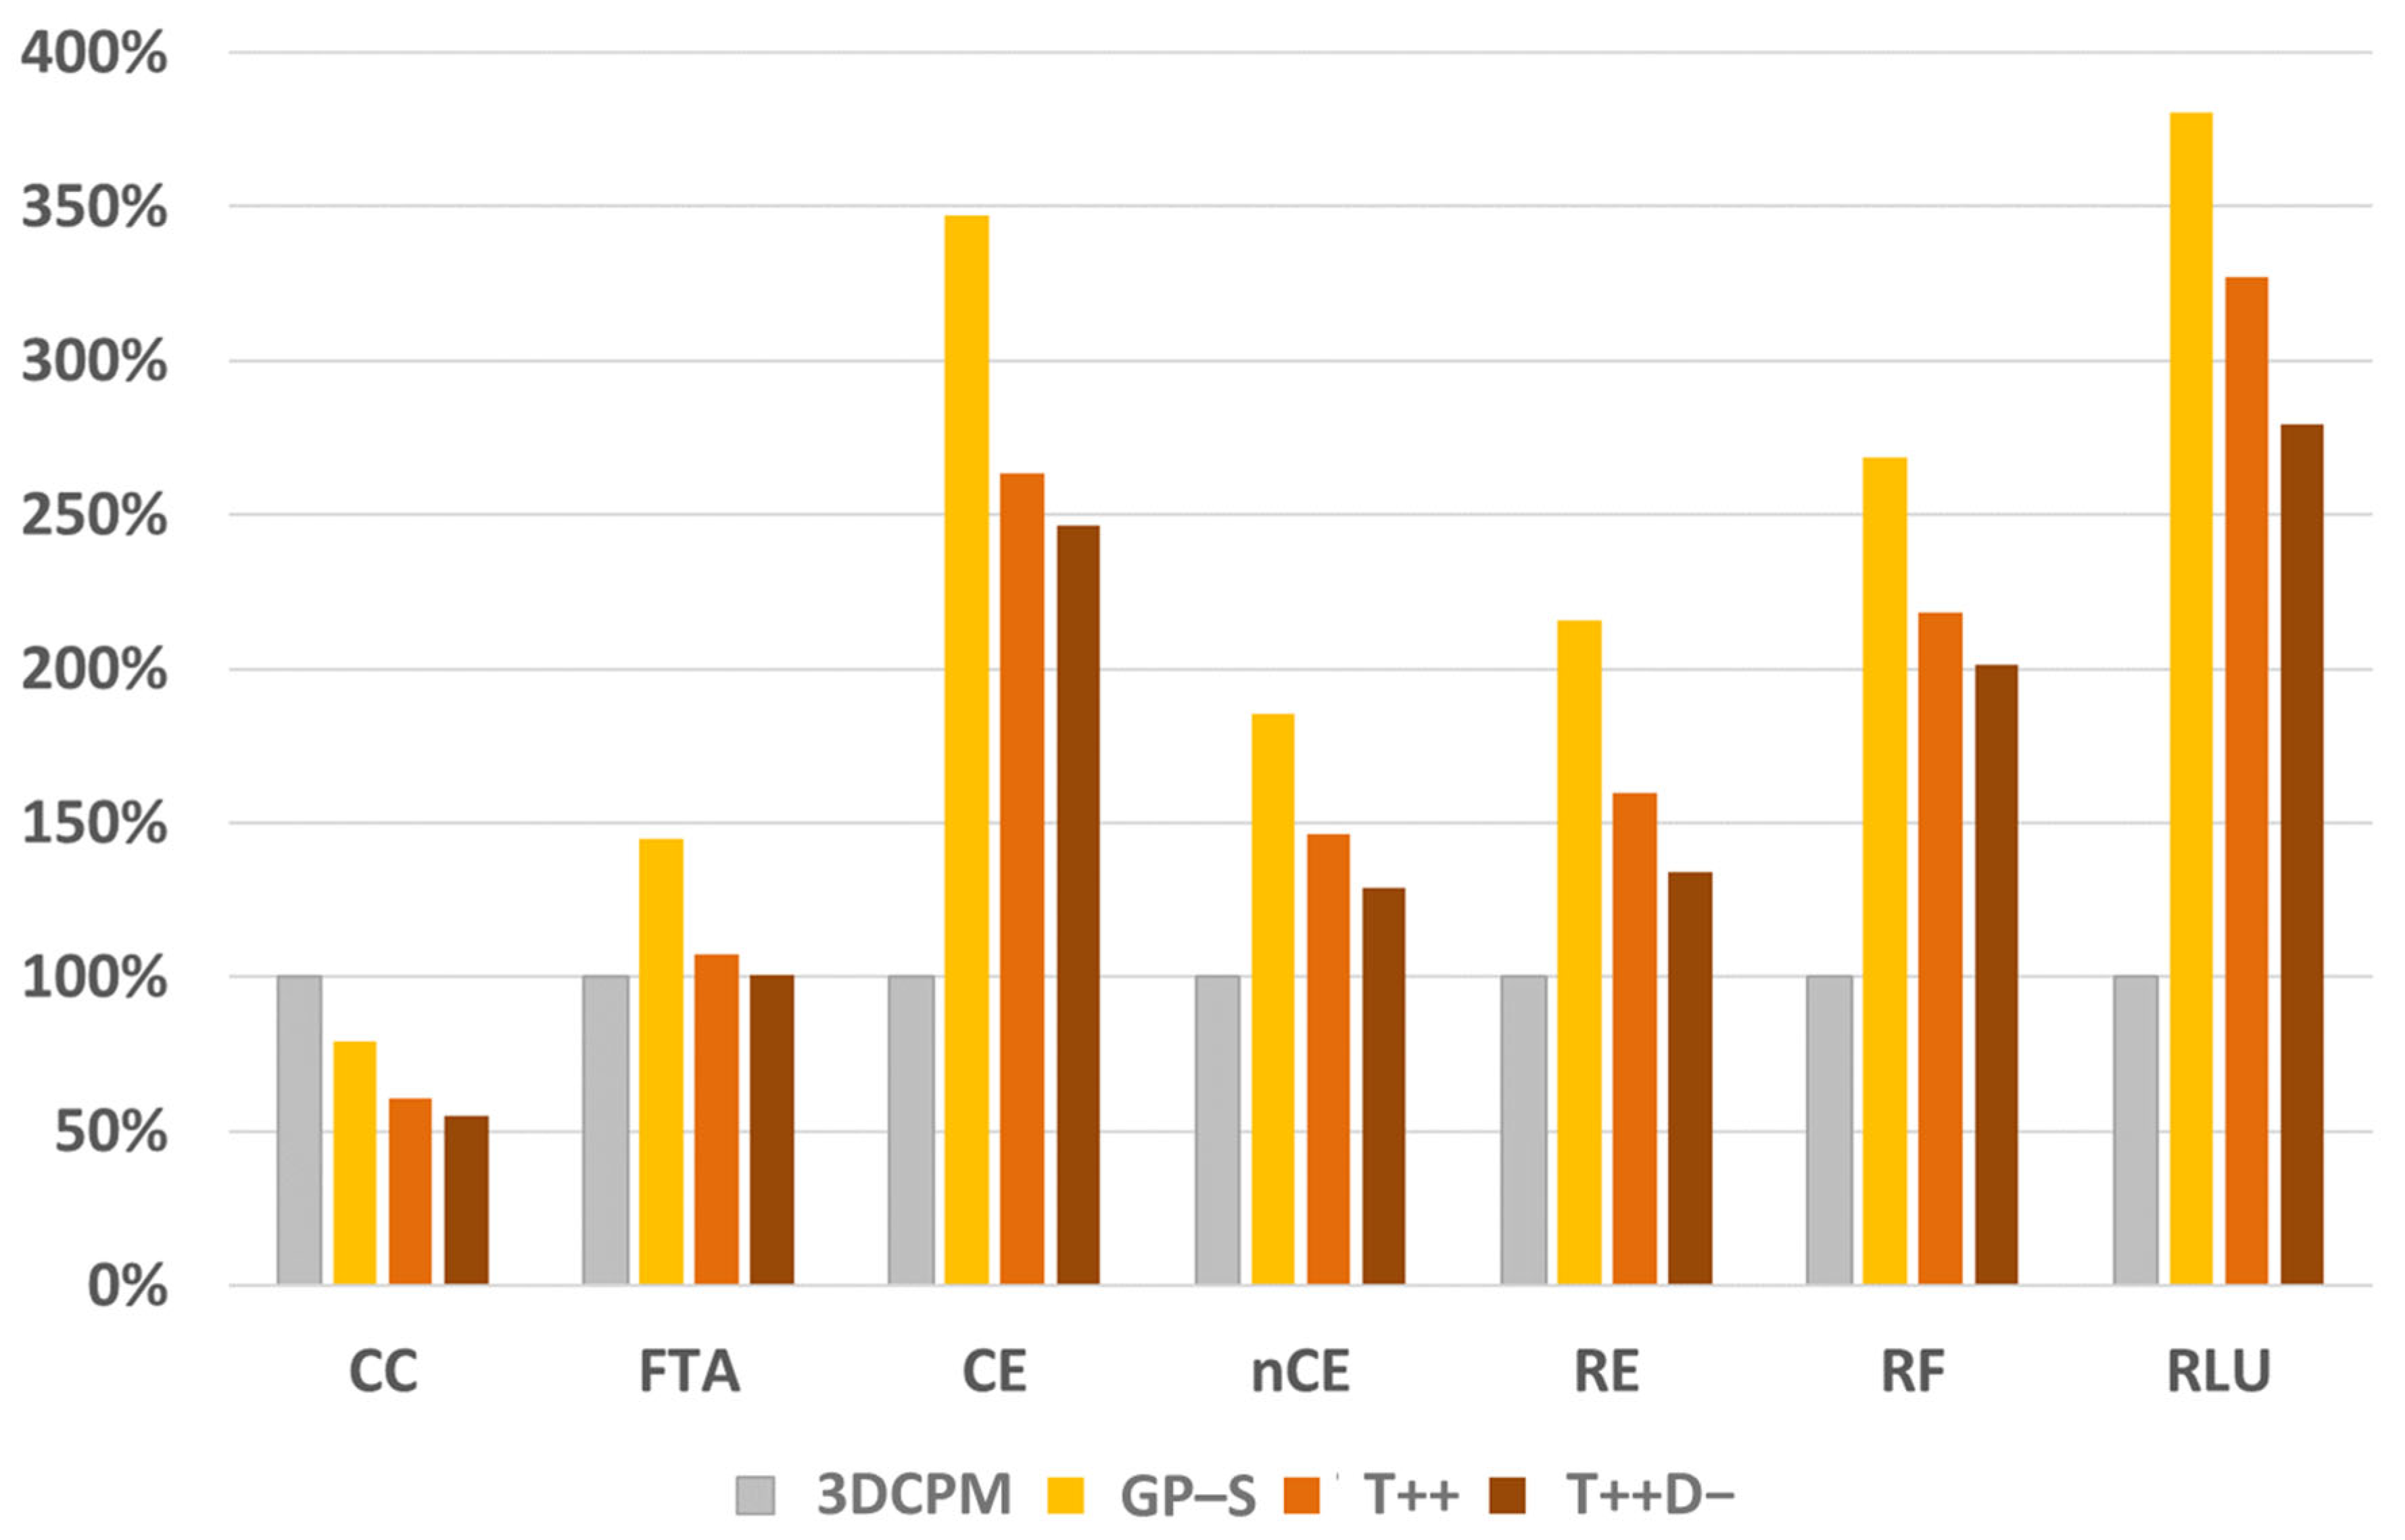
4.1. Value Chain Optimization
4.2. Matrix Optimization
4.3. Uncertainties
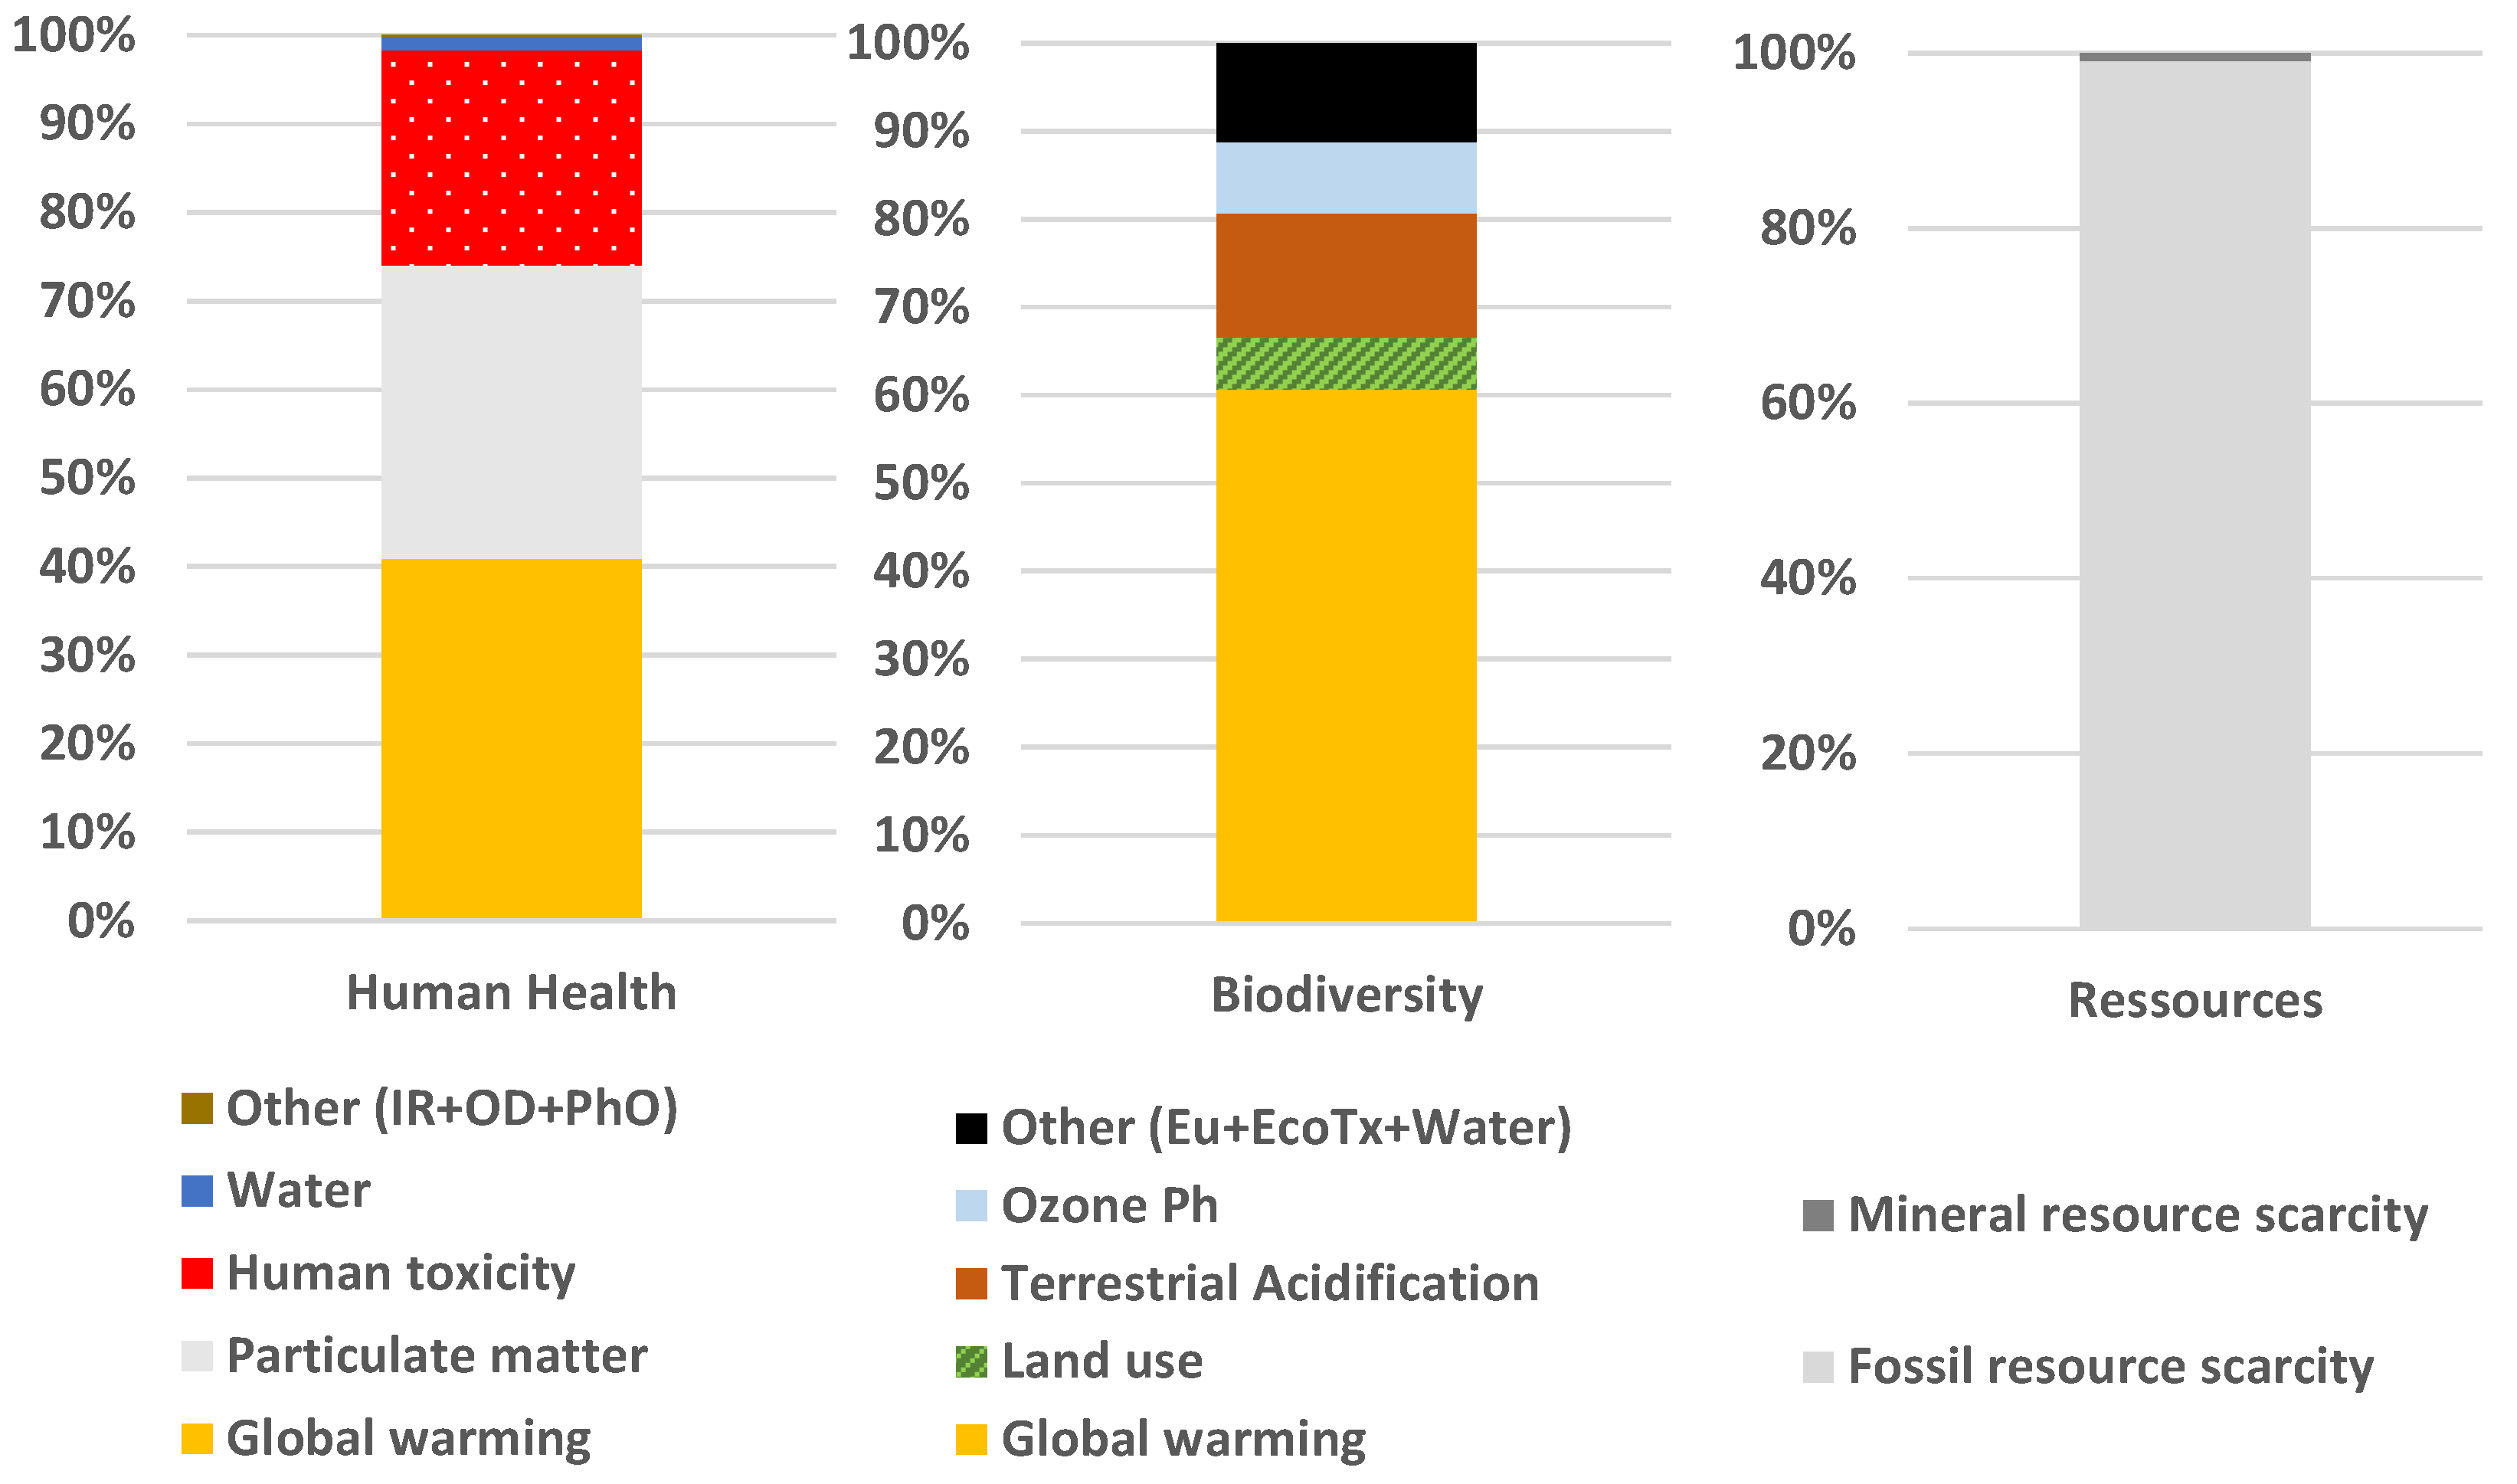
4.4. Damage Assessment Method
4.5. Comparative LCA with 3D Printing Mortar Based on OPC
5. Conclusions and Perspective
Supplementary Materials
Author Contributions
Funding
Informed Consent Statement
Data Availability Statement
Conflicts of Interest
References
- Miller, S.A.; Moore, F.C. Climate and health damages from global concrete production. Nat. Clim. Chang. 2020, 10, 439–443. [Google Scholar] [CrossRef]
- Shi, C.; Jiménez, A.F.; Palomo, A. New cements for the 21st century: The pursuit of an alternative to Portland cement. Cem. Concr. Res. 2011, 41, 750–763. [Google Scholar] [CrossRef]
- Habert, G.; Miller, S.A.; John, V.M.; Provis, J.L.; Favier, A.; Horvath, A.; Scrivener, K.L. Environmental impacts and decarbonization strategies in the cement and concrete industries. Nat. Rev. Earth Environ. 2020, 1, 559–573. [Google Scholar] [CrossRef]
- Makul, N. Modern sustainable cement and concrete composites: Review of current status, challenges and guidelines. Sustain. Mater. Technol. 2020, 25, e00155. [Google Scholar] [CrossRef]
- Sivakrishna, A.; Adesina, A.; Awoyera, P.O.; Rajesh Kumar, K. Green concrete: A review of recent developments. Mater. Today Proc. 2020, 27, 54–58. [Google Scholar] [CrossRef]
- Van Deventer, J.S.J.; Provis, J.L.; Duxson, P. Technical and commercial progress in the adoption of geopolymer cement. Miner. Eng. 2012, 29, 89–104. [Google Scholar] [CrossRef]
- UNEP. Sand and Sustainability: Finding New Solutions for Environmental Governance of Global Sand Resources; GRID-Geneva, United Nations Environment Programm: Geneva, Switzerland, 2019; Available online: https://unepgrid.ch/storage/app/media/documents/Sand_and_sustainability_UNEP_2019.pdf (accessed on 26 March 2021).
- Bendixen, M.; Best, J.; Hackney, C.; Iversen, L.L. Time is running out for sand. Nature 2019, 571, 29–31. [Google Scholar] [CrossRef] [PubMed]
- Davidovits, J. Geopolymer Chemistry and Applications; Geopolymer Institute: Saint-Quentin, France, 2008; ISBN 978-2-9514820-1-2. [Google Scholar]
- Zhang, P.; Zheng, Y.; Wang, K.; Zhang, J. A review on properties of fresh and hardened geopolymer mortar. Compos. Part B Eng. 2018, 152, 79–95. [Google Scholar] [CrossRef]
- Amran, Y.H.M.; Alyousef, R.; Alabduljabbar, H.; El-Zeadani, M. Clean production and properties of geopolymer concrete; A review. J. Clean. Prod. 2020, 251, 119679. [Google Scholar] [CrossRef]
- Pradhan, P.; Dwibedy, S.; Pradhan, M.; Panda, S.; Panigrahi, S.K. Durability characteristics of geopolymer concrete—Progress and perspectives. J. Build. Eng. 2022, 59, 105100. [Google Scholar] [CrossRef]
- Monteiro, P.J.M.; Miller, S.A.; Horvath, A. Towards sustainable concrete. Nat. Mater. 2017, 16, 698–699. [Google Scholar] [CrossRef] [PubMed]
- Provis, J.L. Green concrete or red herring?—Future of alkali-activated materials. Adv. Appl. Ceram. 2014, 113, 472–477. [Google Scholar] [CrossRef]
- Curran, M.A. Life Cycle Assessment Handbook: A Guide for Environmentally Sustainable Products; John Wiley & Sons: Hoboken, NJ, USA, 2012; ISBN 978-1-118-52841-9. [Google Scholar]
- Guinée, J.B.; Lindeijer, E. Handbook on Life Cycle Assessment: Operational Guide to the ISO Standards; Springer Science & Business Media: Berlin/Heidelberg, Germany, 2002; ISBN 978-1-4020-0228-1. [Google Scholar]
- Ghadir, P.; Zamanian, M.; Mahbubi-Motlagh, N.; Saberian, M.; Li, J.; Ranjbar, N. Shear strength and life cycle assessment of volcanic ash-based geopolymer and cement stabilized soil: A comparative study. Transp. Geotech. 2021, 31, 100639. [Google Scholar] [CrossRef]
- Meshram, R.B.; Kumar, S. Comparative life cycle assessment (LCA) of geopolymer cement manufacturing with Portland cement in Indian context. Int. J. Environ. Sci. Technol. 2022, 19, 4791–4802. [Google Scholar] [CrossRef]
- Habert, G.; d’Espinose de Lacaillerie, J.B.; Roussel, N. An environmental evaluation of geopolymer based concrete production: Reviewing current research trends. J. Clean. Prod. 2011, 19, 1229–1238. [Google Scholar] [CrossRef]
- Weil, M.; Dombrowski, K.; Buchwald, A. 10—Life-cycle analysis of geopolymers. In Geopolymers; Provis, J.L., van Deventer, J.S.J., Eds.; Woodhead Publishing: Sawston, UK, 2009; pp. 194–210. ISBN 978-1-84569-449-4. [Google Scholar]
- Matheu, P.S.; Ellis, K.; Varela, B. Comparing the Environmental Impacts of Alkali Activated Mortar and Traditional Portland Cement Mortar using Life Cycle Assessment. IOP Conf. Ser. Mater. Sci. Eng. 2015, 96, 012080. [Google Scholar] [CrossRef]
- Heath, A.; Paine, K.; McManus, M. Minimising the global warming potential of clay based geopolymers. J. Clean. Prod. 2014, 78, 75–83. [Google Scholar] [CrossRef]
- Davidovits, J. False Values on CO2 Emission for Geopolymer Cement/Concrete, Scientific Papers, Technical Paper #24, Geopolymer Institute Library. 2015. Available online: http://www.geopolymer.org/wp-content/uploads/False-CO2-values.pdf (accessed on 2 September 2021).
- Yao, Y.; Hu, M.; Maio, F.D.; Cucurachi, S. Life cycle assessment of 3D printing geo-polymer concrete: An ex-ante study. J. Ind. Ecol. 2020, 24, 116–127. [Google Scholar] [CrossRef]
- Morel, J.-C.; Charef, R.; Hamard, E.; Fabbri, A.; Beckett, C.; Bui, Q.-B. Earth as construction material in the circular economy context: Practitioner perspectives on barriers to overcome. Philos. Trans. R. Soc. B Biol. Sci. 2021, 376, 20200182. [Google Scholar] [CrossRef]
- Luzu, B.; Duc, M.; Djerbi, A.; Gautron, L. High Performance Illitic Clay-Based Geopolymer: Influence of the Mechanochemical Activation Duration on the Strength Development. In Calcined Clays for Sustainable Concrete; Bishnoi, S., Ed.; Springer: Singapore, 2020; pp. 363–373. [Google Scholar]
- Essaidi, N.; Samet, B.; Baklouti, S.; Rossignol, S. Feasibility of producing geopolymers from two different Tunisian clays before and after calcination at various temperatures. Appl. Clay Sci. 2014, 88–89, 221–227. [Google Scholar] [CrossRef]
- De Schutter, G.; Lesage, K.; Mechtcherine, V.; Nerella, V.N.; Habert, G.; Agusti-Juan, I. Vision of 3D printing with concrete—Technical, economic and environmental potentials. Cem. Concr. Res. 2018, 112, 25–36. [Google Scholar] [CrossRef]
- Song, R.; Wang, Y.; Ishutov, S.; Zambrano-Narvaez, G.; Hodder, K.J.; Chalaturnyk, R.J.; Sun, S.; Liu, J.; Gamage, R.P. A Comprehensive Experimental Study on Mechanical Behavior, Microstructure and Transport Properties of 3D-printed Rock Analogs. Rock. Mech. Rock. Eng. 2020, 53, 5745–5765. [Google Scholar] [CrossRef]
- Hassan, A.; Arif, M.; Shariq, M. Use of geopolymer concrete for a cleaner and sustainable environment—A review of mechanical properties and microstructure. J. Clean. Prod. 2019, 223, 704–728. [Google Scholar] [CrossRef]
- Singh, B.; Ishwarya, G.; Gupta, M.; Bhattacharyya, S.K. Geopolymer concrete: A review of some recent developments. Constr. Build. Mater. 2015, 85, 78–90. [Google Scholar] [CrossRef]
- Zakka, W.P.; Abdul Shukor Lim, N.H.; Chau Khun, M. A scientometric review of geopolymer concrete. J. Clean. Prod. 2021, 280, 124353. [Google Scholar] [CrossRef]
- Komnitsas, K. Potential of geopolymer technology towards green buildings and sustainable cities. Procedia Eng. 2011, 21, 1023–1032. [Google Scholar] [CrossRef]
- Zhong, H.; Zhang, M. 3D printing geopolymers: A review. Cem. Concr. Compos. 2022, 128, 104455. [Google Scholar] [CrossRef]
- Turner, L.K.; Collins, F.G. Carbon dioxide equivalent (CO2-e) emissions: A comparison between geopolymer and OPC cement concrete. Constr. Build. Mater. 2013, 43, 125–130. [Google Scholar] [CrossRef]
- Archez, J.; Maitenaz, S.; Demont, L.; Charrier, M.; Mesnil, R.; Texier-Mandoki, N.; Bourbon, X.; Rossignol, S.; Caron, J.F. Strategy to shape, on a half-meter scale, a geopolymer composite structure by additive manufacturing. Open Ceram. 2021, 5, 100071. [Google Scholar] [CrossRef]
- NF-EN 197-1; Cement—Part 1: Composition, Specifications and Conformity Criteria for Common Cements. NFE: Paris, France, 2001.
- Archez, J.; Texier-Mandoki, N.; Bourbon, X.; Caron, J.F.; Rossignol, S. Adaptation of the geopolymer composite formulation binder to the shaping process. Mater. Today Commun. 2020, 25, 101501. [Google Scholar] [CrossRef]
- Gökçe, H.S.; Tuyan, M.; Nehdi, M.L. Alkali-activated and geopolymer materials developed using innovative manufacturing techniques: A critical review. Constr. Build. Mater. 2021, 303, 124483. [Google Scholar] [CrossRef]
- Archez, J.; Texier-Mandoki, N.; Bourbon, X.; Caron, J.F.; Rossignol, S. Shaping of geopolymer composites by 3D printing. J. Build. Eng. 2021, 34, 101894. [Google Scholar] [CrossRef]
- Mutel, C. Brightway: An open source framework for Life Cycle Assessment. JOSS 2017, 2, 236. [Google Scholar] [CrossRef]
- Steubing, B.; de Koning, D.; Haas, A.; Mutel, C.L. The Activity Browser—An open source LCA software building on top of the brightway framework. Softw. Impacts 2020, 3, 100012. [Google Scholar] [CrossRef]
- Frischknecht, R.; Jungbluth, N.; Althaus, H.-J.; Doka, G.; Dones, R.; Heck, T.; Hellweg, S.; Hischier, R.; Nemecek, T.; Rebitzer, G.; et al. The ecoinvent Database: Overview and Methodological Framework (7 pp). Int. J. Life Cycle Assess. 2005, 10, 3–9. [Google Scholar] [CrossRef]
- Wernet, G.; Bauer, C.; Steubing, B.; Reinhard, J.; Moreno-Ruiz, E.; Weidema, B. The ecoinvent database version 3 (part I): Overview and methodology. Int. J. Life Cycle Assess. 2016, 21, 1218–1230. [Google Scholar] [CrossRef]
- Fawer, M.; Concannon, M.; Rieber, W. Life cycle inventories for the production of sodium silicates. Int. J. LCA 1999, 4, 207. [Google Scholar] [CrossRef]
- Chomkhamsri, K.; Wolf, M.-A.; Pant, R. International Reference Life Cycle Data System (ILCD) Handbook: Review Schemes for Life Cycle Assessment. In Towards Life Cycle Sustainability Management; Finkbeiner, M., Ed.; Springer: Amsterdam, The Netherlands, 2011; pp. 107–117. ISBN 978-94-007-1898-2. [Google Scholar]
- Saouter, E.; Biganzoli, F.; Ceriani, L.; Versteeg, D.; Crenna, E.; Zampori, L.; Sala, S.; Pant, R. Environmental Footprint: Update of Life Cycle Impact Assessment Methods: Ecotoxicity Freshwater, Human Toxicity Cancer, and Non Cancer; Publications Office of the European Union: Luxembourg, 2020; ISBN 978-92-76-17143-0. [Google Scholar]
- Huijbregts, M.A.J.; Steinmann, Z.J.N.; Elshout, P.M.F.; Stam, G.; Verones, F.; Vieira, M.; Zijp, M.; Hollander, A.; van Zelm, R. ReCiPe2016: A harmonised life cycle impact assessment method at midpoint and endpoint level. Int. J. Life Cycle Assess. 2017, 22, 138–147. [Google Scholar] [CrossRef]
- Huijbregts, M.A.J.; Rombouts, L.J.A.; Hellweg, S.; Frischknecht, R.; Hendriks, A.J.; van de Meent, D.; Ragas, A.M.J.; Reijnders, L.; Struijs, J. Is Cumulative Fossil Energy Demand a Useful Indicator for the Environmental Performance of Products? Environ. Sci. Technol. 2006, 40, 641–648. [Google Scholar] [CrossRef]
- Gharzouni, A.; Sobrados, I.; Balouti, S.; Joussein, E.; Rossignol, S. Control of polycondensation reaction generated from different metakaolins and alkaline solutions. J. Ceram. Sci. Technol. 2017, 8, 365–376. [Google Scholar]
- Jaya, N.A.; Liew, Y.M.; Heah, C.Y.; Abdullah, M.M.A.B. Effect of solid-to-liquid ratios on metakaolin geopolymers. AIP Conf. Proc. 2018, 2045, 020099. [Google Scholar] [CrossRef]
- Roussel, N. Rheological requirements for printable concretes. Cem. Concr. Res. 2018, 112, 76–85. [Google Scholar] [CrossRef]
- Romagnoli, M.; Leonelli, C.; Kamse, E.; Lassinantti Gualtieri, M. Rheology of geopolymer by DOE approach. Constr. Build. Mater. 2012, 36, 251–258. [Google Scholar] [CrossRef]
- Kuzmenko, K.; Roux, C.; Feraille, A.; Baverel, O. Assessing environmental impact of digital fabrication and reuse of constructive systems. Structures 2021, 31, 1300–1310. [Google Scholar] [CrossRef]
- Agusti-Juan, I.; Habert, G. An Environmental Perspective on Digital Fabrication in Architecture and Construction. In Proceedings of the 21st International Conference on Computer-Aided Architectural Design Research in Asia (Caadria 2016), Melbourne, Australia, 30 March–2 April 2016; pp. 797–806. Available online: http://papers.cumincad.org/data/works/att/caadria2016_797.pdf (accessed on 7 May 2021).
- Agustí-Juan, I.; Müller, F.; Hack, N.; Wangler, T.; Habert, G. Potential benefits of digital fabrication for complex structures: Environmental assessment of a robotically fabricated concrete wall. J. Clean. Prod. 2017, 154, 330–340. [Google Scholar] [CrossRef]
- San Nicolas, R.; Cyr, M.; Escadeillas, G. Characteristics and applications of flash metakaolins. Appl. Clay Sci. 2013, 83–84, 253–262. [Google Scholar] [CrossRef]
- Deteuf, C. Imerys Metakaolin Production.pdf. 2016. Available online: https://geopolymer.org/fichiers/gpcamp-2016/Deteuf%20-%20Imerys%20metakaolin%20production.pdf (accessed on 23 September 2021).
- Batis, G.; Pantazopoulou, P.; Tsivilis, S.; Badogiannis, E. The effect of metakaolin on the corrosion behavior of cement mortars. Cem. Concr. Compos. 2005, 27, 125–130. [Google Scholar] [CrossRef]
- Handbook on Kaolin and Kaolinic Clays | BRGM. Available online: https://www.brgm.fr/en/reference-completed-project/handbook-kaolin-kaolinic-clays (accessed on 7 April 2023).
- Toutou, Z.; Roussel, N.; Lanos, C. The squeezing test: A tool to identify firm cement-based material’s rheological behaviour and evaluate their extrusion ability. Cem. Concr. Res. 2005, 35, 1891–1899. [Google Scholar] [CrossRef]
- Sleiman, H.; Perrot, A.; Amziane, S. A new look at the measurement of cementitious paste setting by Vicat test. Cem. Concr. Res. 2010, 40, 681–686. [Google Scholar] [CrossRef]
- Ducoulombier, N.; Mesnil, R.; Carneau, P.; Demont, L.; Bessaies-Bey, H.; Caron, J.-F.; Roussel, N. The “Slugs-test” for extrusion-based additive manufacturing: Protocol, analysis and practical limits. Cem. Concr. Compos. 2021, 121, 104074. [Google Scholar] [CrossRef]
- Heijungs, R.; Huijbregts, M.A. A Review of Approaches to Treat Uncertainty in LCA. 2004. Available online: http://scholarsarchive.byu.edu/iemssconference/2004/all/197/ (accessed on 7 September 2017).
- Oberschelp, C.; Hellweg, S.; Bradford, E.; Pfister, S.; Huo, J.; Wang, Z. Poor Data and Outdated Methods Sabotage the Decarbonization Efforts of the Chemical Industry. 2023. Available online: https://doi.org/10.26434/chemrxiv-2023-8c86t (accessed on 25 May 2023).
- Shobeiri, V.; Bennett, B.; Xie, T.; Visintin, P. A comprehensive assessment of the global warming potential of geopolymer concrete. J. Clean. Prod. 2021, 297, 126669. [Google Scholar] [CrossRef]
- Bulle, C.; Margni, M.; Patouillard, L.; Boulay, A.-M.; Bourgault, G.; De Bruille, V.; Cao, V.; Hauschild, M.; Henderson, A.; Humbert, S.; et al. IMPACT World+: A globally regionalized life cycle impact assessment method. Int. J. Life Cycle Assess. 2019, 24, 1653–1674. [Google Scholar] [CrossRef]
- Hedberg, J.; Fransson, K.; Prideaux, S.; Roos, S.; Jönsson, C.; Odnevall Wallinder, I. Improving the Life Cycle Impact Assessment of Metal Ecotoxicity: Importance of Chromium Speciation, Water Chemistry, and Metal Release. Sustainability 2019, 11, 1655. [Google Scholar] [CrossRef]
- Gandhi, N.; Diamond, M.L. Freshwater ecotoxicity characterization factors for aluminum. Int. J. Life Cycle Assess. 2018, 23, 2137–2149. [Google Scholar] [CrossRef]
- Muller, S.; Lassin, A.; Lai, F.; Thiéry, D.; Guignot, S. Modelling releases from tailings in life cycle assessments of the mining sector: From generic models to reactive transport modelling. Miner. Eng. 2022, 180, 107481. [Google Scholar] [CrossRef]
- Gartner, E.; Sui, T. Alternative cement clinkers. Cem. Concr. Res. 2018, 114, 27–39. [Google Scholar] [CrossRef]


| Geopolymer (GP) Description | GHG Emissions of GP (kgCO2eq/m3) | GHG Emissions of Ref. OPC (kgCO2eq/m3) | Ref | Comments |
|---|---|---|---|---|
| Binder, suitable for 3D printing—FA50% + GGBS50% | 107 | 556 | [34] | Carbon accounting and not full LCA (f.e. water carbon footprint is set to zero). Reference binder is 80% OPC and 20% FA. |
| Binder, suitable for 3D printing—FA78.5% + GGBS13.8% + SF7.7% | 134 | 556 | [34] | Carbon accounting and not full LCA (f.e. water carbon footprint is set to zero). Reference binder is 80% OPC and 20% FA. |
| Slag and FA GP binder for 3D printing | 677 | 493 | [24] | Full, complete LCA, including sensitivity analysis on allocations. |
| “Standard” FA GP concrete | 320 | 354 | [35] | Carbon accounting and not full LCA. |
| FA GP concrete | 169 | 306 | [19] | Also investigating MK-GP, but clear figures are not available. MK-GP impacts are higher than FA-GP impacts. |
| FA and slag GP cement | 267 | 895 | [18] | Indian context, cement and not concrete. |
| Particle Type | Sand | Earth | |||
|---|---|---|---|---|---|
| Grain size (mm) | 0–4 | 1.6–2.5 | 0.8–1.6 | 0.4–0.8 | <0.4 |
| Water absorption 0.02 (mL/g) | 0.13 | 0.06 | 0.28 | 0.58 | 0.75 |
| Picture |  | 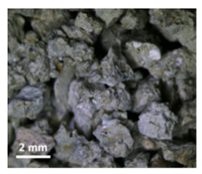 |  | 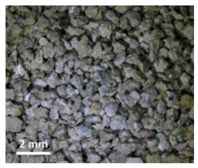 | 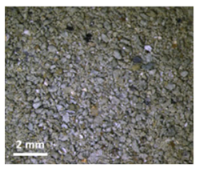 |
| Impact Category | Abbreviation | Unit |
|---|---|---|
| Climate Change Total | CC | kg CO2-eq |
| Freshwater and Terrestrial Acidification | FTA | mol H+-eq |
| Freshwater Ecotoxicity | Fex | CTUe |
| Freshwater Eutrophication | Feu | kg P-eq |
| Marine Eutrophication | Meu | kg N-eq |
| Terrestrial Eutrophication | Teu | mol N-eq |
| Carcinogenic Effects | CE | CTUh |
| Ionizing Radiation | IR | kg Bq U235 |
| Non-Carcinogenic Effects | nCE | CTUh |
| Ozone Layer Depletion | OD | kg CFC-11-eq |
| Photochemical Ozone Creation | POCP | kg NMVOC eq |
| Respiratory Effects, Inorganics | RE | disease incidences |
| Resources, Dissipated Water | DW | m3 water deprived |
| Resources, Fossils | RF | Megajoule |
| Resources, Land Use | RLU | soil quality index—dimensionless |
| Resources, Minerals, and Metals | RMM | kg Sb-Eq |
| Cumulative Energy Demand | CED | MJ-Eq |
| Quantity (in kg/m3) | 3D Cement Mortar— «3DCM» [54] | Quantity (in kg/m3) | GP Mortar «GP–GfW» [36] | GP Mortar «GP–S» (Section 3.2.2) | GP Mortar «GP–SE» (Section 3.2.3) |
|---|---|---|---|---|---|
| OPC | 540 | MK | 915.4 | 327.4 | 505 |
| Silica Fume | 480 | PSS | 736.3 | 327.4 | 505 |
| Sand | 1033 | Sand | 0 | 1248.8 | 666.6 |
| Water | 212 | Wollastonite | 298.5 | 0 | 0 |
| Accelerator | 6 | Glass fibers | 39.8 | 0 | 0 |
| Plasticizers | 8.8 | Steamed earth | 0 | 0 | 333.3 |
Disclaimer/Publisher’s Note: The statements, opinions and data contained in all publications are solely those of the individual author(s) and contributor(s) and not of MDPI and/or the editor(s). MDPI and/or the editor(s) disclaim responsibility for any injury to people or property resulting from any ideas, methods, instructions or products referred to in the content. |
© 2024 by the authors. Licensee MDPI, Basel, Switzerland. This article is an open access article distributed under the terms and conditions of the Creative Commons Attribution (CC BY) license (https://creativecommons.org/licenses/by/4.0/).
Share and Cite
Roux, C.; Archez, J.; Le Gall, C.; Saadé, M.; Féraille, A.; Caron, J.-F. Towards Sustainable Material: Optimizing Geopolymer Mortar Formulations for 3D Printing: A Life Cycle Assessment Approach. Sustainability 2024, 16, 3328. https://doi.org/10.3390/su16083328
Roux C, Archez J, Le Gall C, Saadé M, Féraille A, Caron J-F. Towards Sustainable Material: Optimizing Geopolymer Mortar Formulations for 3D Printing: A Life Cycle Assessment Approach. Sustainability. 2024; 16(8):3328. https://doi.org/10.3390/su16083328
Chicago/Turabian StyleRoux, Charlotte, Julien Archez, Corentin Le Gall, Myriam Saadé, Adélaïde Féraille, and Jean-François Caron. 2024. "Towards Sustainable Material: Optimizing Geopolymer Mortar Formulations for 3D Printing: A Life Cycle Assessment Approach" Sustainability 16, no. 8: 3328. https://doi.org/10.3390/su16083328
APA StyleRoux, C., Archez, J., Le Gall, C., Saadé, M., Féraille, A., & Caron, J.-F. (2024). Towards Sustainable Material: Optimizing Geopolymer Mortar Formulations for 3D Printing: A Life Cycle Assessment Approach. Sustainability, 16(8), 3328. https://doi.org/10.3390/su16083328