Article

Study on the Railway Effect of the Coordinated Development of the Economy and Environment in the Chengdu–Chongqing Economic Circle

1
School of Economics and Management, Chongqing Jiaotong University, Chongqing 400074, China
2
School of Traffic and Transportation, Chongqing Jiaotong University, Chongqing 400074, China
*
Author to whom correspondence should be addressed.
Sustainability 2024, 16(8), 3333; https://doi.org/10.3390/su16083333
Submission received: 13 March 2024 / Revised: 12 April 2024 / Accepted: 13 April 2024 / Published: 16 April 2024
(This article belongs to the Special Issue Innovations in Economic Approaches to Sustainable Development Goals)

Abstract

:
Transportation infrastructure plays a crucial role in economic development and significantly influences climate change, providing direct and indirect benefits towards the attainment of Goals 8 and 13 of the United Nations Sustainable Development Goals (SDGs). This study investigates the impact of railway infrastructure on the level of economic and environmental coordination development in the Chengdu–Chongqing economic circle, using panel data from 16 cities spanning from 2010 to 2020. The analysis employs a coupled coordination degree model and a panel fixed effects model. The findings reveal a gradual increase in the level of economic and environmental coordination development in each city during the study period. Notably, Chongqing and Chengdu exhibit significantly higher levels compared to other cities. Railway infrastructure construction can significantly promote the coordinated development of the urban economy and environment. In areas with a high level of coordinated development of the economy and environment, the promoting effect is relatively small, while in areas with a low level of coordinated development of the economy and environment, the promoting effect is relatively large. Over the long term, railways continue to significantly promote the coordinated development of the urban economy and environment. The construction of railways can stimulate the development of the urban private economy and marketization, thereby facilitating the coordinated development of the urban economy and environment.

1. Introduction

In today’s world, marked by rapid globalization and expanding industrialization, urban agglomerations face both unprecedented challenges and opportunities. The balance between economic growth and environmental preservation has become a prominent global concern, especially in many developing areas. In the pursuit of economic growth, extensive resource extraction and energy consumption are often necessary, leading to environmental pollution, ecosystem destruction, and resource depletion [1]. The worsening of environmental pollution and resource depletion significantly impacts the sustainability of economic development, creating a detrimental cycle [2]. Consequently, a close and inseparable relationship exists between economic development and environmental protection. China’s modernization approach emphasizes creating a harmonious coexistence between humans and nature, aiming to address the historical challenge of the conflict between economic development and environmental protection [3]. This approach seeks to establish a win–win coordination between economic development and environmental protection. China prioritizes the coordinated development of the economy, society, and resource environment, promoting concepts like ‘promoting coordinated development of the economy and the environment’ and ‘protecting the environment is essentially protecting productivity’ [4]. By treating the economy and the environment as interconnected research subjects and exploring pathways for their coordinated development, we can achieve a mutually beneficial situation between economic growth and environmental protection. Only by simultaneously prioritizing environmental protection, sustainable resource utilization, and economic development can we ensure the long-term stability and prosperity of human society.
In 2015, the United Nations established the 17 Sustainable Development Goals (SDGs) in collaboration with 195 countries, marking it as the largest agreement ever reached [5]. The SDGs have garnered significant attention from scholars, with 65,433 papers indexed in the Scopus database, of which 61,016 papers (93%) are related to these goals. Among these, research on environmental science stands out prominently [6]. Addressing the challenge of climate change is a crucial aspect of environmental policy agendas, with Goal 13, ‘Climate Action’, emphasizing the need for urgent measures to combat climate change and its impacts [7]. This goal aligns directly with research on environmental science. Achieving Goal 13 necessitates increased financial resources for renewable energy technologies and the sustainable use of natural resources [8], which are intricately linked to urban economic development. Moreover, studies have shown that each of the 17 SDGs has a complementary impact on climate change [9]. Researchers have highlighted the benefits of implementing comprehensive climate policies, as socioeconomic factors play a significant role [10]. This theoretical framework supports the examination of the coordinated development of the economy and environment. Goal 8, ‘Decent Work and Economic Growth’, focuses on enhancing economic efficiency globally by creating job opportunities and fostering economic prosperity to drive social progress and environmental sustainability [11]. This goal provides an economic foundation and policy framework for the successful realization of Goal 13.
In light of the Chinese government’s enduring dedication to sustainable development as a critical national objective, the establishment and advancement of the Chengdu–Chongqing economic circle emerges as notably significant. Encompassing Chengdu and Chongqing, in addition to their neighboring areas in western China, this circular formation not only plays a pivotal role in the overall strategy for the expansive growth of Western China but also functions as an essential foundation and backing for the establishment of the Yangtze River Economic Belt. Throughout the 14th Five-Year Plan timeframe, China has prioritized the creation of an ecological civilization, setting the mitigation of carbon emissions as a central strategic focus. This era is characterized by nationwide regulations targeting pollution reduction and carbon emission mitigation coordination, along with the encouragement of a comprehensive green overhaul of economic and societal advancement with the aim of fundamentally enhancing the environmental quality and transitioning from quantity-based growth to qualitative enhancement [12]. This strategic direction not only demonstrates China’s proactive response to the global climate change challenge but also showcases this country’s strong commitment and proactive efforts towards achieving the sustainable development goals. In 2016, China’s National Development and Reform Commission and the Ministry of Housing and Urban–Rural Development jointly issued the “Development Plan for the Chengdu-Chongqing Urban Agglomeration,” specifying that “by 2020, the Chengdu-Chongqing urban agglomeration should be basically built into a national-level urban group with a vibrant economy, high quality of life, and beautiful ecological environment.” As a growth point in the western region, this economic circle not only bears the responsibility of promoting regional economic development but also faces the challenge of protecting the environment and achieving green transformation amidst rapid developments. Thus, in the process of realizing its own development, the Chengdu–Chongqing economic circle is becoming an important demonstration area for the national carbon reduction strategy and the advancement of ecological civilization construction, making it a research area that showcases the potential pathways for seeking balance and coordination between economic growth and ecological environment protection. This contribution is crucial for the sustainable development of the region and offers valuable insights for achieving Sustainable Development Goals 8 and 13.
Transportation planning plays a vital role in sustainable development [6]. It not only supports economic growth but also contributes to reducing environmental impacts. Focusing solely on the influence of transportation infrastructure on economic growth may neglect its adverse effects on the environment. Therefore, it is crucial to comprehensively assess the dual impact of transportation infrastructure on both the economy and the environment to achieve coordinated development and realize the sustainable development goals. Nevertheless, the current research in this particular area does possess some limitations. Numerous studies have primarily concentrated on the effects of railway construction on regional economic growth or its influence on environmental conservation, with little exploration into whether railway infrastructure could impact the internal harmonization of economic and environmental aspects within urban agglomerations, as well as the underlying mechanisms driving this process. As a result, this investigation presents a fresh perspective and in-depth examination to comprehend the potential impact of railway infrastructure on advancing the synchronized development of the economy and environment within urban clusters. Through this study, our objective is to enhance the theoretical framework within the realms of transportation, economy, and the environment and provide more precise and efficient policy recommendations for practical implementation.

2. Literature Review

Limited research exists on the influence of transportation infrastructure on the coordinated development of urban economies and environments. Prior studies have primarily concentrated on either analyzing the effects of transportation infrastructure on economic advancement or its impact on the ecosystem. Regarding economic advancement, certain studies have directly investigated the correlation between transportation infrastructure and regional economic growth. They posit that the construction of transportation infrastructure significantly enhances local economic development [13,14,15,16,17,18,19,20]. Other research has indirectly delved into the repercussions of transportation infrastructure on economic progression, including its role in stimulating the upgrade of industrial structures [21], promoting industrial agglomeration [22], supporting enterprise exports [23], and enhancing social welfare standards [24,25]. These investigations offer valuable empirical data and theoretical insights into the functions of transportation infrastructure in spurring economic growth across different regions. The influence of transportation infrastructure construction on the environment presents a dual perspective. On the one hand, the establishment and operation of transportation infrastructure yield detrimental consequences on the surrounding ecosystem [26]. These repercussions encompass water and soil erosion, the destruction of vegetation, and the disruption of terrains [27]. The construction of railways can also have adverse effects on vegetation, permafrost layers, and land stability [28], leading to water and soil erosion, the desertification of land, and the degradation of grasslands [29]. In contrast, the construction of transportation infrastructure can also yield favorable environmental outcomes. Investing in transportation infrastructure can enhance urban air quality [30]. Rail transit alters personal travel choices, reducing car exhaust emissions and easing traffic congestion [31]. Particularly, public transportation infrastructure, like rail transit, effectively addresses haze issues [32]. Therefore, it is crucial to consider environmental concerns when studying the impact of transportation infrastructure on economic advancement, aiming for a balance between the economy and the environment to achieve sustainable development. Railways, as a key part of a nation’s transportation infrastructure, play an essential role in promoting sustainable development [33]. Expanding rail networks improves connections within and between urban areas, fostering regional economic integration [34]. This speeds up resource and information flow, creating favorable conditions for industrial upgrades and structural adjustments within urban areas [35]. Additionally, as a form of low-carbon transportation, rail transport helps reduce carbon emissions and enhance environmental quality in urban areas [36]. When compared to road and air transportation, railways, especially electrified ones, have significantly lower carbon emissions [37]. Acting as a low-carbon transport alternative, railways have a noticeable impact on decreasing urban carbon emissions and enhancing environmental quality. Due to their efficiency, low carbon footprint, sustainability, and profound effect on urban and regional development, railway infrastructure emerges as a crucial area for research on the coordinated growth of urban economies and the environment.
In order to evaluate how the construction of railway infrastructure influences the joint economic and environmental advancement of cities, it is essential to initially assess the degree of coordination in economic and environmental aspects across cities. In the realm of integrated economic and environmental advancement, various researchers have made significant contributions. They have employed diverse methodologies, such as uncoupling [38], input–output [39], comprehensive assessments [40], and environmental Kuznets curves [41], for their empirical investigations. Expanding upon previous studies, the objective of this paper is to employ the coupling coordination degree model to quantify the level of combined economic and environmental progression in different regions, thereby exploring the influence of railway infrastructure on said coordination.
This study focuses on the Chengdu–Chongqing economic circle as the research area to investigate how railway infrastructure impacts the coordinated development of the economy and environment. This research holds significance both theoretically and practically. To begin with, the Chengdu–Chongqing economic circle stands out as a highly dynamic and promising economic region in Western China. Analyzing the influence of its railway infrastructure on the economy and environment is crucial for this region’s sustainable development, offering valuable insights for China and the world. Additionally, while existing research mainly examines the effects of railways on regional economic growth or the environment, there is a lack of literature on their coordinated development. Therefore, this study will help enhance the theoretical framework in transportation, economics, and environmental studies. Furthermore, it aims to uncover the impacts and underlying mechanisms of railway infrastructure on the coordinated development of the economy and environment, thus providing more precise and effective policy recommendations.

3. Methodology

3.1. Study Area

Following the geographical partition outlined in the ‘Development Plan for the Economic Circle of Chengdu-Chongqing’, released by the State Council of China in 2021, this study chose a total of 16 cities at or above the prefectural level as the focus area. These cities include Chongqing, Chengdu, Luzhou, Zigong, Mianyang, Deyang, Suining, Neijiang, Nanchong, Leshan, Meishan, Guang’an, Yibin, Dazhou, Ziyang, and Ya’an.

3.2. Economic and Environmental Indicator System

Drawing on the research findings uncovered by Liu et al. [42], this study selected per capita GDP, total import and export volume of foreign-invested enterprises, actual use of foreign investment, and total retail sales of consumer goods, along with two indicators of industrial rationalization and industrial upgrading, to reflect the economic structure. Based on these indicators, the per capita disposable income of urban residents was also included, making a total of seven indicators to reflect the economic development status of various regions. Referencing the work of Zhou et al. [43], this study selected the volume of wastewater discharge, sulfur dioxide emission volume, smoke (dust) emission volume, solid waste utilization rate, centralized sewage treatment rate, harmless garbage disposal rate, and green space area as indicators, along with the greening coverage rate of built-up areas on top of these, totaling eight indicators to reflect the environmental development status of various regions. The specific selection of indicators is shown in Table 1.
Economic indicators comprehensively reflect a region’s level of economic development, industrial structure, openness to the external world, consumption capacity, and residents’ living standards from various dimensions, allowing for a comprehensive and scientific assessment and comparison of economic development conditions across different regions. Environmental indicators extensively depict a region’s performance and effectiveness in environmental protection, pollution control, resource utilization, and ecological construction, enabling the effective evaluation of a region’s environmental status. The level of industrial rationalization and the index of industrial upgrading were calculated using the approach proposed by Fu Linghui [44].

3.3. Measurement

3.3.1. Dependent Variable

The dependent variable in this study is the level of coordinated development between the economy and the environment (Lcd). Initially, the entropy weight technique is utilized to allocate weights to the indicators within each system, evaluating the economic and environmental development levels of cities. This approach determines the precise weights of indicators by analyzing their information entropy, regardless of the dimensions and scales of the indicators. Applicable to various types of indicators, the entropy weight method can impartially demonstrate the importance of each indicator within the comprehensive indicator framework. Subsequently, the coupling coordination model is employed to assess the level of coordinated development between urban economy and the environment. The specific calculation procedures are as follows:
Step 1: Data preprocessing.
When Xij is a positive indicator:
Z i j = X i j min X i j max X i j min X i j , i = 1 , 2 , , n ;   j = 1 , 2 , , m
When Xij is a negative indicator:
Z i j = max X i j X i j max X i j min X i j , i = 1 , 2 , , n ;   j = 1 , 2 , , m
Step 2: Calculation of the economic and environmental development levels.
Calculation of information entropy for each indicator:
p i j = Z i j i = 1 n Z i j
e j = 1 ln n p i j ln p i j
Calculation of weights for each indicator:
W j = ( 1 e j ) j = 1 m ( 1 e j )
In Equations (1)–(5), Zij denotes the standardized value of the indicator; Xij denotes the original value of the jth indicator in the ith year in each system; ej denotes the information entropy value of the jth indicator; and Wj denotes the weight of the jth indicator.
The comprehensive scores for the economic and environmental systems (U1 and U2, respectively), were calculated using the linear weighting method with the following equation:
U = j = 1 n W j Z i j
Step 3: Measurement of the coordinated development level between the economy and environment.
Calculation of coupling degree:
C = 2 × [ U 1 × U 2 ( U 1 + U 2 ) 2 ] 1 2
Calculation of the comprehensive coordination index:
T = a U 1 + b U 2
Calculation of coupling coordination degree:
D = C × T
In Equations (7)–(9), U1 denotes the level of order in the economic system; U2 denotes the level of order in the environmental system; C denotes the coupling degree value; T denotes the comprehensive coordination index; and a and b denote the relative status and contribution of the economic and environmental systems, respectively. Considering that the contribution degrees of the two are the same, a = b = 0.5 was taken. D denotes the coupling coordination degree. According to Chen et al.’s method [45], scholars have categorized the coupling coordination degree into 10 different levels, which can be seen in Table 2.

3.3.2. Independent Variable

Railway density (Rd): Railway density refers to the ratio of railway route length to the geographical area in a specific region or country [46]. A higher railway density indicates a larger scale of the railway network and relatively dense railway routes, which can better meet the travel and transportation needs of people. Railway density is used to represent the level of development and construction of railway infrastructure [47].

3.3.3. Control Variables

Population density (Pd): Population density refers to the ratio of population quantity to the geographical area in a specific region or country. It reflects the degree of population concentration in an area, i.e., the population quantity per unit area. Population density serves as a measure of how densely populated a region is [48]. While population agglomeration can stimulate regional economic growth, it can also lead to environmental strain.
Patents granted per 10,000 people (Pg): This metric signifies the ratio of granted patents to the population within a specific region or country over a defined timeframe. It reflects the achievements and capabilities of a region or country in terms of scientific and technological innovation. Measuring technological innovation using the number of patent grants is more scientific than using R&D expenditure, as patent grants reflect the actual technological innovation capacity of regions more accurately than patent applications. The innovation capacity of a region is represented by the number of patent grants per ten thousand people [49].
Number of students enrolled in regular institutions of higher learning per 10,000 people (Ns): This indicator refers to the quantity of students enrolled in regular higher learning institutions per 10,000 inhabitants in a particular region or country. Education is a crucial factor in regional economic development, and the number of students enrolled in regular higher education institutions per ten thousand people acts as an educational benchmark for the region [50].
Rural–urban Engel coefficient ratio (Ruecr): The rural–urban Engel coefficient ratio illustrates the consumption structure disparity between rural and urban dwellers. By examining this ratio, we can better comprehend the consumption variations between rural and urban residents, aiding in policy development and fostering rural–urban growth.

3.3.4. Mechanism Variables

The level of employment in non-state-owned units (Pe) is a metric that shows the percentage of non-state-owned units, such as companies or organizations, in the total workforce of a particular region or nation. This measure offers insights into the growth of the private sector and the degree of market integration.

3.4. Examination Statistic Models

In line with the methodology of Jin et al. [51], a model with fixed effects was chosen to analyze how railway infrastructure impacts the synchronized advancement of the economy and environment. This model was structured as follows:
ln L c d k i = α 0 + α 1 ln R d k i + α 2 ln P d k i + α 3 P g k i + α 4 ln N s k i + α 5 R u e c r k i + μ k + ε k i
In Equation (10), k represents cities; i represents years; Lcd is the dependent variable; and Rd is the core explanatory variable. Pd, Pg, Ns, and Ruecr are control variables. a represents the regression coefficients of the respective variables; μk represents the fixed effects of provinces; and εki represents the random error term.
Moreover, to explore the influence of railway infrastructure on the growth and marketization of the urban private sector, thus impacting the synchronized progress of the urban economy and environment, we followed the research of Zhou and Li [52] and created the model below based on Equation (10):
ln L c d k i = β 0 + β 1 ln R d k i + β 3 x c k i + μ k + ε k i
ln L c d k i = γ 0 + γ 1 ln R d k i + γ 2 P e k i + γ 3 x c k i + μ k + ε k i
In Equations (11) and (12), Pe represents the mediating mechanism variable, which is the proportion of employment in non-state-owned units. β and γ represent the regression coefficients. Equation (10) is the baseline model; Equation (11) is the estimation model for the influence of the core explanatory variable on the mediating variable; and Equation (12) is the estimation model that simultaneously considers the core explanatory variable and the mediating variable. If a1 is significant, it suggests the presence of a mediating effect. Furthermore, if both β1 and γ2 are significant, this indicates the existence of the mechanism described in this study. To test the mediating effect, the estimated values of β1 and γ2 were subjected to a Sobel test. If the Sobel test rejects the null hypothesis, it implies the proposed mechanism in this study exists and is effective; otherwise, it is not supported.

3.5. Data Source

This study utilized data from a variety of sources, such as the “China Urban Statistical Yearbook”, the “Sichuan Statistical Yearbook”, and the “Chongqing Statistical Yearbook”, along with statistical bulletins from cities within the study area. To ensure the dataset’s completeness, missing data were filled in using the linear interpolation and nearest-neighbor imputation methods.

4. Empirical Analysis

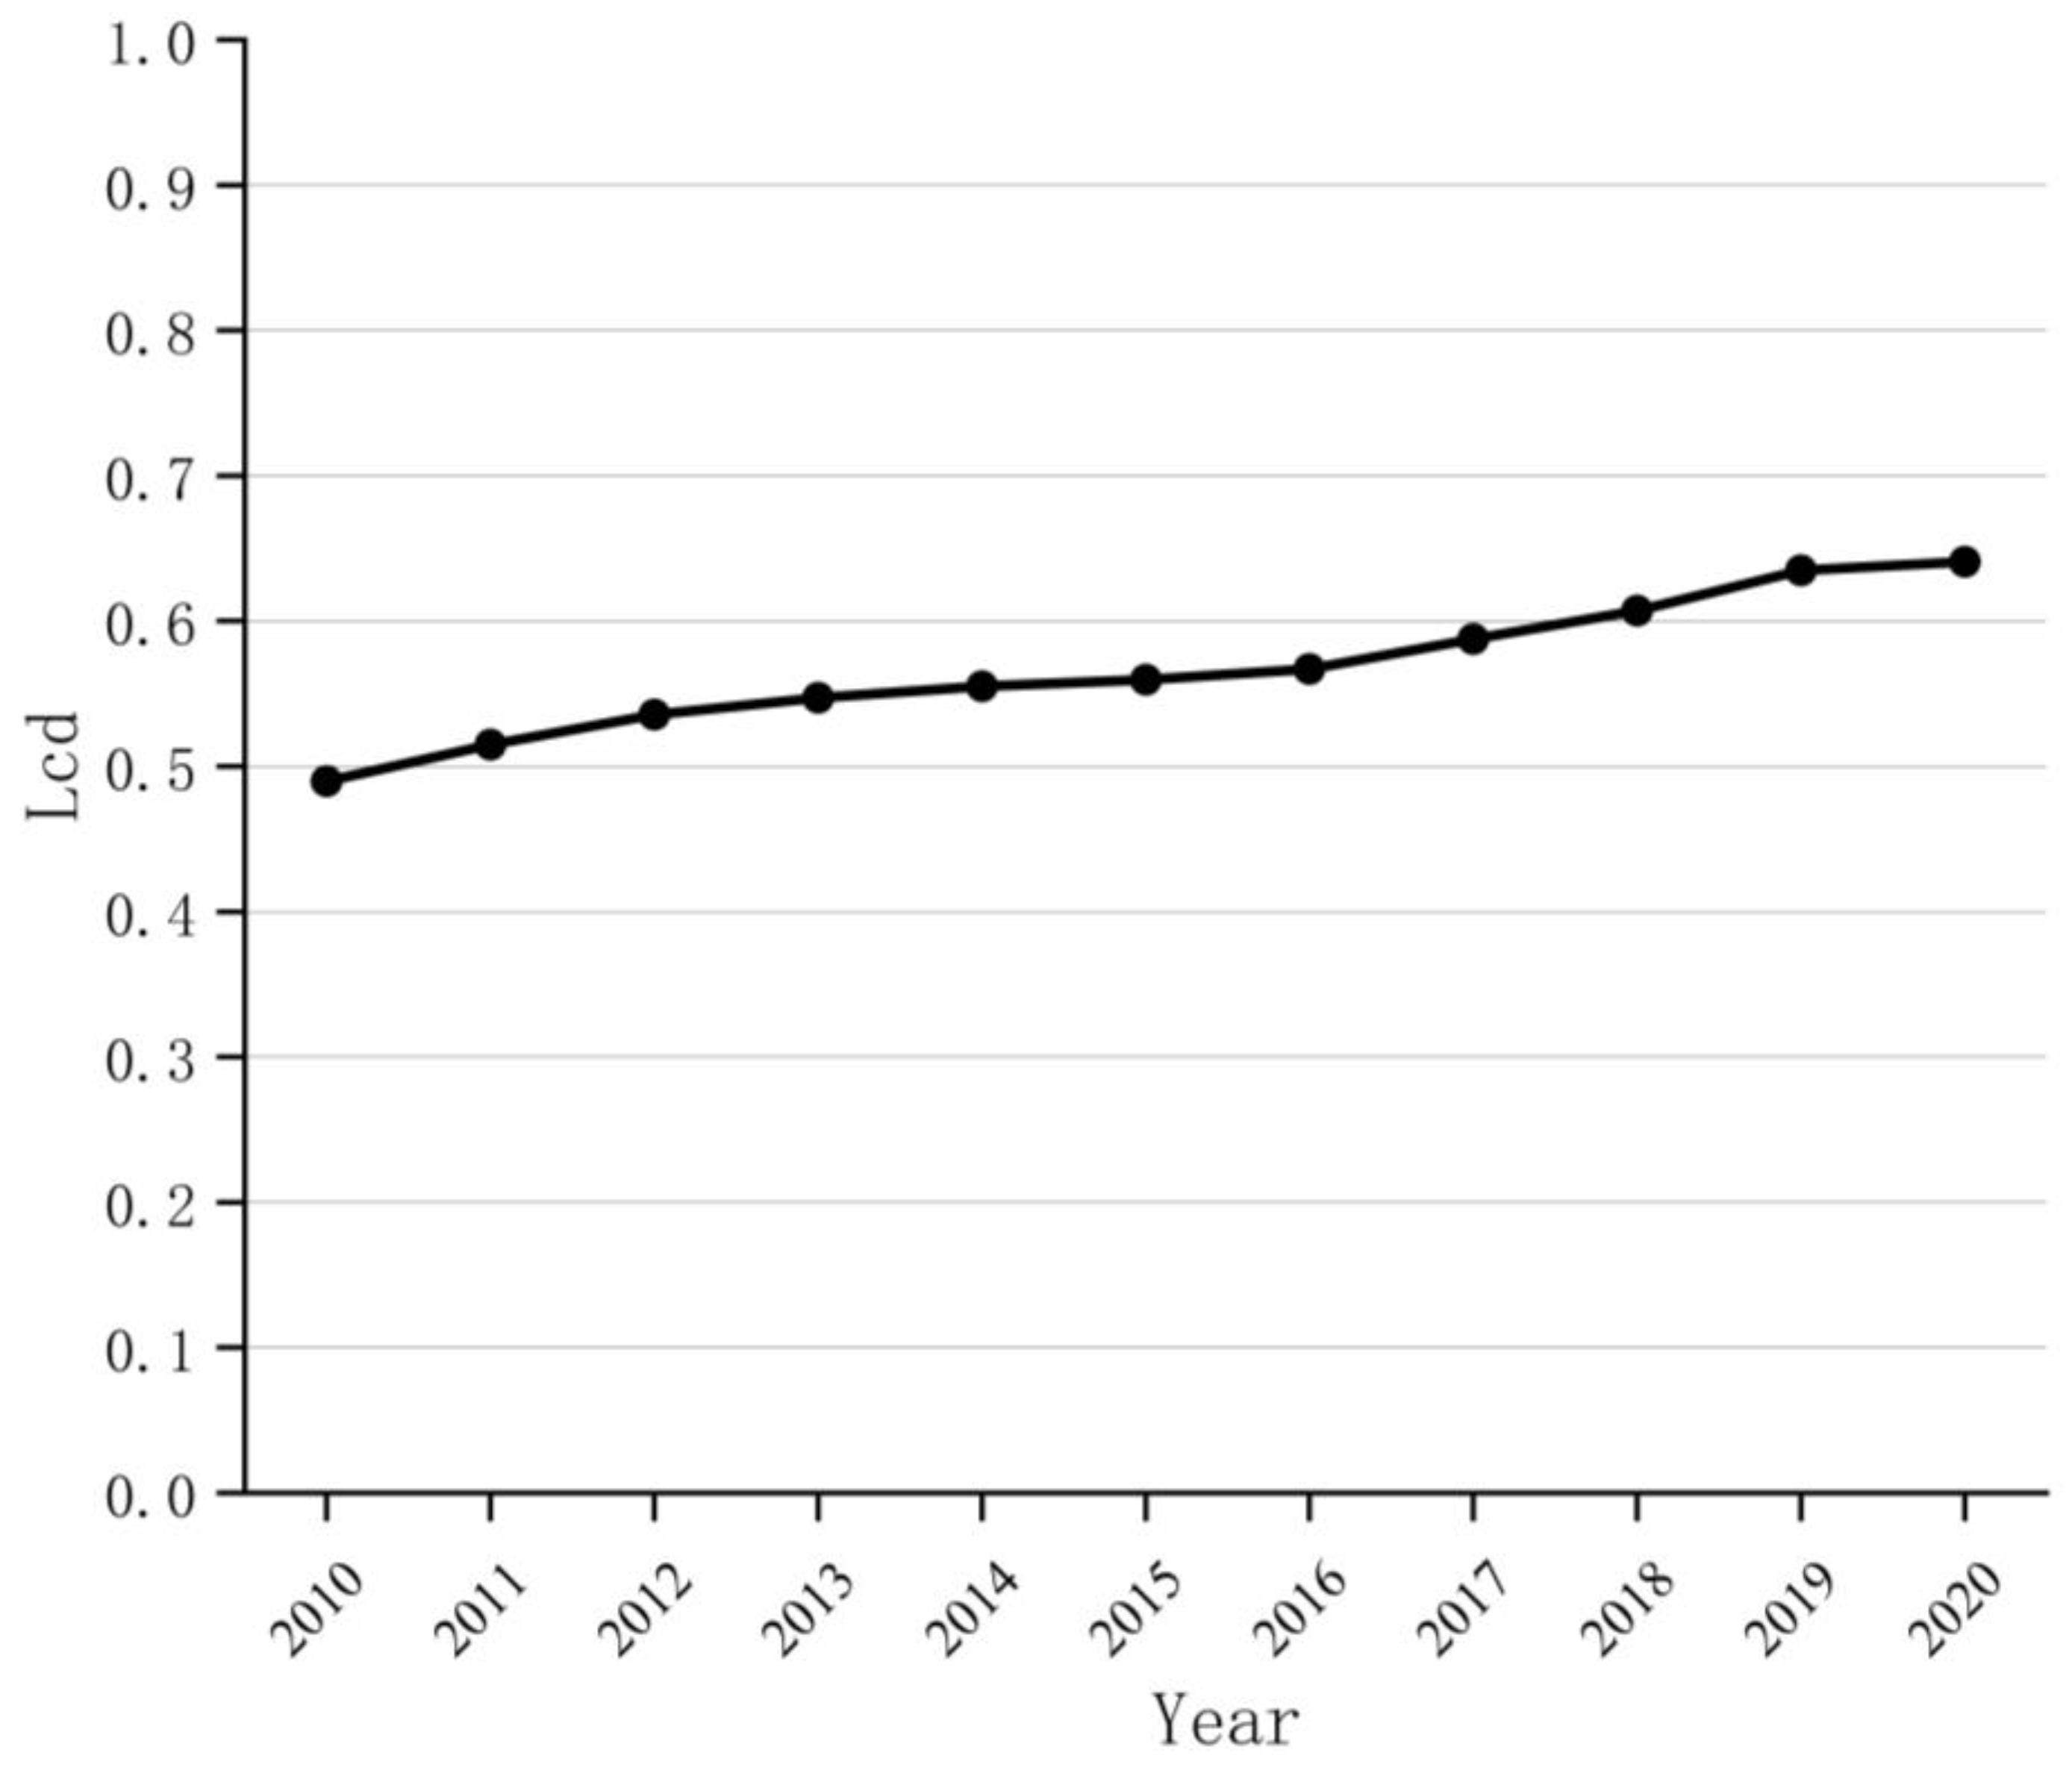
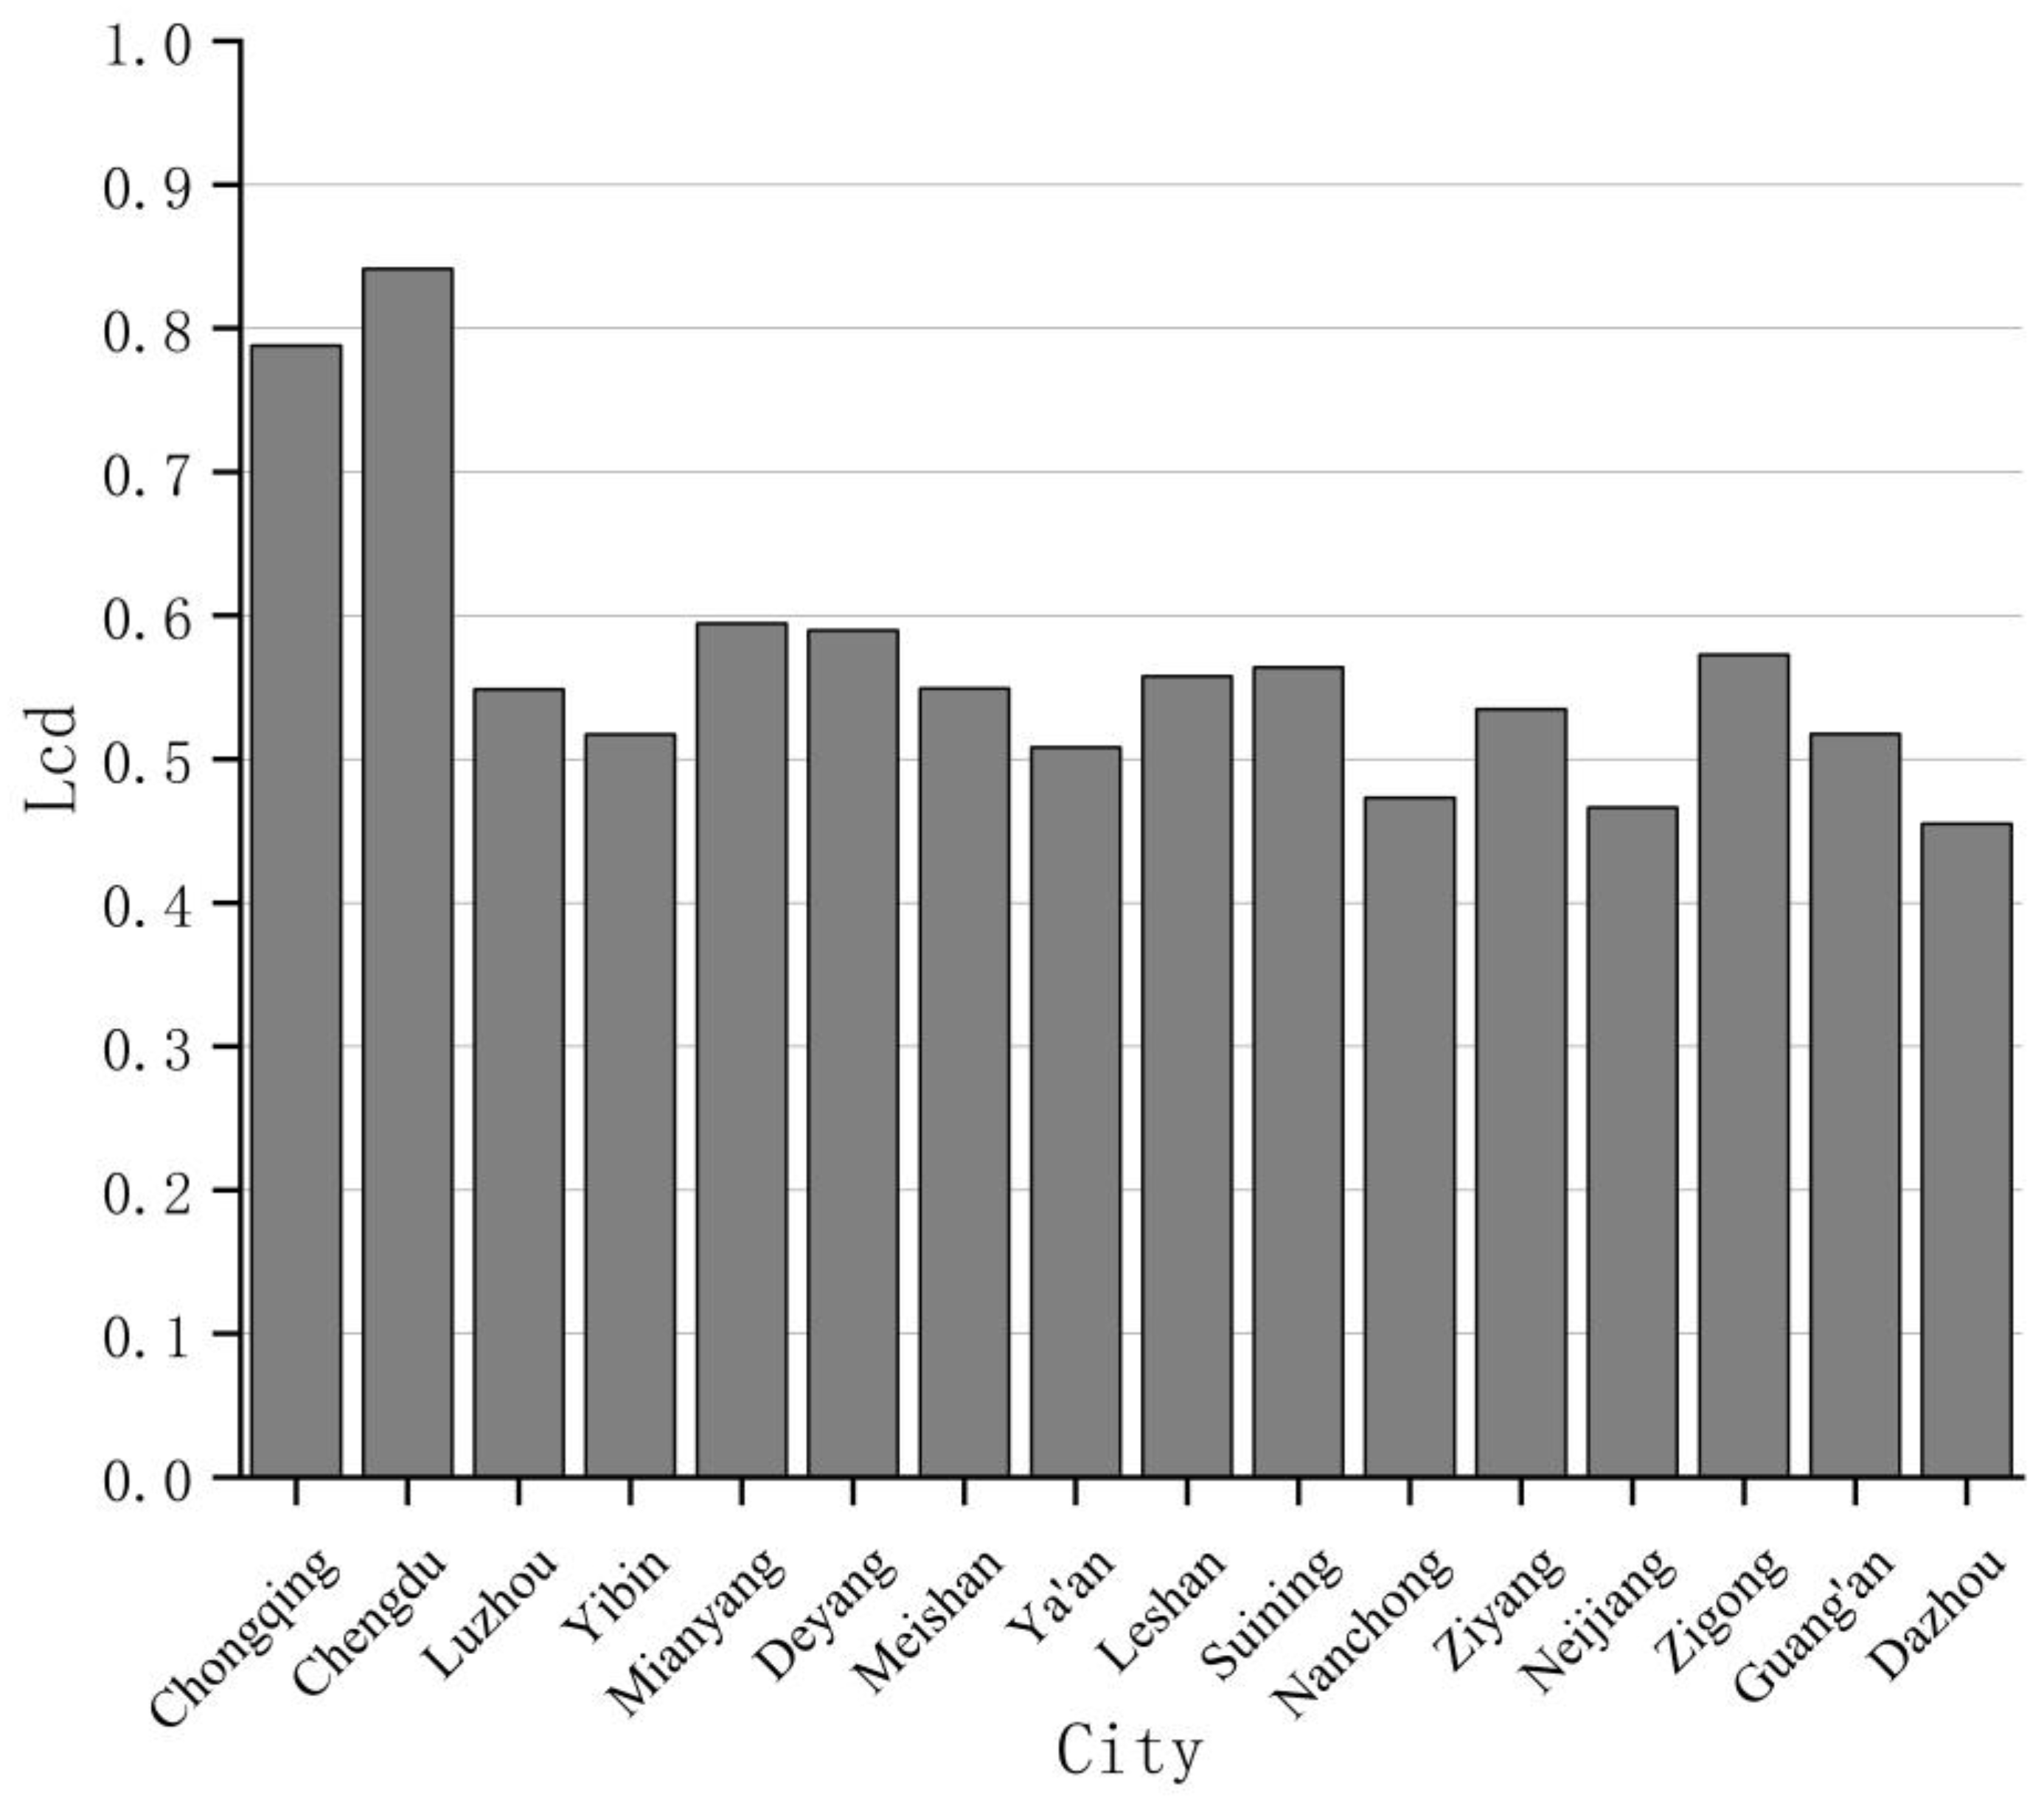
4.1. Temporal and Spatial Evolution of the Coordinated Development between the Economy and Environment

Using the evaluation indicator system outlined in Table 1, this study calculated the level of coordinated development between the economy and the environment for the 16 cities in the Chengdu–Chongqing economic circle from 2010 to 2020. The coupling coordination degree model was employed for this purpose. Additionally, time series trend charts (Figure 1 and Figure 2) were created to depict the temporal evolution trend of this level.
Based on Figure 1, the overall coordinated development level between the economy and the environment within the Chengdu–Chongqing economic circle showed a steady increase from 2010 to 2020. The level rose from 0.49 in 2011 to 0.64 in 2020, displaying an average annual growth rate of 2.73%. In 2011, all cities reached an average level of 0.5 in coordinated development between the economy and the environment, marking the beginning of marginal coordination. By 2018, the average coordinated development level increased to 0.6, transitioning into the primary coordination stage. From 2010 to 2012, there was rapid growth in the coordinated development level between the urban economy and the environment. From 2012 to 2016, the growth rate slowed down, followed by a period of relatively rapid growth from 2016 to 2019. The growth rate then slowed down, with minor increases leading up to 2020.
As shown in Figure 2, between 2010 and 2020, Chengdu and Chongqing led in their levels of coordinated economic and environmental development, with Chengdu surpassing Chongqing and both cities significantly outpacing others. Beyond Chengdu and Chongqing, the remaining cities exhibited coordination levels below 0.6, indicating a relatively lower overall level of coordinated development. This discrepancy may result from uneven resource distribution, insufficient policy support, and lagging infrastructure development in these cities, which, in turn, affects their compatibility with the industrial transfer from Chengdu and Chongqing. Moreover, these peripheral cities may also face environmental pressures and resource bottlenecks during their economic development, contributing to their lower levels of coordinated development compared to the “dual cores”.

4.2. Baseline Regression

Supported by the data and methods described in the previous sections, we established a panel fixed effects model to estimate Equation (10). Considering that the level of coordinated development between the economy and the environment ranges from zero to one, we employed the Tobit regression model for robust estimations. The results are presented in Table 3.
In Table 3, models M(1) and M(2) represent the empirical results without and with control variables, respectively. Models M(3) and M(4) correspond to the corresponding Tobit regression results. From M(1) and M(2), it can be observed that the coefficient of railway density significantly decreases when control variables are added. In M(1), the railway density coefficient is 0.232, showing significance at a 1% level in the test. Upon including control variables, the railway density coefficient changes to 0.0705, maintaining significance at a 5% level. Additionally, the Tobit model’s regression coefficients closely resemble the baseline model, indicating the robustness of the estimation results in this research. These findings suggest that boosting railway density could effectively enhance the harmonious development of the urban economy and the environment.
As for the variables under scrutiny, in the initial regression model, the coefficient associated with lnPd stands at −0.0663, demonstrating statistical significance at a 5% threshold. This signifies that a rise in population density exerts a detrimental influence on the symbiotic relationship between the urban economy and the environment. Conversely, the coefficient linked to Pg is 0.00808, passing the significance test at a 1% level, indicating that advancements in technological innovation capacity can enhance the synergy between the local economy and the environment. The coefficient tied to lnNs is 0.0694, also passing the significance test at a 1% level, elucidating that an elevation in educational attainment significantly encourages the alignment of the local economy with environmental considerations. Furthermore, the coefficient for Recr is 0.125, which passes the significance test at a 5% level. This underscores the notable impact of disparities in urban–rural consumption patterns on the coordinated development between the urban economy and the environment, revealing a positive correlation between the Engel coefficient for urban–rural areas and the harmonization of economic activities with environmental sustainability.

4.3. Robustness Test

In order to address potential issues related to endogeneity in the model, this study utilizes two-stage least squares (2SLS) with instrumental variables including lagged railway density from one period and two periods prior. The outcome of this analysis is detailed in Table 4.
Additionally, to assess the reliability of the regression findings, various methodologies are applied for robustness testing. Initially, regression analysis is carried out using lagged railway density from one period and two periods prior. Subsequently, the impact of outliers is addressed by winsorizing railway density, as well as economic and environmental coordination levels at the 1% and 99% thresholds, followed by regression analysis. Furthermore, alternative estimation approaches are employed through panel quantile regressions at the 0.1, 0.2, and 0.9 quantiles to explore the effects of railway density at varying levels of coordination development. The detailed outcomes are provided in Table 4 and Table 5.
Based on the findings in Table 4 and Table 5, it is evident that utilizing lagged one-period and lagged two-period railway density as instrumental variables resulted in coefficients of 0.0928 and 0.113, respectively. These coefficients are statistically significant at both the 1% and 5% levels. This shows that, even when addressing endogeneity concerns, railway density continues to have a significant positive impact on the advancement of economic and environmental coordination, thus underscoring the resilience of this study’s conclusions. The coefficients of lagged one-period and lagged two-period railway density gradually diminish and remain statistically significant at the 5% and 10% levels, respectively, pointing to the presence of delayed effects of railway density on economic and environmental coordination development. Following the application of winsorizing, the positive significance of the railway density coefficient persists, reinforcing the reliability of this study’s findings. Moreover, in the outcomes of panel quantile regression, where quantile points were established at 0.1 and 0.2, the coefficients of railway density were determined to be 0.0822 and 0.0830, respectively. These coefficients were statistically significant at the 5% and 10% levels. This indicates that in regions with lower levels of economic and environmental coordination development, railway density exerts a comparatively stronger influence on the enhancement of coordination. Conversely, in regions with greater coordination development, the impact of railway density on coordination progress is relatively modest.

4.4. Long-Term Effects Analysis

Railway density can have a lasting impact on the development of economic and environmental coordination. To account for the delayed impact of railway density, we included the lagged-dependent variable, Lcd. Following the approach suggested by Quinn and Toyoda [53] for testing long-term effects, we conducted our panel regression analysis using the averages of two and three years for all variables. The findings are detailed in Table 6.
Our analysis of Table 6 revealed that the utilization of the lagged-dependent variable Lcd resulted in significant coefficients for railway density in the baseline regression, two-year average, and three-year average models, with values of 0.0865, 0.0800, and 0.751, respectively, all of which were deemed statistically significant at the 5% threshold. These findings suggest that the presence of railway infrastructure plays a crucial role in fostering long-term economic and environmental coordination development.

4.5. Mechanism Test

The presence of railway infrastructure has the potential to influence the growth of the private economy and the level of marketization within urban areas, thereby impacting the overall coordination of economic and environmental dynamics. This study employed both empirical data and a constructed model to explore and validate this hypothesis (Equations (11) and (12)), as depicted in Table 7.
In Model M(3), the significance of the railway density’s coefficient is observed at the 10% level, while the coefficient of Pe is significant at the 1% level. This suggests that developing railway infrastructure can boost private sector growth and marketization in urban areas, leading to a more harmonious economic and environmental development. The Sobel test also supports the presence of a positive mediating process at the 10% significance threshold. Railways, as an efficient means of transport, can enhance logistics efficiency, lower logistics expenses for businesses, hasten goods circulation, and facilitate smooth and convenient market transactions. The construction and development of railways can enhance logistics efficiency [54], expedite the movement of goods, and facilitate frequent and convenient market transactions [55]. This, in turn, benefits private enterprises by aiding in market expansion, boosting competitiveness, and driving economic growth. Moreover, the enhancement and expansion of railway networks offer wider market access and resource channels for enterprises, fostering both competition and collaboration among them and facilitating the efficient allocation and optimization of resources [56]. The promotion of marketization also encourages the optimization and upgrading of urban economic structures [57], leading to a reduction in resource wastage and environmental pollution [58,59], ultimately achieving a balance between economic growth and environmental protection.
In conclusion, this study thoroughly investigates the impact mechanism of railway density on the coordinated development of the urban economy and the environment through benchmark regression, robustness tests, long-term effects analyses, and mechanism examinations. Railways, as an efficient mode of transportation, play a crucial role in improving urban logistics efficiency [54], reducing enterprise logistics costs [60], and accelerating the circulation of goods. This, in turn, promotes frequent and convenient market transactions [55], fostering urban economic development, enhancing industrial competitiveness and efficiency, and facilitating trade and investment activities. The improved transportation efficiency provided by railways accelerates commercial activities and production processes in cities, offering reliable support for healthy economic growth. Furthermore, the development of railway transportation helps reduce road traffic pressure and alleviate traffic congestion and emissions, thus enhancing urban environmental quality [31]. Compared to other transportation modes like cars and planes, railways have lower energy consumption and emissions levels, demonstrating better environmental performance [37]. The low-carbon characteristics of railway transportation make it a sustainable transportation mode, contributing to the reduction in environmental pollution and energy consumption [61]. By mitigating the negative impacts of transportation on the environment, railway transportation creates a cleaner and more livable urban environment, which is beneficial for residents’ health and quality of life. Additionally, the development of railway transportation promotes regional integration and enhances resource allocation efficiency between cities [34,55]. The expansion and improvement of railway networks strengthen connections and cooperation among cities, fostering industrial synergies and regional economic complementarity [62]. By enhancing communication and collaboration among cities, railway transportation supports the optimization and upgrading of urban economic structures [21,35], ultimately boosting overall economic strength and competitiveness. Therefore, railway transportation provides robust support for urban sustainable development, facilitating the benign interaction and sustainable development of the urban economy and the environment.

5. Conclusions

The research in this paper is based on panel data that were collected from 16 cities within the Chengdu–Chongqing economic circle in China during the period of 2010 to 2020. It aims to analyze the influence of railway infrastructure on the synchronized progress of both the urban economy and the environment using a panel fixed effects model. The findings of this study are significant. Initially, over the course of 2010 to 2020, the overall trend in the level of synchronized economic and environmental development in the Chengdu–Chongqing economic circle, which comprises 16 cities, showed an upward trajectory. Notably, Chongqing and Chengdu emerged as the leaders in this development, while the other cities demonstrated relatively lower levels of synchronized progress. Additionally, the expansion in railway density has played a crucial role in promoting the synchronized development of urban economies and environments, a relationship that remained robust even after conducting various tests to account for endogeneity. In regions where synchronized economic and environmental development is more advanced, the impact of railway infrastructure on this progress is modest, whereas in regions with lower levels of synchronization, the impact is more pronounced. Furthermore, the long-term analysis shows that the continuous increase in railway density significantly contributes to the synchronized development of urban economies and environments. The establishment of railway infrastructure not only supports the growth of urban private economies and marketization but also enhances the synchronization between urban economies and environments.
These findings indicate that the development and enhancement of railway infrastructure are essential in achieving a balance between economic growth and environmental conservation. By fostering inclusive and sustainable economic development, railways present viable solutions for urban economic transformation and environmental preservation. The expansion of railway networks not only boosts urban economies but also alleviates traffic congestion and emissions, leading to an enhancement in urban environmental conditions. This integrated approach to economic and environmental progress establishes a strong basis for urban sustainability and offers valuable insights for attaining Sustainable Development Goals 8 and 13.

Author Contributions

Conceptualization, X.R. and J.S.; methodology, J.S.; software, J.S.; validation, J.S. and Z.F.; formal analysis, J.S.; investigation, J.S. and Z.F.; resources, J.S. and Z.F.; data curation, J.S. and Z.F.; writing—original draft preparation, J.S.; writing—review and editing, X.R. and J.S.; visualization, J.S.; supervision, X.R. and J.S.; project administration, J.S.; funding acquisition, X.R. All authors have read and agreed to the published version of the manuscript.

Funding

General Project of the National Social Science Foundation, grant/award number: 21BJY223; General Project of the Chongqing Natural Science Foundation, grant/award number: CSTB2023NSCQ-MSX0046; and Major Project of Chongqing Social Science Planning “Construction of Western Land-Sea New Passage”, grant/award number: 2023ZDLH06.

Institutional Review Board Statement

Not applicable.

Informed Consent Statement

Not applicable.

Data Availability Statement

Data will be made available on request.

Conflicts of Interest

The authors declare that they have no known competing financial interests or personal relationships that could have appeared to influence the work reported in this paper.

References

  1. Zhao, L.; Wu, D. A Study on the Ecological Pressure of Population—Concurrent Analysis on the Regional Differences of the Relationship between Population and Environment in China. Popul. J. 2015, 37, 25–36. [Google Scholar] [CrossRef]
  2. Wei, X.; Zhang, Z. The Spillover Effect of Smart City Policy on Regional Ecological Efficiency. J. Anhui Norm. Univ. (Soc. Sci.) 2024, 52, 122–135. [Google Scholar] [CrossRef]
  3. Li, P.; Dai, X. On “Two Combinations” of Xi Jinping Thought on Ecological Civilization. J. Hainan Univ. (Humanit. Soc. Sci.) 2023, 41, 44–52. [Google Scholar] [CrossRef]
  4. Chen, S.; Tan, Z.; Han, J. Innovative expansion and practical application of sustainable development theory in the planetary boundaries framework. China Popul. Resour. Environ. 2023, 33, 32–41. [Google Scholar]
  5. Ordonez-Ponce, E. Exploring the Impact of the Sustainable Development Goals on Sustainability Trends. Sustainability 2023, 15, 16647. [Google Scholar] [CrossRef]
  6. Ali, S.M.; Appolloni, A.; Cavallaro, F.; D’Adamo, I.; Di Vaio, A.; Ferella, F.; Gastaldi, M.; Ikram, M.; Kumar, N.M.; Martin, M.A.; et al. Development Goals towards Sustainability. Sustainability 2023, 15, 9443. [Google Scholar] [CrossRef]
  7. Filho, W.L.; Wall, T.; Salvia, A.L.; Dinis, M.A.P.; Mifsud, M. The central role of climate action in achieving the United Nations’ Sustainable Development Goals. Sci. Rep. 2023, 13, 20582. [Google Scholar] [CrossRef] [PubMed]
  8. He, X.; Khan, S.; Ozturk, I.; Murshed, M. The role of renewable energy investment in tackling climate change concerns: Environmental policies for achieving SDG-13. Sustain. Dev. 2023, 31, 1888–1901. [Google Scholar] [CrossRef]
  9. Fuso Nerini, F.; Sovacool, B.; Hughes, N.; Cozzi, L.; Cosgrave, E.; Howells, M.; Tavoni, M.; Tomei, J.; Zerriffi, H.; Milligan, B. Connecting climate action with other Sustainable Development Goals. Nat. Sustain. 2019, 2, 674–680. [Google Scholar] [CrossRef]
  10. Liu, J.-Y.; Fujimori, S.; Takahashi, K.; Hasegawa, T.; Wu, W.; Geng, Y.; Takakura, J.; Masui, T. The importance of socioeconomic conditions in mitigating climate change impacts and achieving Sustainable Development Goals. Environ. Res. Lett. 2021, 16, 014010. [Google Scholar] [CrossRef]
  11. Skvarciany, V.; Astike, K. Decent work and economic growth: Case of EU. In Proceedings of the 12th International Scientific Conference “Business and Management 2022”, Vilnius, Lithuania, 12–13 May 2022. [Google Scholar]
  12. Liu, Z.Y.; Wang, D.D.; Wang, Y.W. Environmental governance effect of the government budget: From the perspective of budget deviation. China Popul. Resour. Environ. 2023, 33, 103–116. [Google Scholar]
  13. Aschauer, D.A. Is public expenditure productive? J. Monet. Econ. 1989, 23, 177–200. [Google Scholar] [CrossRef]
  14. Berechman, J.; Ozmen, D.; Ozbay, K. Empirical analysis of transportation investment and economic development at state, county and municipality levels. Transportation 2006, 33, 537–551. [Google Scholar] [CrossRef]
  15. Atack, J.; Bateman, F.; Haines, M.; Margo, R. Did Railroads Induce or Follow Economic Growth? Urbanization and Population Growth in the American Midwest, 1850–1860. Soc. Sci. Hist. 2010, 34, 171–197. [Google Scholar] [CrossRef]
  16. Achour, H.; Belloumi, M. Investigating the causal relationship between transport infrastructure, transport energy consumption and economic growth in Tunisia. Renew. Sustain. Energy Rev. 2016, 56, 988–998. [Google Scholar] [CrossRef]
  17. Arbués, P.; Baños, J.F.; Mayor, M. The spatial productivity of transportation infrastructure. Transp. Res. Part A Policy Pract. 2015, 75, 166–177. [Google Scholar] [CrossRef]
  18. Donaldson, D. Railroads of the Raj: Estimating the Impact of Transportation Infrastructure. Am. Econ. Rev. 2018, 108, 899–934. [Google Scholar] [CrossRef]
  19. Saidi, S.; Shahbaz, M.; Akhtar, P. The long-run relationships between transport energy consumption, transport infrastructure, and economic growth in MENA countries. Transp. Res. Part A Policy Pract. 2018, 111, 78–95. [Google Scholar] [CrossRef]
  20. Yu, N.; De Jong, M.; Storm, S.; Mi, J. Spatial spillover effects of transport infrastructure: Evidence from Chinese regions. J. Transp. Geogr. 2013, 28, 56–66. [Google Scholar] [CrossRef]
  21. Sun, W.; Niu, D.; Wan, G. Transportation Infrastructure and Industrial Structure Upgrading: Evidence from China’s High-speed Railway. Manag. World 2022, 38, 19–41. [Google Scholar] [CrossRef]
  22. Ma, H.; Hao, M. Theoretical mechanism and empirical evidence of China’s high-speed railway construction and the agglomeration of productive service industry. Ind. Econ. Res. 2020, 1, 99–113. [Google Scholar] [CrossRef]
  23. Li, C.; Li, H.; Tang, L. High-speed railway, transportation efficiency and vertical specialization. Q. J. Econ. 2019, 21, 51–70. [Google Scholar] [CrossRef]
  24. Allen, T.; Arkolakis, C. Trade and the Topography of the Spatial Economy. Q. J. Econ. 2014, 129, 1085–1140. [Google Scholar] [CrossRef]
  25. Donaldson, D.; Hornbeck, R. Railroads and American Economic Growth: A “Market Access” Approach. Q. J. Econ. 2016, 131, 799–858. [Google Scholar] [CrossRef]
  26. Swanson, F.J.; Dyrness, C.T. Impact of clear-cutting and road construction on soil erosion by landslides in the western Cascade Range, Oregon. Geology 1975, 3, 393–396. [Google Scholar] [CrossRef]
  27. Li, J.; Zhang, X.; Wu, X.; Quan, Z.; Fan, J. Ecological Impacts from Road Traffic: A Review. J. Ecol. Environ. 2009, 18, 1169–1175. [Google Scholar] [CrossRef]
  28. Li, D.; Li, Y.; Bu, Q.; He, C. Research on post-evaluation of soil and water conservation on Qinghai-Tibet Railway. Railw. Constr. 2014, 3, 85–87. [Google Scholar] [CrossRef]
  29. Shang, T.; Hu, X.; Ye, K.; Tam, V.W.Y. Will contractors pursue unsustainable practices following environmental recovery? A highway case in China. Eng. Constr. Archit. Manag. 2023, 30, 1165–1182. [Google Scholar] [CrossRef]
  30. Luo, Z.; Wan, G.; Wang, C.; Zhang, X. Urban pollution and road infrastructure: A case study of China. China Econ. Rev. 2018, 49, 171–183. [Google Scholar] [CrossRef]
  31. Anderson, M.L. Subways, Strikes, and Slowdowns: The Impacts of Public Transit on Traffic Congestion. Am. Econ. Rev. 2014, 104, 2763–2796. [Google Scholar] [CrossRef]
  32. Shi, Z. The Effects of Traffic Infrastructure on Haze Pollution—A Test Based on BMA Method. Forum Sci. Technol. China 2018, 1, 143–149. [Google Scholar] [CrossRef]
  33. Lv, W.; Li, X. An Empirical Assessment of the Human Well-Being Effects of “the Belt and Road” Countries. Quant. Tech. Econ. Res. 2021, 38, 83–102. [Google Scholar]
  34. Shi, M.J.; Zhang, X. Urban Heterogeneity and Effects of High-Speed Railway on Urban Innovation: Based on Data from 264 Chinese Cities. Econ. Rev. J. 2020, 2, 15–22. [Google Scholar] [CrossRef]
  35. Li, Q.; Wang, Y.C. Research on the Impact of High-Speed Rail Network on the Industrial Upgrading of the Yangtze River Economic Belt. Soft Sci. 2022, 36, 78–85. [Google Scholar] [CrossRef]
  36. Zhang, X.Y.; Li, R.; Qin, Y.T.; Zuo, Q.; Zheng, P.F. The effect of high-speed railway construction on urban carbon emission intensity and mechanism under the perspective of multidimensional heterogeneity: A quasi natural experiment based on 281 cities at prefecture level and above in China. Resour. Sci. 2023, 45, 1310–1323. [Google Scholar] [CrossRef]
  37. Huang, J.S.; Mao, B.h.; Wu, X.Y. Research on Carbon Emission Reduction Strategy of China’s Transportation Industry under Carbon Neutrality Strategy. J. Beijing Jiaotong Univ. (Soc. Sci. Ed.) 2023, 22, 107–116. [Google Scholar] [CrossRef]
  38. Peng, X.; Cheng, J.; Fang, C. Coordinated Development of Economy, Resources and Environment in the Yangtze River Economic Belt based on “Three Lines and One Order”. China Popul. Resour. Environ. 2021, 31, 163–173. [Google Scholar]
  39. Zhang, H.L.; Shen, L.; Li, Y.M. Carbon Dioxide Emission Transfers Embodied in Interregional Economic Activities in Beijing-Tianjin-Hebei According to Multiregional Input-Output Model. Resour. Sci. 2017, 39, 2287–2298. [Google Scholar] [CrossRef]
  40. Chen, H.; Bao, H. Economic Growth, Ecological Footprint and Capability of Sustainable Development: An Empirical Research on Zhejiang Province. China Ind. Econ. 2008, 8, 5–14. [Google Scholar] [CrossRef]
  41. Cui, X.; Han, M.; Fang, Z. Inverted ‘U’-shape of EKC with dynamic evolution trend. China Popul. Resour. Environ. 2019, 9, 74–82. [Google Scholar]
  42. Liu, T.; Xu, Z.; Zhang, K. The Impact of Digital Finance on the Synergy of Economic Development and Ecological Environment. Mod. Financ. Econ. (J. Tianjin Univ. Financ. Econ.) 2022, 42, 21–36. [Google Scholar] [CrossRef]
  43. Zhou, J.; Wang, W.; Zhang, Y. The Spatial-temporal Evolution of Coordinated Development of Industry Transportation-Environment: A Case Study of the Beijing-Tianjin-Hebei Urban Agglomeration. J. East China Norm. Univ. Humanit. Soc. Sci. 2019, 51, 118–134+240. [Google Scholar] [CrossRef]
  44. Fu, L. An Empirical Research on Industry Structure and Economic Growth. Stat. Res. 2010, 27, 79–81. [Google Scholar] [CrossRef]
  45. Chen, G.; Liu, X.; Jiang, S.; Ding, C.; Guo, Q.; Yang, L. Measurement and Path Selection of Coupling and Coordinated Development of Rural Revitalization in Hunan Province. Econ. Geogr. 2019, 39, 191–197+206. [Google Scholar] [CrossRef]
  46. Liu, X.B.; Liu, Y.F. Fiscal Sustainability Information Disclosure and Fiscal Sustainability. Fisc. Sci. 2022, 11, 87–103. [Google Scholar] [CrossRef]
  47. Zhang, X.J.; Li, Y.S.; Zhao, X.L. Research on the Effect of CR-express on Trade Growth in Inland Regions. J. Financ. Econ. 2019, 45, 97–111. [Google Scholar] [CrossRef]
  48. Zhao, C.X.; Zhou, B.; Guan, Z.T. Fiscal Transparency, Expenditure Progress, and Budget Execution Tightening. J. Beijing Univ. Technol. (Soc. Sci. Ed.) 2024, 24, 72–87. [Google Scholar] [CrossRef]
  49. Zeng, Z.; Yang, H.; Mi, F. Financial investment in science and technology, science and technology innovation and ecological efficiency. Stat. Decis. 2023, 39, 154–158. [Google Scholar] [CrossRef]
  50. Lu, X.L. The evolution track and influence effect of regional economic development imbalance. Stat. Decis. 2023, 39, 105–110. [Google Scholar] [CrossRef]
  51. Jin, X.; Wu, W.; Shao, J. Digital transformation, intellectual capital and technological innovation in manufacturing. Stat. Decis. 2023, 39, 41–49. [Google Scholar] [CrossRef]
  52. Zhou, Q.; Li, Q. The effect and mechanism of economic agglomeration on green development efficiency. Stat. Decis. 2023, 39, 138–142. [Google Scholar] [CrossRef]
  53. Quinn, D.P.; Toyoda, A.M. Does Capital Account Liberalization Lead to Growth? Rev. Financ. Stud. 2008, 21, 1403–1449. [Google Scholar] [CrossRef]
  54. Zhang, Z.; Hu, Z. The geographical process of international corridor construction: The assemblage perspective of New China-Myanmar Indian Ocean Corridor. Acta Geogr. Sin. 2024, 1–17. Available online: https://link.cnki.net/urlid/11.1856.P.20240307.2335.002 (accessed on 12 March 2024).
  55. Wang, Y. Will Digital Technology Bring about a “Technological Singularity”? Rev. Ind. Econ. 2024, 1–13. [Google Scholar] [CrossRef]
  56. Liu, M.Y.; Tong, W.T. Study on the heterogeneous impact of high-speed rail opening on urban industrial structure upgrading—Based on a sample of 337 cities nationwide. Shanghai Financ. J. 2023, 3, 17–28. [Google Scholar] [CrossRef]
  57. Yuan, X.; Tang, C. Labor Cost, Transaction Cost, and Industrial Structure Upgrading. J. Zhejiang Univ. (Humanit. Soc. Sci.) 2015, 45, 133–143. [Google Scholar] [CrossRef]
  58. Zhang, B.; Tian, X.; Zhu, J. Environmental Pollution Control, Marketization and Energy Efficiency: A Theoretical and Empirical Analysis. Nanjing Soc. Sci. 2017, 39–46. [Google Scholar] [CrossRef]
  59. Li, X. An Empirical Analysis Based on Marketization, Industrial Agglomeration and Environmental Pollution. Stat. Res. 2014, 31, 39–45. [Google Scholar] [CrossRef]
  60. Zhang, C.; Chen, D.; Jin, Y.; Yang, G.; Zhang, H. Identification of Driving Forces of Land Use Change Based on Transition of Economic-Social Development Stage: Evidence from Middle Reaches of Yangtze River. Resour. Environ. Yangtze Basin. 2023, 32, 2528–2541. [Google Scholar]
  61. Liu, Y.; Wu, M.; Mu, R. Carbon Emission Measurement, Factor Decomposition and Low Carbonization Strategies of Transportation Industry in Tibet. J. Tibet Univ. (Soc. Sci.) 2021, 36, 126–133. [Google Scholar] [CrossRef]
  62. Li, B.; Liu, G. Does Industrial Collaborative Agglomeration Promote the Increase of Urban Entrepreneurial Activity? J. Yunnan Univ. Financ. Econ. 2024, 40, 84–98. [Google Scholar] [CrossRef]
Figure 1. Average level of coordinated economic and environmental development in each year.
Sustainability 16 03333 g001
Figure 2. Average level of coordinated economic and environmental development of each city.
Sustainability 16 03333 g002
Table 1. The construction of the economic and environmental index system.
SystemIndicatorUnitIndicator Type
EconomyPer Capita GDPYuan+
Level of Industrial Rationalization +
Index of Industrial Upgrading +
Ratio of Foreign Direct Investment (FDI) Enterprises’ Import and Export Value to GDP%+
Ratio of Actual Utilized Foreign Investment to GDP%+
Ratio of Total Retail Sales of Consumer Goods to GDP%+
Per Capita Disposable Income of Urban ResidentsYuan+
EnvironmentPer Capita Wastewater DischargeTon
SO2 Emission per 10,000 PeopleTon
Particulate Matter (PM) Emission per 10,000 PeopleTon
Solid Waste Utilization Rate%+
Sewage Centralized Treatment Rate%+
Harmless Treatment Rate of Garbage%+
Per 10,000 People Green Space AreaHectare+
Green Coverage Rate of Built-up Areas%+
Table 2. Classification of coupling coordination degree.
Coupling DegreeCoupling Degree LevelCoupling DegreeCoupling Degree Level
[0, 0.1)Extreme Imbalance[0.5, 0.6)Barely Coordinated
[0.1, 0.2)Severe Imbalance[0.6, 0.7)Primary Coordination
[0.2, 0.3)Moderate Imbalance[0.7, 0.8)Intermediate Coordination
[0.3, 0.4)Mild Imbalance[0.8, 0.9)Good Coordination
[0.4, 0.5)Approaching Imbalance[0.9, 1]High-quality Coordination
Table 3. Baseline regression results.
VariableBaseline RegressionTobit
M(1)M(2)M(3)M(4)
lnRd0.232 ***0.0705 **0.232 ***0.0705 **
(0.0308)(0.0303)(0.0293)(0.0284)
lnPd −0.0663 ** −0.0663 **
(0.0329) (0.0309)
Pg 0.00808 *** 0.00808 ***
(0.00131) (0.00123)
lnNs 0.0694 *** 0.0694 ***
(0.0181) (0.0170)
Ruecr 0.125 ** 0.125 **
(0.0522) (0.0490)
Intercept0.512 ***0.436 ***0.703 ***0.602 ***
(0.00806)(0.102)(0.0169)(0.108)
City effectYesYesYesYes
Observations176176176176
R20.2630.541
Note: Standard errors in parentheses, where *** p < 0.01 and ** p < 0.05.
Table 4. Lag test and endogeneity test.
Lag 1 Period as the Explanatory VariableLag 2 Period as the Explanatory VariableLag 1 Period as the Instrumental VariableLag 2 Period as the Instrumental Variable
lnRd0.0928 ***0.113 **0.0740 **0.0641 *
(0.0293)(0.0495)(0.0314)(0.0355)
Intercept 0.464 ***0.509 ***
(0.106)(0.113)
ControlYesYesYesYes
City effectYesYesYesYes
Observations160144160144
R20.4840.4470.4900.459
Note: Standard errors in parentheses, where *** p < 0.01, ** p < 0.05, and * p < 0.1.
Table 5. Truncated processing and quantile regression.
Truncation Handlingτ = 0.1τ = 0.2τ = 0.9
lnRd0.0727 **0.0822 **0.0830 **0.0442 *
(0.0303)(0.0318)(0.0336)(0.0260)
Intercept0.606 ***0.526 ***0.533 ***0.550 ***
(0.115)(0.121)(0.127)(0.0986)
ControlYesYesYesYes
City effectYesYesYesYes
Observations176176176176
R20.909
Note: Standard errors in parentheses, where *** p < 0.01, ** p < 0.05, and * p < 0.1.
Table 6. The results of mean reversion.
Lagged Cross-Dimensional Data (Lcd)
Baseline RegressionTwo-Year MeanThree-Year Mean
lnRd0.0865 **0.0800 **0.0751 *
(0.0342)(0.0361)(0.0386)
Intercept0.420 ***0.449 ***0.475 ***
(0.109)(0.117)(0.128)
ControlYesYesYes
City effectYesYesYes
Observations160144128
R20.4200.4220.433
Note: Standard errors in parentheses, where *** p < 0.01, ** p < 0.05, and * p < 0.1.
Table 7. The results of the mechanism test.
M(1)M(2)M(3)
LcdPeLcd
lnRd0.0705 **14.17 **0.0501 *
(0.0303)(6.590)(0.0293)
Pe 0.0014 ***
(0.0004)
Sobel test0.020 *
Mechanism validity–positive transmission
Ind_eff test0.0204 *
Indirect effect established
ControlYesYesYes
City effectYesYesYes
Observations176176176
R20.9090.6670.918
Note: Standard errors in parentheses, where *** p < 0.01, ** p < 0.05, and * p < 0.1.
Disclaimer/Publisher’s Note: The statements, opinions and data contained in all publications are solely those of the individual author(s) and contributor(s) and not of MDPI and/or the editor(s). MDPI and/or the editor(s) disclaim responsibility for any injury to people or property resulting from any ideas, methods, instructions or products referred to in the content.

