1. Introduction
Benzene, toluene, ethylbenzene, p-xylene, m-xylene, and o-xylene (BTEX) are a group of alkyls, which are toxic aromatic VOCs associated with adverse health outcomes, even at low concentrations [
1]. Exposure to BTEX at low levels is associated with human health risks such as sperm abnormalities, cardiovascular disease, respiratory dysfunction, and asthma, as well as reproductive and development-related health outcomes [
2]. The City of Johannesburg, within the Fordsburg area, has a myriad of food traders who use charcoal as the primary method of food preparation and grilling. Despite the high prevalence of charcoal burning, the levels of BTEX emissions remain unknown, and this contributes significantly to a lack of sustainability and a cleaner environment within major cities, like Johannesburg.
There is an increase in urbanization and industrialization in metropolitan cities such as Johannesburg as people seek better livelihoods [
3]. Many of these people conduct businesses that are not regulated which result in environmental health challenges such as air pollution. One such business is informal food trading, which is conducted on pavements, open veld, sidewalks, unauthorized spaces, and taxi ranks.
Food is usually prepared using the cheapest and easiest methods such as broiling and braaiing using charcoal as a source of energy. When braaiing and broiling take place, three combustion phases are involved, namely, igniting, flaming, and coking. During these combustion phases, smoke is released into the atmosphere resulting in the potential inhalation of different volatile organic compounds such as BTEX, and these are harmful to the environment, people, and sustainability. Nitrogen oxides (NO
x) and toxic organic compounds such as benzene and PAHs (polycyclic aromatic hydrocarbons) are formed through complex chemical reactions during combustion processes and smoke emissions [
4]. Nitrogen oxides, primarily nitric oxide (NO) and nitrogen dioxide (NO
2), occur when nitrogen in the air reacts with oxygen at high temperatures in combustion processes [
5]. Volatile organic compounds such as benzene are emitted during the incomplete combustion of organic materials, such as fossil fuels or biomass [
6]. This occurs when insufficient oxygen is present to completely oxidize the fuel molecules into carbon dioxide [
6]. Polycyclic aromatic hydrocarbons are formed during the incomplete combustion of all carbon-based fuels and organic materials, including coal [
7,
8]. At a typical ambient temperature, lower-molecular-weight PAHs (with 2–4 aromatic rings) are present predominantly in the gas phase while higher-molecular-weight PAHs are present predominantly in the particle phase [
8].
Research suggests that the emission of smoke resulting from charcoal burning comprises pollutants such as particulate matter, carbon monoxide, nitrogen dioxide, and toxic organic compounds such as benzene, 1, 3 butadiene, and many other PAH [
9]. Furthermore, overheating oils also increases the fuel of burning smoke; however, it is still dependent on the type of cooking method, the food being cooked, and the cooking equipment [
10]. Much as the literature suggests that BTEX can be traced from charcoal burning, scholars argued that the same (BTEX) can be found in the ambient air dispersed from various point or non-point sources [
9,
11,
12]. This observation negates the conclusiveness of charcoal burning as an irrefutable source of BTEX. Assessment of BETX in the current study area may bring some conclusiveness to the discourse about the association between charcoal burning and BTEX exposure.
The emission of air pollutants is influenced by several factors such as the exposure time, the activity conducted, the concentration of the pollutant, and wind speed or direction conditions [
13]. There is a need to identify sources and levels of exposure to BTEX within the informal food trading sector, to understand where interventions for a cleaner environment and sustainability can be implemented, particularly in the three combustion phases involved in food preparation to reduce the emission of BTEX.
Studies have been carried out across the world to assess exposure to BTEX and have highlighted the health effects; however, in South Africa, very few studies have been conducted to quantify indoor and environmental exposure to BTEX, particularly from domestic activities where coal burning has had been linked to severe health effects [
13].
We need to identify the possible sources and levels of exposure to BTEX in informal food traders in the flea market at Fordsburg, Johannesburg, to understand where interventions can be implemented. This study aimed to assess the cleaner environment and sustainability, primarily by measuring emission levels of BTEX among informal food traders using charcoal as the primary source of energy at a flea market. Sources of BTEX are associated with the type of energy used for food preparation such as charcoal and wood, the type of equipment used to prepare the food, and the preparation time. The type of products that are used on site such as oil can influence the release and emission of BTEX levels.
2. Materials and Methods
2.1. Description of the Study Area
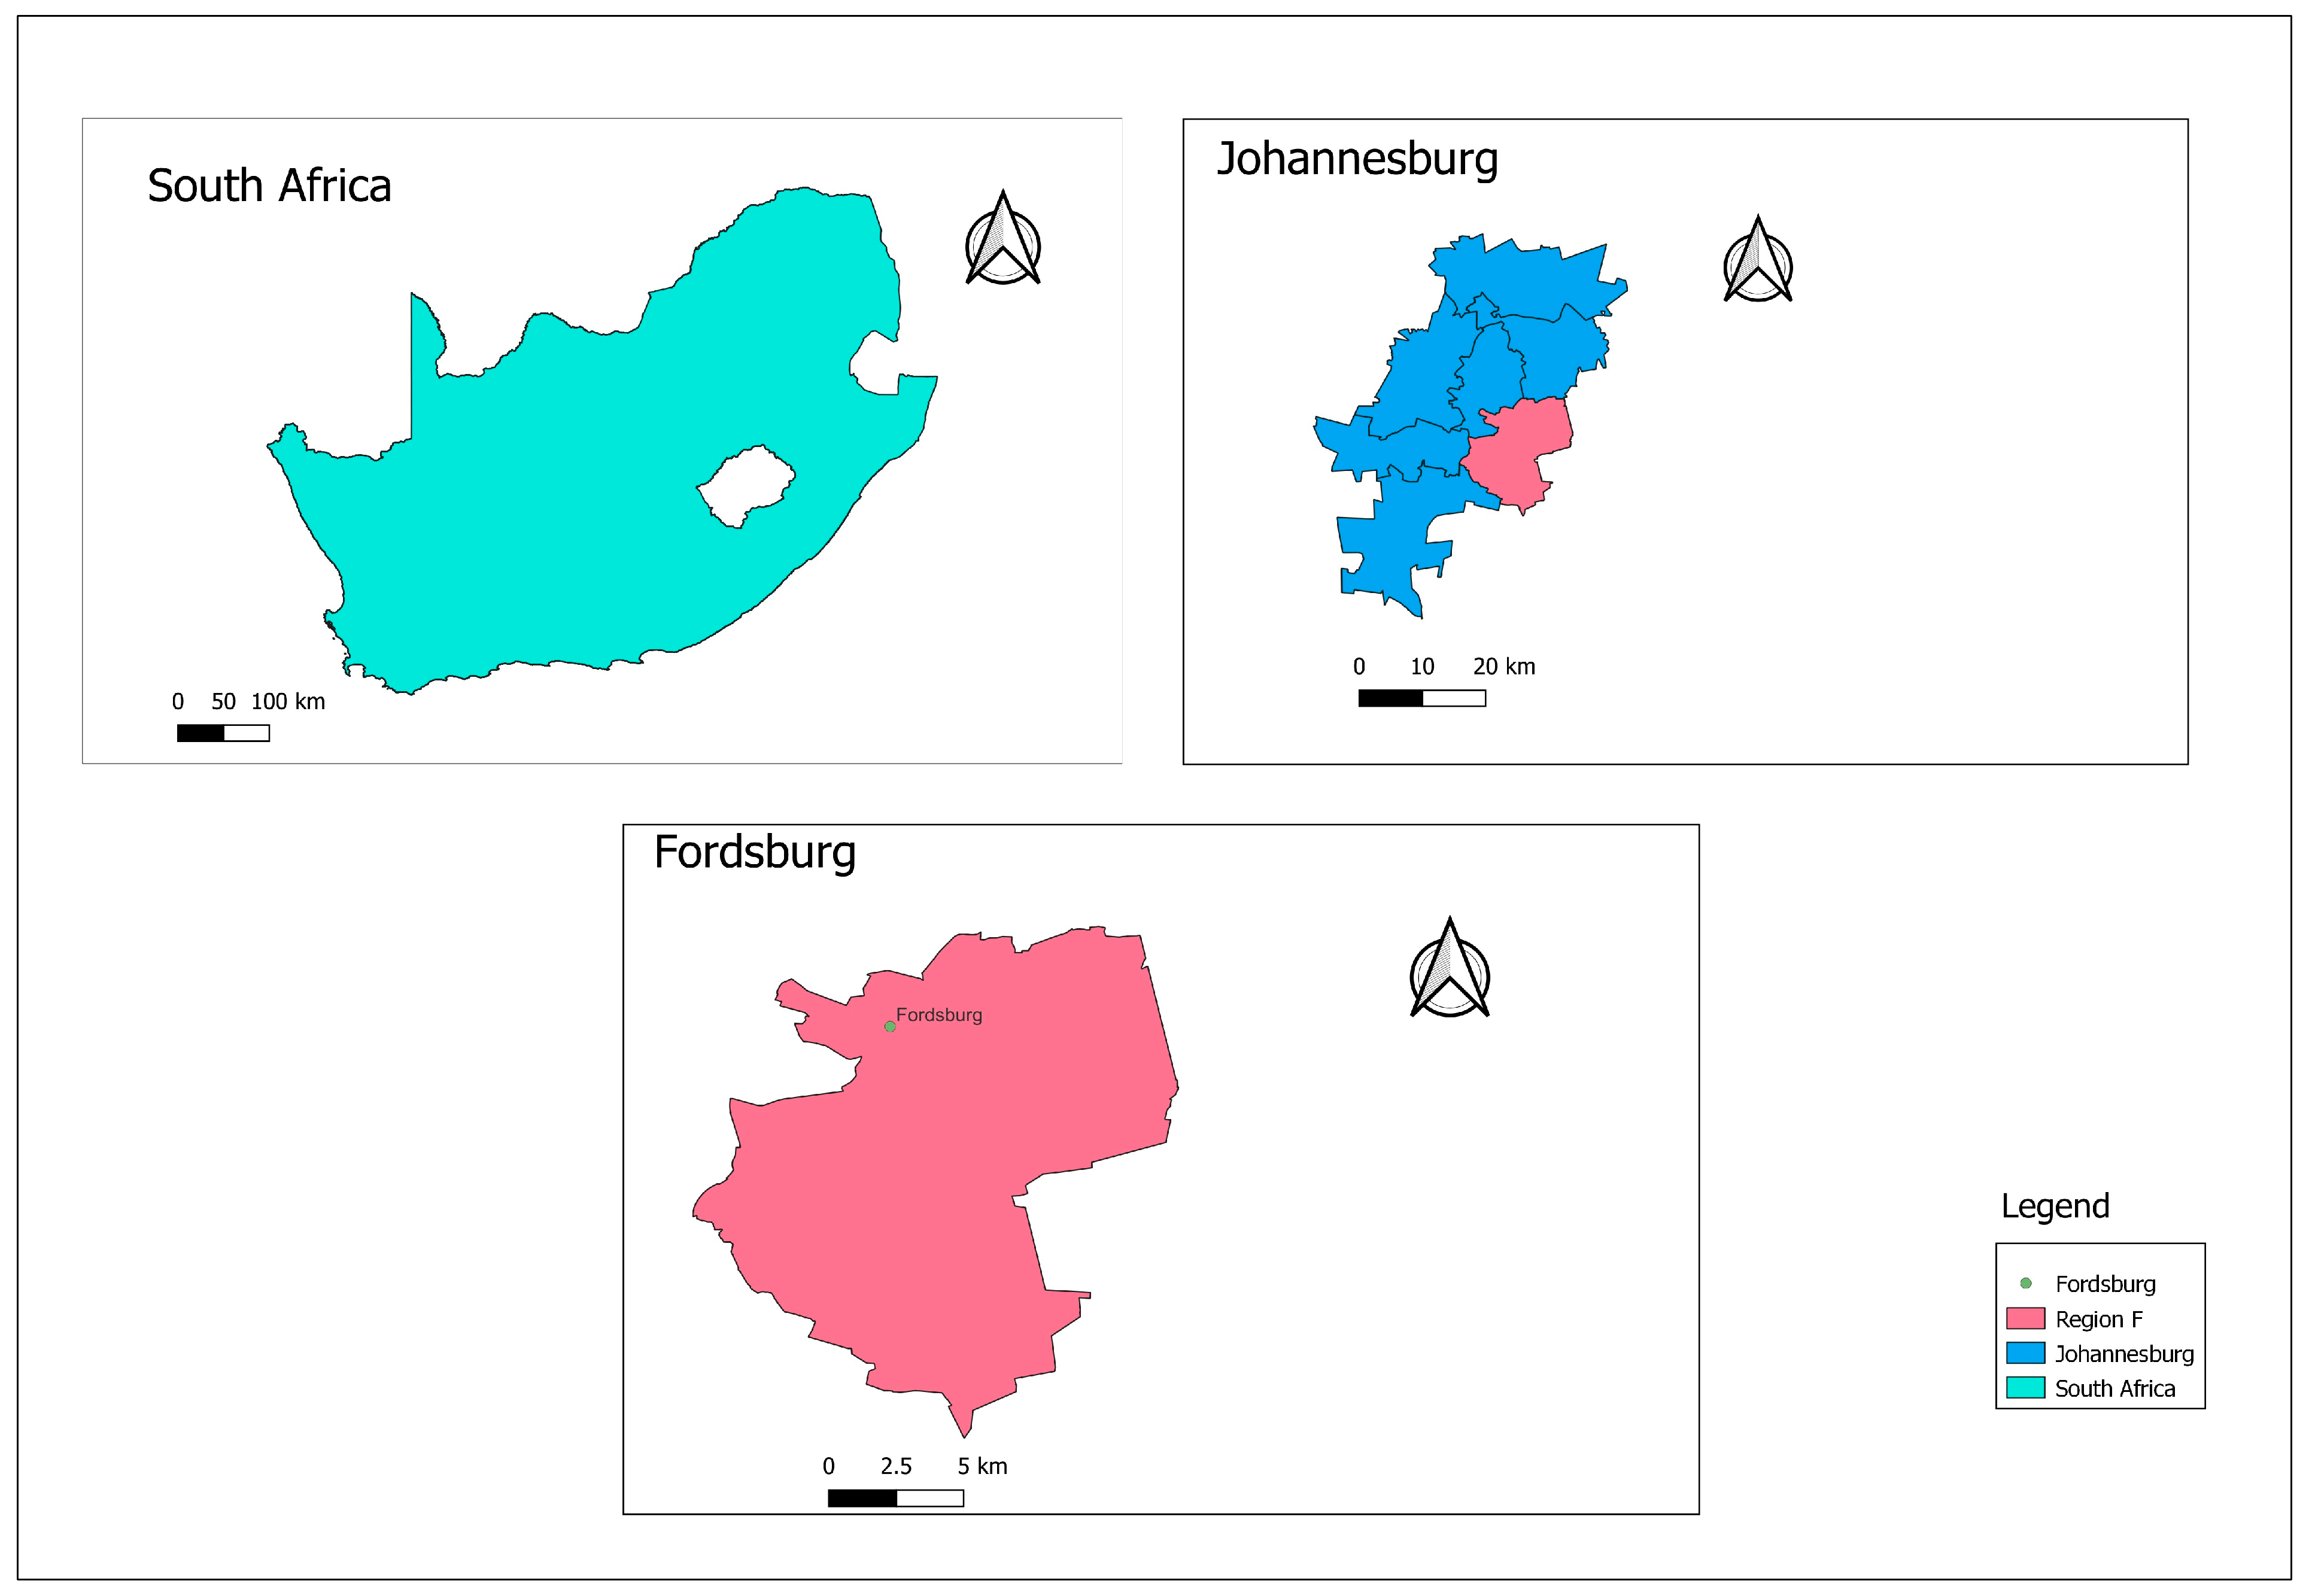
The study was conducted in the Fordsburg flea market in Johannesburg, South Africa. Fordsburg is in Region F of the City of Johannesburg Metropolitan Municipality administration within Gauteng province. A map and the geographic location of Fordsburg within the City of Johannesburg Municipality region are shown in
Figure 1.
Fordsburg is a multi-ethnic suburb that was built on the outskirts of Johannesburg to house miners from nearby mines like Crown mines and Deep City in the early 1888s. Fordsburg has a multi-racial community ranging from Asians, Indians, Ethiopians, Somalians, and other African nationals. This area is populated with high-rise buildings used for business and residential purposes.
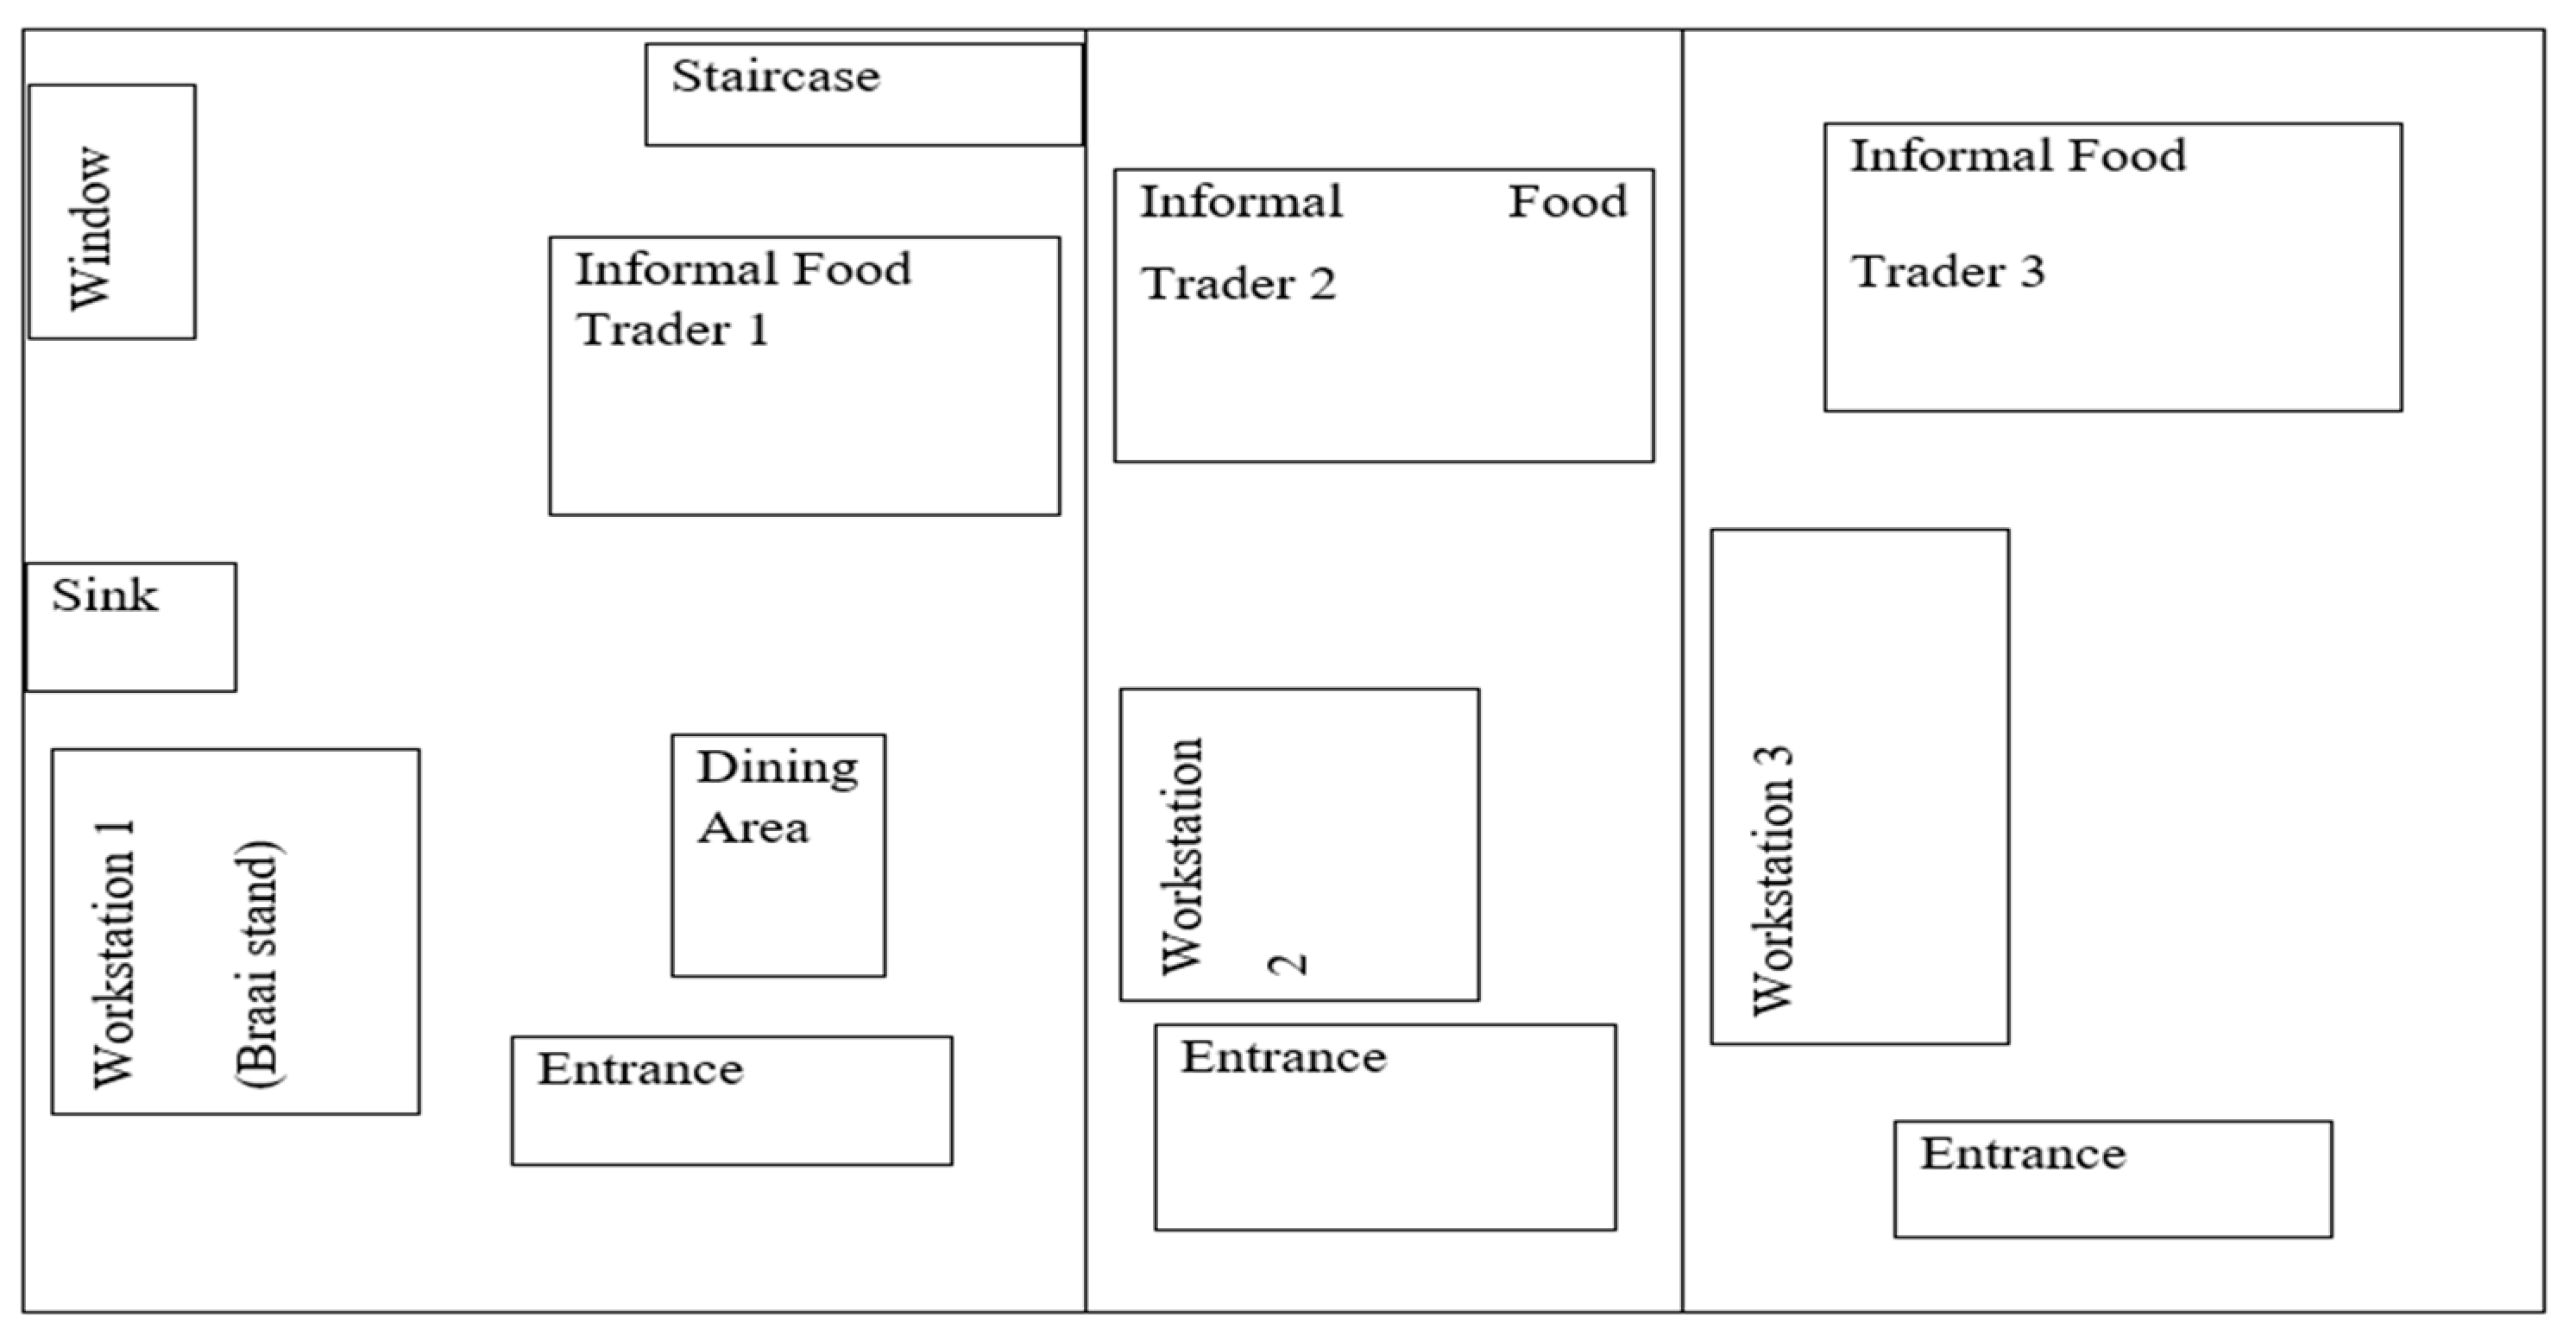
Fordsburg is known for housing the famous Fordsburg flea market. The flea market is situated in the central business district on the main route where there is huge traffic movement of motor vehicles. The flea market operates from Monday to Sunday, from 08:00 a.m. to 17:30, except on Indian religious holidays such as I’dul Fiter, during which the market does not operate. There are about 30 informal traders at the flea market involved in selling food, jewelry, toys, clothes, cosmetics, electronics, etc. Three of these traders are involved in food trading and they make use of charcoal as a source of energy for food preparation. Common foods that are prepared daily include chicken, chicken tikka, kebabs, rotis, Indian beef curry, samosas, etc. A schematic diagram, as shown in
Figure 2, illustrates the layout of the flea market. The layout depicts a partially enclosed structure, with an opening facing the west side of the area on which there is high traffic movement of vehicles. Workstation 1, at which braaiing takes place, is only within a 1 m radius of the same place as the dining area at which customers sit whilst waiting for their food.
2.2. Data Collection
Data were collected in triplicates using various instruments according to the study’s objectives. A combination of field-based observations and exposure measurements in the form of real-time monitoring and passive sampling were used during the data collection process. The principal investigator observed various working practices such as preparation of the fire, meat braaiing activities, and time spent in the activity area corresponding to the entire meat preparation cycle. Data were collected over three days and in triplicates per day. The collection of data started at 08:00 a.m. and ended at 12:45 p.m. Measurements were conducted on one informal food trader’s workstation (workstation 1). The three combustion phases of ignition, flaming, and coking were monitored consecutively over three days at the same workstation.
2.3. Measuring of VOCs and BTEX Emissions
At 08:00 a.m., the workstation 1 shop opens; the braai stand gets cleaned with water and soap. The floor surface was cleaned and tables and chairs for dining were cleaned as well to prepare for the food service of the day. To start the measurement activity, the Radiellos were removed from the plastic covers and placed inside the chemisorbed container, a sticker with a unique number was placed onto the Radiello pocket surface, and, thereafter, the time and date were written on the sticker to ensure the correct recording of day and time for the passive sampling. The braai stand (dimensions = 0.7 m breath × 1.4 m) was positioned at 0.96 m from the ground. The Radiello sampler was placed 0.8 m above the braai stand and secured with masking tape onto the corrugated iron surface used to partition the informal food stalls. The PID was placed on a tripod 1.5 m in height, the length of which was equivalent to the breathing zone of the food handler. The indoor air quality monitor (IAQ) was placed closer to the PID and held up straight for recording of the meteorological factors for five minutes.
Three 5 kg bags of charcoal were placed inside the braai stand and a firelighter and matchstick were used to start the fire and the braaiing cycle started. The meat was brought from upstairs on a stainless-steel rod, already spiced, and marinated and was then placed on the braai stand for braaiing. As the braaiing took place, the food handler used more marinate and oil as basting to give the meat flavor; however, as the marinate was added to the meat using a food brush, smoke was observed as it was emitted from the meat product. After the first complete braaiing cycle, the meat was removed from the braai stand and a new bag of 5 kg charcoal was added to the coked charcoal and a steel rod was used to mix the new charcoal with the already coked charcoal. This episode was the refueling stage that was conducted after a complete braaiing cycle, and it continued for the rest of the working shift. At this stage, no flaming phase was observed because the temperature was already high, so the coal bed was using the existing temperature from the coking phase. Therefore, the refueling episode only had an ignition and coking phase.
2.4. Description of the Data Collection Tools
Data were collected according to the research objectives set above and the relevant scientific tools for each objective were used.
2.4.1. Field Observation to Describe the Three Main Combustion Phases (Ignition, Flaming, and Coking)
The principal investigator visited the flea market to observe the activities that were undertaken in the preparation of food using charcoal as a source of energy. Informed consent forms were given to informal food handlers to sign and consent for pictures to be taken. Different combustion phases were noted, and the time of each phase was also noted. The time it took to ignite the fire, to start the flaming process, and the coking period were noted from start to finish. In addition, the refueling phase for ignition and coking was also noted.
The food outlets open at 08:00 a.m. every morning, Monday to Sunday. Six people worked in each informal food outlet within the flea market. Cleaning was conducted in preparation for braaiing activities. The combustion phase starts with the ignition phase, and once the ignition phase is completed, the flaming phase starts, then the charcoal gets evenly distributed in the braai stand using a stainless-steel rod. The fan was used for an average of 8 min at the beginning of the combustion process to supply additional primary air. The flaming phase continued to release blazes and flames leading to the creation of a hot zone on top of the fuel grate. Once flaming is complete, the coking phase starts and immediately the meat is placed on the braai stand to get braaied.
During the process of braaiing meat, there was visible smoke that can be seen at this stage; however, the smoke was not as intense as the smoke observed in the ignition phase and flaming phase. As the meat was placed on the braai stand, it still got marinated using oil and spices from the container, and as this happened, more smoke was observed coming from the coked charcoal and the assumption was that oil also contributed to the generation of smoke.
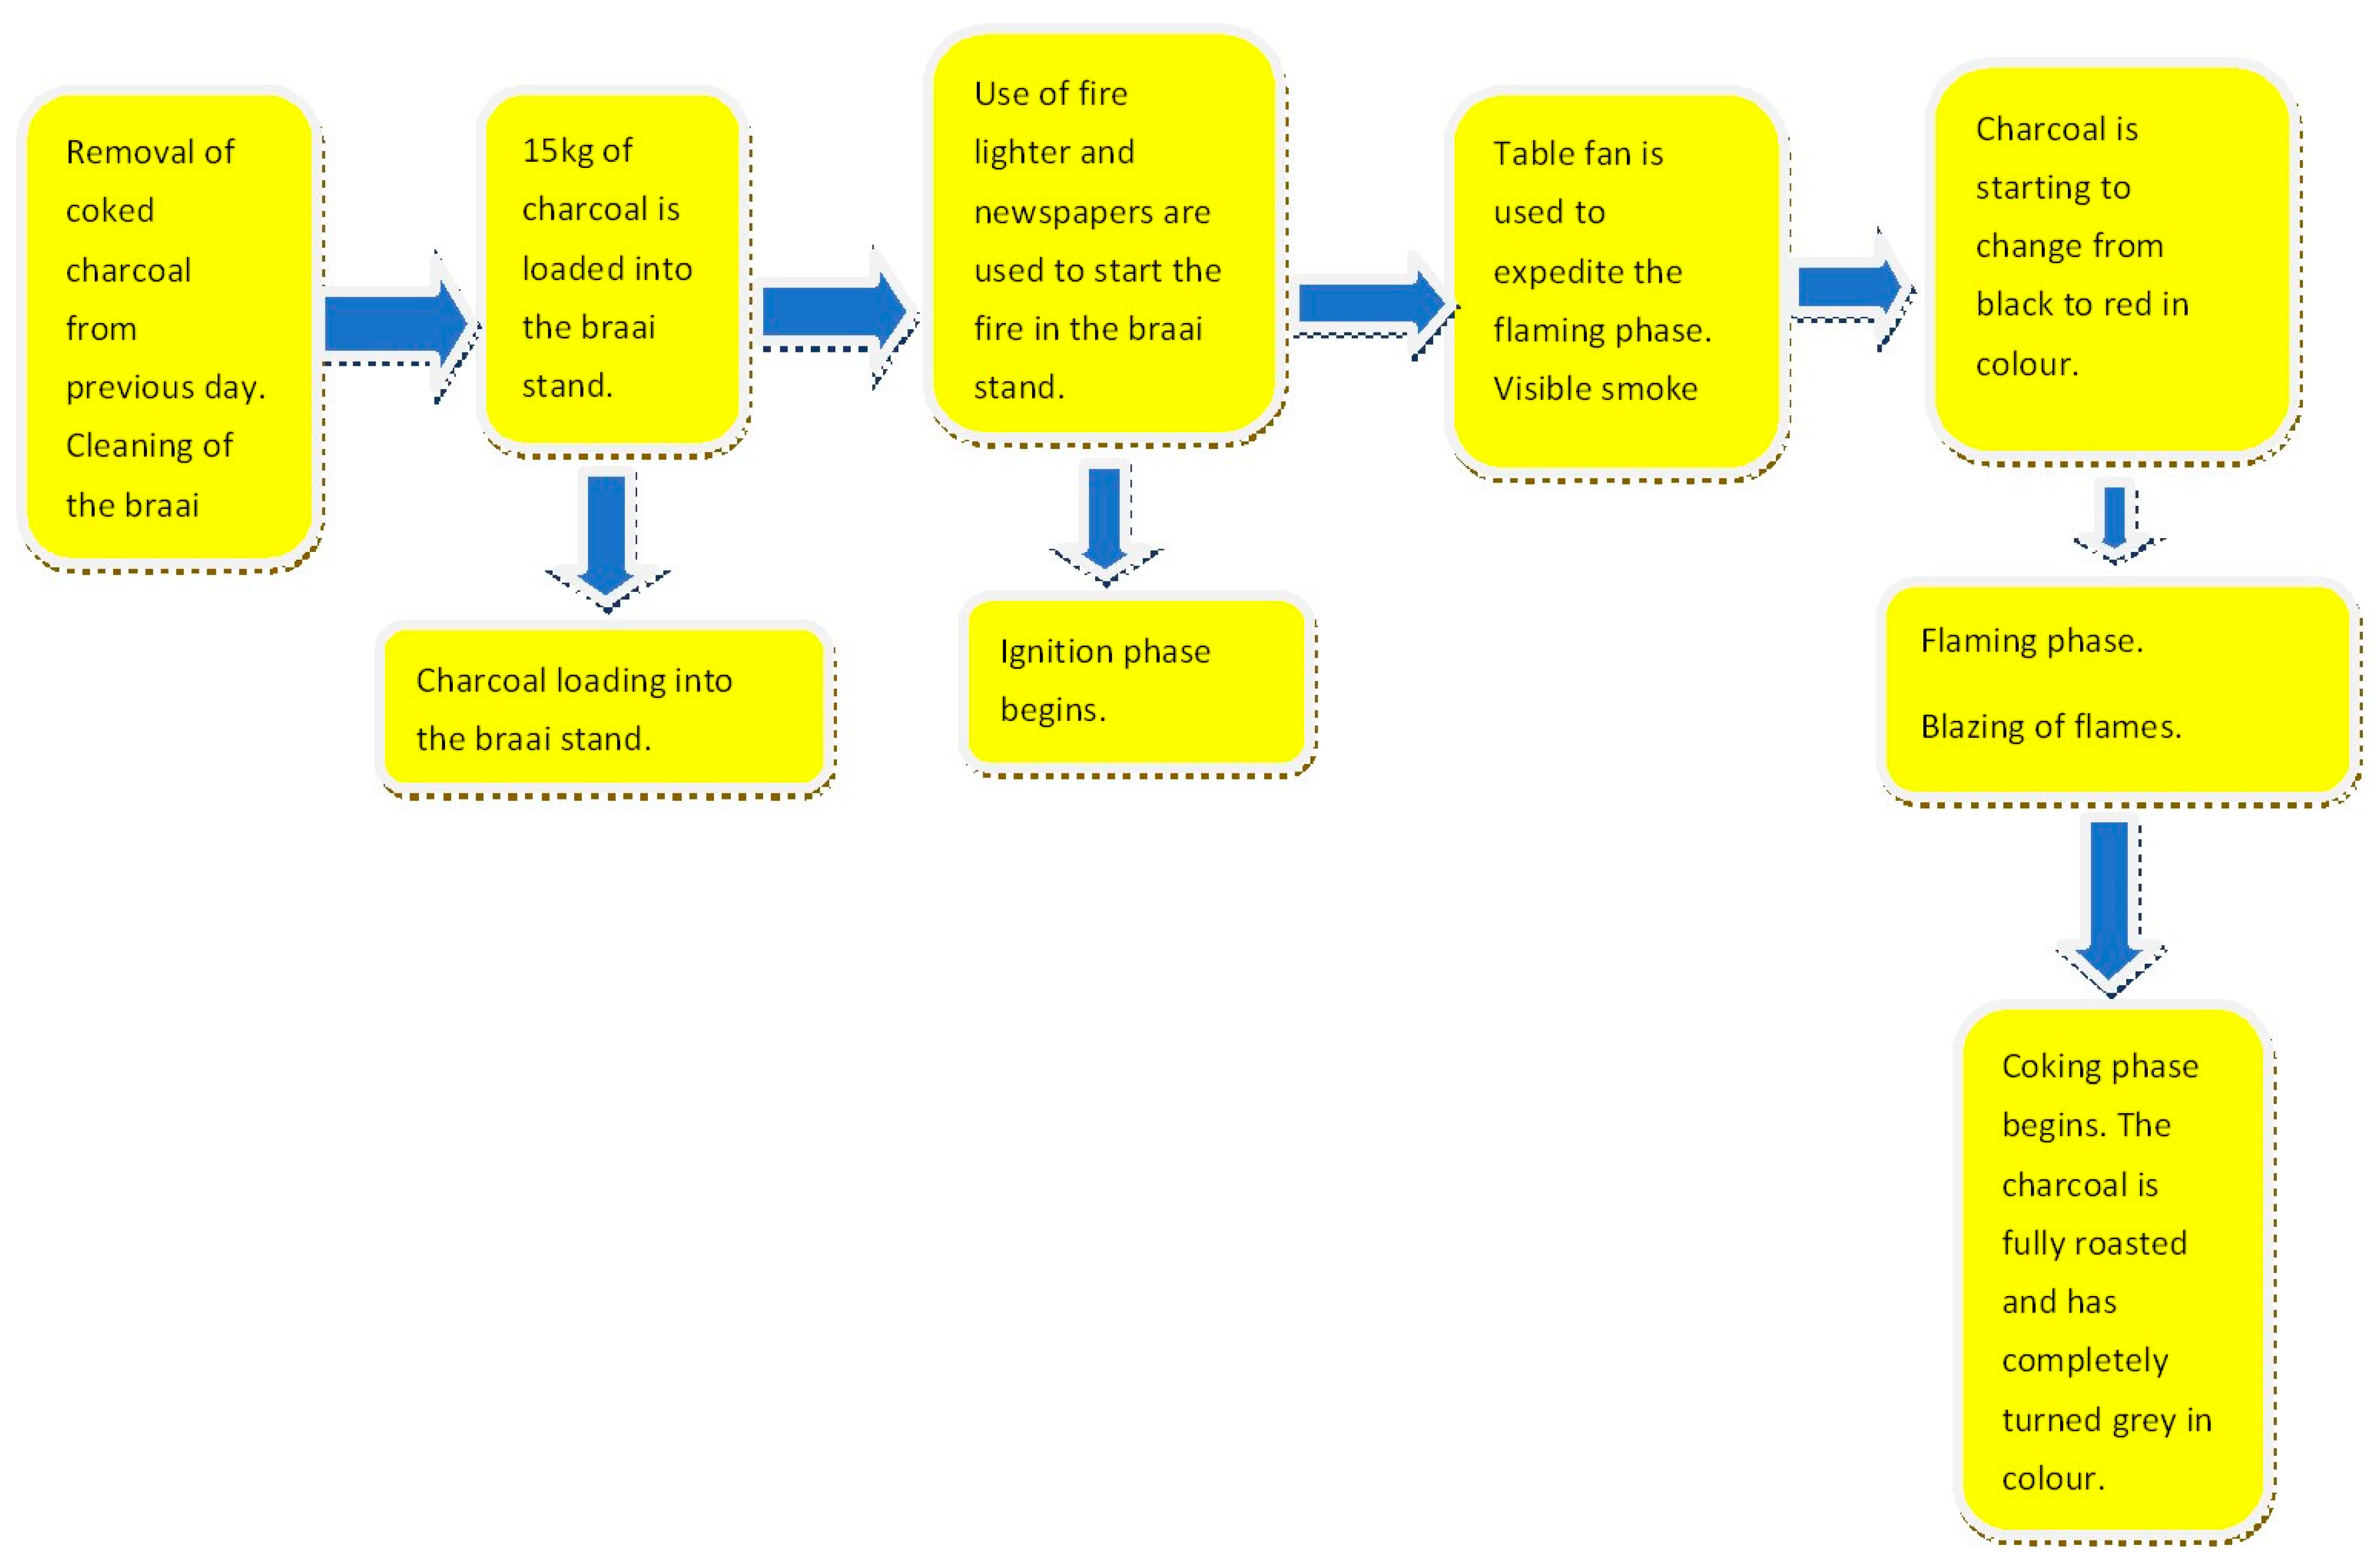
Different combustion phases require different periods to burn. Results showed that the coking phase lasts longer than the ignition phase and flaming phase. During the ignition phase, a fan was used to expedite the flaming phase by increasing air velocity and mixing charcoal to increase the blazing process whilst the charcoal started to burn. The duration of the coking phase was determined by the quantity of meat to be braaied, with the more meat to be braaied the longer the coking phase. Different phases within the combustion cycle require different meteorological conditions to complete a full combustion cycle. A flow diagram (
Figure 3) below shows activities that were undertaken in the informal food outlet.
2.4.2. BTEX Monitoring Using PID
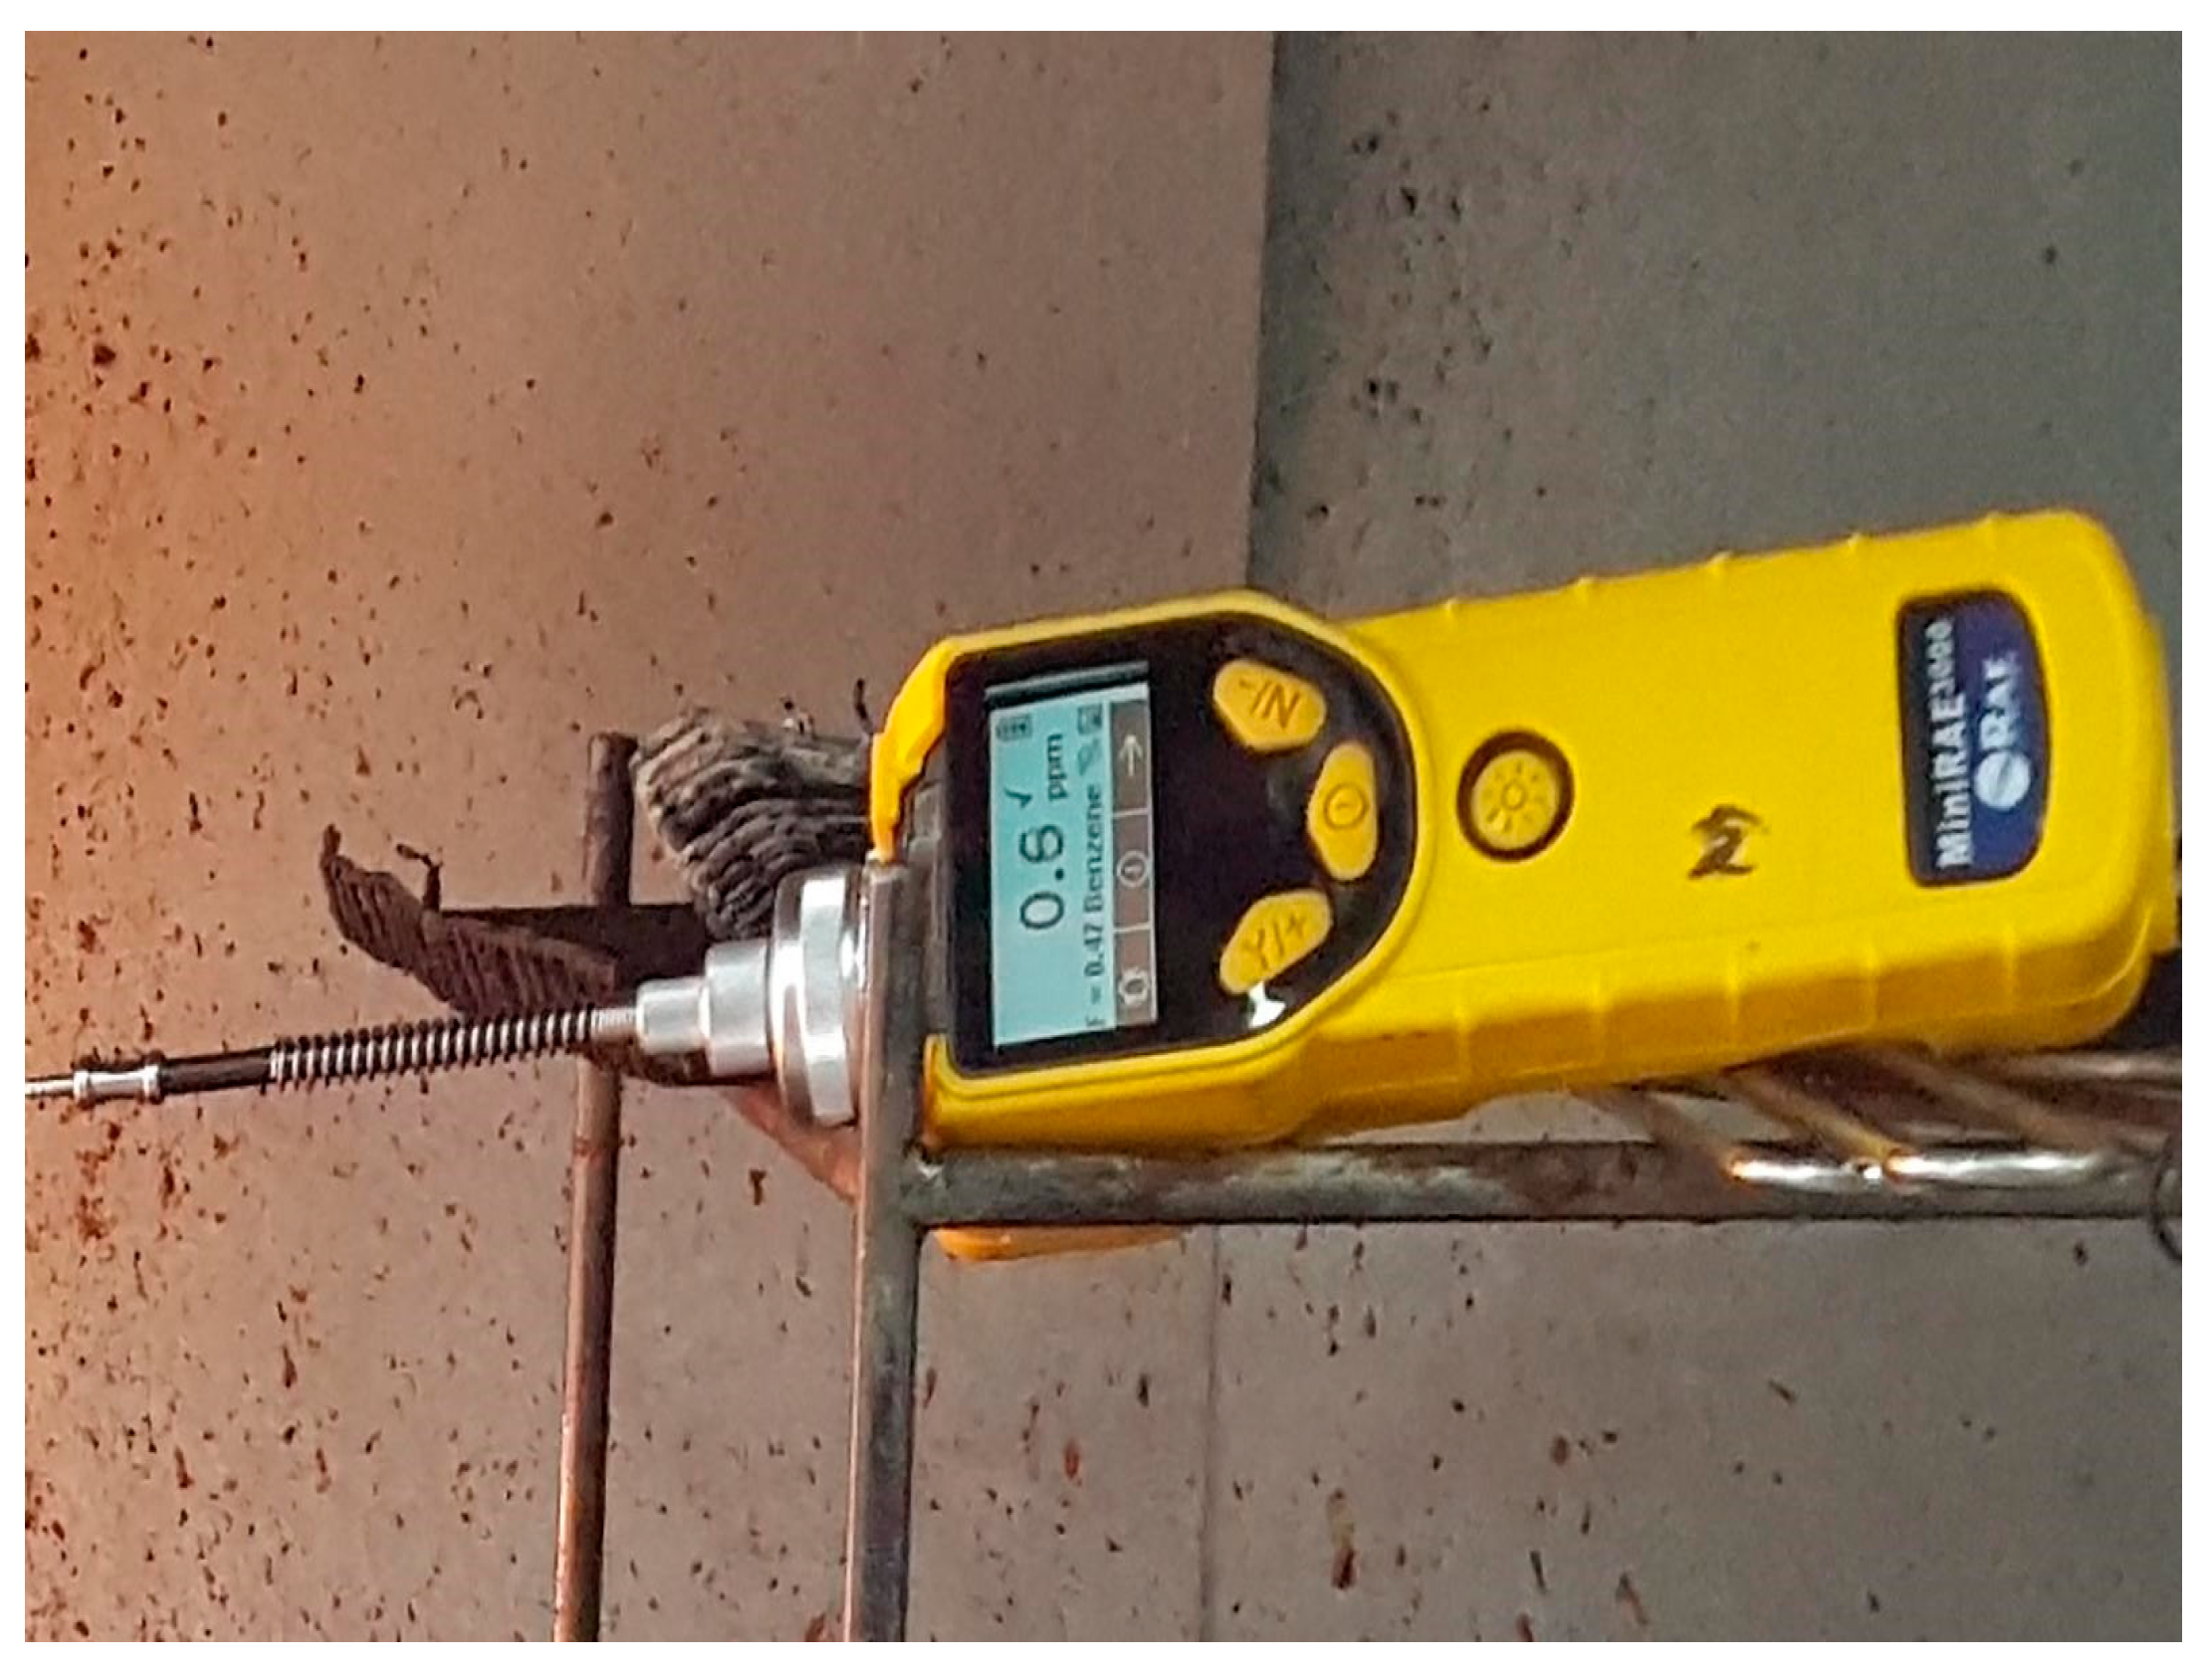
The VOC emissions during the different combustion phases of the food preparation were monitored using the photoionization detector (PID), MiniRae 3000 (RAE Systems, Inc., Kent, WA, USA) [
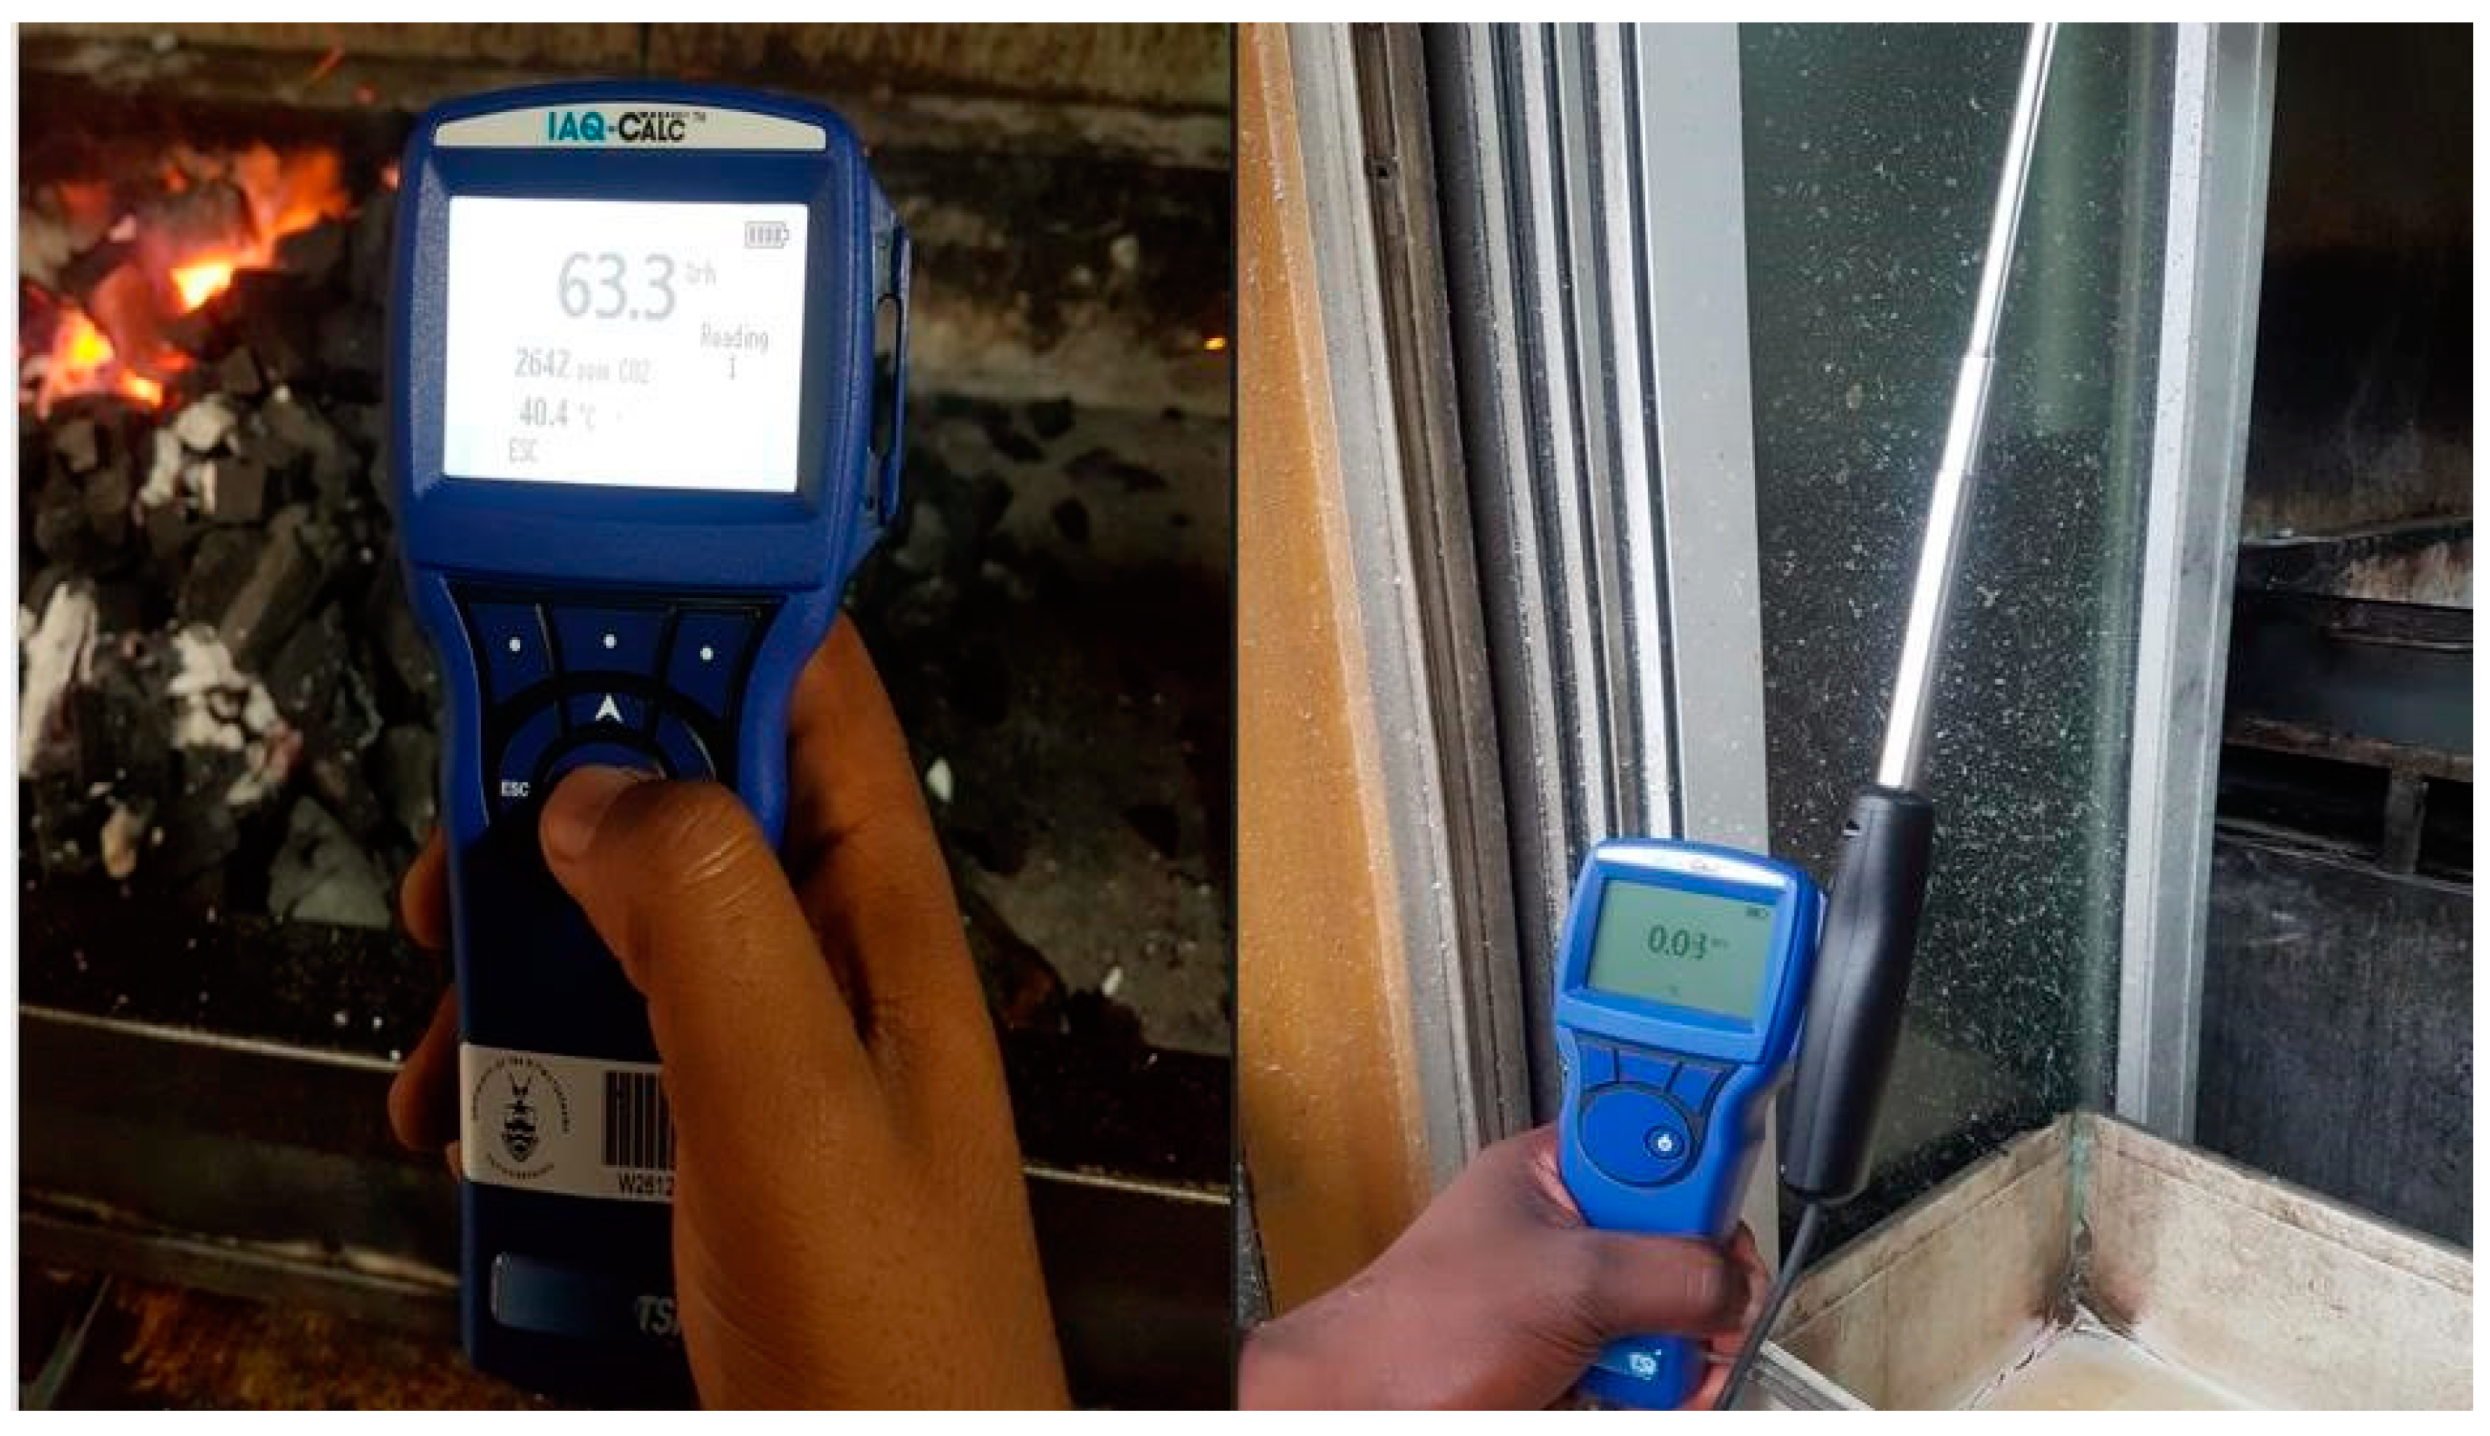
14]. The PID, as shown in
Figure 4, is a real-time direct-reading device with a 10.6 eV lamp (range 0.1–15,000 ppm) which was used to continuously detect VOCs.
The PID lamp absorbed the chemicals emitted and then ionized the chemical to provide an ionization response, which was then displayed as the concentration of the chemical as “ppm” (parts per million). The PID had an internal sampling draw pump that was calibrated using a standard reference gas, Isobutylene gas, and can also be calibrated using by two-point field zero [
15,
16]. Charged particles migrated to the electric field towards the respective electrodes, generating a current that was indicative of the number of formed ions + electron pairs, regardless of the compounds present in the chamber [
17].
When the monitored VOC levels exceeded the set limit, the PID buzzed and flashed the light-emitting diode (LED) on the display screen. Detection was presented as high, low, short-term exposure limit, time-weighted average, and showed the date and time of the concentrations detected. The data logging capabilities for the study were set at 10 s intervals. The PID was switched on and calibrated to zero using the internal pump of the instrument. Isobutylene gas was used for span calibration. Time and date were adjusted to the current time zones and the PID was set to ppm reading.
The gas that was used for measuring was benzene and the correction factor was at 0.47. Mini Rae Photoionization detector was charged 24 h before the measurements were taken. The PID was used to detect and measure the emission of VOCs from the three combustion phases. There were three informal food traders’ workstations; however, measurements were taken only at one informal food trader workstation (workstation 1). The total response of the PID depended on the specific mixture of VOCs; therefore, the response must be calibrated to the expected mix of VOCs. Isobutylene is the normal calibration gas, but the PID response can be adjusted to one of several specific VOC species or standard mixtures of VOCs such as gasoline [
18,
19]. The PID was placed on a tripod, at a height of 1.5 m from the ground and 0.8 m from the preparation area. A 1.5 m long Teflon tube with an outer width diameter of about 2 mm was connected to the PID to extend the probe inlet of the PID and avoid placing the device too close to the braai stand.
Each combustion cycle and combustion phase were monitored over three days in triplicates to reduce uncertainty by increasing the number of data points and the results were averaged to obtain correct emissions concentration. Monitoring was conducted at the start of the braaiing activities; thereafter, it was stopped to avoid the contribution of TVOCs from the previous burning cycle. Thereafter, 15 min of averaged concentrations and 10 s of data-logged measurements were exported into a Microsoft Excel spreadsheet for analysis.
2.5. Monitoring of Environmental Parameters (Humidity and Temperature) CO and CO2 Emissions
Relative humidity, temperature, carbon dioxide, and carbon monoxide CO emissions were measured during the three combustion phases using the Q-TRAK™ multi-function indoor air quality (IAQ) monitor (TSI Model 7575) (TSI Inc., Shoreview, MN, USA) depicted in
Figure 5. The direct-reading Q-Trak IAQ monitor is a multi-functioning, handheld test instrument that uses a probe to simultaneously measure RH, CO, and CO
2. It provides quick and accurate information to measure and assess these air quality parameters. One instrument with multiple plug-in probe options including VOCs and air velocity TRAKPRO™ (Version 4.7.2) data analysis software provided data logging, analysis, and documenting results for Bluetooth communications for transferring data or remote polling.
2.6. Passive Samplers (Radiello) for BTEX Emissions Sampling
Passive samplers (Radiello) were stored at room temperature inside containers 24 h before the start of conducting measurements. To evaluate the atmospheric average urban background BTEX concentration, before the start of the combustion phase, the passive sampler was placed at the entrance of workstation 1 to measure the background concentration that existed before the braaiing cycle. Cooler boxes and ice bricks were prepared to ensure a good temperature environment was maintained. Thereafter, at the start of the combustion phase, samplers were placed on a corrugated support structure resembling a wall at a height of about 2 m from the floor and 0.7 m away from the braai stand. The sampler was removed after the first complete braaiing cycle and it was placed inside the cooler box with ice and shipped to the laboratory for analysis.
2.7. Processing of the Raw Data
Data collected on the field notebook and data capturing sheet were transferred to a Microsoft Excel sheet for further processing and analysis. Data were grouped according to exposure characterization variables such as fire preparation method, time spent near the emission point, time taken to complete each meat braaiing cycle, and number of braaiing cycles in a day. Data from the PID were exported to a Microsoft Excel sheet using the instrument’s software supplied by the manufacturer and were further arranged according to the entire burning cycle and the combustion phases. The data from the PID were multiplied by the relevant correction factor to approximate a discrete probability distribution where isobutylene was used as a calibration gas. The correction factor was calculated using Equation (1).
where CF is the correction factor of a specific chemical, Mw is the molar weight, and Cf is the assigned correction factor when isobutylene was used as a calibration gas.
Thereafter, the average concentration of BTEX was used to calculate the time-weighted average (TWA) concentration corresponding to the entire burn cycle or a particular combustion phase. A TWA concentration was derived using Equation (2):
where TWA is the time-weighted average concentration corresponding to the combustion duration, C is the measured combustion cycle/combustion phase/derived chemical concentration, t is the actual combustion cycle time/combustion phase time, and T is the total combustion cycle time. The PID data were presented in ppm; therefore, for ease of data interpretation, we used ppm as the SI unit for the measured BTEX.
Data collected using field sheets during field observation were used to determine the time spent in the emission zone per shift. The average concentration of BTEX was used together with the time spent in the emission zone to calculate a shift exposure. Equation (3) was used to calculate the food trader’s (receptor’s) day shift exposure concentration.
where TWA is the time weighted average, t is the total time spent in the emission zone, and T is the total time of the shift duration.
2.8. Chemical Analysis
Details of the chemical analysis used were taken from previous studies [
20,
21]. In brief, after extraction of the sorbent tubes in CS2, gas chromatography with a flame ionization detector was used to quantify the concentrations of VOCs. Chromatographic separation was performed using a DB-624 column (0.25 mm ID, 30 m length, 1.4 µm film thickness) for quantification, as well as a DB-WAX column (0.25 mm ID, 30 m length, 1.5 µm film thickness) for verification, with a split injection of 3 µL and split flow of 20 mL/min. The carrier gas was nitrogen at a constant pressure of 5 psi. The injector temperature was 220 °C, and the detector temperature was 200 °C. The MSD ChemStation macro program extracted Peak areas, adjusted for internal standards, and transferred them to an Excel spreadsheet. The average concentration over the exposure period was calculated from the mass of the analyte found on the cartridge and the reported duration of sampling.
2.9. Data Analysis
VOC and BTEX sampling was repeated three times for each combustion phase (ignition, flaming and coking) over 3 consecutive days. We assessed VOCs and BTEX at various combustion phases for statistically significant differences. An F-Test for the null hypothesis that two normal populations have the same variance was used in the data analyses. This test can be used in practice, with care, particularly when a quick check is required, and is subject to associated diagnostic checking. Large alpha levels (at least 0.05) were used and balanced layouts because the F-Test is relatively robust. The F-Test was used to determine the type of t-test to employ (i.e., t-test (i): two samples assuming equal variances; or t-test (ii): two samples assuming unequal variances). A p-value > 0.05 indicates that the variances are the same; a p-value < 0.05 indicates that the variances are unequal.
A two-tailed student t-test (at 95% confidence level) was used for statistical evaluation of the BTEX emissions at three distinct combustion phases. Note: for this evaluation, a significant number means that the p-value was less than 5% (p < 0.05); a number that is not significant means that the p-value is greater than 5% (p > 0.05).
2.10. Quality Control
Quality control was achieved by calibrating the PID before and in between measurements to ensure the accuracy and authenticity of the results. Samples were stored in a cooler box with ice immediately after measurements were conducted and during transportation; thereafter, they were stored in the refrigerator at 4 °C for three weeks before being sent to the lab for analysis. Field blanks were handled, stored, transported, and evaluated in the same way as the VOC samples, but without exposure. Field blank samples were used to screen for contamination that might have occurred during sample collection, transportation, and storage.
4. Discussion
The study aimed to assess BTEX emissions from braaiing activities at a flea market in Fordsburg, Johannesburg. This study focused on informal food traders using charcoal as a primary source of energy and characterization of different combustion phases involved in a full braaiing cycle. Braaiing was the longest activity conducted on the premises lasting for 240 min in an 8 h work shift per one full combustion phase. Most studies that assess BTEX emissions have been conducted in nail salons, indoor air quality, traffic officers, exposure to VOCs in silages, exposure to petrol attendants, vehicle emissions, etc. [
20,
21]. This study is therefore focused particularly on the assessment of exposure to BTEX in the informal food trading sector and, according to the authors’ knowledge, this is the first-ever study to be conducted in South Africa, hence results of this study are compared to other sources of BTEX exposure and not of informal food trading.
Results show that during cleaning activity, employees were exposed to 3.13% of BTEX concentrations for 15 min within the 8 h working shift. BTEX concentration emissions from cleaning activity result from background concentrations and the dry sweeping of the floor surface. Studies conducted on indoor air quality have shown that VOC concentrations were several times higher than those in outdoor air although indoor quality is unregulated [
23]. Studies have shown that indoor VOC concentrations were significantly associated with the type of flooring materials, adhesives, and paints. The average indoor air BTEX concentrations were higher in homes and schools in Asia (0.74–125 μg/m
3) than those in the U.S. (0.30–11.6 μg/m
3), Canada (1.1–18.3 μg/m
3), and European countries (0.3–17.5 μg/m
3) [
23,
24]. Dry sweeping using a broom has been identified as one type of a factor that affects the effectiveness of cleaning and the resuspension of floor dust. Even though the cleaning activity does not contribute much to BTEX concentration exposure, it is important to note that repeated exposure can increase the potential inhalation of BTEX compounds [
25]. Resuspension can be an important source of indoor particulate matter compared with other indoor sources. Factors that influence the resuspension of VOCs from floor surfaces include intensity of activity, particle size, surface type, ventilation, and relative humidity [
25].
Since the study was carried out over three consecutive days, the background concentrations in
Table 3 show that there was no significant difference in the background concentrations and therefore there are other sources of TVOC emissions that may influence total volatile compounds which informal food traders may be exposed to as the literature suggests. These sources can be from indoor and/or outdoor sources since the flea market is partially enclosed as shown in
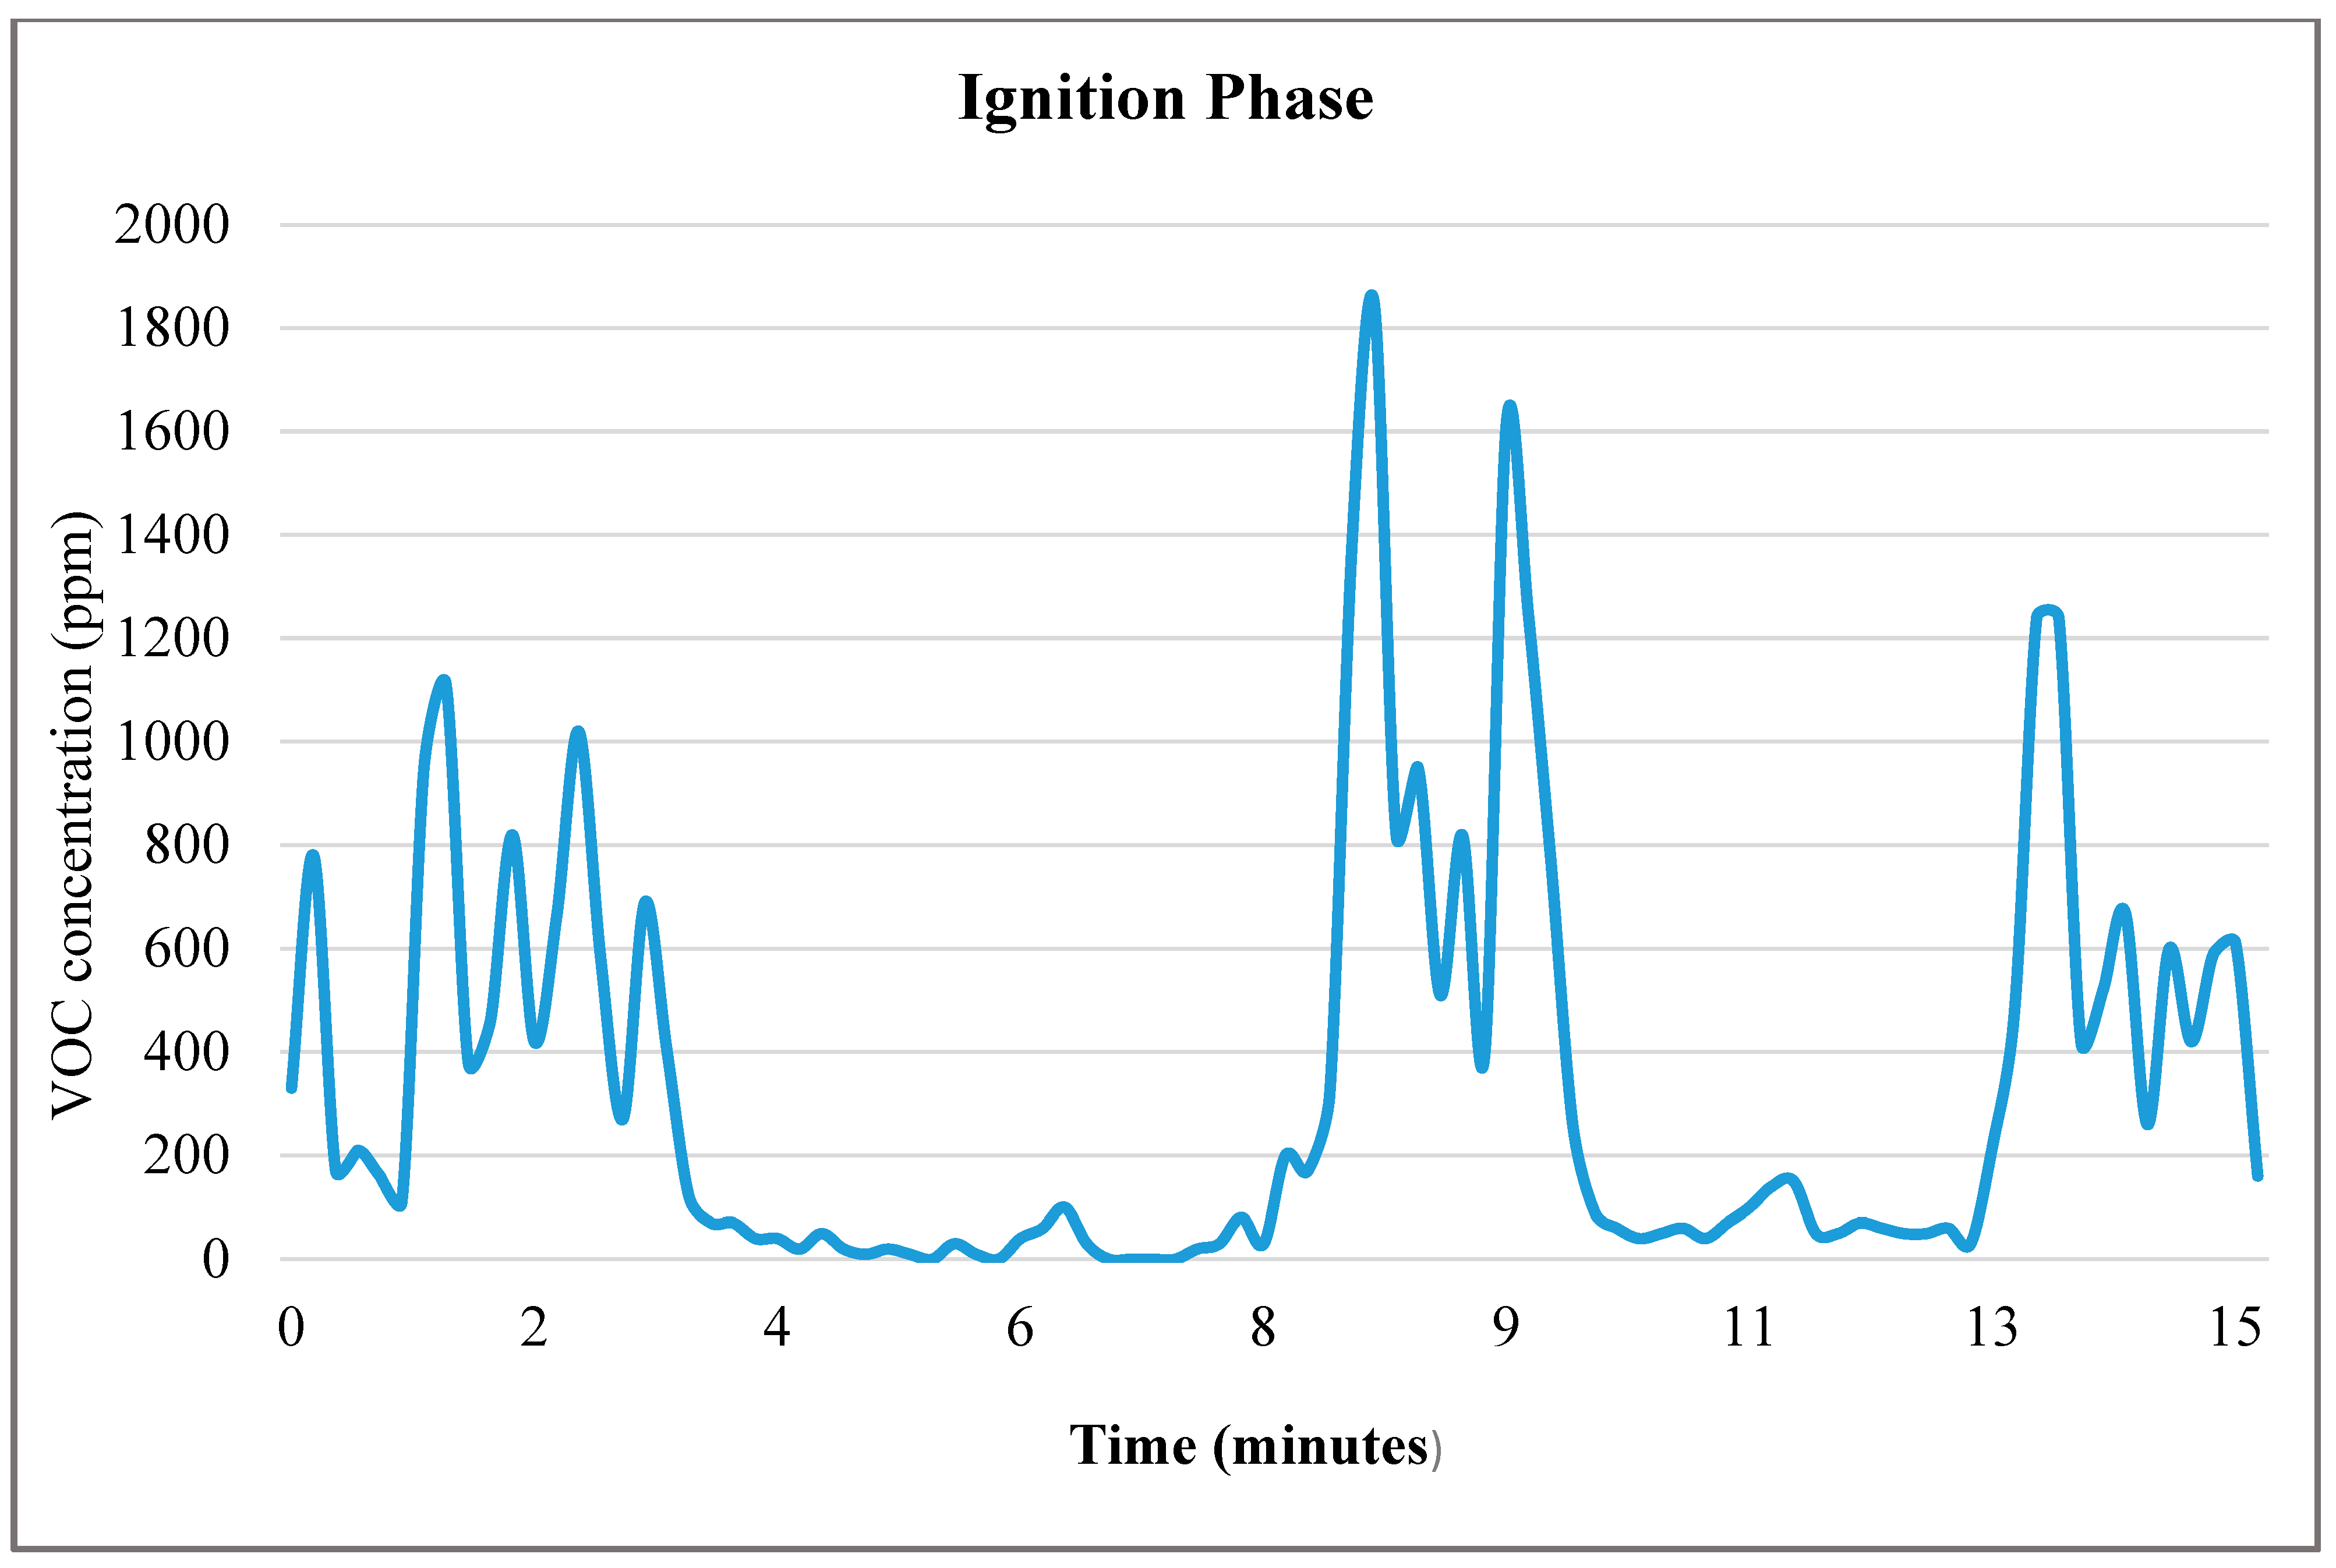
Figure 2. The ignition phase started at 5 ppm concentration emissions of TVOC, and gradually, as the charcoal started to burn, TVOC concentrations increased to 18 ppm reaching the maximum level. The ignition phase depends on the particle size, coal type, volatile matter content, heating rate, devolatilization rate temperature, and type of background gas [
26]. Low temperature in combustion is determined by the internal kinetic processes, diffusion processes, and heat treatment; moreover, low temperature is responsible for oxidation pyrolysis and carbonization before the gasification stage of low-grade fossil fuels and biomass [
27]. An increase in the TVOC concentration levels in the figure can be observed at 8:58 a.m. due to the usage of a table fan. A fan was used to expedite the ignition phase and speed up the process between the ignition phase and the flaming phase.
There was an increase in the concentration levels when a table fan was used. This is because the air velocity increases the charcoal mixture. TVOC level concentrations were much higher at the beginning of the ignition phase but started to reduce as time increased. According to Li and colleagues, ambient VOC content can be impacted by meteorological factors such as temperature, wind direction and speed, sunshine intensity, precipitation, and vegetation [
23] as depicted in
Table 4.
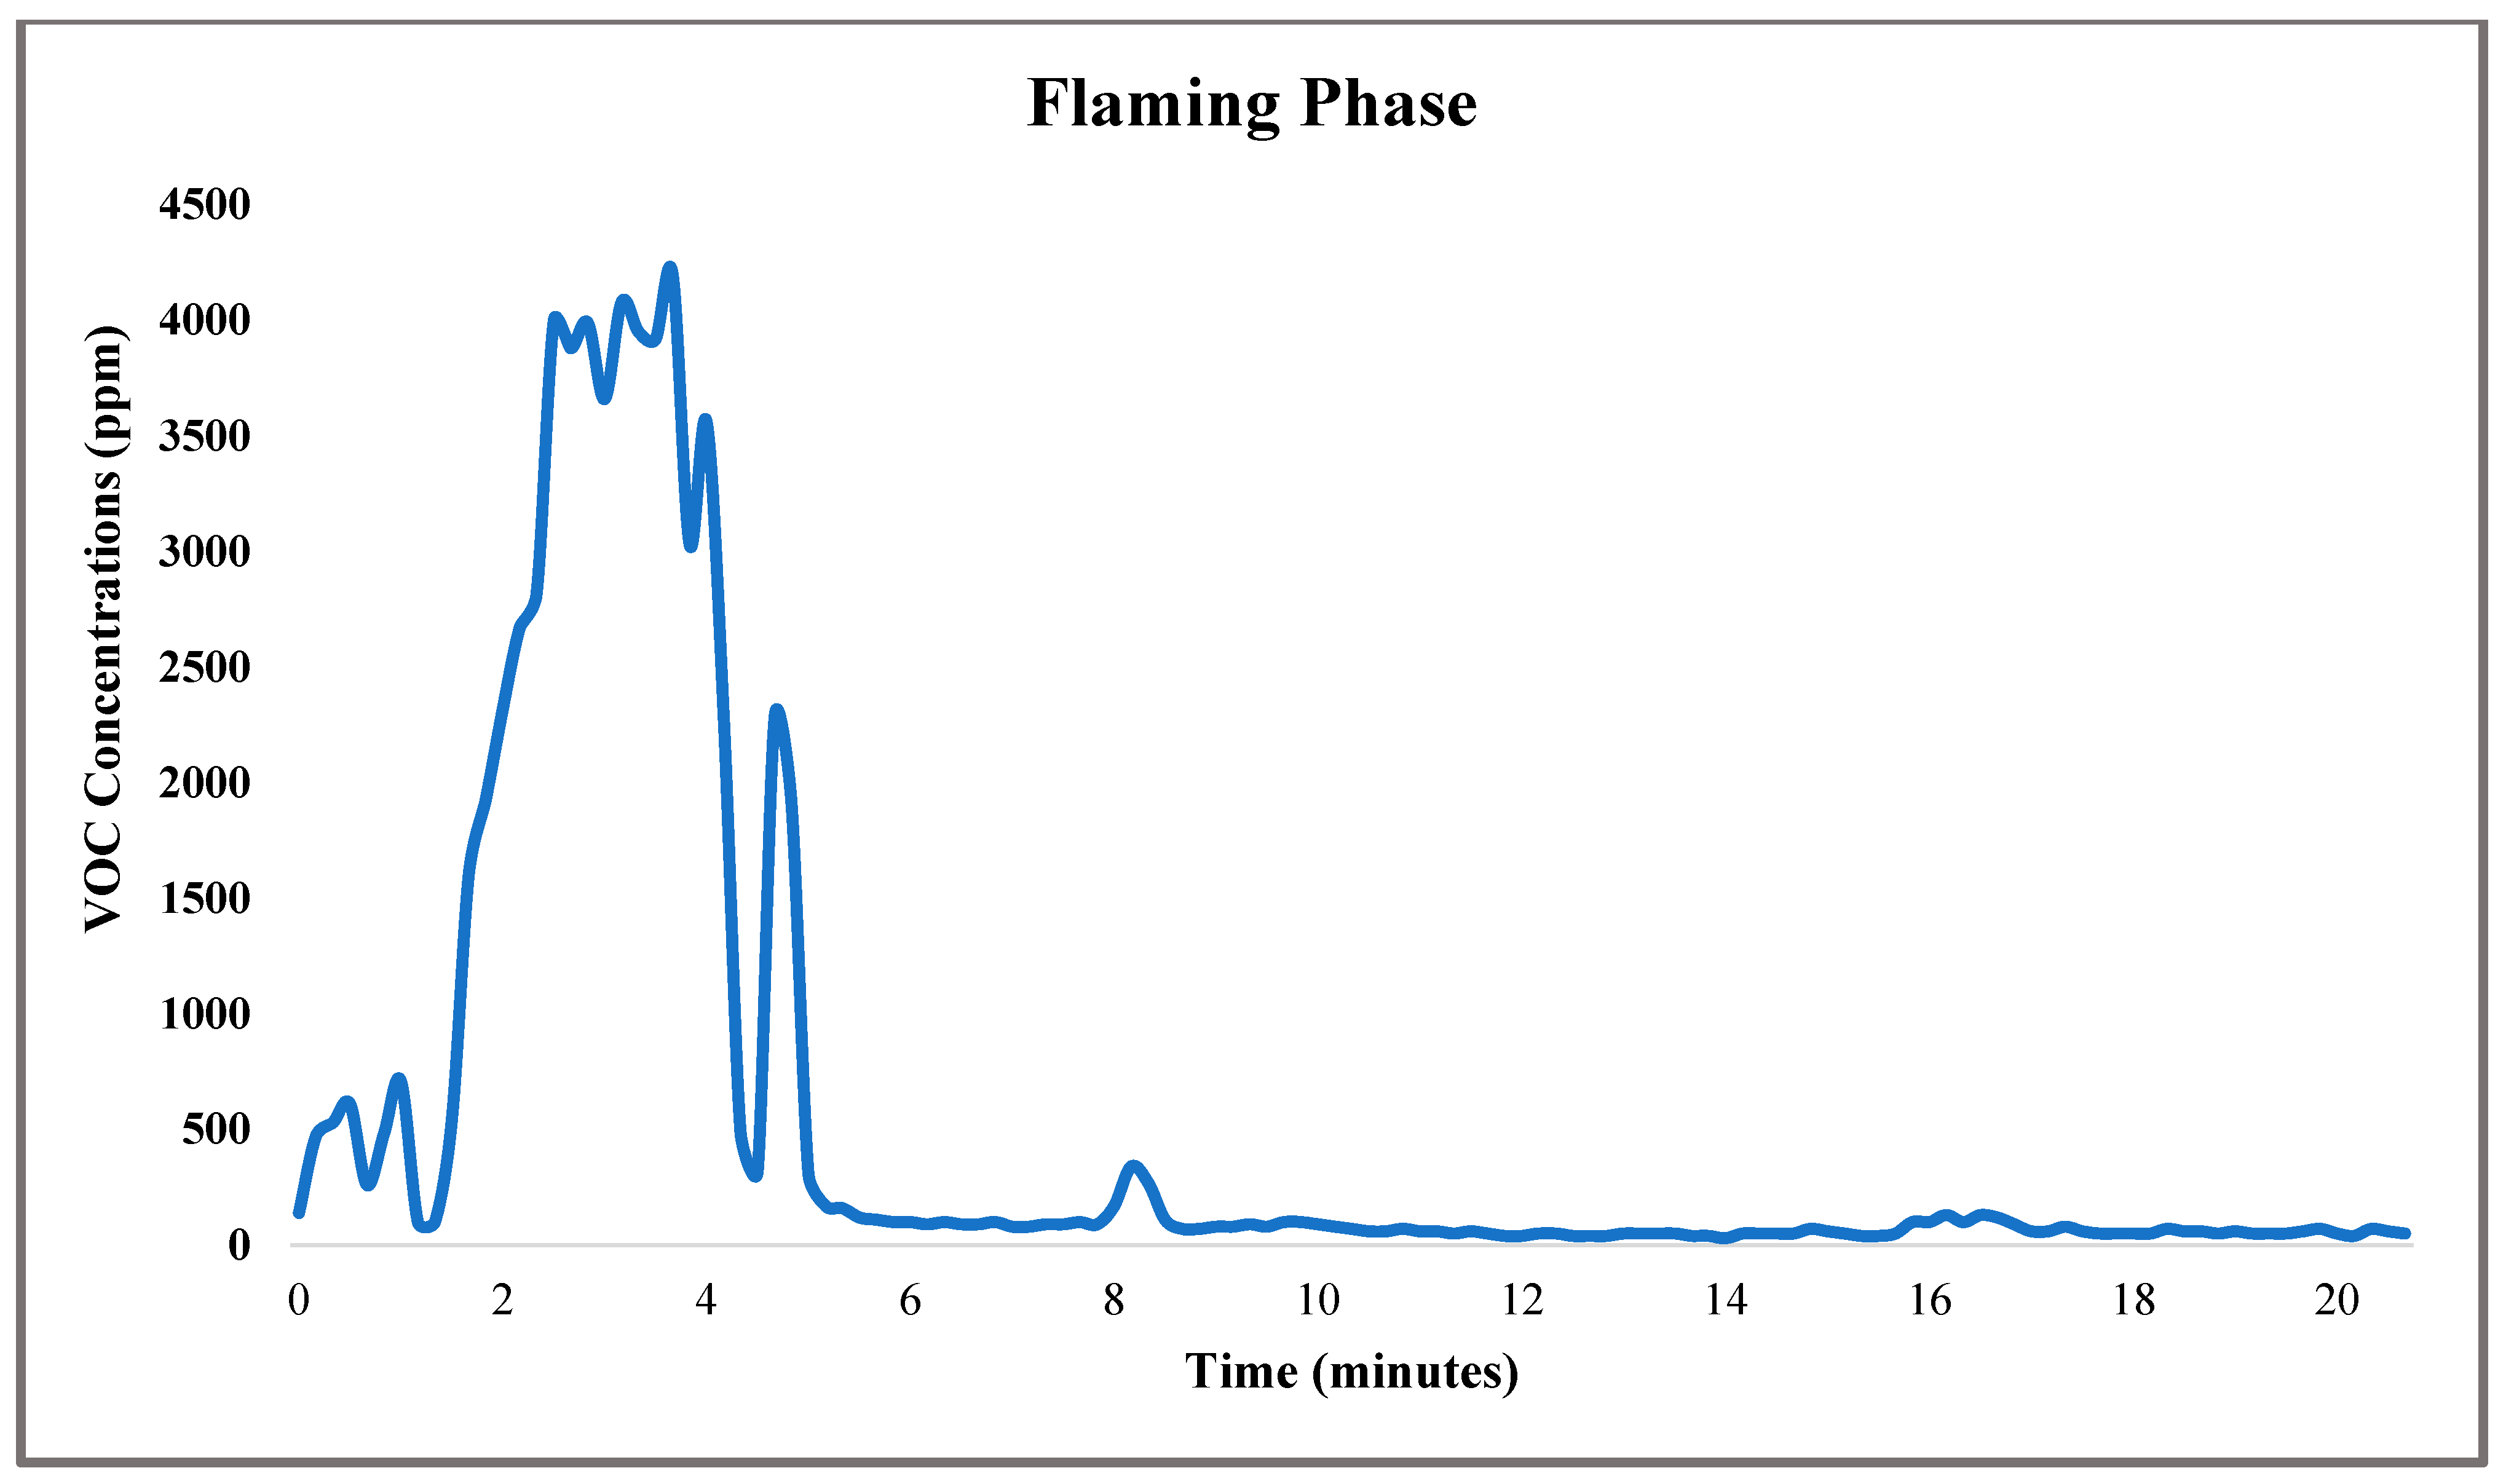
Combustion cannot proceed without steady and continuous ignition, which depends on the heating rate of the particles’ surface and the release rate of the volatiles under certain conditions [
28]. The flaming phase emitted more TVOC concentrations reaching a maximum level of 43 ppm whilst using a fan, but once the blazes and flames cooled down, the levels of TVOC emitted started to reduce drastically. The flaming stability of the charcoal was dependent on the oxygen concentration in the gas stream. Furthermore, flaming is related to ignition as the isolated particles interact and agglomerates in turn affect ignition [
28]. The flaming phase period was accelerated by oxygen concentration; therefore, flaming stability increases as the oxygen concentration increases [
28]. In addition, as shown in
Table 4, the flaming phase had high temperatures; this confirms the study carried out by Ryzhkov and colleagues, showing that the size and quality of the inner reaction surface accessible to the oxidizer are determinants of high temperature in combustion, so a large reaction surface would have the highest burn-up rate [
27]. Furthermore, when the inner surface in the heating process does not develop for certain reasons, combustion cannot be achieved at all, i.e., the low combustibility of paper rolls [
29].
Table 4 shows high temperature and humidity during the flaming phase reaching 31 °C and a relative humidity of 50.8% as compared to during other combustion phases. The coal flame stability and the combustion efficiency are strongly suppressed by the increasing pulverized charcoal particle size. At larger particle sizes, the coal powders have greater inertia, resulting in higher densities in the impingement area. These densities strongly attenuated the combustion of volatile and char and the temperature in the furnace. These things considered, the concentrations of O
2, CO
2, and CO also indicate the presence of incomplete combustion [
30].
Table 4 depicts different levels of CO and CO
2 in the three combustion phases as known factors that influence total combustion. A study conducted by Makonese et al. revealed that CO emissions decreased during ignition contrary to the norm that CO emissions increase with lack of ventilation [
31]. High CO emissions are found in the flue gas because the char’s surface oxy-sorption produces CO that cannot be further oxidized to CO
2 in the absence of enough oxygen. Therefore, a shortage of oxygen causes smoldering combustion conditions that encourage the release of incomplete combustion by-products, such as CO.
A change in the ignition mechanism had no appreciable impact on CO
2 emissions, as per
Table 4 results, because coal’s carbon content determines CO
2 emissions, and because the fuel was obtained from the same batch, little to no change in overall CO
2 emissions was anticipated. During the early stages of pyrolization, poor combustion conditions have an impact on CO, but coking combustion produces the majority of CO [
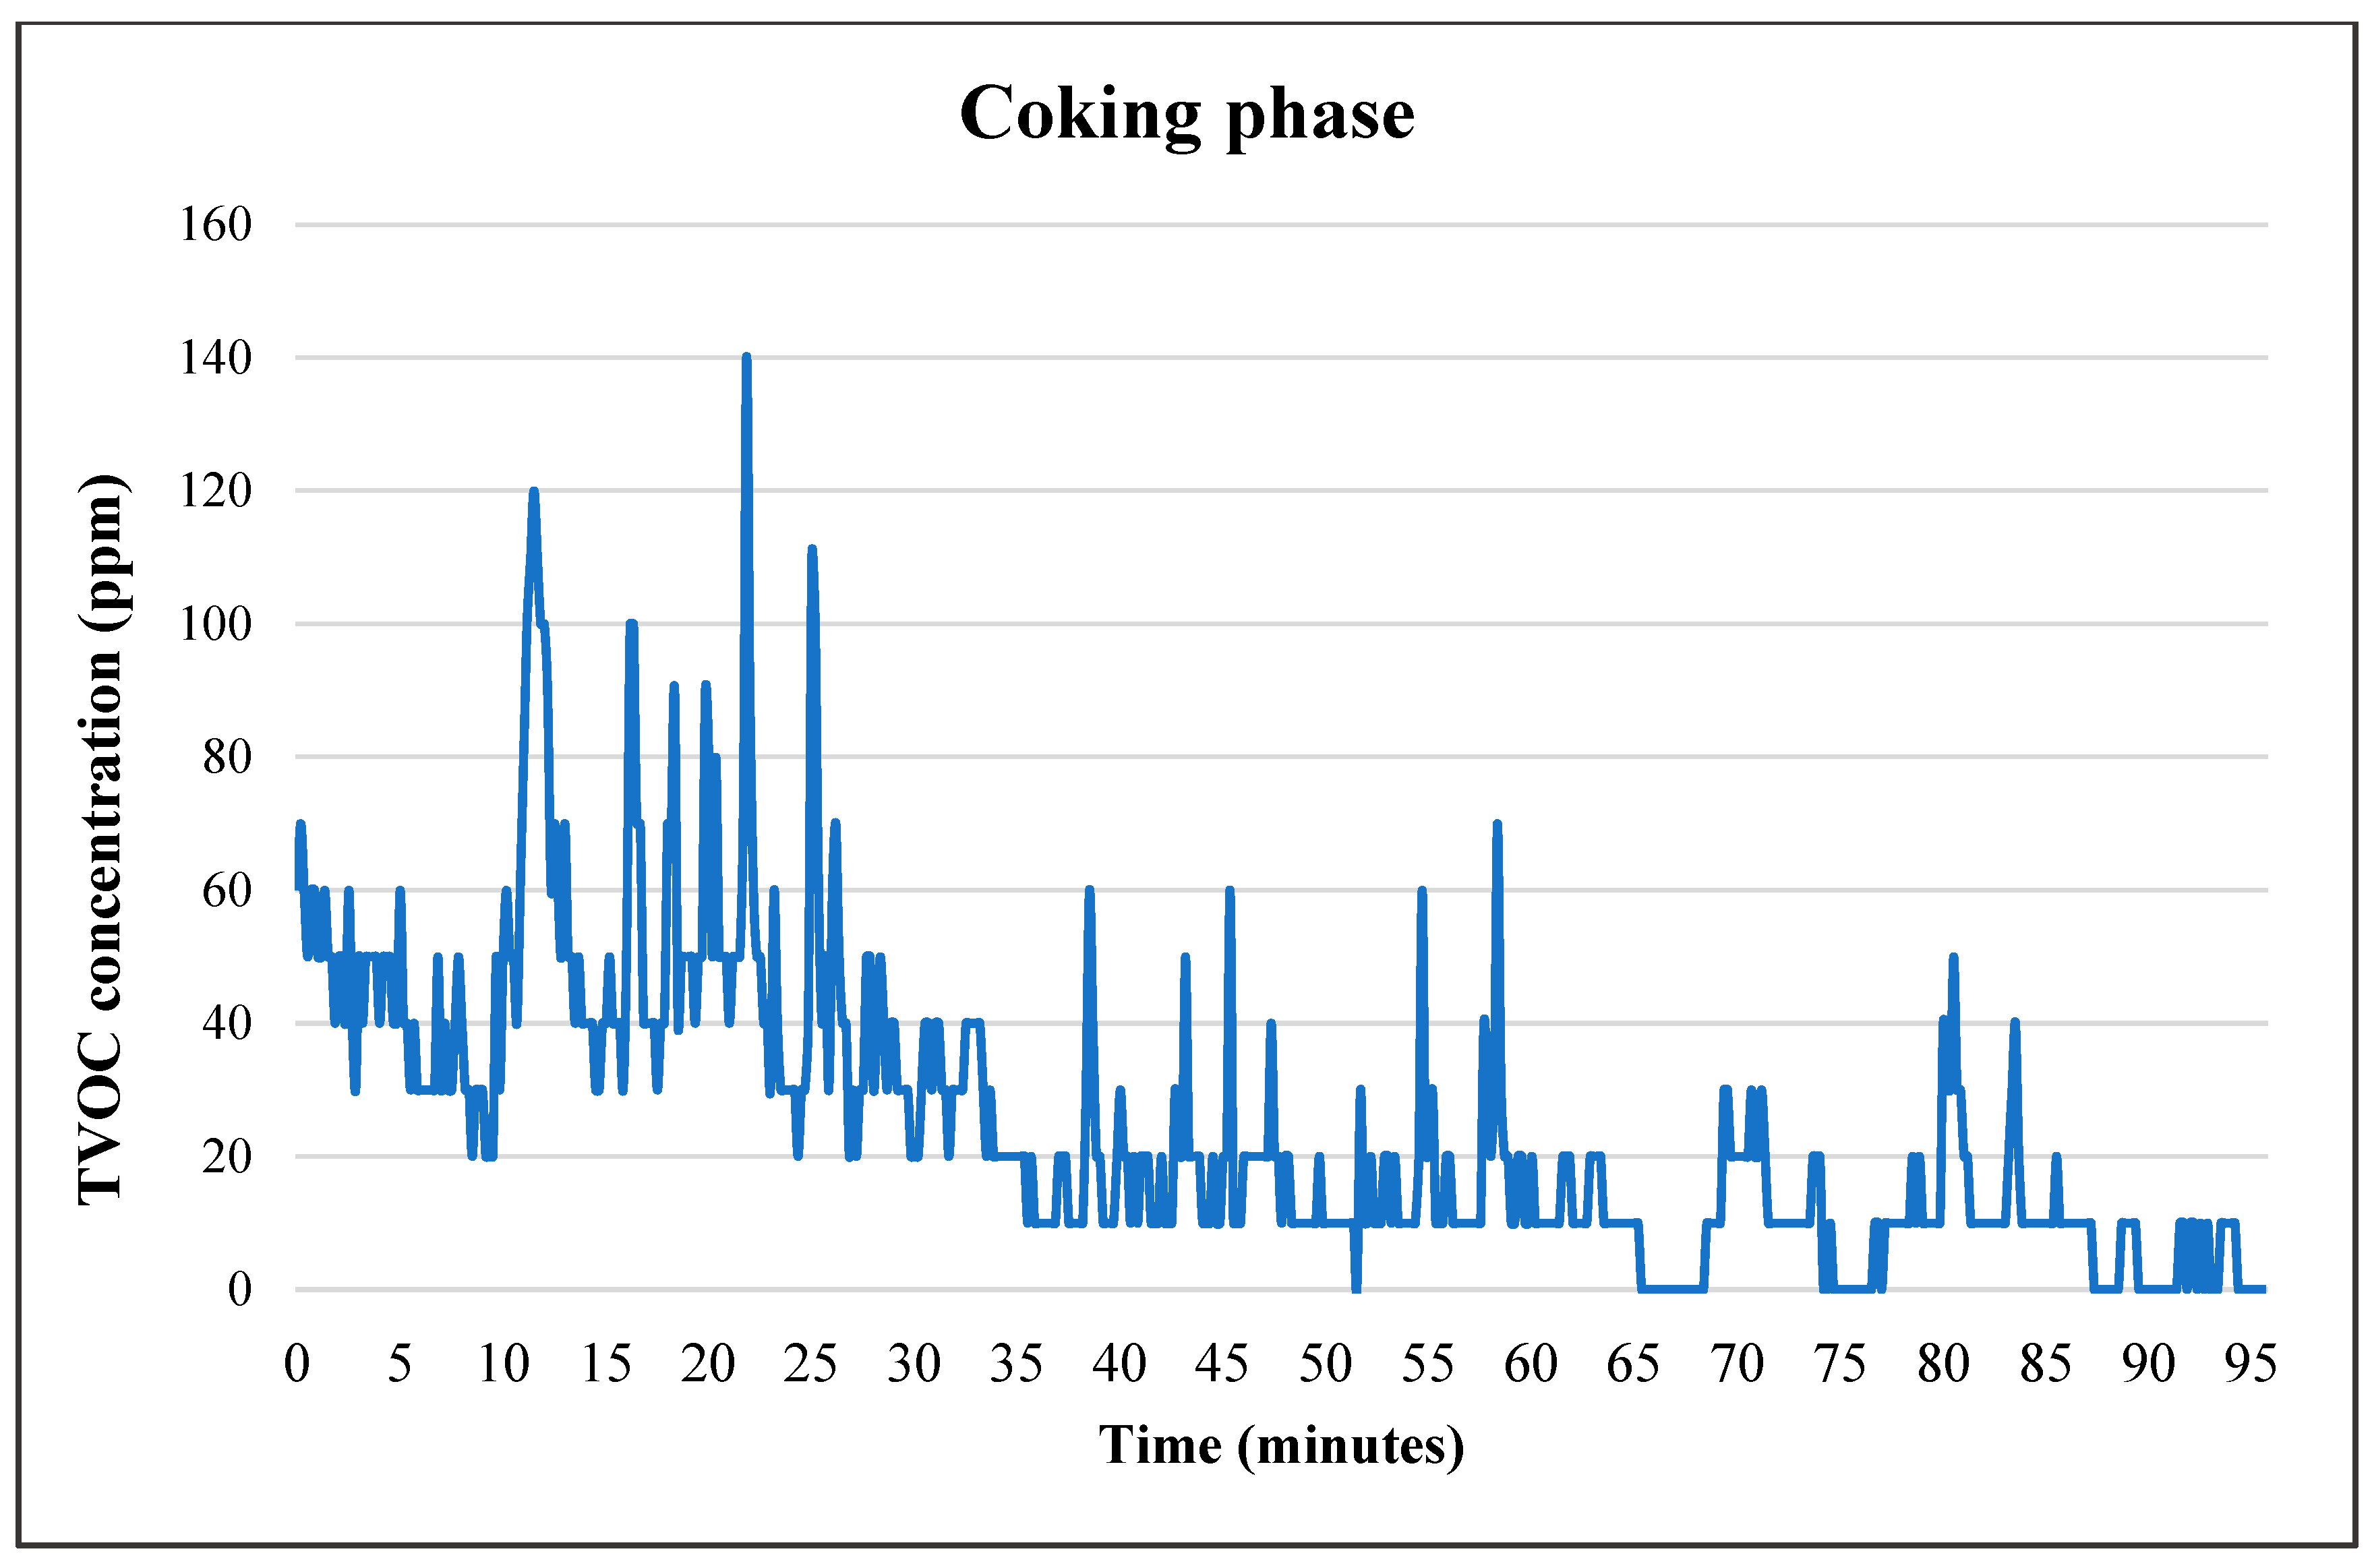
31]. When the charcoal is fully roasted and mostly grey and in powdered form, the third phase of the combustion phase begins, known as coking. This phase was characterized by charcoal having a large-pore structure and a slow heating process.
Figure 8 depicts the coking phase having a high burn-up time as compared to all other phases. Moreover, the slow heating process ignites at the ambient temperature shown in
Table 4 reaching 26.9 °C and at a relatively low mass rate and lowest relative humidity of 39.5 in the whole combustion phase. The coking phase had the lowest emission of TVOC concentration ranging between 0.15 ppm and 1.6 ppm. This part of the combustion phase is when meat is placed on the braai stand to be braaied.
Therefore, the decrease in the mass of the unit surface of the coke ash residue is a variable quantity [
27]. Charcoal combustion at low temperatures emits low volatile contents, and low TVOC emissions can be observed in this combustion phase ranging between 0.3 ppm and 4.2 ppm which is much lower than in the first three combustion phases. During the cooking phases, oxidation gets delayed in temperature and time due to the release of the main mass of volatiles blocking access to oxygen in combustion [
27]. Results show that the coking phase had a temperature average of 28.9 °C. The results confirm that the slow heating process ignites at ambient temperature. Slow heating happens when the charcoal is introduced into the upper part of the low-temperature carbonization shaft onto a cold bed, and it starts heating with the bed as it descends through the shaft to the combustion zone. Therefore, the decrease in the mass of the unit surface of the coke ash residue is a variable quantity [
32]. During this phase, the volatiles cannot escape as they were trapped by the hot surface zone, hence there were low volatiles and therefore there were low emissions and exposure to volatiles during this phase.
BTEX level concentrations from the Radiello were analyzed by the laboratory. The results showed that benzene and toluene were the most abundant compounds in all the combustion phases, respectively, in a complete braaiing cycle. The results reveal that informal food handlers are exposed to high benzene concentration levels and high toluene concentration levels. Findings from the Radiello show that not all combustion phases emit BTEX compounds at equal concentrations. The flaming phase had a high benzene concentration at 4.8 µm/m
3, compared to other combustion phases, and a concentration of toluene at 2.9 µm/m
3. In a study conducted by Masekameni et al., it was found that the benzene concentration was higher and ranged from 857 to 942 µg/m
3, with a mean of 919 µg/m
3 over a three-hour burn cycle in a study that was conducted to assess BTEX levels in a simulated laboratory as, compared to our study, this may be due to a difference in the measurement period [
33,
34]. The coking phase and refueling phases (both ignition and coking) showed the lowest emissions of BTEX at maximum concentrations of 1.8 µm/m
3. Ethylbenzene, m, p-xylene, and o-xylene concentrations remained constant at 1.8 µm/m
3; in all the combustion phases, the results show that the exposure risk is low but when frequency and duration increase there is potential for exposure risk. A study that was conducted by Moolla and Johnson at the Lanseria Airport found BTEX concentrations ranging from 12.95 µg/m
3 to 124.04 µg/m
3 whilst using passive Radiello over 10 days [
20]. These results are high compared to our findings due to different measurement location duration of measurement and sources of BTEX.
A study was conducted in Malaysia using active sampling adsorbent tubes and online gas chromatography to assess VOCs from the ambient environment, particularly BTEX from different sources such as vehicular emissions [
35]. This study found that toluene had the highest concentration among the BTEX compounds with average hourly concentrations between 2.76 ± 2.05 mg/m
3 and 22.31 ± 11.54 mg/m
3, while ethylbenzene were recorded at the lowest concentrations with hourly averages ranging between 0.36 ± 0.36 mg/m
3 and 4.52 ± 2.25 mg/m
3 [
35]. These results are in alignment with the results from our Radiello findings except for ethylbenzene. BTEX concentrations measured in a wastewater treatment plant in Turkey by Ulutaş et al. revealed concentrations of BTEX components were 2.78, 11.6, 3.72, and 11.9 µg/m
3 for benzene, toluene, ethylbenzene, and xylenes, respectively [
36].


 ,
, 


