Article

The Effect of Environmental, Social, and Governance (ESG) Performance on Corporate Financial Performance in China: Based on the Perspective of Innovation and Financial Constraints

School of Finance and Economics, Jiangsu University, Zhenjiang 212013, China
*
Author to whom correspondence should be addressed.
Sustainability 2024, 16(8), 3329; https://doi.org/10.3390/su16083329
Submission received: 5 March 2024 / Revised: 5 April 2024 / Accepted: 7 April 2024 / Published: 16 April 2024

Abstract

:
This paper analyzes the effects of Environmental, Social, and Governance (ESG) performance on corporate financial performance (CFP), enriching the research on the intrinsic mechanism between ESG and financial performance in developing countries. This study uses a data sample of A-share listed companies in Shanghai and Shenzhen, China from 2009 to 2021, and adopts a two-way fixed effects model research methodology with fixed time and industries to explore the relationship and intrinsic mechanism between the two in conjunction with relevant basic theories. The study findings indicate that ESG performance exerts a positive influence on CFP by fostering corporate innovation. Corporations with good ESG performance in the long term may be more conducive to good CFP. When corporations face financial constraints, the role of ESG performance in enhancing CFP weakens. Heterogeneity analyses indicate that ESG performance contributes more to the CFP of non-state-owned enterprises (non-SOEs). The negative moderating influence of financial constraints is more pronounced in non-SOEs. Additionally, ESG performance promotes the improvement of CFP in non-heavy polluting corporates. This research study extends a scientific foundation for how corporates can improve CFP and increase market competitiveness.

1. Introduction

As global economies continue to develop and the industrialization process continues to advance, worldwide environmental and social concerns are becoming increasingly prominent; thereby, they are attracting widespread attention from all walks of life. As a consequence, sustainable development has become a pivotal research topic. In 2016, in order to control ecological pollution, and due to the commitment to peak carbon by 2030, the State Council proposed to construct a green financial system in China to accelerate the development of a global consensus on green finance. Meanwhile, stakeholder integration of sustainable development with corporate strategy shall serve as the direction of ESG development [1]. Specifically, ESG performance helps to reflect the development of green finance, while its concepts persist in taking hold.
Noticeably, ESG performance acts as a third-party evaluation system that focuses on environmental protection, social responsibility, and corporate governance (CG), while organically combining and harmonizing the economic and social benefits of enterprises. At present, regulators across the globe attach vital significance to ESG policies, regulations, and guidelines. In the meantime, the ESG system has gradually evolved as a result of green finance supported by the previously well-known notion of socially responsible investment.
High ESG performance promotes corporate green innovation [2]. High-tech industries in China, such as the new energy industry, are majorly financed by the government instead of the market at the early stage of development. Nonetheless, government support can also entail severe issues such as a shortage of funds [3]. Owing to the limitations of the traditional financial system, the state support mechanism cannot replace the market mechanism [4]. In general, ESG ratings extend green funds for enterprise credit assessment, while the alleviation of financial constraints makes the enterprises’ development enter a virtuous circle.
Prior to the establishment of the ESG system, corporations were unable to precisely estimate their costs and environmental benefits. Consistent with this, it was difficult for the beneficial behavior of the corporation to reflect its financial performance. Simultaneously, it was challenging for investors to ascertain the ecological protection efforts of firms and determine whether the enterprise reflected a sound corporate image; thus, it was difficult for them to engage in rational investment behaviors. Reportedly, ESG third-party rating agencies evaluated the ESG performance of companies and published ESG score data. Accordingly, enterprises that had long been committed to ecological protection, social responsibility, and CG scored comparatively high in terms of their ESG performance, which established that their corporate image was relatively better and more favorable to investors, which is conducive to promoting an improvement in CFP.
In terms of research on ESG performance and firm development, several studies have explored the relationship between ESG performance and firms’ green innovation [5,6,7]. The innovation of enterprise technology is very important for the sustainable development of the enterprise, but the business condition of the enterprise is also an important factor that managers need to consider. Currently, there are relatively few studies on the impact of ESG performance on corporate financial performance, and scholars’ views on the relationship between ESG performance and financial performance are not uniform. R.M. Ammar Zahid (2023) [8] found that ESG performance has a negative impact on firms’ financial performance. Nidhi Agarwala (2024) [9] found a U-shaped relationship between ESG and financial performance. In addition, some scholars have researched and found only that ESG performance has a positive impact on financial performance, but the mechanism of its impact has not been studied in depth [10]. The definition of social responsibility is not uniform. Some scholars in previous studies have argued that CSR encompasses corporate governance-level factors such as environmental practices, executives, etc. [11]. As a result, some scholars have studied financial performance, focusing only on the social responsibility perspective in ESG performance [12]. China is the second largest economy in the world, but the rapid economic development has also brought serious environmental problems. Some enterprises believe that investing in environmental protection equipment will increase costs, which in turn will affect corporate profits [13]. With China’s commitment to peak carbon by 2030, this is a critical time for companies to make a green transition. ESG rating data is one of the most important indicators of corporate sustainability. Most of the research on ESG and financial performance focuses on developed countries, while China’s market is somewhat different from the West. China’s stock market is regulated by the government, and listed companies are subject to certain restrictions when issuing shares [14], and non-state-owned enterprises are also affected to a certain extent. Therefore, this study focuses on whether ESG performance has a positive impact on corporate financial performance.
Considering that the China Securities Regulatory Commission (CSRC) issued guidelines on social responsibility reporting for listed companies in 2009, social factors have been included in the scope of China’s corporate management, and the information of ESG rating indexes has been further improved. Therefore, this study selects Chinese A-share listed companies in Shanghai and Shenzhen from 2009 to 2021 as the research sample. We not only investigate the two mechanisms through which ESG performance affects financial performance, financing constraints and financial performance, but also analyze heterogeneity in terms of firm ownership and industry characteristics. Specifically, we explore whether the impact of ESG performance on financial performance differs between non-state-owned firms and state-owned firms when firms are under financing constraints. As well, we separately investigate the impact of ESG performance on the financial performance of heavily polluting firms, such as thermal power, versus non-heavily polluting firms, to provide some insights into the green development of firms.
Exploring the effect of ESG performance on CFP is imperative for accelerating the development of a green economy [15]. The key contributions of this research study are as follows. First, this paper explores whether CFP is influenced by ESG performance, while identifying the economic benefits of ESG performance at the micro level, thereby complementing the existing literature on financial performance. Typically, the present literature on ESG performance concentrates on well-developed markets. Moreover, past studies on ESG performance focus on the effect on investment, such as IPO price suppression [16], green bonds [17], and other relevant studies. However, there are relatively few studies on how ESG performance impacts corporate financial performance. This research study not only assists in filling this gap but also helps to enrich the current literature on ESG performance in developing economies. Secondly, this paper further expands on the influencing factors of CFP by emphasizing the value of corporate innovation capabilities, consequently offering a novel perspective on the influence of ESG performance on CFP. Accordingly, the mediation effect model is adopted in this study to identify and test the path of “ESG performance-firm innovation capability-financial performance”, which supplements the research on the economic impact of ESG performance and the relevant mechanisms. Hence, this enriches the present studies on the factors influencing financial performance. Thirdly, the estimation of enterprise innovation capability is expanded in this paper. Predominantly, past studies have emphasized the amount of R&D investment in forecasting enterprise innovation capability, but since the disclosure rules of R&D data in China have not been perfected at present, this research paper utilizes the number of applications for design patents, invention patents, and utility model patents in order to predict the innovation capability of firms, which will help to lead to more meaningful research topics. Fourthly, this study uncovers the potential mechanisms by which ESG performance impacts CFP in the context of both financial constraints and firms’ innovation capabilities, offering effective empirical support for comprehending the feasible path for ESG performance to drive the real economy. Fifthly, the heterogeneous effect of ESG performance is explored in terms of CFP based on the different ownership and industry characteristics of corporations. This contribution extends effective suggestions for the sustainable development of enterprises as well as innovative ideas for regulators, in order to formulate differentiated policies.
The remainder of this research paper is organized as follows: Section 2 reviews the extant literature and postulates research hypotheses. Afterward, Section 3 represents the research design. Subsequently, Section 4 empirically tests the influence of ESG performance on CFP. Further, this section not only analyses the intrinsic mechanisms by which ESG performance affects financial performance but also performs the heterogeneity analysis. Finally, Section 5 puts forward the study conclusions and policy implications.

2. Literature Review and Hypotheses

2.1. ESG Performance and Financial Performance

ESG performance comprises three dimensions: environmental, social responsibility, and CG. As far as the association between environmental performance and financial performance is concerned, improving environmental performance and reducing environmental costs exert a substantial effect on the improvement of financial performance. Given the surge in ecological pollution issues, stakeholders have used ecological performance as one of the main criteria for estimating firms’ performance. For instance, Moneva and Ortas (2010) [18] reported that corporate practices such as using cleaner energy sources or reducing greenhouse gas emissions can result in an optimized level of environmental performance, thereby leading to an improvement in financial performance. Parallel to this, Zeng et al. (2020) [19] exhibited that ecological information disclosure activities can make the financial performance of enterprises meet or exceed the expected level of CFP. Using environmental information disclosure practices, enterprises transmit positive information to society and the government, establish a sound image, gain a social reputation, eliminate information asymmetry problems, and realize government funds, resources, and preferential policies, as well as other support [20]. Subsequent to this, Zhang and Ouyang (2021) [21] also confirmed that a better corporate reputation and popularity can indirectly augment CFP. In the meantime, lightly polluting enterprises can improve their financial performance by reporting ecological information due to the lower ecological costs.
In terms of the linkage between CSR and CFP, environmental performance represents one of the vital components of CSR. Aligned with this, Jo et al. (2015) [22] believe that business operators investing in eco-friendly technologies can lower environmental costs in several manners, thereby improving financial performance. Further, their results reveal that lowering ecological costs over a longer time period improves the CFP of European enterprises in the short term based on different factors, whereas North American corporations demonstrate a stronger influence on long-term CFP. Prominently, CSR is significant for the sustainable development of enterprises. However, CSR practices may vary owing to cultural differences between different regions. Reportedly, Vuong (2022) [23] indicated that Japanese corporations adhere to the tradition of mutual benefit as the key to the sustainable development of Japanese enterprises, which is different from the strategy of Western corporations, i.e., oriented towards the interests of shareholders. Consistently, Japanese investors perceive companies with sound environmental and social commitments as safer entities to invest in. Therefore, these business firms can improve their financial performance through sustainable investment. Subsequently, George et al. (2023) [24] revealed that CSR activities in the Indian banking sector exert efforts to cover financial services in different regions, which is beneficial in decreasing the poverty gap. Rational CSR spending assists corporations in improving their financial performance. When corporations employ social responsibility as a competitive tool, it exerts a substantial influence on the long-term CFP of the companies. By studying the emerging economies of Asia, Saeed et al. (2023) [25] pointed out that enterprises that consistently improve their social and ecological responsibility help to expand their market share and uplift customer loyalty, which eventually increases profitability and improves CFP.
The field of CG has emerged in the context of agency conflict. CG motivates the board of directors and management to realize the corporate objectives while mitigating the possible conflicts between principals and agents. Certain scholars have scrutinized the influence of the internal mechanisms of CG on CFP, while other researchers have explored the correlation between CG as a whole and CFP. In developing countries, poor people are predominantly concerned about access to credit. In this context, microfinance firms arose in Bangladesh. Additionally, Iqbal et al. (2019) [26] anticipated the connection between microfinance companies and financial performance in Asia. Their study results highlighted that sound CG serves as the key to the sustainability of microfinance corporations while augmenting the financial profitability of microfinance companies. Given the cultural differences in different regions, some research scholars believe that the independence of the board of directors exerts a negative effect on the CFP [27]. Most researchers argue that board independence in CG mechanisms displays a positive effect on the CFP. Kyere and Ausloos (2021) [28] adopted UK enterprises as a study sample and showed that board independence reduces costs, effectively resolves agency problems, and increases CFP. In the meantime, investors investigate the CG governance mechanism prior to investing since sound CG can enhance a firm’s value. In the same vein, Aldamen et al. (2020) [29] explained that good CG practices, including the independence of the board of directors, significantly minimize information asymmetry. In the event of a financial crisis, firms with a sound internal governance environment have CG mechanisms that mitigate the adverse influences of the financial crisis on the firm and improve CFP. Thereafter, Pekovic and Vogt (2021) [30] hold that the board of directors represents a significant mechanism of CG. Meanwhile, CG acts as an internal mechanism to ensure the quality of socially responsible investment. Hence, the influence of CSR on CFP is influenced by the correlation between it and CG. Based on this, a positive relationship between CSR and CG can support the CFP.
Stakeholder theory emphasizes the interrelationships between stakeholders, who are both creators and receivers of value. Stakeholders are broadly identified as six groups, which include internal stakeholders such as employees and managers, and external stakeholders such as suppliers and customers [31]. Customers are considered to be one of the important stakeholder groups, who will only exchange value if their needs are met [32]. Firms with poor ESG performance reflect their small contribution to the environment and society, and their unethical behaviors (e.g., polluting the environment) may result in stakeholders, such as customers, no longer supporting them. Donaldson, T., and Preston, L. E. (1995) [33] found that stakeholder theory can be categorized into three approaches, which are normative, instrumental, and descriptive approaches. Among them, the normative approach emphasizes that firms should satisfy the needs of different stakeholders. Firms with higher ESG performance show good performance in environmental, social, and corporate governance aspects, and are able to satisfy the intrinsic value of each stakeholder, thus creating a competitive advantage [34]. Considering ESG performance in investment decisions, effective stakeholder management may improve firms’ financial performance [35]. This study proposes relevant hypotheses based on the above theoretical explanations.
Hypothesis 1: 
There exists a positive correlation between ESG performance and CFP.

2.2. Moderating Effect of Financial Constraints on ESG Performance and Financial Performance

Financial constraints are one of the main impediments to the improvement of CFP. Presently, the financial environment in China is still imperfect, and business firms commonly encounter the issue of financial constraints. Likewise, financial constraints make companies subject to certain limitations in terms of financing. The risks borne by enterprises also increase when enterprises experience a high level of financial constraints. Certainly, a high degree of financial constraints may trigger enterprises to employ aggressive financing approaches. Therefore, there is an increase in uncertainty, and the volatility of share price, thus fostering the risk borne by enterprises [36]. The increased risk encountered by corporations reduces the firm’s value while exerting a significant impact on the CFP. Concurrently, the higher the extent of corporate financial constraints, the more difficult it is for enterprises to raise funds from external sources, the cost of financing increases [37], and the internal cash flow of the firm significantly decreases. Cash presents one of the important factors for the development and survival of enterprises, whereas cash shortages may exhibit a strong effect on the financial status of enterprises, possibly triggering a financial crisis.
In the context of ESG performance, corporations with lower ESG ratings bear more financing costs, experience higher information asymmetry, and encounter higher financial constraints [38]. Banos-Caballero et al. (2014) [39] propose that when companies experience information asymmetry, the cost of external financing for the firm increases as the information deficiency causes the market to lower its assessment of the firm. Conversely, when firms display sound ESG performance, their willingness to disclose information is stronger. Explicitly, ESG disclosure is a non-financial disclosure, which can systematically reflect the actual state of enterprise development, and provide creditors such as banks and investors with more information related to the enterprise, in order to ensure that the corporation maintains a strong and transparent association with the stakeholders [40]. In particular, a transparent connection with stakeholders is conducive to reducing information asymmetry, making it convenient for business firms to acquire external financing and alleviate the issue of corporate financial constraints.
At present, China is adopting a green credit policy that provides favorable credit support to firms with good ESG performance and eco-friendly enterprises and restricts loans to environmentally polluting enterprises. Consistently, external constraints are imposed on enterprises, in order to effectively mitigate information asymmetry [41]. At the same time, corporate social reputation and credibility make up one of the key factors that generate business value for corporations. Specifically, firms with sound ESG performance actively participate in social responsibility practices, reduce cash flow volatility, develop sound relationships with stakeholders, and lower default risk. Further, these enterprises improve corporate competitiveness, obtain value recognition from the capital market and the public, and reduce corporate risk.
Signaling theory provides theoretical support for firms to come up with strategies to maintain financial stability and, thus, alleviate the problem of financing constraints. Early signaling theories focused on issues such as dividends, where dividend payment policies acted as a reliable mechanism to help investors assess the value of the borrower, thus reducing information asymmetry problems [42]. Due to the imperfect financial system and information asymmetry between financial institutions and enterprises, SMEs may need to bear additional transaction costs to access capital markets. According to signaling theory, firms send positive signals to emphasize their good financial position, reducing the information asymmetry between financial institutions and firms, reducing the risk of expected losses to financial institutions and, thus, obtain external financing [43]. ESG reporting discloses non-financial information of enterprises, and enterprises with higher ESG performance send out positive signals, which not only reflect their own financial statuses, but also their contributions to the environment, society, and other aspects, effectively reducing information asymmetry and, thus, alleviating financing constraints.
From the viewpoint of stakeholder theory, the enterprise promotes the development of the enterprise, in order to coordinate the interests of various stakeholders. CSR is one of the crucial factors of ESG performance, while the fulfillment of social responsibility has almost become an essential and integral part of the corporate development process. Nevertheless, enterprises can alleviate the financial constraints encountered in the process of development by assuming social responsibility. Meanwhile, diversified means of raising funds can alleviate the financial constraints. Trade credit is a form of indirect financing, and corporate reputation represents one of the key factors in realizing trade credit. Accordingly, Luo et al. (2023) [44] stated that sound ESG performance improves the corporate ability to obtain credit financing. For example, corporations may improve their financial performance by expanding their financing channels through extending trade credit. It is evident that the higher the degree of financial constraints, the more the input of corporate ESG performance shall be reduced, and CFP may not be steadily improved. On this basis, Hypothesis 2 is put forward in this paper.
Hypothesis 2: 
Financial constraints exert a negative moderating influence between ESG performance and financial performance.

2.3. The Mediating Effect of Corporate Innovation on ESG Performance and Corporate Financial Performance

Typically, enterprise green innovation is characterized by high risk, a long cycle, and a large capital investment. Sound ESG ratings of corporations not only take into account the internal situation such as CG, but also the long-term development of the enterprise. Resultantly, financial institutions display an effective comprehension of corporate information, which lessens the information asymmetry issues, while the firms can obtain the funds offered by financial institutions during credit assessment. Concurrently, sound ESG ratings give companies a positive social image and reputation, which lowers the decision-making risk of creditors [2]; therefore, more investors enter the market, thereby producing a positive market influence and reducing the cost of enterprises’ green innovation [45].
CSR is one of the critical elements of ESG performance, and caring for employees is one of the important components of CSR. Certainly, firms with sound ESG performance offer services such as career development, safeguarding of the interests, safety, and security of their employees, and promoting their motivation to innovate, which eventually supports corporate innovation [46]. At the same time, CSR creates surges in investor demand and market value, hence making investors pay due attention to corporate innovation behavior [47].
In the meantime, managers play a vital role in the implementation of corporate innovation. Additionally, ESG ratings encourage companies to develop green innovation strategies. Hull and Rothenberg (2008) [48] established that there is a positive impact on CFP when management innovation considers environmental factors. Environmental innovation not only takes into account the reduction of pollutant emissions but also drives product and process innovation, in order to create more innovative products. This results in enhanced customer satisfaction, an expanded competitive edge, and an improved CFP [49,50]. Establishing consistency of goals through innovative approaches helps maintain a balance between society and the economy [51]. Consistently, a firm investing excessive funds in social innovation shall attract social attention, while the enterprise shall feel substantial pressure from society to fulfill its social commitments. Therefore, business firms need to invest more resources in social development in an innovative manner, in order to improve their efficiency and sustain their market position [52].
In accordance with the resource base view, the competitive advantage of a company is realized through scarce and valuable resources and capabilities. Simultaneously, corporations innovate by investing in R&D practices and utilizing R&D capabilities to attain new resources, thereby gaining a competitive edge, maintaining profitability, and optimizing CFP [48,49,50]. Obviously, the products produced by enterprises with high innovation ability can increase the repeat purchase rate of customers, consequently elevating the CFP. Figure 1 illustrates the path analysis of how ESG performance influences CFP. In line with this, Hypothesis 3 is put forward as follows:
Hypothesis 3: 
Corporate innovation mediates the connection between ESG performance and financial performance.

3. Research Design

3.1. Sample Selection and Data Sources

In this paper, A-share listed companies are selected as the research sample for the time period from 2009 to 2021. A total of 10,426 observations were finally obtained, excluding the financial industry and samples with missing data. On the one hand, ESG data were derived from the Wind Information Financial Terminal; on the other hand, financial data were retrieved from the CSMAR database. The samples with 1% above and below the continuous variables are shrink-tailed, in order to avoid the potential influences of outliers.

3.2. Variable Definitions

3.2.1. Explained/Dependent Variable

Financial performance (ROA). Referring to numerous scholars at home and abroad, there are two main approaches to estimating financial performance in academic circles. The first approach is to forecast financial performance with a single indicator, while the second approach is to choose a variety of indicators and predict them by building a comprehensive indicator system through statistics or knowledge of operations research. Currently, certain local and foreign scholars take market value as the financial performance measurement index, such as Tobin’s Q value. Furthermore, some researchers also take enterprise TFP as an estimation indicator. Further, the ROA approach utilizes the revenue influence created by different types of assets invested in the business process of the enterprise, in order to effectively anticipate the firm’s profitability, thus reflecting the overall development ability of the enterprise, with a highly strong comprehensiveness. Therefore, aligned with Weng and Chen (2017) [53], this paper adopts the ROA to measure CFP. Likewise, the ROE is used as a proxy variable for robustness testing.

3.2.2. Independent Variable

ESG performance (ESG). The CSI ESG rating, which consists of 9 grades from C to AAA, represents an inclusive rating methodology with a wide range of applications. This study draws on Lin, Fu, and Fu (2021) [54], in order to assign ESG ratings of listed companies from 1 to 9, ranging from low to high.

3.2.3. Mediator Variable

Corporate innovation (innovation). Generally, researchers at home and abroad employ R&D input or R&D expenditure as the estimate of innovation capability. In terms of the R&D input, some research scholars incorporate the proportion of net intangible assets to total assets at the end of the period as a measure, since the disclosure rules of R&D data are still not perfect in China [55]. In the context of innovation output estimation, some scholars utilize the number of green invention patent applications as a scaling indicator [56]. This paper refers to [57], in order to scale a corporation’s innovation based on its design patents, invention patent applications, and utility model patents.

3.2.4. Moderating Variable

Financial constraints (SA). There are a variety of approaches to gauge financial constraints. The first approach is to measure SA using a single indicator, such as cash flow [58]. The proposed approach entails certain drawbacks as it does not fully reflect the financing constraint. The second approach is to scale financial constraints by a combination of indicators such as the SA index, the WW index [59], and the KZ index [60]. On the one hand, the WW index is more suitable for capital markets in developed economies; therefore, this indexation is not suitable for the Chinese market. On the other hand, the KZ index consists of cash flow and Tobin’s Q value, which may be endogenous. Meanwhile, the KZ index is composed of Tobin’s Q, cash flow, and other indicators, which may have endogeneity concerns. In this paper, the authors draw on the SA index built by Hadlock and Pierce (2010) [61] with firm size and age as an estimate of financial constraints. Correspondingly, the SA index is developed with external variables such as firm age, which avoids the endogeneity issue triggered by financial indicators.
Specifically, the relevant model, (1), is as follows:
S A = 0.737 × S i z e + 0.043 × S i z e 2 0.040 × A g e
where Size stands for the natural logarithm of the total assets of the firm; Age denotes the operating year of the enterprise. The calculation result is empty when any one of the indicators is empty.

3.2.5. Control Variables

This paper draws on studies such as those of Zhou et al. (2022) [62] and Tan and Zhu (2022) [2], in order to include the following related variables as control variables, namely: total asset growth rate (Growth), equity concentration (Top1), number of board members (Board), gearing ratio (Lev), earnings per share (Eps), cash ratio (Cashflow), firm size (Size), and the number of years the company has been listed (Age). In addition, this paper controls for industry and year-fixed effects, in order to control for the effect of industry and macroeconomic situation on financial performance. The details of the variables are depicted in Table 1.

3.3. Empirical Model

This study uses a two-way fixed effects model controlling for industry and time; this model reduces the bias caused by industry and time characteristics and improves the accuracy of the results [63].
In this study, regression Model (2) is set to test Hypothesis 1 (H1): ESG performance exerts a positive effect on the CFP. Accordingly, the specific model is set as follows:
R O A i , t = β 0 + β 1 E S G i , t + β 2 C o n t r o l s i , t + I n d u s t r y + Y e a r + ε i , t
This paper sets up regression Model (3), in order to test Hypothesis 2 (H2): financial constraints demonstrate a negative moderating effect between ESG performance and CFP. Meanwhile, the specific model is as follows:
R O A i , t = β 0 + β 1 E S G i , t + β 2 S A i , t + β 3 E S G × S A i , t + β 4 C o n t r o l s i , t + I n d u s t r y + Y e a r + ε i , t
In this paper, regression Model (4) is set to test Hypothesis 3 (H3): corporate innovation mediates the correlation between ESG performance and CFP. Consistent with this, the specific model setting is as follows:
R O A i , t = β 0 + β 1 E S G i , t + β 2 I n n o v a t i o n i , t + β 3 C o n t r o l s i , t + I n d u s t r y + Y e a r + ε i , t
where subscripts i and t signify the observation sample and year, respectively. Additionally, C o n t r o l s i , t in regression Models (2) to (4) serve as control variables.

4. Results and Discussion

4.1. Descriptive Statistics and Correlation Matrix

Table 2 displays that the mean value of ESG performance stands at 4.268, with a minimum value of 2 and a maximum value of 6, while the standard deviation is reported to be 0.999. This indicates that there exists a significant difference in terms of the ESG performance between enterprises; further, the overall level of ESG performance of China’s listed enterprises still needs to be improved; the mean value of ROA is documented to be 0.043, with a minimum value of −0.097, a maximum value of 0.197, and the standard deviation of 0.046. This implies that there exist profound differences between enterprises’ financial performance, with certain enterprises displaying losses. Additionally, the net profit stock amounts to $4.3 million for companies with $100 million in total assets. Among the control variables, gearing ratio, equity concentration, number of board members, earnings per share, total asset growth rate, cash ratio, firm size, and the number of years the firm has been on the market differ between enterprises, reflecting that these control variables may be impacted by ESG performance.
Table 3 reflects that the correlation coefficient between ESG performance and ROA stands at 0.121. Further, it is significantly positive at the 1% level of statistical significance, as expected. Moreover, the correlation coefficients between the variables are less than 0.8, thereby indicating that there exists no serious issue of multicollinearity. The regression model is organized for the subsequent analysis.

4.2. Benchmark Effects Regression Analyses

Specifically, Table 4 highlights the outcomes of the benchmark regressions on the influence of ESG performance on CFP. Meanwhile, all regressions control for industry and year-fixed effects. Primarily, Column (1) indicates that the ESG regression coefficients are significantly positive at the 1% level. This reveals that a higher ESG performance results in higher levels of CFP, which is economically significant, as the firm’s net profit/total assets shall increase by 0.001 for every one standard deviation increase in ESG performance (0.999), which is equivalent to nearly 2.6 percent of the sample mean of the variable CFP (0.043). Preliminary empirical evidence is extended for theoretical Hypothesis 1 of this study: ESG performance is positively associated with CFP. Moreover, the findings are also consistent with some previous empirical results [64,65,66]. Good ESG performance of a firm indicates that it engages in ethical behavior, meets the needs of various stakeholders, and sends out positive signals, which in turn promotes customers’ consumption behavior and improves its financial performance. Some scholars’ findings are contrary to this study [34]. However, we believe that these findings are not contradictory to the results of this study. R.M. Ammar Zahid (2023) [34] selected a sample of 620 companies in Western Europe for his study, and his selection of listed companies encompasses a number of European countries and focuses mainly on developed capital markets. The institutional context of the subjects of this study as well as the number of countries involved varies, so we do not consider these differences in results to be contradictory.

4.3. Robustness Test and Endogeneity Problem

In the previous paper, a fixed effects model was adopted to carry out an empirical analysis of how ESG performance impacts the CFP of a company. However, although the study controlled for firm value, size, etc., it may still not have included all the characteristics of the enterprise; thus, it presents issues such as endogeneity. This research paper adopts methods such as lag and replacement variables to perform robustness tests, in order to further verify the previous hypotheses.

4.3.1. Robustness Test: Replacing the Independent Variable

Explicitly, the model is re-estimated by replacing ROA with ROE as a measure of CFP, with all regressions controlling for enterprise-level idiosyncrasies, as well as industry and year-fixed effects. Subsequently, Column (2) of Table 4 illustrates that the ESG performance coefficient stands at 0.002, with a statistical significance at the 1% level. This suggests that an increment in the ESG performance of enterprises results in a mean increase in the CFP of nearly 0.2%. Hence, the conclusion is in line with Hypothesis 1 (H1).

4.3.2. Endogeneity Problem Handling: Lag Period Regression

Since the association between ESG performance and CFP has the potential to trigger endogeneity concerns due to reverse causation, this research study lags ESG performance and control variables by one period and re-calculates the model. Afterward, Column (6) of Table 4 depicts that the ESG performance coefficient is recorded to be 0.002, which is significant at the 1% level. This implies that a higher ESG performance makes CFP nearly 0.2% higher on average. Accordingly, this conclusion is aligned with Hypothesis 1 (H1).

4.3.3. Endogeneity Problem Handling: Instrumental Variable

In this paper, two-stage least squares (2SLS) is used to mitigate the endogeneity problem. In terms of correlation, the ESG mean of the same industry in the same year affects the ESG performance of a particular listed corporate. In terms of exogeneity, ESG mean of the same industry in the same year does not directly affect CFP. Therefore, we use the ESG mean of the same industry in the same year of CSI (ESGmean) as an instrumental variable. The results of the first stage regression in column (3) of Table 4 show that the regression coefficient of ESGmean is 0.758, which is significant at the 1% level. Kleibergen-Paap rk Wald F = 235.056, which is greater than the 10% maximal IV size (16.38) in the Stock-Yogo weak ID test critical values. The original hypothesis of “instrumental variables are weakly identified” is rejected at a high level, indicating that there is no weak instrumental variable problem. The results of the second stage regression in column (4) indicate that the estimated coefficient of ESG is 0.006, which is significant at the 1% level. Compared to the coefficient of 0.001 for ESG in the benchmark regression, the uplift effect of ESG on CFP is more significant after controlling for potential endogeneity using instrumental variables, and the findings of this study are more robust.

4.4. Analysis of Mechanisms

4.4.1. Moderating Effect of Financial Constraints

Column (1) of Table 5 presents the baseline regression analyses of the degree of the effect of ESG performance on CFP. Concurrently, Table 5 also reports findings related to ESG performance, corporate innovation capability, financing constraints, and financial performance tests. Thereafter, Column (2) examines the linkage between financial performance ROA and financing constraint (SA). Reportedly, the regression outcomes depict that the financing constraint coefficient stands at −0.018, which is significant at the 1% level of significance. This shows that the financing constraints exert a negative effect on CFP. Subsequent to this, Column (3) exhibits the introduction of the interaction term between ESG performance and financing constraints into the regression model of ESG performance and CFP. The relevant results reveal that the coefficient of ESG performance is documented to be 0.001, with a statistical significance at the 1% level; further, the coefficient of the interaction term, ESG×SA, is −0.004, with a 1% level of statistical significance, thereby suggesting that the financing constraints exert a negative moderating influence. As a result, Hypothesis 2 (H2) holds in this study. This result is consistent with previous findings [67]. For firms with low ESG performance, it sends a negative signal, that information asymmetry between firms and financial institutions or investors leads to financing constraints, which may further inhibit financial performance improvement.

4.4.2. Mediating Effect of Corporate Innovation

Notably, the ESG performance coefficient in Column (4) of Table 5 is recorded to be 0.207. Furthermore, it is significantly positive at the 1% level, thus reflecting that ESG performance contributes to the firm’s innovation capability. As is evident from Column (5), once both ESG performance and the firm’s innovation capability are introduced into the regression model of CFP, the coefficient of ESG performance stands at 0.001 and the coefficient of the firm’s innovation capability is 0.001, with a significant positive 1% level of statistical significance. Accordingly, corporate innovation plays a mediating role in the driving impact of ESG performance on CFP; therefore, Hypothesis 3 (H3) is validated in this paper. This means that ESG performance manifests itself in the form of a positive image of the firm, where the firm gains the trust of stakeholders such as investors, and, thus, the firm gains more resources to invest in corporate innovation [68]. Corporate innovation is a driver of sustainable business development, which helps companies allocate resources more rationally and reduce costs, thus gaining a competitive advantage to improve financial performance [69].

4.5. Heterogeneity Analysis

4.5.1. Enterprise Ownership Heterogeneity Test

Prior studies illuminate that the financing constraints experienced by enterprises in the Chinese market environment vary based on the nature of property rights. The government favors SOEs over non-SOEs in terms of financing, and SOEs are more inclined to receive direct financial subsidies from the state when faced with operational difficulties [70]. In this study, the researchers explore the impact of financing constraints on the CFP of ESG performance in corporations with different ownership properties by grouping them in accordance with their nature of ownership. Table 6 shows the specific grouping regression results. Meanwhile, Columns (1) and (2) reflect that the ESG performance of companies with both ownership natures exerts an enhancing influence on CFP. On the other hand, the ESG performance coefficient of SOEs stands at 0.001, which is significant at the 5% level, with a low level of significance. On the other hand, the ESG performance coefficient of non-SOEs is documented to be 0.002, which is significant at a 1% level and is 0.001 higher as compared to the ESG performance coefficient of SOEs, and the ESG performance of non-SOEs plays a more pronounced role in enhancing CFP. Certainly, the significance of the aforesaid difference is validated by the empirical p-value in terms of the difference test derived using the Bootstrap method, which is significant at a 1% level of significance. Thereafter, Columns (3) and (4) establish that the coefficients of financing constraints (SA) are both significant at the 1% level of statistical significance. The outcomes of the test confirm that financing constraints demonstrate a negative impact on the CFP of both ownership natures. Subsequently, the results in Columns (5) and (6) display that the interaction term ESG×SA for enterprises with both ownership natures is significant at the 1% and 5% levels, respectively. Profoundly, financing constraints play a negative moderating role in the impact of ESG performance on CFP for both SOEs and non-SOEs. Using the Bootstrap method, the significance of the aforementioned differences is confirmed by the empirical p-value in the difference test, which is significant at the 5% level. The comparison of Columns (1) and (5) shows that the coefficient of the ESG performance of SOEs is nearly 0.001. Furthermore, a comparison of Columns (2) and (6) suggests that the coefficient of the ESG performance of non-SOEs decreases from 0.002 to 0.001. Specifically, the test results reveal that financing constraints inhibit CFP improvement in both SOEs and non-SOEs. Furthermore, the negative moderating effect of financing constraints on the impact of ESG performance on CFP is more significant in non-SOEs. The effect of ESG performance on CFP improvement is significantly weaker when non-SOEs experience financing constraints.

4.5.2. Industry Characteristics

Notably, the environment is one of the significant factors in computing ESG performance, and heavily polluting enterprises violate the theory of sustainable development. In this study, enterprises such as the thermal power industry are categorized as heavy polluters and assigned a value of 1, whereas other non-heavy polluters are assigned a value of 0 based on the standard of the environmental protection department. The effect of ESG performance on CFP with different industry characteristics is explored in this study. Correspondingly, Table 7 represents the regression results, which differ significantly between the two groups. Primarily, the ESG performance coefficient of companies in the non-heavily polluting group is 0.002, with a 1% level of significance. Further, the coefficient of ESG performance for the heavy-polluting enterprises group is reportedly 0.001, but insignificant. Meanwhile, the results confirm that there is no correlation between firms’ ESG performance and CFP in the heavy-polluting firms’ group. Corporate ESG performance promotes CFP in the non-heavily polluting enterprise group. For certain, heavily polluting enterprises need to invest in ESG performance at a greater cost; therefore, operators are reluctant to invest in ESG, thereby leading to the poorer ESG performance of heavily polluting companies. Evidently, the ESG performance of heavy-polluting firms cannot effectively assist the improvement of CFP. Moreover, non-heavily polluting firms pay due attention to ecological protection in the operation process and possess sound corporate reputations. Therefore, ESG performance plays a significant role in improving financial performance.

5. Conclusions and Policy Implications

5.1. Conclusions

Using A-share listed enterprises spanning from 2009 to 2021, this study investigates the relationship between ESG performance and CFP as well as the corresponding influential mechanism. The study draws the following major conclusions.
Sound ESG performance improves corporate financial performance. Additionally, ESG performance lags by one period, and its contribution to CFP is more pronounced. This may be the result of effective ESG performance in the short term, which promptly establishes a sound reputation for the firm. Presently, information dissemination is rapid, which assists investors in making rapid decisions in a short time period, while promoting improvement in the CFP. Concurrently, there exists a lag effect, in that CFP does not significantly improve when enterprises invest substantial funds in ESG performance in the short term.
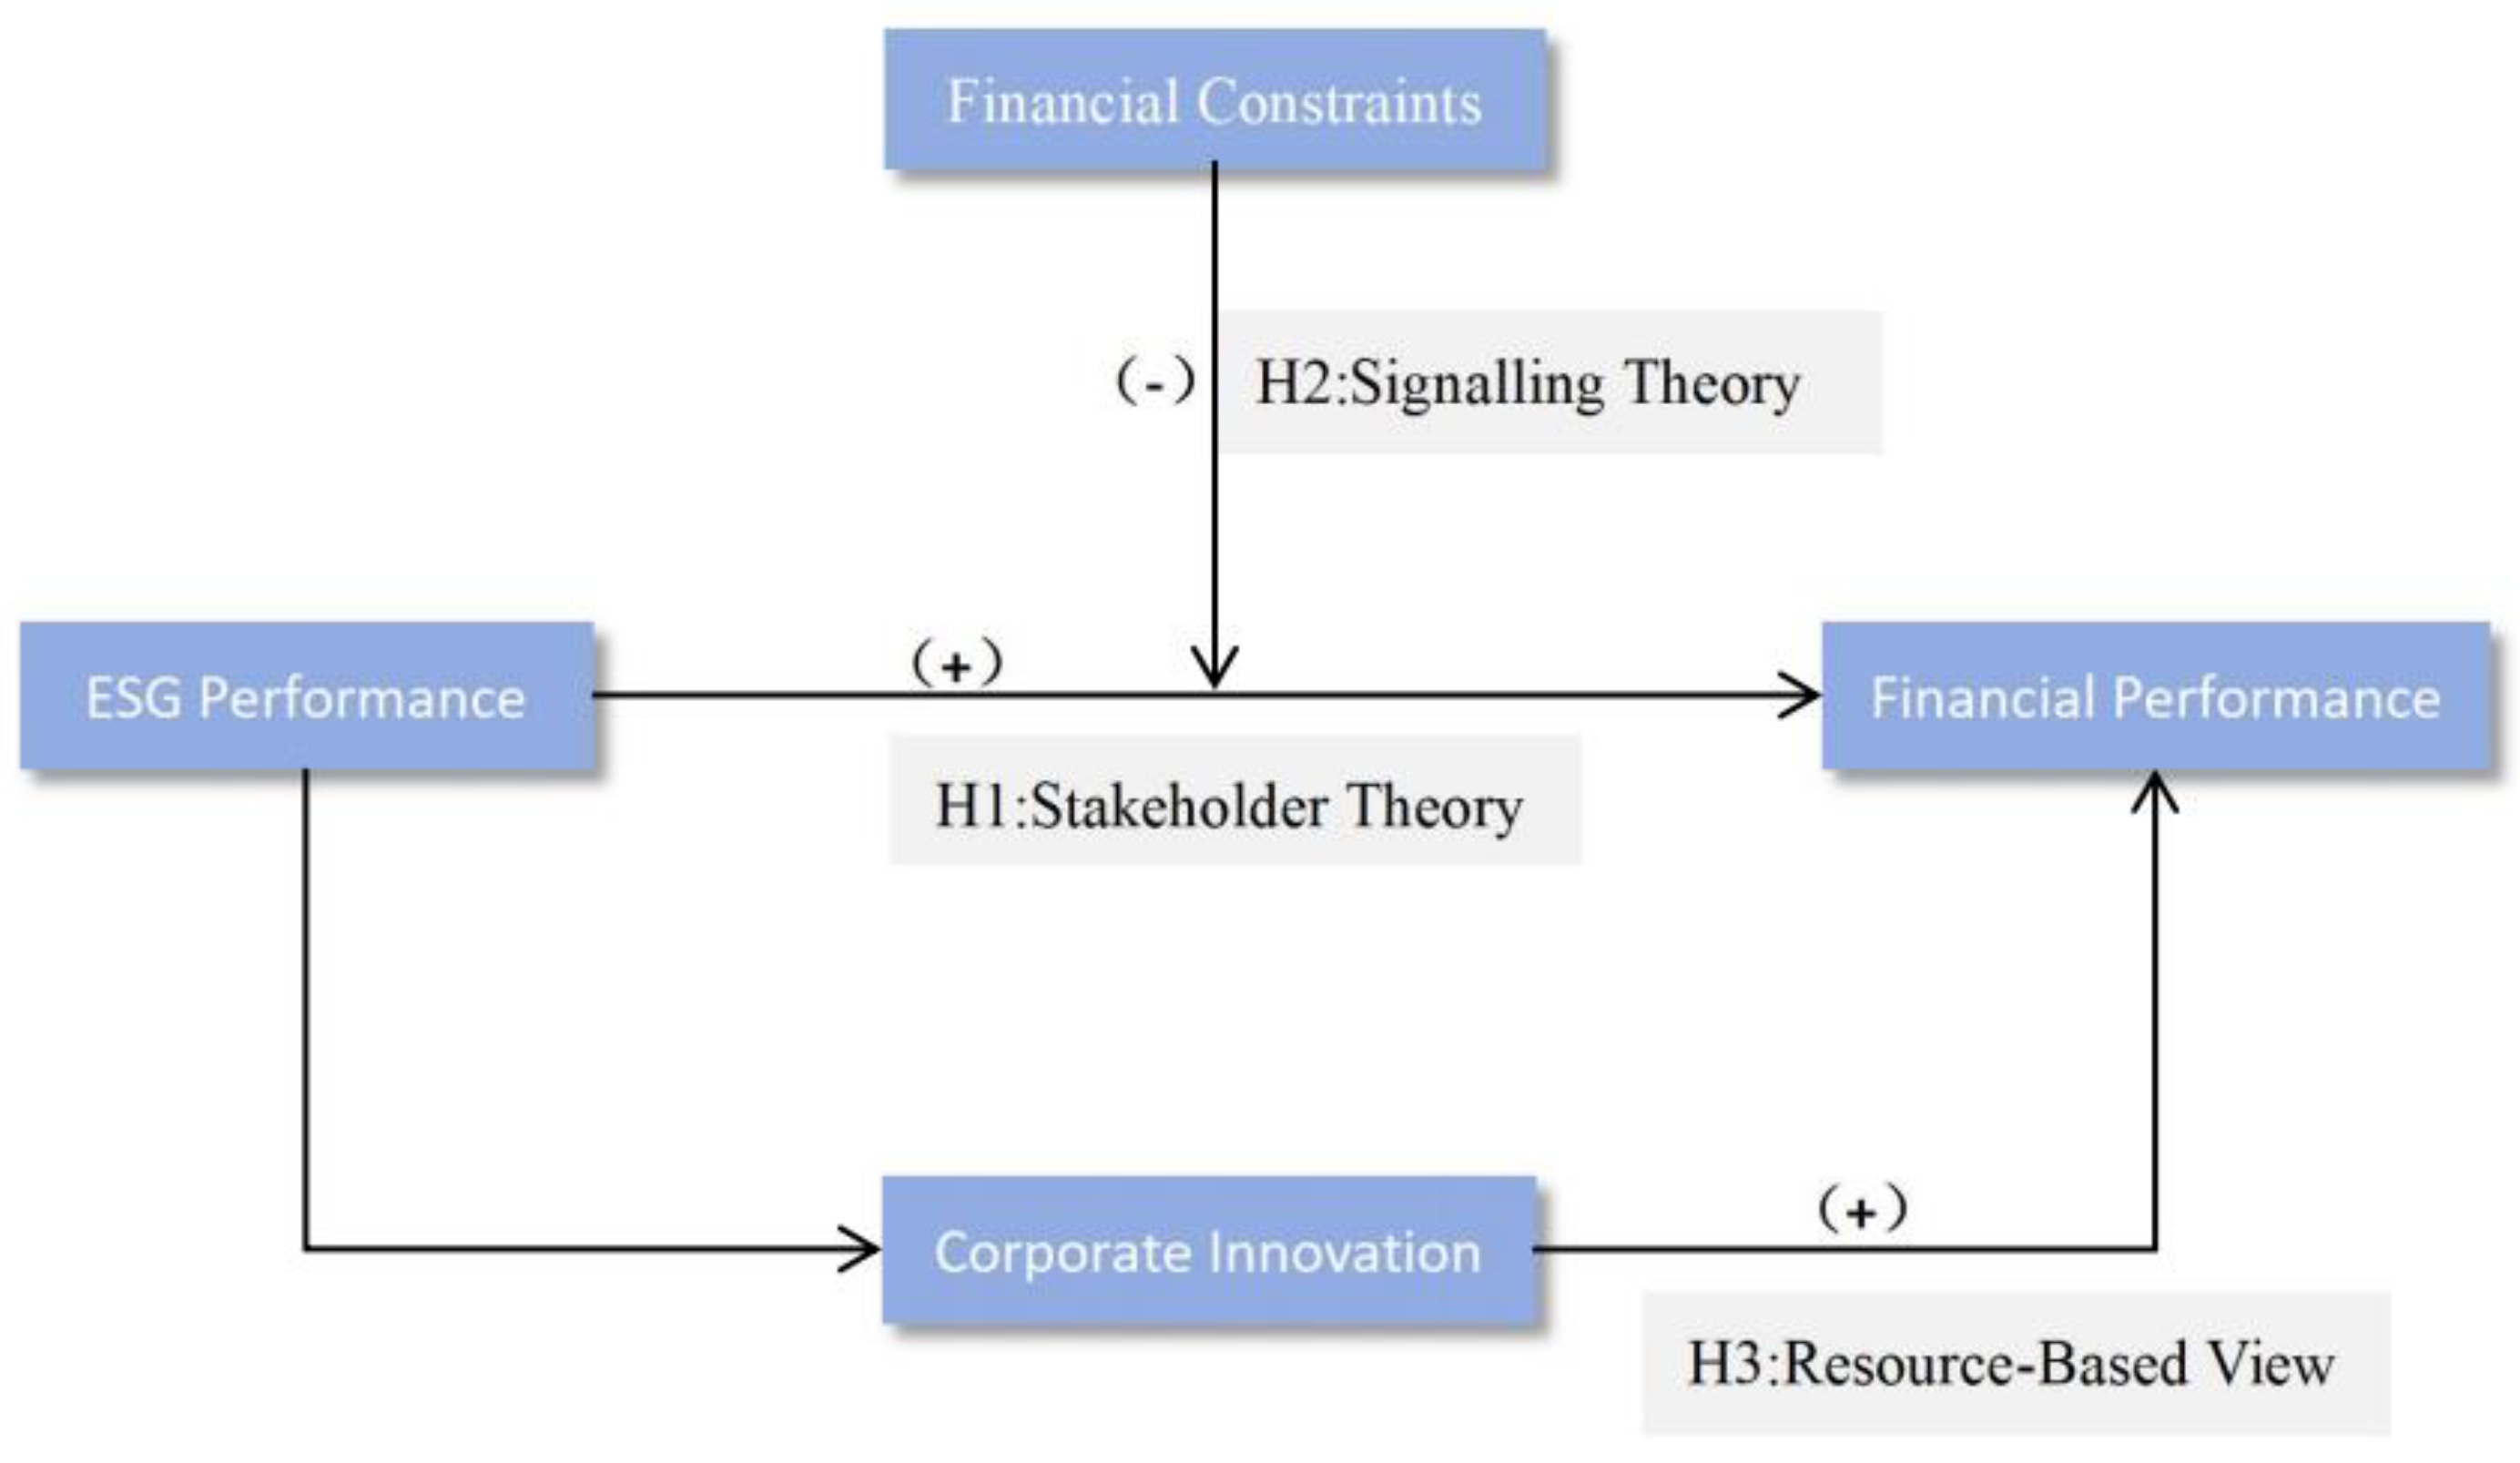
ESG performance influences CFP mainly through two different mechanisms, namely: alleviating the financing constraints of listed enterprises and improving the innovation ability of corporations. In the meantime, financing constraints have a negative moderating influence between ESG performance and CFP. Further, this corporate innovation ability plays a partial mediating effect between ESG performance and CFP. Noticeably, ESG performance transmits sound social image information to stakeholders, which assists in supporting trust and resolving principal–agent conflicts between the two parties of interest, thereby improving CFP.
Heterogeneity analysis confirms that financing constraints demonstrate a more profound inhibitory impact on financial performance improvement in NRHEs. In non-heavily polluting firms, corporate ESG performance exerts a significant effect on CFP improvement. However, ESG performance fails to enhance financial performance in heavily polluting firms.

5.2. Policy Implications

Government agencies should improve the ESG performance evaluation system. Compared with Western developed countries, China’s ESG disclosure system is not yet comprehensive, and the quality of ESG disclosure varies. Due to the imperfection of the ESG disclosure system, the ESG information reported by some enterprises may be false. We also recommend that third-party ESG rating agencies harmonize their evaluation criteria. The environmental and other problems that arise in heavily polluting companies tend to negatively affect their reputation and do not promote the improvement of their financial performance. Therefore, government agencies should make corresponding penalties for enterprises with poor ESG performance and put forward corresponding rectification suggestions, and for enterprises with good ESG performance, government agencies should make incentives and endeavor to improve the ESG performance of enterprises. Currently, our financial system is not perfect. SMEs face financing constraints due to information asymmetry problems, and may have to bear additional costs, which may also make it more difficult for SMEs to access the capital market [43]. Therefore, we recommend improving the relevant laws.

5.3. Practical Managerial Implications

At the corporate level, the benefits of ESG investment exceed the cost of investment, and non-SOEs should augment their ESG investment. Eventually, the sound ESG performance of enterprises improves their own images. Therefore, enterprises should not only expand diversified financing channels to alleviate financing constraints but also develop trust in testing times. On the same note, enterprise managers should take improving ESG performance as the strategic goal of the enterprise, improve environmental awareness, effectively realize energy saving and emission reduction, increase investment in innovation, and improve the innovation ability of the enterprise, in order to ensure that the CFP can be significantly improved over the course of time. Similarly, strengthening CSR and information disclosure is not only needed for enterprises to integrate external and internal resources, in order to facilitate high-quality development, but is also a response to the growing demand of the public for sustainable development. Moreover, enterprises should set up a long-term goal. Corporate innovation can improve corporate reputations and images and create greater corporate value, but the process of innovation is long. Therefore, on the one hand, in the short term, a good ESG performance improves financial performance, but on the other hand, over time, a good ESG performance improves financial performance more significantly.
At the investor level, prior to making investment decisions, investors should take into account the ESG performance of firms while paying due attention to their CFP. From the perspective of sustainable development, investors present substantial external supervisors and governors who promote listed corporations to not only actively fulfill their social responsibilities but also improve CG.

5.4. Limitations and Future Research

There are some limitations to our study, but these limitations may also provide some insights for future research. Firstly, there are limitations in the selection of variables in this study. We used firm size and age to construct a model to calculate the financing constraint index, which was earlier derived by scholars based on a sample of U.S. firms under the assumption that younger firms may be more constrained, as well as that a firm’s poor track record could be assessed by selecting size and age as variables that translate into a reluctance on the part of banks to grant credit [71]. Therefore, we believe that the selection of a sample of Chinese firms may be affected by these assumptions. In future research, we will try to measure financing constraints by constructing credit rating scores using multiple indicators. Second, there are limitations in exploring the mechanisms of influence. This study only explores the mechanism of the external factors of corporate finance and innovation in the relationship between ESG performance and financial performance. Attempts can be made in future studies to explore whether executives within a firm have an impact on ESG performance and financial performance. Finally, the research object of this study only involves China; in the future, we can try to study other emerging economies to provide more of a basis for studying the impact of ESG performance on corporate sustainability.

Author Contributions

Conceptualization, methodology, N.Z.; investigation, data curation, writing—original draft preparation, Y.X. All authors have read and agreed to the published version of the manuscript.

Funding

This research was funded by the National Social Science Foundation of China, grant number 20BGL099.

Institutional Review Board Statement

Not Applicable.

Informed Consent Statement

Not Applicable.

Data Availability Statement

Restrictions apply to the availability of these data. Data were obtained from CSMAR;CSI and are available from the authors with the permission of CSMAR;CSI.

Acknowledgments

We thank the anonymous reviewers’ and editors’ suggestions on revision, which were very important for the improvement of the paper.

Conflicts of Interest

The authors declare no conflicts of interest.

Abbreviations

AcronymsExplanation
ESGEnvironmental, Social, and Governance
CFPCorporate financial performance
SOEsState-owned enterprises
non-SOEsNon-state-owned enterprises
CGCorporate governance
R&DResearch and Development
CSRCorporate Social Responsibility
CSMARChina Stock Market & Accounting Research Database
TFPTotal Factor Productivity
CSIChina Securities Index
CSRCChina Securities Regulatory Commission

References

  1. Lokuwaduge, C.S.D.S.; Heenetigala, K. Integrating Environmental, Social and Governance (ESG) Disclosure for a Sustainable Development: An Australian Study. Bus. Strategy Environ. 2017, 26, 438–450. [Google Scholar] [CrossRef]
  2. Tan, Y.F.; Zhu, Z.H. The effect of ESG rating events on corporate green innovation in China: The mediating role of financial constraints and managers’ environmental awareness. Technol. Soc. 2022, 68, 101906. [Google Scholar] [CrossRef]
  3. Huang, S. The effects of digital finance and financial constraint on financial performance: Firm-level evidence from China’s new energy enterprises. Energy Econ. 2006, 2022, 112. [Google Scholar]
  4. Gabor, D.; Brooks, S. The digital revolution in financial inclusion: International development in the fintech era. New Political Econ. 2017, 22, 423–436. [Google Scholar] [CrossRef]
  5. Long, H.; Feng, G.F.; Chang, C.P. How does ESG performance promote corporate green innovation? Econ. Change Restruct. 2023, 56, 2889–2913. [Google Scholar] [CrossRef]
  6. Li, J.; Li, S. Environmental protection tax, corporate ESG performance, and green technological innovation. Front. Environ. Sci. 2022, 10, 982132. [Google Scholar] [CrossRef]
  7. Zhang, C.; Jin, S. What drives sustainable development of enterprises? Focusing on ESG management and green technology innovation. Sustainability 2022, 14, 11695. [Google Scholar] [CrossRef]
  8. Zahid, R.A.; Khan, M.K.; Anwar, W.; Maqsood, U.S. The role of audit quality in the ESG-corporate financial performance nexus: Empirical evidence from Western European companies. Borsa Istanb. Rev. 2022, 22, S200–S212. [Google Scholar] [CrossRef]
  9. Agarwala, N.; Jana, S.; Sahu, T.N. ESG disclosures and corporate performance: A non-linear and disaggregated approach. J. Clean. Prod. 2024, 437, 140517. [Google Scholar] [CrossRef]
  10. Alareeni, B.A.; Hamdan, A. ESG impact on performance of US S&P 500-listed firms. Corp. Gov. Int. J. Bus. Soc. 2020, 20, 1409–1428. [Google Scholar]
  11. Bansal, P.; Gao, J.; Qureshi, I. The extensiveness of corporate social and environmental commitment across firms over time. Organ. Stud. 2014, 35, 949–966. [Google Scholar] [CrossRef]
  12. Bhaskaran, R.K.; Ting, I.W.K.; Sukumaran, S.K.; Sumod, S.D. Environmental, social and governance initiatives and wealth creation for firms: An empirical examination. Manag. Decis. Econ. 2020, 41, 710–729. [Google Scholar] [CrossRef]
  13. Li, D.; Zhao, Y.; Sun, Y.; Yin, D. Corporate environmental performance, environmental information disclosure, and financial performance: Evidence from China. Hum. Ecol. Risk Assess. Int. J. 2017, 23, 323–339. [Google Scholar] [CrossRef]
  14. Jiang, F.; Jiang, Z.; Kim, K.A. Capital markets, financial institutions, and corporate finance in China. J. Corp. Financ. 2020, 63, 101309. [Google Scholar] [CrossRef]
  15. Ding, Q.; Huang, J.; Chen, J. Does digital finance matter for corporate green investment? Evidence from heavily polluting industries in China. Energy Econ. 2023, 117, 106476. [Google Scholar] [CrossRef]
  16. Baker, E.D.; Boulton, T.J.; Braga-Alves, M.V.; Morey, M.R. ESG government risk and international IPO underpricing. J. Corp. Financ. 2021, 67, 101913. [Google Scholar] [CrossRef]
  17. Larcker, D.F.; Watts, E.M. Where’s the greenium? J. Account. Econ. 2020, 69, 101312. [Google Scholar] [CrossRef]
  18. Moneva, J.M.; Ortas, E. Corporate environmental and financial performance: A multivariate approach. Ind. Manag. Data Syst. 2010, 110, 193–210. [Google Scholar] [CrossRef]
  19. Zeng, Y.; Gulzar, M.A.; Wang, Z.; Zhao, X. The effect of expected financial performance on corporate environmental responsibility disclosure: Evidence from China. Environ. Sci. Pollut. Res. 2020, 27, 37946–37962. [Google Scholar] [CrossRef] [PubMed]
  20. Liu, Y.; Xi, B.; Wang, G. The effect of corporate environmental responsibility on financial performance-based on Chinese listed companies. Environ. Sci. Pollut. Res. 2021, 28, 7840–7853. [Google Scholar] [CrossRef] [PubMed]
  21. Zhang, Y.; Ouyang, Z. Doing well by doing good: How corporate environmental responsibility influences corporate financial performance. Corp. Soc. Responsib. Environ. Manag. 2021, 28, 54–63. [Google Scholar] [CrossRef]
  22. Kim, H.; Park, K. Corporate Environmental Responsibility and Firm Performance in the Financial Services Sector. J. Bus. Ethics 2015, 131, 257–284. [Google Scholar]
  23. Vuong, N.B. Investor sentiment, corporate social responsibility, and financial performance: Evidence from Japanese companies. Borsa Istanb. Rev. 2022, 22, 911–924. [Google Scholar] [CrossRef]
  24. George, A.K.; Kayal, P.; Maiti, M. Nexus of Corporate Social Responsibility Expenditure (CSR) and financial performance: Indian banks. Q. Rev. Econ. Financ. 2023, 90, 190–200. [Google Scholar] [CrossRef]
  25. Saeed, A.; Alnori, F.; Yaqoob, G. Corporate social responsibility, industry concentration, and firm performance: Evidence from emerging Asian economies. Res. Int. Bus. Financ. 2023, 64, 101864. [Google Scholar] [CrossRef]
  26. Iqbal, S.; Nawaz, A.; Ehsan, S. Financial performance and corporate governance in microfinance: Evidence from Asia. J. Asian Econ. 2019, 60, 1–13. [Google Scholar] [CrossRef]
  27. Peng, H.; Zhang, J.; Zhong, S.; Li, P. Corporate governance, technical efficiency and financial performance: Evidence from Chinese listed tourism firms. J. Hosp. Tour. Manag. 2021, 48, 163–173. [Google Scholar] [CrossRef]
  28. Kyere, M.; Ausloos, M. Corporate governance and firms financial performance in the United Kingdom. Int. J. Financ. Econ. 2021, 26, 1871–1885. [Google Scholar] [CrossRef]
  29. Aldamen, H.; Duncan, K.; Kelly, S.; McNamara, R. Corporate governance and family firm performance during the Global Financial Crisis. Account. Financ. 2020, 60, 1673–1701. [Google Scholar] [CrossRef]
  30. Pekovic, S.; Vogt, S. The fit between corporate social responsibility and corporate governance: The effect on a firm’s financial performance. Rev. Manag. Sci. 2021, 15, 1095–1125. [Google Scholar] [CrossRef]
  31. Edward Freeman, R. Managing for stakeholders: Trade-offs or value creation. J. Bus. Ethics 2010, 96 (Suppl. S1), 7–9. [Google Scholar] [CrossRef]
  32. Freudenreich, B.; Lüdeke-Freund, F.; Schaltegger, S. A stakeholder theory perspective on business models: Value creation for sustainability. J. Bus. Ethics 2020, 166, 3–18. [Google Scholar] [CrossRef]
  33. Donaldson, T.; Preston, L.E. The stakeholder theory of the corporation: Concepts, evidence, and implications. Acad. Manag. Rev. 1995, 20, 65–91. [Google Scholar] [CrossRef]
  34. Rahman, H.U.; Zahid, M.; Al-Faryan, M.A.S. ESG and firm performance: The rarely explored moderation of sustainability strategy and top management commitment. J. Clean. Prod. 2023, 404, 136859. [Google Scholar] [CrossRef]
  35. Gao, J.; Luo, C.; Xu, H.; Shi, G. How does boardroom diversity influence the relationship between ESG and firm financial performance? Int. Rev. Econ. Financ. 2024, 89, 713–730. [Google Scholar]
  36. He, G.; Liu, Y.; Chen, F. Research on the effect of environment, society, and governance (ESG) on firm risk: An explanation from a financial constraints perspective. Financ. Res. Lett. 2023, 58, 104038. [Google Scholar] [CrossRef]
  37. Bai, X.; Han, J.; Ma, Y.; Zhang, W. ESG performance, institutional investors’ preference and financial constraints: Empirical evidence from China. Borsa Istanb. Rev. 2022, 22, S157–S168. [Google Scholar] [CrossRef]
  38. Luo, D. ESG, liquidity, and stock returns. J. Int. Financ. Mark. Inst. Money 2022, 78, 101526. [Google Scholar] [CrossRef]
  39. Banos-Caballero, S.; Garcia-Teruel, P.J.; Martinez-Solano, P. Working capital management, corporate performance, and financial constraints. J. Bus. Res. 2014, 67, 332–338. [Google Scholar] [CrossRef]
  40. Srivastava, J.; Sampath, A.; Gopalakrishnan, B. Is ESG the key to unlock debt financing during the COVID-19 pandemic? international evidence. Financ. Res. Lett. 2022, 49, 103125. [Google Scholar] [CrossRef]
  41. Lei, N.; Miao, Q.; Yao, X. Does the implementation of green credit policy improve the ESG performance of enterprises? Evidence from a quasi- natural experiment in China. Econ. Model. 2023, 127, 106478. [Google Scholar] [CrossRef]
  42. Miller, M.H.; Modigliani, F. Dividend policy, growth, and the valuation of shares. J. Bus. 1961, 34, 411–433. [Google Scholar] [CrossRef]
  43. Falavigna, G.; Ippoliti, R. SMEs and dividend payout policy in case of poor legal environment. J. Small Bus. Manag. 2022, 1–33. [Google Scholar] [CrossRef]
  44. Luo, C.; Wei, D.; He, F. Corporate ESG performance and trade credit financing-Evidence from China. Int. Rev. Econ. Financ. 2023, 85, 337–351. [Google Scholar] [CrossRef]
  45. Shi, Q.; Chen, G.; Huang, D. Environmental cooperation system, ESG performance and corporate green innovation: Empirical evidence from China. Front. Psychol. 2023, 14, 1096419. [Google Scholar]
  46. Lian, Y.; Li, Y.; Cao, H. How does corporate ESG performance affect sustainable development: A green innovation perspective. Front. Environ. Sci. 2023, 11, 1170582. [Google Scholar] [CrossRef]
  47. Pang, W. The effect of digital inclusive finance on corporate ESG performance: Based on the perspective of corporate green technology innovation. Environ. Sci. Pollut. Res. 2023, 30, 65314–65327. [Google Scholar]
  48. Hull, C.E.; Rothenberg, S. Firm performance: The interactions of corporate social performance with innovation and industry differentiation. Strateg. Manag. J. 2008, 29, 781–789. [Google Scholar] [CrossRef]
  49. Busch, T.; Schnippering, M. Corporate social and financial performance: Revisiting the role of innovation. Corp. Soc. Responsib. Environ. Manag. 2022, 29, 635–645. [Google Scholar] [CrossRef]
  50. Liao, Z. Corporate culture, environmental innovation and financial performance. Bus. Strategy Environ. 2018, 27, 1368–1375. [Google Scholar] [CrossRef]
  51. Cegarra-Navarro, J.-G.; Reverte, C.; Gomez-Melero, E.; Wensley, A.K.P. Linking social and economic responsibilities with financial performance: The role of innovation. Eur. Manag. J. 2016, 34, 530–539. [Google Scholar] [CrossRef]
  52. Alonso-Martinez, D.; Gonzalez-Alvarez, N.; Nieto, M. The influence of financial performance on corporate social innovation. Corp. Soc. Responsib. Environ. Manag. 2019, 26, 859–871. [Google Scholar] [CrossRef]
  53. Weng, P.-S.; Chen, W.-Y. Doing good or choosing well? Corporate reputation, CEO reputation, and corporate financial performance. N. Am. J. Econ. Financ. 2017, 39, 223–240. [Google Scholar] [CrossRef]
  54. Lin, Y.; Fu, X.; Fu, X. Varieties in state capitalism and corporate innovation: Evidence from an emerging economy. J. Corp. Financ. 2021, 67, 101919. [Google Scholar] [CrossRef]
  55. Liu, Y.; Liu, J.; Zhang, L. Enterprise financialization and R&D innovation: A case study of listed companies in China. Electron. Res. Arch. 2023, 31, 2447–2471. [Google Scholar]
  56. Lian, G.; Xu, A.; Zhu, Y. Substantive green innovation or symbolic green innovation? The effect of ER on enterprise green innovation based on the dual moderating effects. J. Innov. Knowl. 2022, 7, 100203. [Google Scholar] [CrossRef]
  57. Liu, M.; Li, C.; Wang, S.; Li, Q. Digital transformation, risk-taking, and innovation: Evidence from data on listed enterprises in China. J. Innov. Knowl. 2023, 8, 100332. [Google Scholar] [CrossRef]
  58. Fisman, R.; Love, I. Financial dependence and growth revisited. J. Eur. Econ. Assoc. 2007, 5, 470–479. [Google Scholar] [CrossRef]
  59. Whited, T.M.; Wu, G.J. Financial constraints risk. Rev. Financ. Stud. 2006, 19, 531–559. [Google Scholar] [CrossRef]
  60. Kaplan, S.N.; Zingales, L. Do investment-cash flow sensitivities provide useful measures of financial constraints? Q. J. Econ. 1997, 112, 169–215. [Google Scholar] [CrossRef]
  61. Hadlock, C.J.; Pierce, J.R. New Evidence on Measuring Financial Constraints: Moving Beyond the KZ Index. Rev. Financ. Stud. 2010, 23, 1909–1940. [Google Scholar] [CrossRef]
  62. Zhou, G.; Liu, L.; Luo, S. Sustainable development, ESG performance and company market value: Mediating effect of financial performance. Bus. Strategy Environ. 2022, 31, 3371–3387. [Google Scholar] [CrossRef]
  63. Wang, H.; Zhang, Y.; Dagestani, A.A.; Qing, L. Effect of ESG Performance on Corporate Green Technology Innovation: The Mediating Role of Financial Constraints and Digital Transformation. Singap. Econ. Rev. 2024, 1–26. [Google Scholar] [CrossRef]
  64. Chen, S.; Song, Y.; Gao, P. Environmental, social, and governance (ESG) performance and financial outcomes: Analyzing the effect of ESG on financial performance. J. Environ. Manag. 2023, 345, 118829. [Google Scholar] [CrossRef] [PubMed]
  65. Naeem, N.; Cankaya, S.; Bildik, R. Does ESG performance affect the financial performance of environmentally sensitive industries? A comparison between emerging and developed markets. Borsa Istanb. Rev. 2022, 22, S128–S140. [Google Scholar] [CrossRef]
  66. Zhao, C.; Guo, Y.; Yuan, J.; Wu, M.; Li, D.; Zhou, Y.; Kang, J. ESG and corporate financial performance: Empirical evidence from China’s listed power generation companies. Sustainability 2018, 10, 2607. [Google Scholar] [CrossRef]
  67. Zhang, D.; Wang, C.; Dong, Y. How does firm ESG performance impact financial constraints? An experimental exploration of the COVID-19 pandemic. Eur. J. Dev. Res. 2023, 35, 219–239. [Google Scholar] [CrossRef] [PubMed]
  68. Zhang, H.; Lai, J.; Jie, S. Quantity and quality: The impact of environmental, social, and governance (ESG) performance on corporate green innovation. J. Environ. Manag. 2024, 354, 120272. [Google Scholar] [CrossRef]
  69. Farza, K.; Ftiti, Z.; Hlioui, Z.; Louhichi, W.; Omri, A. Does it pay to go green? The environmental innovation effect on corporate financial performance. J. Environ. Manag. 2021, 300, 113695. [Google Scholar] [CrossRef] [PubMed]
  70. Ying, S. Does Improved Business Environment Improve Business Performance?-Empirical Evidence Based on A-Share Listed Companies From 2008 to 2020 in China. J. Hohai Univ. (Philos. Soc. Sci.) 2022, 24, 121–128+132. [Google Scholar]
  71. Bottazzi, G.; Secchi, A.; Tamagni, F. Financial constraints and firm dynamics. Small Bus. Econ. 2014, 42, 99–116. [Google Scholar] [CrossRef]
Figure 1. A theoretical framework.
Sustainability 16 03329 g001
Table 1. Definition and description of research variables.
Variable TypeVariable NameVariable SymbolVariable Metric
Dependent variableFinancial performanceROANet profit/total assets
Independent variableESG performanceESGCSI ESG rating data
Moderating variableFinancial constraintsSASee Model (1)
Mediator variableCorporate innovationInnovationPatent applications plus the natural logarithm of 1
Control variablesGearing ratioLevTotal liabilities/total assets
Earnings per shareEpsNet profit after tax/total equity
Total asset growth rateGrowth(Total assets at the end of the current period − total assets at the end of the previous period)/total assets at the end of the previous period
Shareholding concentrationTop1Shareholding ratio of the largest shareholder
Cash ratioCashflowNet cash flows from operating activities/total assets
Number of board of directorsBoardThe number of board members is taken as a natural logarithm
Years of enterprise listingAgeLn (current year − year of listing + 1)
Enterprise sizeSizeNatural logarithm of total assets for the year
SectorIndustryIndustry dummy variables
VintagesYearAnnual dummy variables
Table 2. Descriptive statistics.
VariableNMeanSDMinp25p50p75Max
ROA10,4260.0430.046−0.0970.0150.0340.0640.197
ESG10,4264.2680.99924456
Lev10,4260.4790.1890.0740.3370.4900.6250.858
Eps10,4260.4710.614−0.7600.1170.3070.6323.349
Growth10,4260.1160.172−0.2090.0110.0820.1830.844
Top110,42636.7314.9310.312534.9147.7075.84
Cashflow10,4260.0560.070−0.1460.0160.0530.0970.251
Board10,4262.1850.2001.6092.0792.1972.1972.708
Age10,4262.6740.4621.0992.4852.7732.9963.332
Size10,42622.731.36420.2121.7522.5723.5926.71
Innovation10,4261.1861.520000.6932.1976.023
SA10,426−3.8190.257−4.378−3.993−3.833−3.662−2.959
Table 3. Correlation matrix.
ROAESGLevEpsGrowthTop1CashflowBoardAgeSizeInnovationSA
ROA1
ESG0.121 ***1
Lev−0.389 ***0.028 ***1
Eps0.698 ***0.202 ***−0.055 ***1
Growth0.248 ***0.066 ***0.078 ***0.245 ***1
Top10.080 ***0.041 ***0.089 ***0.132 ***−0.032 ***1
Cashflow0.448 ***0.044 ***−0.178 ***0.318 ***−0.042 ***0.087 ***1
Board0.021 **0.023 **0.104 ***0.063 ***0.022 **0.047 ***0.071 ***1
Age−0.126 ***0.038 ***0.079 ***0.033 ***−0.193 ***−0.066 ***−0.056 ***−0.048 ***1
Size−0.039 ***0.292 ***0.455 ***0.313 ***0.049 ***0.239 ***0.035 ***0.222 ***0.243 ***1
Innovation0.072 ***0.176 ***0.0080.105 ***0.035 ***−0.0130.056 ***0.062 ***−0.063 ***0.228 ***1
SA0.062 ***0.073 ***0.088 ***0.088 ***0.125 ***0.255 ***0.064 ***0.127 ***−0.658 ***0.153 ***0.141 ***1
*** p < 0.01, ** p < 0.05.
Table 4. Regression results of ESG performance and financial performance.
Variables(1)(2)(3)(4)(5)(6)
1st Stage2nd Stage
ROAROEESGROAVariablesROA
ESGmean 0.758 ***
(15.27)
ESG0.001 ***0.002 *** 0.006 ***L.ESG0.002 ***
(4.20)(4.18) (3.37) (3.91)
Lev−0.070 ***0.003−1.001 ***−0.065 ***L.Lev−0.055 ***
(−35.17)(0.63)(−16.20)(−24.25) (−20.50)
Eps0.046 ***0.096 ***0.068 ***0.046 ***L.Eps0.032 ***
(52.77)(52.74)(3.67)(51.79) (33.54)
Growth0.029 ***0.060 ***0.114 **0.028 ***L.Growth0.019 ***
(15.35)(16.22)(2.08)(15.10) (7.89)
Top10.000 ***0.000 ***−0.001 **0.000 ***L.Top10.000 ***
(4.75)(6.41)(−2.07)(5.01) (4.51)
Cashflow0.138 ***0.207 ***0.274 **0.136 ***L.Cashflow0.160 ***
(26.75)(20.80)(2.01)(26.19) (23.76)
Board0.004 ***0.009 ***−0.109 **0.004 ***L.Board0.003
(2.84)(3.29)(−2.28)(3.23) (1.39)
Size−0.004 ***−0.008 ***0.315 ***−0.005 ***L.Size−0.003 ***
(−12.00)(−13.09)(32.36)(−8.11) (−6.19)
Age−0.003 ***−0.003−0.133 ***−0.002 ***L.Age−0.003 ***
(−3.85)(−1.61)(−5.36)(−2.91) (−2.49)
Constant0.116 ***0.177 ***−4.817 ***0.126 ***Constant0.091 ***
(17.33)(12.93)(−16.60)(16.68) (9.48)
IndustryYesYesYesYesIndustryYes
YearYesYesYesYesYearYes
Observations10,42610,42610,42610,426Observations9624
R-squared0.6990.6450.2370.691R−squared0.453
*** p < 0.01, ** p < 0.05.
Table 5. Mechanism test results.
Variables(1)(2)(3)(4)(5)
ROAROAROAInnovationROA
ESG0.001 *** 0.001 ***0.207 ***0.001 ***
(4.20) (3.96)(15.34)(3.35)
Innovation 0.001 ***
(5.46)
SA −0.018 ***−0.017 ***
(−8.79)(−8.61)
ESG×SA −0.004 ***
(−3.73)
Lev−0.070 ***−0.072 ***−0.071 ***−0.162 **−0.070 ***
(−35.17)(−36.42)(−35.63)(−2.08)(−35.13)
Eps0.046 ***0.046 ***0.046 ***−0.0410.046 ***
(52.77)(53.51)(53.72)(−1.56)(52.96)
Growth0.029 ***0.028 ***0.028 ***0.0200.029 ***
(15.35)(14.79)(14.79)(0.28)(15.40)
Top10.000 ***0.000 ***0.000 ***−0.002 **0.000 ***
(4.75)(6.09)(6.08)(−2.56)(4.88)
Cashflow0.138 ***0.138 ***0.137 ***0.673 ***0.137 ***
(26.75)(26.88)(26.77)(3.78)(26.64)
Board0.004 ***0.004 **0.003 **0.347 ***0.003 **
(2.84)(2.50)(2.40)(5.14)(2.54)
Size−0.004 ***−0.002 ***−0.002 ***0.292 ***−0.004 ***
(−12.00)(−6.06)(−6.55)(19.38)(−12.95)
Age−0.003 ***−0.009 ***−0.008 ***−0.265 ***−0.003 ***
(−3.85)(−8.40)(−8.15)(−8.08)(−3.47)
Constant0.116 ***0.036 ***0.038 ***−6.907 ***0.124 ***
(17.33)(3.08)(3.33)(−21.77)(18.30)
IndustryYesYesYesYesYes
YearYesYesYesYesYes
Observations10,42610,42610,42610,42610,426
R-squared0.6990.7030.7040.4110.701
Robust t-statistics in parentheses
*** p < 0.01, ** p < 0.05.
Table 6. Enterprise heterogeneity test results.
Variables(1)(2)(3)(4)(5)(6)
State-Owned EnterpriseNon-State-Owned EnterpriseState-Owned EnterpriseNon-State-Owned EnterpriseState-Owned EnterpriseNon-State-Owned Enterprise
ROAROAROAROAROAROA
ESG0.001 **0.002 *** 0.001 **0.001 ***
(2.11)(4.28) (2.50)(3.59)
SA −0.017 ***−0.015 ***−0.016 ***−0.015 ***
(−7.49)(−3.69)(−7.14)(−3.72)
ESG×SA −0.004 ***−0.005 **
(−3.32)(−2.09)
Lev−0.067 ***−0.073 ***−0.069 ***−0.075 ***−0.068 ***−0.072 ***
(−29.13)(−19.01)(−30.11)(−20.03)(−29.62)(−19.00)
Eps0.043 ***0.053 ***0.043 ***0.054 ***0.043 ***0.053 ***
(45.03)(29.12)(45.30)(30.09)(45.46)(30.34)
Growth0.024 ***0.031 ***0.023 ***0.031 ***0.023 ***0.031 ***
(10.49)(9.99)(10.12)(9.78)(10.03)(9.93)
Top10.000 ***0.000 ***0.000 ***0.000 ***0.000 ***0.000 ***
(5.05)(4.94)(6.37)(4.86)(6.36)(5.13)
Cashflow0.110 ***0.163 ***0.110 ***0.163 ***0.110 ***0.161 ***
(18.63)(17.53)(18.76)(17.73)(18.70)(17.58)
Board0.005 ***0.007 ***0.004 **0.007 ***0.004 **0.007 **
(2.97)(2.60)(2.43)(2.59)(2.40)(2.51)
Size−0.003 ***−0.005 ***−0.001 ***−0.003 ***−0.001 ***−0.004 ***
(−8.45)(−6.98)(−3.40)(−4.84)(−3.62)(−5.55)
Age0.000−0.000−0.005 ***−0.005 ***−0.005 ***−0.005 **
(0.45)(−0.10)(−4.04)(−2.77)(−3.75)(−2.32)
Constant0.087 ***0.120 ***0.0100.056 ***0.0120.060 ***
(10.50)(8.92)(0.73)(2.61)(0.91)(2.84)
IndustryYesYesYesYesYesYes
YearYesYesYesYesYesYes
Observations673937006739370067393700
R-squared0.7130.7080.7170.7090.7180.711
p-value0.008 *** 0.013 **
Robust t-statistics in parentheses
*** p < 0.01, ** p < 0.05.
Table 7. Heterogeneity results based on industry characteristics.
Variables(1)(2)
Heavily Polluting EnterprisesNon-Heavily Polluting Enterprises
ROAROA
ESG0.0010.002 ***
(1.33)(4.18)
Lev−0.078 ***−0.065 ***
(−22.94)(−26.72)
Eps0.042 ***0.048 ***
(33.10)(39.21)
Growth0.042 ***0.024 ***
(11.86)(10.84)
Top1−0.0000.000 ***
(−0.25)(5.95)
Cashflow0.173 ***0.126 ***
(16.70)(21.35)
Board0.0020.005 ***
(0.87)(3.07)
Size−0.002 ***−0.004 ***
(−4.14)(−11.29)
Age−0.001−0.004 ***
(−0.85)(−3.96)
Constant0.084 ***0.127 ***
(7.84)(15.31)
IndustryYesYes
YearYesYes
Observations35736866
R-squared0.7540.665
Robust t-statistics in parentheses
*** p < 0.01.
Disclaimer/Publisher’s Note: The statements, opinions and data contained in all publications are solely those of the individual author(s) and contributor(s) and not of MDPI and/or the editor(s). MDPI and/or the editor(s) disclaim responsibility for any injury to people or property resulting from any ideas, methods, instructions or products referred to in the content.

