Article

Effect of Inoculum Pretreatment and Substrate/Inoculum Ratio on Acidogenic Fermentation of Chemically Enhanced Primary Treatment Sludge

College of Environmental Science and Engineering, Ocean University of China, Qingdao 266100, China
*
Author to whom correspondence should be addressed.
Sustainability 2024, 16(8), 3347; https://doi.org/10.3390/su16083347
Submission received: 2 February 2024 / Revised: 9 April 2024 / Accepted: 15 April 2024 / Published: 16 April 2024
(This article belongs to the Section Waste and Recycling)

Abstract

:
Inoculum pretreatment and substrate/inoculum ratio (SIR) are essential factors affecting the acidogenic fermentation of chemically enhanced primary treatment (CEPT) sludge. To determine the optimal inoculum conditions, the influence of inoculum pretreatment and SIR on the production of volatile fatty acids (VFAs) was investigated via two phases of batch experiments. Heat, acid, and alkali pretreatment methods demonstrated the enhanced production of VFAs, with the heat pretreatment being the optimal inoculum pretreatment method due to its highest VFA accumulation and favorable VFA composition for denitrification. The substrate/inoculum ratio of 4:1 (SIR 4) presented the optimal efficiency for both hydrolysis and acidogenesis processes (24.6 ± 0.1% and 22.7 ± 0.4%), with acetic acid, butyric acid, and propionic acid dominating the VFA profile. Combining VFA production and microbial community, the heat-pretreated inoculum with the SIR 4 condition was the most suitable for the VFA production of CEPT sludge acidogenic fermentation. This study contributes to sustainability in wastewater management by demonstrating an efficient approach for the recovery of carbon resources from CEPT sludge. The optimized conditions for acidogenic fermentation not only enhance VFA production but also support the circular economy by transforming waste into valuable resources.

1. Introduction

The treatment of sewage generates significant volumes of sludge, which presents both a challenge and an opportunity for sustainable wastewater management. It is estimated that sewage sludge treatment and disposal account for 50% to 60% of the operating expenses of sewage treatment plants (STPs), highlighting the economic burden [1]. Moreover, the environmental and health risks associated with sludge disposal—stemming from its high content of organic pollutants, heavy metals, and potential pathogens—underscore the urgent need for more sustainable management strategies [2]. By employing anaerobic fermentation, we can not only mitigate the volume of sewage sludge but also recover valuable organic carbon sources, transforming them into high-value products. This approach not only alleviates the economic and environmental pressures on wastewater treatment facilities but also contributes to the circular economy by turning waste into resources, thereby enhancing the sustainability of urban water systems. A study by Liu et al. [3] demonstrates that the net profit of VFAs is significantly higher at 9.12 USD/m3 compared to biogas at 3.71 USD/m3. Additionally, the required sludge retention time (SRT) for VFA production is much lower in contrast to the longer SRT of 25 to 30 days required for biogas production [4]. Therefore, effectively converting organic matter into VFAs during the acidogenic step will result in higher added value and a wider range of applications. The chemically enhanced primary treatment (CEPT) process, utilizing chemicals like coagulants and flocculants, precipitates suspended solids and colloidal particles in wastewater. The resultant CEPT sludge, characterized by its high organic matter content and improved biodegradability, proves to be an excellent feedstock for acidogenic fermentation. CEPT sludge can intercept over 60% of organic carbon in raw sewage [5], and its BOD/COD is higher relative to primary sludge and waste activated sludge, indicating a higher biodegradable organic waste content. In addition, CEPT sludge exhibits a reduced median particle size. This characteristic leads to an increased specific surface area of solid organic waste for hydrolyzing bacteria, resulting in a higher rate of biological hydrolysis [6].
Operating parameters such as inoculum, pH, and temperature are essential factors affecting acidogenic fermentation. The inoculum from the anaerobic digester contains a large population of anaerobic microorganisms, which can provide diverse biochemical functions and improved process stability [4]. To improve VFA production, the hydrolysis and acidification rates must be increased while blocking the methanogenesis pathway. The pretreatment of inoculum is an effective method to improve acidification. Different pretreatment methods are proposed based on the physiological response of microbial communities to extreme conditions. Since acidogens and methanogens have different nutritional requirements and environmental conditions, pretreatment methods such as acid, alkali, heat shock, and chemical inhibitors are applied to inhibit methane production by methanogens. Methanogens exhibit their highest growth rates within a specific pH range of 6.8–8.2 [4]. Under extreme pH conditions (acidic and alkaline), acidogenic bacteria can still survive or form spores, while methanogens will be inhibited or eliminated due to their inability to sporulate [7]. The temperature range for heat shock treatment of inoculum is 80–121 °C, which can significantly increase VFA production [8]. Several studies have conducted comparisons of different methods of pretreating inoculum to enhance the yield of VFAs; however, some conclusions were contradictory. Montiel-Jarillo et al. [9] found that heat-shock pretreatment resulted in the highest yield of VFAs when glucose was used as the substrate. The optimal pretreatment method varies significantly depending on the origin or type of inoculum and feedstocks. Therefore, additional investigation is necessary to ascertain the impact of different methods of inoculum pretreatment on the acidogenic fermentation of CEPT sludge.
The SIR is a crucial parameter that impacts anaerobic digestion performance. Although the optimal SIR of anaerobic fermentation has been extensively studied, most of the research has focused on food waste, municipal solid waste, and waste activated sludge. Li et al. [10] found that SIRs higher than 1 led to irreversible acidification for the anaerobic digestion of food waste, while SIRs lower than 0.5 favored methane production. Li et al. [11] found that the VFA yield decreased with decreasing SIR in a study of acidification of corn straw hydrolysate, mainly due to the high abundance of methanogens caused by the increasing inoculum. Therefore, it is feasible to inhibit methanogens by adjusting the appropriate SIR; a higher SIR should be selected to achieve high VFA production. At high SIRs, acidogens proliferate rapidly initially, leading to a large accumulation of metabolite byproducts of VFAs, which decreases the system’s pH value and leads to the suppression of anaerobic activity, effectively preventing the conversion of VFAs to methane [12]. It is apparent that the optimal SIR exhibits variability across studies, which may be attributed to the diversity in nutrient composition of the substrate and physicochemical properties of the inoculum. To date, the optimal SIR for acidogenic fermentation of CEPT sludge has not been studied.
Inoculum pretreatment and proper SIR have been proven to be associated with the efficiency of acidogenic performance. However, previous research has not yet examined the impact of combining inoculum pretreatment and SIR on the production of VFAs from CEPT sludge. In order to determine the ideal inoculum conditions for acidogenic fermentation of CEPT sludge utilizing inoculum from an anaerobic digester, batch experiments were conducted in two phases. The effect of inoculum pretreatment methods was investigated in the first batch experiment. The second batch experiment investigated the effect of heat-pretreated inoculum combined with the different SIRs. The reaction kinetics and microbial communities were analyzed to understand the mechanisms of how inoculum pretreatment and SIR affect the production of VFAs. The results from this study will provide a scientific basis for further study of CEPT sludge acidogenic fermentation.

2. Materials and Methods

2.1. Substrate and Preparation Method

Raw wastewater was collected from the Maidao STP in Qingdao, China. The average characteristics of wastewater during the experiment were as follows: total chemical oxygen demand (TCOD) 766.2 ± 76.7 mg/L, soluble chemical oxygen demand (SCOD) 335.8 ± 49.2 mg/L, total phosphorus (TP) 8.6 ± 1.0 mg/L, total nitrogen (TN) 79.0 ± 1.6 mg/L, and suspended solids (SS) 414 mg/L. To eliminate large particles, the raw wastewater was filtered using a 1 mm screen before the experiment. The optimum dosages of FeCl3 of 58 mg/L and anionic polyacrylamide (aPAM) of 1.2 mg/L for chemically enhanced primary treatment were determined by applying the laboratory jar test. After adding FeCl3, the wastewater was rapidly stirred at 200 rpm for 1 min, and aPAM solution was added and then slowly stirred at 30 rpm for 15 min [13]. Finally, the wastewater was allowed to settle without stirring for 90 min. After this procedure, the supernatant was discarded, and 500 mL of settled sludge was ultimately kept as CEPT sludge (25 L of raw wastewater). The main characteristics of CEPT sludge are exhibited in Table 1. Compared to simple primary sludge [6], which is primarily produced through gravitational settling, CEPT sludge exhibits a higher yield and enriched organic matter content, thereby harboring enhanced potential for acidogenic fermentation.

2.2. Inoculum Pretreatment Methods and Inoculum Activation

Inoculation sludge used in the experiment was sourced from the anaerobic digester at Haibohe STP in Qingdao, China. The inoculum was filtered through a 2 mm sieve and then rinsed twice using ultrapure water. Heat, acid, and alkali pretreatments were applied to the inoculum to limit methanogenic activity. For acid and alkali pretreatment, the sludge was adjusted to pH 3.0 or 12.0 using 1 M HCl acid or NaOH, respectively [9,14]. It was then mixed and stirred at 37 °C and 200 rpm for 24 h, followed by readjusting the pH back to 7.0. In the case of heat pretreatment, the sludge was subjected to boiling at a temperature of 100 °C for a period of 30 min [8].
Batch experiments were conducted with three pretreated inocula and untreated inocula (as controls) to evaluate the acidogenic activity using glucose as the model substrate. Fifty milliliters of inocula were added to 150 mL of nutrient medium containing 10 g/L glucose; the specific composition of the medium was as described in Gavala et al. [15] (non-enriched). To rejuvenate the pretreated inocula and promote the growth of acidogenic bacteria, 50 mL of each type of the three differently pretreated inocula was incubated in 500 mL of nutrient medium containing 20 g/L glucose for 48 h, constituting the first batch of experiments (First batch). Due to insufficient activity recovery in the alkali-pretreated sludge group, the inoculum was washed and then introduced into fresh nutrient medium to commence the second batch of experiments (Second batch). The above batch experiments were conducted under strict anaerobic conditions, achieved by purging each container using nitrogen gas for 2 min before sealing. The fermentation experiments were carried out in a water bath shaker, maintained at a constant temperature of 37 °C and stirred at a speed of 200 rpm to ensure uniform mixing.

2.3. Effect of Inoculum Pretreatment Methods on VFA Production

A batch fermentation experiment was performed to examine the effect of different pretreated inocula on VFA production. The SIR was set at approximately 4. For each treatment, 30 mL of untreated, acid-pretreated, alkali-pretreated, and heat-pretreated inocula were separately inoculated into 300 mL of CEPT sludge. The experiments were carried out in triplicate at 37 °C and 200 rpm for ten days. The reactor with untreated inoculum was set as the control reactor named as the Control. The other three reactors with acid-pretreated, alkali-pretreated, and heat-pretreated inocula were labeled as Acid, Alkali, and Heat reactors, respectively.

2.4. Effect of Heat-Pretreated Inoculum and SIRs on the Production of VFAs

Batch fermentation experiments were conducted to explore the effect of heat pretreatment inoculum with different SIRs (4, 2, 1, and 0.5 g vs. substrate/g vs. inoculum). Heat-pretreated inoculum (VS 14.4 VS/L) was prepared. Twelve reactors were divided into four groups (SIR 4, SIR2, SIR 1, and SIR 0.5), each reactor was first loaded with 150 mL of CEPT sludge, and inoculum was added according to the different SIRs. In parallel, blank assays were performed using the same amount of inoculum as the experimental reactor but with ultrapure water instead of CEPT sludge. The endogenous VFA production determined in blank assays was subtracted to obtain the net VFA production.

2.5. Analytical Methods

2.5.1. Chemical Indices Analysis

The pH value of sludge was measured using a pH meter (PH300F, Rex, Shanghai, China). Total solids (TS), volatile solids (VS), total nitrogen (TN), and total phosphorus (TP) of sludge samples were measured using the Chinese State Determination Method of Municipal Sludge in Wastewater Treatment Plant [16]. The supernatant from the centrifuged sludge samples (10,000 rpm, 5 min) was used to analyze the soluble water quality indicators. Total chemical oxygen demand (TCOD), soluble chemical oxygen demand (SCOD), ammonia (NH4-N), and phosphate (PO4-P) were measured according to standard methods [17]. The polysaccharide concentration was measured using the sulphate-anthrone method [18], and the soluble protein concentration was quantified using a Lowry Protein Assay Kit (Solarbio, Beijing, China). Additionally, the activity of protease was also determined using an Acidic Proteinase (ACP) Activity Assay Kit (Solarbio, Beijing, China). The α-glucosidase activity was determined using a Micro α-glucosidase (α-GC) Assay Kit (Solarbio, Beijing, China).
Gas chromatography (8890, Agilent, Santa Clara, CA, USA) with a capillary column (DB-FFAP, 30 m × 0.25 mm × 0.25 mm, Agilent, Santa Clara, CA, USA) and flame ionization detector was used to determine the concentration and composition of VFAs. The conversion coefficients of VFA concentration and COD concentration are as follows: 1.067 g COD/g acetic acid, 1.514 g COD/g propionic acid, 1.818 g COD/g butyric acid or iso-butyric acid, and 2.039 g COD/g valeric acid or iso-valeric.

2.5.2. Calculations

The ratio of SCOD to the initial TCOD was used to calculate the hydrolysis efficiency (Equation (1)).
Hydrolysis   Efficiency   ( % ) = SCOD t TCOD initial
The ratio of the concentration of VFAs to the initial TCOD was used to calculate the acidogenesis efficiency, which was then utilized to assess the acidogenic potential (Equation (2)).
Acidogenesis   Efficiency   ( % ) = COD VFA TCOD initial
where TCODinitial represents the initial total chemical oxygen demand concentration, SCODt and CODVFA represent the soluble chemical oxygen demand concentration and VFA concentration (mgCOD/L) at time t.
The VFA yield (YVFA) was calculated as the amount of produced VFAs divided by the concentration of volatile solid of the CEPT sludge (Equation (3)).
Y VFA mgCOD gVS = COD VFA , max COD VFA , initial VS CEPT
where CODVFA,max, CODVFA,initial, and VSCEPT represent the maximum concentration of VFAs, the initial concentration of VFAs and the volatile solids content in the CEPT sludge.
To estimate the nutrient release and recovery potential, ammonium and phosphate release rates were calculated according to Equations (4) and (5).
NH 4 N   release % = NH 4 N FL TN CEPT
PO 4 P   release % = PO 4 P FL TP CEPT
where NH4-NFL and PO4-PFL represent the content in the fermentation liquid, TNCEPT and TPCEPT represent the total content in the CEPT sludge [19].

2.5.3. Kinetic Analysis

Acid fermentation typically involves the processes of hydrolysis and acidogenesis. Particulate organic matter (i.e., PCOD) progressively hydrolyzes into soluble organic matter (SCOD), which acidogens can then further convert into VFAs [20]. Simplifying hydrolysis to first-order kinetics of substrate biodegradation, the relationship between substrate and product is expressed in Equations (6) and (7) [21].
dPCOD dt = k H PCOD
dSCOD dt = α k H PCOD
where PCOD and SCOD represent the particulate COD and soluble COD concentration (mg/L), kH is the first-order rate constant (d−1), and α is the conversion coefficient of PCOD to SCOD. After the integration of Equations (6) and (7), the product concentration is expressed in Equation (8),
SCOD t = SCOD t 0 + α PCOD t 0 1 e k H t
For acidogenesis kinetics, the logistic model is frequently employed, as defined in Equation (9) [21],
VFAs t = VFAs max 1 + VFAs max VFAs t 0 1 e k VFAs t
in which VFAst0, VFAsmax, and kVFAs are the initial and maximum VFA concentration (mgCOD/L), and the apparent specific rate constant (d−1).

2.6. Bacterial Community Analysis

The fermentation mixture was collected at the end of two batch experiments for bacterial community analysis. DNA was extracted using the E.Z.N.A.® soil DNA kit (Omega Bio-tek, Norcross, GA, USA). The quality of the DNA was assessed using 1% agarose gel electrophoresis, and the concentration and purity were evaluated using the NanoDrop 2000 (Thermo Scientific, Wilmington, NC, USA). For PCR amplification, the V3–V4 regions of the bacterial 16S rRNA gene were amplified using primers 338F/806R. The taxonomic information of OUT was analyzed by using the RDP classifier algorithm against the Silva database (Release138, http://www.arb-silva.de, accessed on 31 October 2022) at a 97% similarity threshold. For diversity estimation, microbial α-diversity indexes such as Chao, Shannon, and Simpson were derived using the OTU cluster taxonomy results. The Principal Coordinate Analysis (PCoA) was used to examine β-diversity in samples from diverse reactors.

3. Results and Discussion

3.1. Comparison of the Effects of Inoculum Pretreatment Methods and Activation on VFA Production

VFA-producing inocula were prepared by applying heat, acid, and alkali pretreatment, and the quality of the different pretreated inocula was checked by using activity tests on the model substrate glucose. Figure 1a illustrates the concentration and composition of VFAs in the non-enriched and enriched cultures (First batch and Second batch) with different pretreated inocula and untreated inoculum. The composition of VFAs depended on the pretreatment method used. For the non-enriched batch test, the fermentation products of the untreated inoculum (Control) were acetic acid and iso-butyric acid, with a comparable proportion of both. For acid and heat pretreatment fermentation products, iso-butyric acid prevailed overwhelmingly (>63%). The highest concentration of acetic acid (53%) was found in the alkali pretreatment, followed by butyric acid (33%) and valeric acid (14%). After enrichment cultivations, the proportion of iso-butyric acid in each group increased substantially. Consistent with previous studies [9,22], acetic acid and iso-butyric acid were the major VFA components of the fermentation liquid of all batches, and different pretreatment methods led to variations in the type of fermentation.
The acidogenesis efficiency for various inoculum pretreatment methods is shown in Figure 1b. Activity tests for inocula that received only pretreatment (non-enriched) showed that heat pretreatment had the highest acidogenesis efficiency of 29.8 ± 3.2%, followed by acid pretreatment (18.2 ± 1.5%) and the control (11.7 ± 0.4%), while alkali pretreatment had the lowest acidogenesis efficiency (11.0 ± 0.2%). Notably, the acidogenesis efficiency and VFA yield were lower in the alkali pretreatment group than in the control group, contrary to previous reports; since there was no sharp change in COD and no significant gas production, this decrease can be considered a temporary shift to carboxylic acid rather than VFAs [7]. After the first batch, the VFA yield and acidogenesis efficiency in descending order were heat, acid, and alkali pretreatments. However, the activity of alkali-pretreated inoculum could not be effectively revived. After the second batch, the order of VFA yield and the acidogenesis efficiency were as follows: alkali > heat > acid, consistent with the study of [9]. In conclusion, anaerobic sludges with high activity after the second batch of enrichment cultivation were selected as inocula for the acidogenic fermentation of CEPT sludge.

3.2. Effect of Different Inoculum Pretreatments on the Acidogenic Fermentation of CEPT Sludge

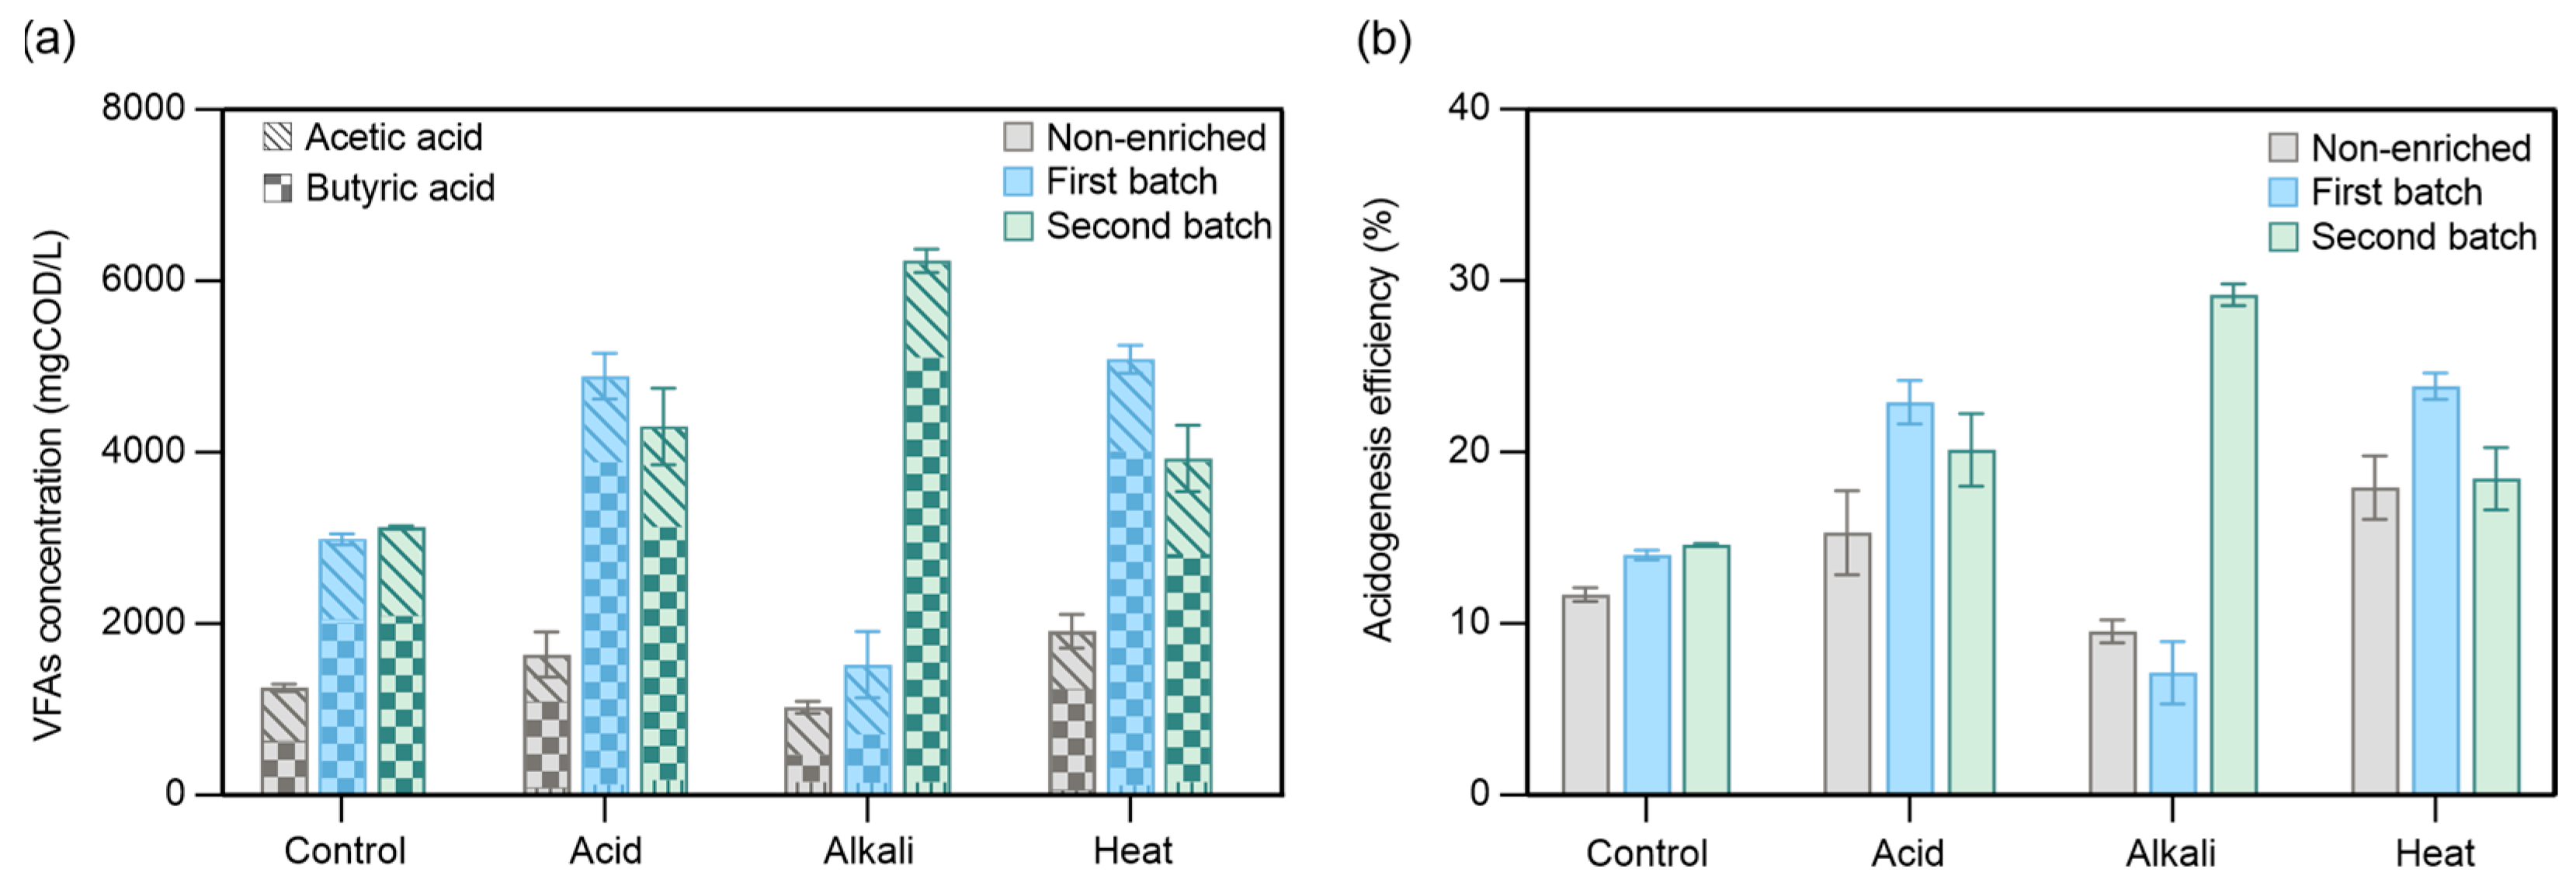
3.2.1. Acidogenic Fermentation Performance

The batch experiment was conducted to evaluate the acidogenic potential of different pretreated inocula on CEPT sludge. The first stage of hydrolysis in the acidogenic fermentation can be characterized by the change in SCOD concentration. As illustrated in Figure 2a, the SCOD concentrations in all groups increased throughout the course of the first five days at various rates, and first-order kinetics can be well fitted to assess hydrolysis performance (R2 > 0.91). The maximum SCOD concentration was reached on day 4 for the heat pretreatment group at 3764 ± 350 mg/L, followed by the alkali and acid pretreatments on day 5 (2947 ± 45 and 2630 ± 61 mg/L). In comparison with the maximum SCOD of the control group (1867 ± 95 mg/L), there were 2-, 1.6- and 1.4-fold increases, respectively. The parameters α and kH determine the specific rate of hydrolysis. Among various pretreatment groups, the hydrolysis rate constant kH of the heat pretreatment group was the highest. In comparison with the alkali pretreatment group, the acid pretreatment group had higher kH but lower SCOD content, mainly due to its lowest α value, resulting in a lower specific hydrolysis rate. The highest SCOD concentration and α•kH values imply an acceleration of breakdown and dissolution of particulate organic matter using heat-pretreated inoculum. The influence of pretreatment methods on the total production of VFAs is depicted in Figure 2b, and the logistic model well fitted (R2 > 0.92) the acidogenesis process. All groups observed a significant rise in VFAs over the first three to five days, particularly in the heat pretreatment group, where VFAs increased most rapidly during the first three days. As shown in Table 2, the three pretreatment methods all enhanced the VFA production. The VFA yield, indicating the quantity of solubilized organic matter that is converted to VFAs, is one of the indicators of the degree of acidogenic fermentation. The maximum VFA yield was 131.4 ± 6.5 mgCOD/gVS in the control group, while the maximum VFA yields were 282.4 ± 4.8, 372.6 ± 6.5, and 401.9 ± 56.4 mgCOD/gVS in the acid, alkali, and heat pretreatment groups, respectively. Compared with the control group, the hydrolysis efficiency increased more than 2-fold in all pretreatment groups, with the highest hydrolysis efficiency of 27.1% in the heat pretreatment group, followed by the alkali pretreatment (26.6%), while the lowest hydrolysis efficiency (21.4%) was obtained for acid pretreatment. Montiel-Jarillo et al. [9] reported the following order for the hydrolysis efficiency: heat > alkali > acid, which is in agreement with our results. Heat pretreatment has been regarded as an effective inoculum pretreatment strategy to selectively enrich sporulating acidogenic bacteria and suppressing methanogenic activity [14,23].
Moreover, the denitrification potential of the fermentation liquid can be estimated by using the VFAs/NH4-N value. The VFAs/NH4-N of heat pretreatment group was 19.3 ± 3.8 mgCOD/mgN, suggesting a highly favorable composition for enhancing biological nitrogen removal processes [19,24]. This elevated VFAs/NH4-N ratio indicates that the fermentation liquid from heat-pretreated sludge could be effectively utilized in denitrification stages of wastewater treatment plants, providing an efficient carbon source for the reduction of nitrate to nitrogen gas, thus contributing to the removal of nitrogen from the wastewater stream. Moreover, the heat pretreatment method also demonstrated the highest phosphorus release rate among the studied groups, which is advantageous for phosphorus recovery strategies [25]. Given these observations, it is evident that heat pretreatment emerges as the optimal inoculum pretreatment method for VFA production from CEPT sludge, considering both the efficiency of VFA production and the potential environmental benefits.

3.2.2. VFA Composition

The composition of VFAs could provide helpful information about the degree of acidogenic fermentation that had taken place. The time-course profile of VFA composition for different groups is presented in Figure 2c. In the heat pretreatment group, butyric acid production was significantly increased, with a 72.4% sum of acetic acid and butyric acid at the end of fermentation, achieving butyric acid-type fermentation. Propionic acid-type fermentation was achieved in the control, acid, and alkali pretreatment groups. Ren et al. [22] found that varied pretreatments on inoculum resulted in distinct fermentation types, e.g., heat-shock and alkali pretreatment achieved butyric acid-type fermentation, and acid pretreatment achieved mixed acid-type fermentation. Consequently, according to the type of needed VFAs, an appropriate pretreatment method could be chosen to obtain the target products. Interestingly, in the batch fermentation experiment with glucose as the substrate, the fermentation was butyric acid-type in all groups. Butyric acid, acetic acid, and propionic acid were reported to be the main products of glucose, peptone, and glycerol, respectively [26]. This observation highlights the complex interplay between substrate composition and microbial metabolism. The distinct fermentation patterns observed with CEPT sludge, which contains a diverse array of organic compounds including polysaccharides, proteins, and lipids, underscore the unique characteristics of the fermentation process when dealing with complex waste streams. In summary, the composition of VFAs not only provides insights into the metabolic activities of the fermenting microorganisms but also informs the selection of appropriate pre-treatment strategies to achieve the desired fermentation outcomes.

3.3. Effect of Different SIRs on the Acidogenic Fermentation of CEPT Sludge

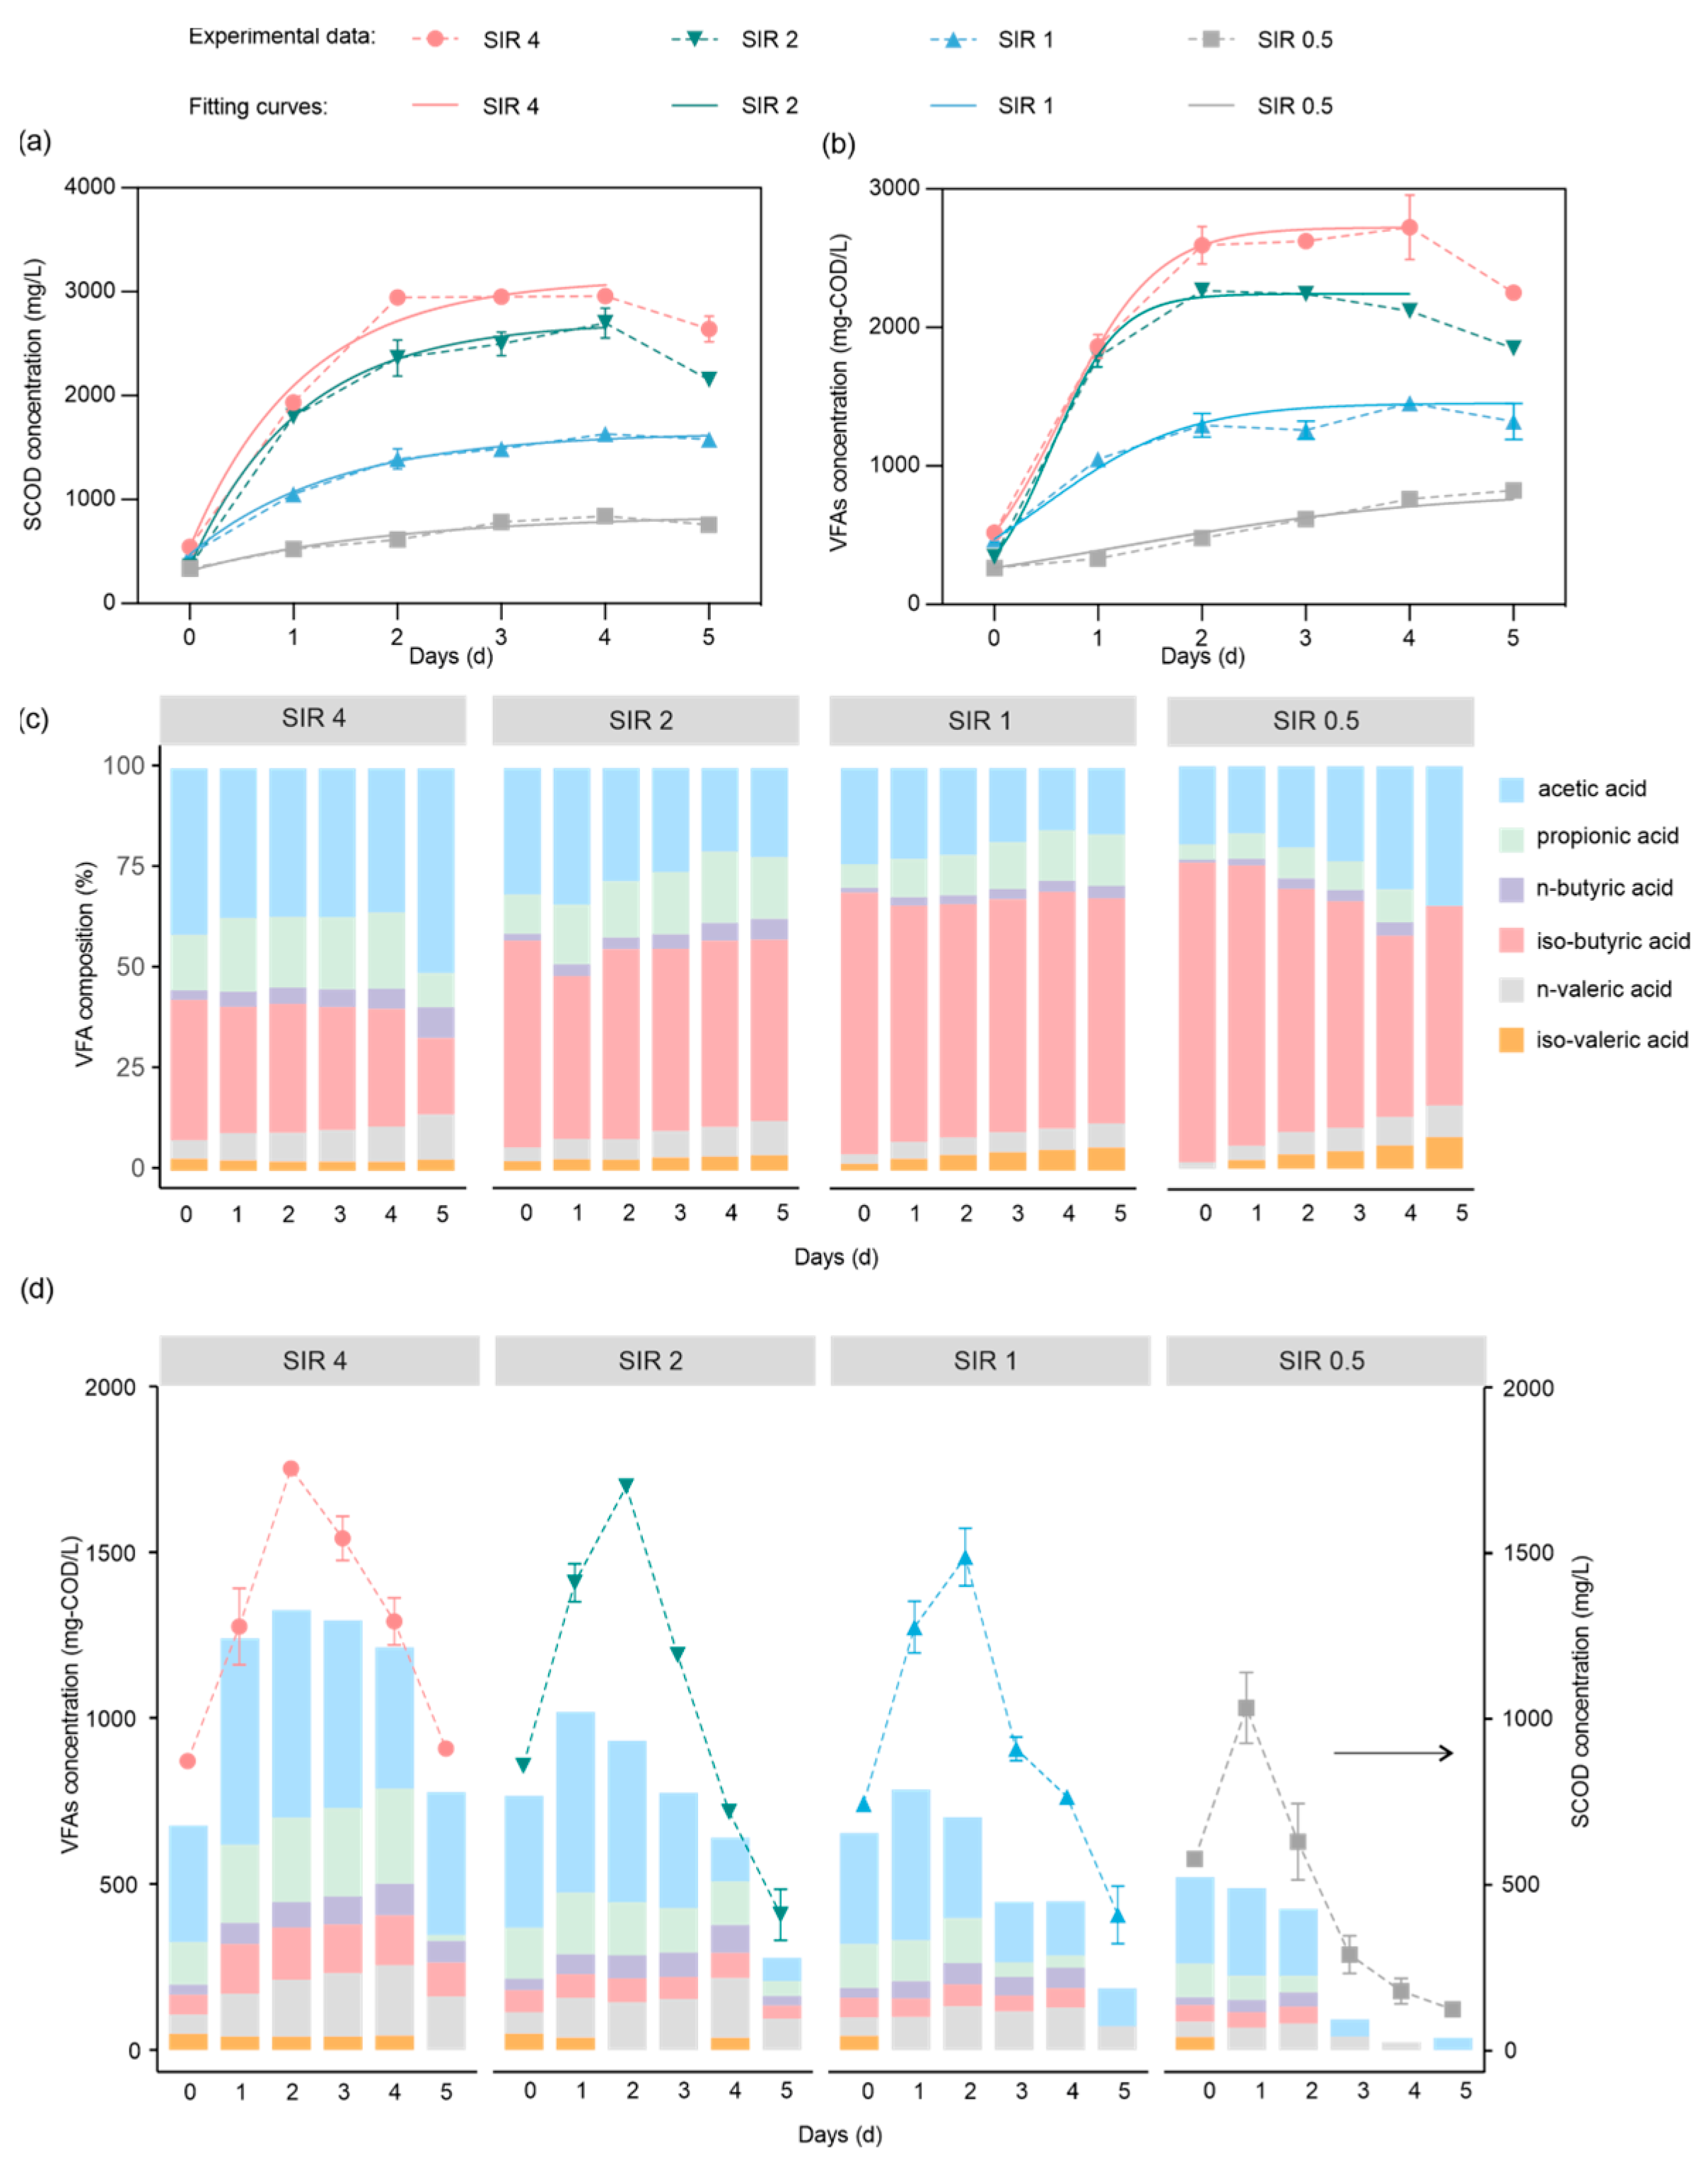
3.3.1. SCOD Release and VFA Production

SIR had a notable effect on the efficiency of hydrolysis and acidogenesis. As shown in Table 3, the SIR 4 group had the highest hydrolysis and acidogenesis efficiencies of 24.6 ± 0.1% and 22.7 ± 0.4%, respectively, followed by SIR 2 (22.4 ± 1.2% and 17.3 ± 0.4%), SIR 1 (13.6 ± 0.1% and 11.5 ± 1.2%), and SIR (7.2 ± 0.3% and 6.2 ± 0.03%). The first-order kinetics (R2 > 0.96, Figure 3a) and logistic models (R2 > 0.91, Figure 3b) can well fit the hydrolysis and acidogenesis processes, respectively. The α•kH value increases from 0.0169 to 0.2062 as the SIR increases from 0.5 to 4. However, it is noteworthy that SIR 4 had lower KVFAs (2.214 ± 0.1197 vs. 3.094 ± 0.1435) but a higher VFA yield compared to SIR 2 (331.4 ± 35.2 vs. 266.9 ± 6.9 mgCOD/gVS). The enhanced performance of SIR 4 can likely be attributed to its superior hydrolysis efficiency, which facilitated a greater release of SCOD, thereby providing an ample substrate for VFA production. Moreover, the rapid accumulation of VFAs at SIR 4 contributed to a lower pH environment, effectively suppressing methanogenic activity. In contrast, at lower SIR levels, the presence of active methanogens could lead to the conversion of VFAs into methane, resulting in the potential loss of valuable organic carbon. This observation aligns with the findings reported by Soomro et al. [20] and Tomei et al. [27]. Hence, SIR 4 was chosen as the optimal parameter to minimize the unwanted conversion of organic carbon into methane, thereby ensuring the retention of valuable carbon sources in the substrate.
To investigate whether the combined effect of SIR and inoculum pretreatment on VFA production is stronger than the individual effect of SIR, simultaneous batch experiments were conducted with unpretreated inoculum at different SIRs (Figure 3d). Similar to the heat pretreatment group, a reduction in the maximum concentrations of VFAs and SCOD was observed as the SIR decreased. However, even at high substrate loading (SIR 4 and 3), the unpretreated inoculum was insufficient to achieve high VFA production, as compared to the heat pretreatment group. Following a brief two-day increase, both SCOD and VFA concentrations gradually declined.

3.3.2. VFA Composition

Different SIRs resulted in varied distributions of VFAs for the same substrate and inoculum, as seen in Figure 3. Butyric acid-type fermentation was consistent across all groups and aligned with the results observed in the heat pretreatment group. After four days of acidogenic fermentation, VFA production peaked in all groups, with significantly higher concentrations in the SIR 4 and SIR 2 groups (2723 ± 234 and 2119 ± 46 mgCOD/L) than in the others. Acetic acid (35.8%) predominated in the SIR 4 group, followed by butyric acid (34.3%), propionic acid (19.0%), and valeric acid (11.0%). Compared to the SIR 4 group, the proportion of butyric acid significantly increased in reactors with lower SIRs, with values of 50.7%, 61.5%, and 48.4% for the SIR 2, SIR 1, and SIR 0.5 groups, respectively. On the contrary, the proportion of acetic acid and propionic acid decreased in the low SIR reactors. This observation aligns with the findings of Jiang et al. [28], who also noted a relative decrease in acetic acid concentration at lower SIRs, in contrast to the increased proportion of longer-chain acids like butyric and valeric acids. Compared to other VFAs, acetic acid was shown to be more readily available to denitrifying bacteria [29], while propionic acid played a role in reducing byproducts (N2O and NO) during denitrification [30]. In the present study, the SIR 4 group yielded the highest concentration of VFAs with a favorable composition for denitrification. Consequently, the fermentation liquid of the SIR 4 group is suitable for use as a carbon source for denitrification. Future studies will evaluate CEPT sludge acidogenic fermentation liquid’s denitrification efficiency for practical applications.

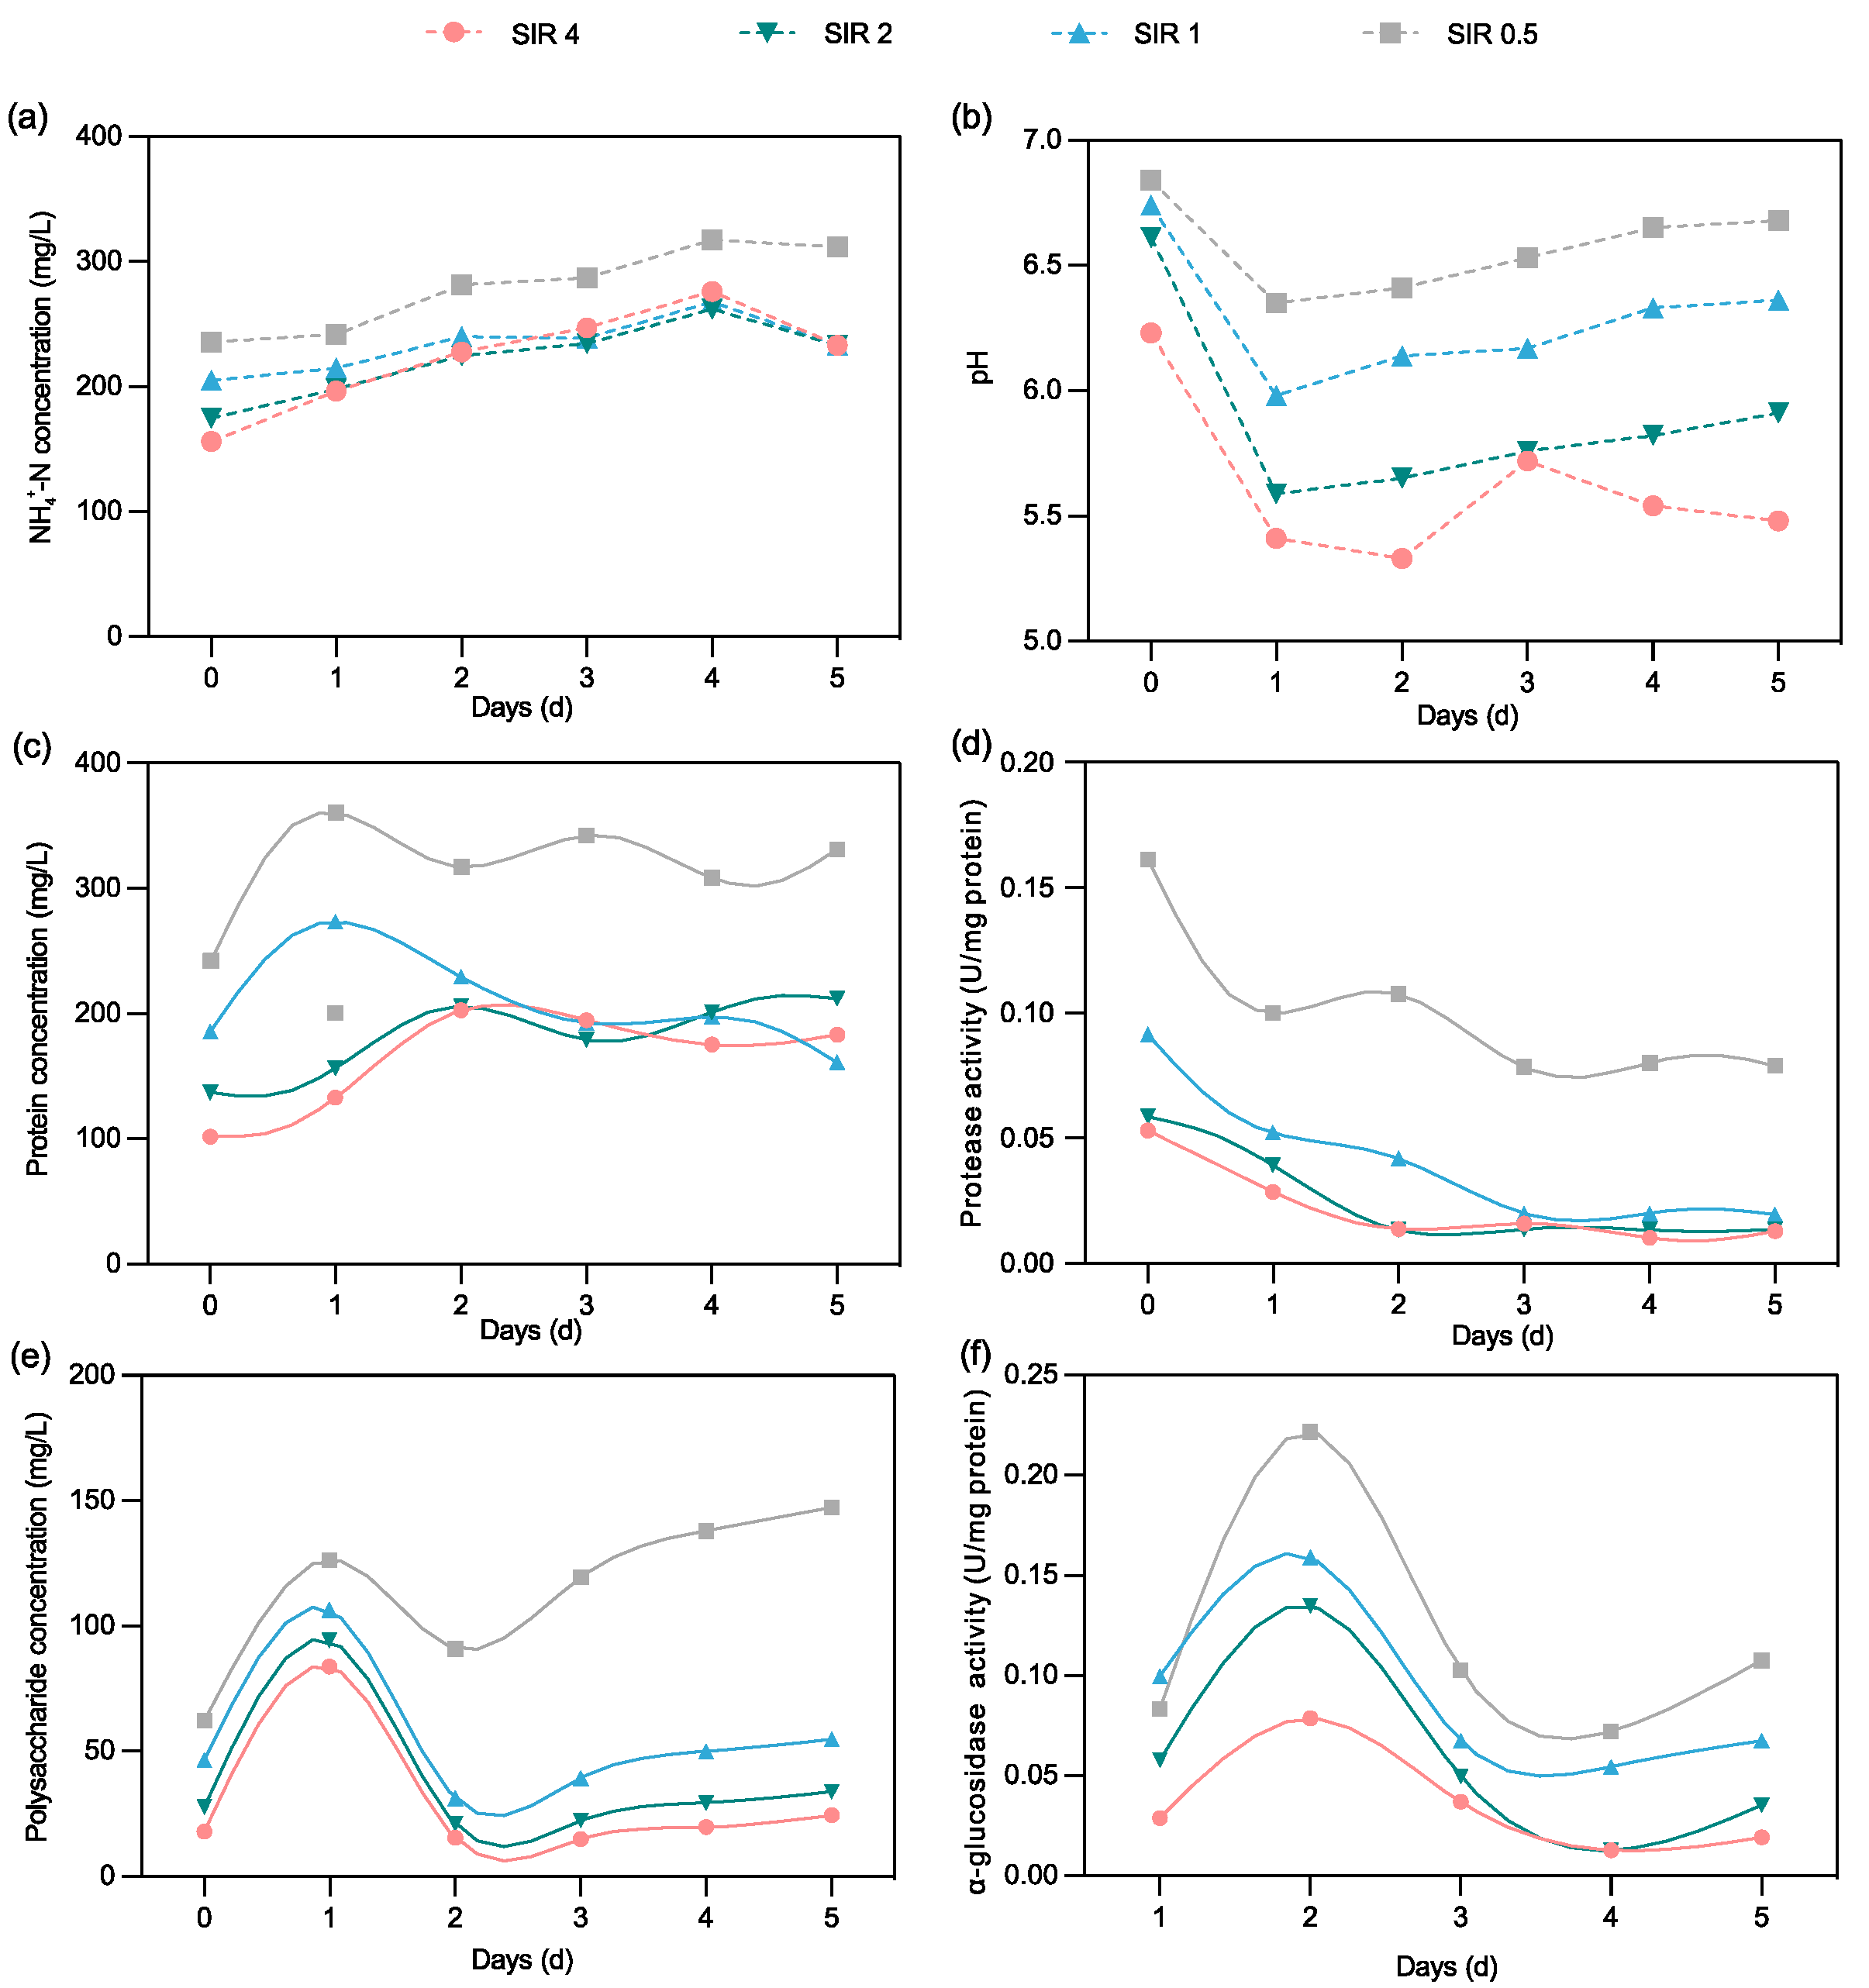
3.3.3. Organics and Nutrients Release

Ammonia concentrations (with endogenous NH4-N release) in all groups showed an increasing trend over time (Figure 4a). Due to the larger amount of protein brought on by the addition of extra inoculum, the SIR 0.5 group’s initial NH4-N concentration was much higher than that of the other groups (Figure 4c). The highest NH4-N concentration released from the SIR 0.5 could provide the alkalinity to neutralize the VFAs produced [20], resulting in a higher pH in the group (Figure 4b). Lower VFAs/NH4-N values in the SIR 1 and 0.5 groups indicate a higher proportion of NH4-N in the fermentation liquid, which increases the nitrogen removal burden and causes water quality degradation.
The process of hydrolysis involves the breakdown of polysaccharides into monosaccharides by α-glucosidase, while protease breaks down proteins into amino acids, which are then converted to pyruvate [26]. Across all groups, the concentration of soluble polysaccharides peaked on the first day before dropping sharply (Figure 4e), consistent with the high α-glucosidase activities observed on the second day (Figure 4f). Subsequent observations showed that the concentration of polysaccharides in SIR 1, 2, and 4 groups maintained a relatively steady decrease, with their α-glucosidase activities also decreasing. On the second day, the concentration of soluble protein shifted from increasing to decreasing, and a similar trend was observed in the acidogenic fermentation of municipal solid waste, signifying that biotransformation of protein typically occurs after the degradation of carbohydrates [20]. The repression of α-glucosidase and protease activities in higher SIR groups was observed, in accordance with the discovery made by Gao et al. [31] that higher substrate loading inhibited protease activity in the anaerobic digestion of solid residual kitchen waste. In comparison to SIR 0.5, the higher SIR groups contained relatively abundant organic matter in the substrate, with more polysaccharides and proteins available for decomposition into glucose and amino acids. Previous studies revealed that glucose, amino acids, and other readily fermentable substrates could repress α-glucosidase and protease secretion [32]. The activities of α-glucosidase and protease were also reported to be positively correlated with pH [33], with the high pH value of low SIR leading to higher activities.

3.4. Microbial Community Analysis

The VFA production and accumulation rely on microbial communities in the reactor. High throughput sequencing was used to determine the microbial community in various reactors. High coverage values (>0.99) were obtained for all samples, indicating that the sequencing results are sufficiently representative of the entire microbial community.

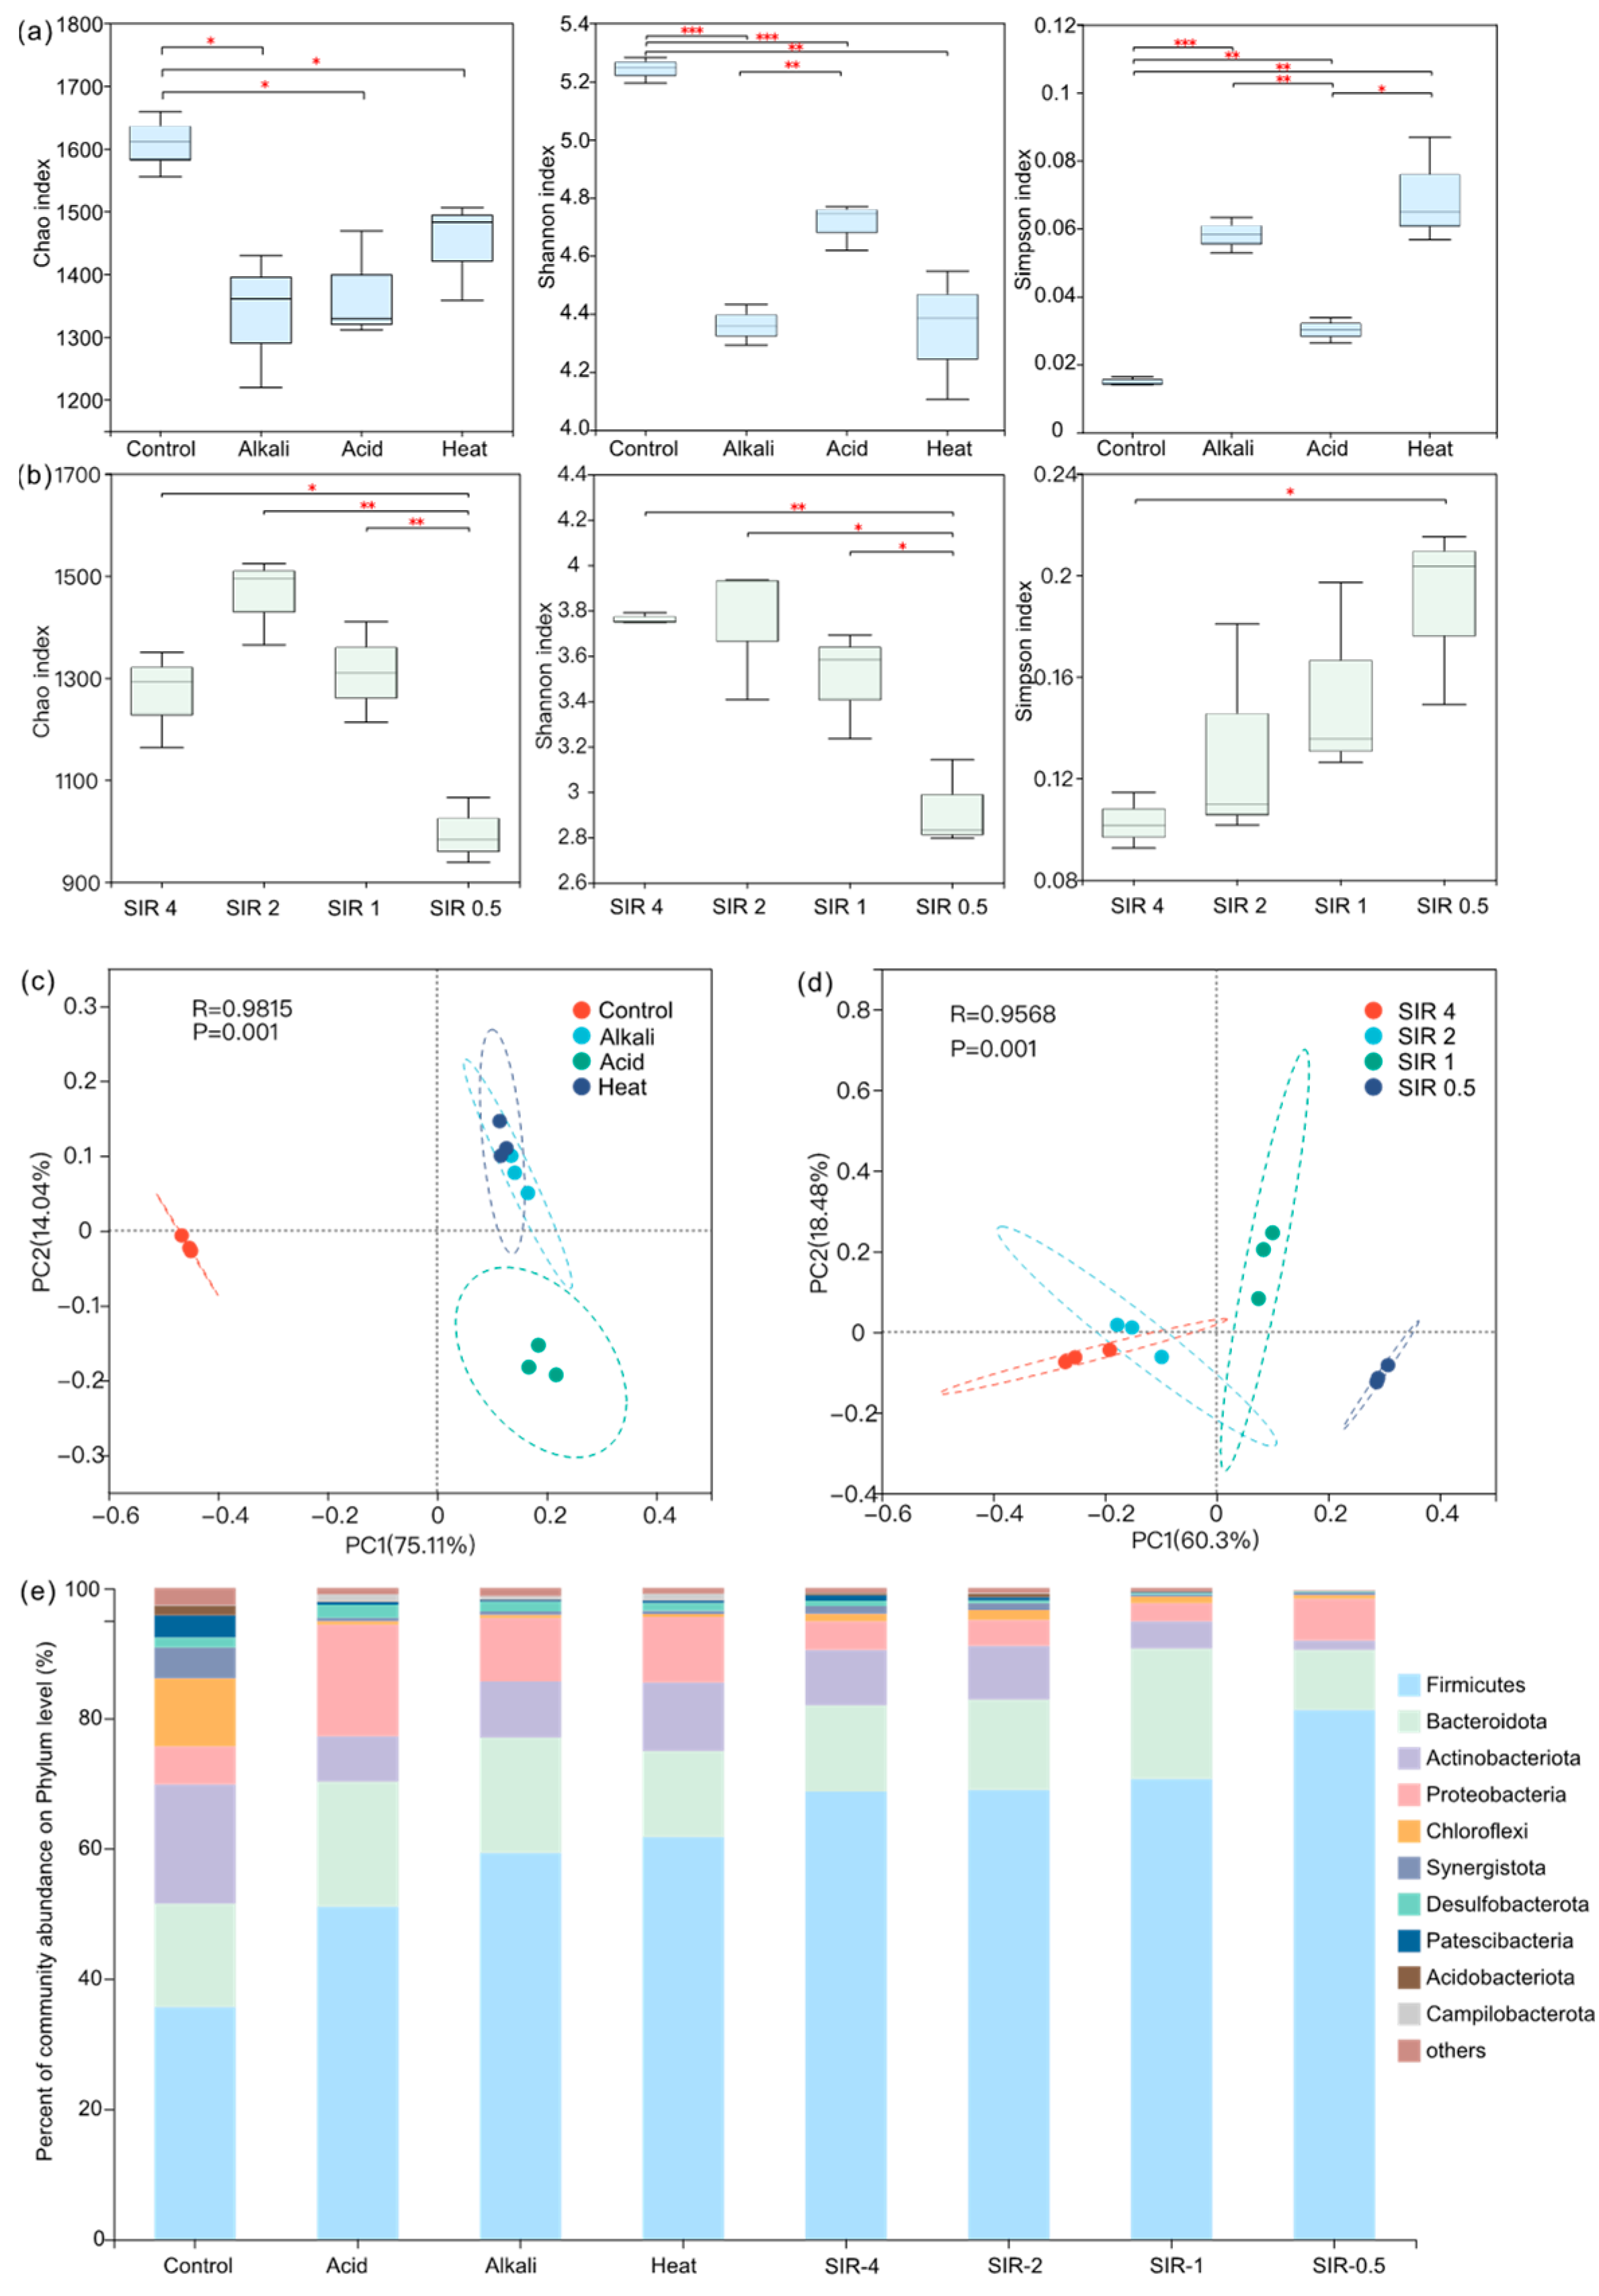
3.4.1. Microbial Diversity

Figure 5a displays the alpha diversity indices of the different pretreatment groups, where the Chao index was employed to evaluate the microbial richness. The Chao values exhibited a significant reduction in all the pretreatment groups in comparison to the control group (p < 0.05), indicating that acidogenic fermentation with pretreated inoculum decreased the microbial richness. A higher Shannon value or a lower Simpson value indicates a greater microbial diversity. The considerable reduction in Shannon values (p < 0.01) and the increase in Simpson values (p < 0.01) indicate an apparent reduction in microbial diversity across all the pretreatment groups. This phenomenon can be attributed to the harsh environmental conditions of the three pretreatment methods, leading to the elimination of a large number of microorganisms, thereby reducing the microbial richness and diversity [7].
As shown in Figure 5c, the PCoA analysis was performed based on the Bray–Curtis distance to evaluate the beta diversity of microbial communities under various pretreatment methods. The PCoA plots revealed an evident separation of bacterial communities among various pretreatment and control groups (R = 0.9815, p = 0.001), while the clusters for acid and alkali pretreatments exhibit no significant dissimilarity. This observation implies that the three pretreatment methods caused a shift in the microbial community structure, leading to different metabolic pathways. The distinct microbial community structures observed among the different pretreatment systems are attributed to the unique adaptations of microorganisms in the inoculum to the pretreatment conditions, resulting in varying microbial enrichments after pretreatment.
The SIRs exert a considerable influence on microbial richness and diversity within anaerobic systems, as depicted in Figure 5b. At lower substrate loading (SIR 0.5), the microbial richness and diversity indices were at their minimum but exhibited a progressive increase with higher substrate loading. Notably, the Chao index, a measure of microbial richness, peaked at SIR 2, suggesting that this SIR provides an optimal environment conducive to the proliferation of a wide range of anaerobic microorganisms, not just acidogenic bacteria. This implies that SIR 2 offers a balanced ecosystem where various microbial populations can thrive without the competitive pressures often associated with higher substrate loadings [34]. On the other hand, the elevated Shannon index coupled with the diminished Simpson index underscores the highest alpha diversity within the SIR 4 group, signifying the presence of a broader spectrum of acidogenic bacteria. This microbial diversity enhances substrate degradation efficiency, as diverse bacteria are adept at metabolizing distinct substrate components, facilitating a more thorough and rapid breakdown process [35]. Meanwhile, the high diversity is conducive to preserving the stability of microbial ecosystems. Combining the VFA yield and microbial diversity, the SIR 4 condition was more suitable for the growth of acidogenic microorganisms. The PCA plot showed significant separation between bacterial communities of different SIRs (R = 0.9568, p = 0.001), indicating that the substrate/inoculum ratio significantly influenced their distribution.

3.4.2. Microbial Community Analysis

A considerable variation in the distribution of microbial communities was observed among the different pretreatment systems in comparison to the control, which is consistent with the results of PCoA. The main dominant phyla in the control group were Firmicutes (35.7%), Actinobacteriota (18.4%), Bacteroidota (15.9%), Chloroflexi (10.3%), and Proteobacteria (5.9%). However, the species and abundance of the main dominant phylum among the three pretreatment groups showed significant changes, with Firmicutes, Bacteroidota, Proteobacteria, and Actinobacteriota becoming dominant phyla, accounting for over 94% of the total. The results observed coincide with the perspective presented in the study conducted by Iglesias-Iglesias et al. [36], which showed that the proliferation of these microorganisms facilitates the production of VFAs due to their pivotal role in promoting the fermentation of organic matter. The predominance of Firmicutes, which possess Gram-positive cell walls and spore-forming ability, can be attributed to their resistance to harsh environmental conditions [37]. Clostridiales and Peptostreptococcales-Tissierellales were found to be the dominant orders in the Firmicutes phylum (Table 4), and these microorganisms secrete extracellular enzymes to hydrolyze various macromolecular organic matter, thereby synthesizing VFAs [38]. Furthermore, a pronounced reduction in the relative abundance of Chloroflexi was observed in the three pretreatment groups, which could be attributed to the higher organic matter concentration in these groups. Similar findings were reported in previous studies, where the growth of Chloroflexi was suppressed with an increase in organic matter concentration during anaerobic digestion [39].
The microbial communities in all the SIR groups showed dominant phyla similar to that of the heat pretreatment group (Figure 5c). However, during the fermentation process, the abundance of the dominant phyla changed in all groups. Furthermore, it was observed that SIR 4 and SIR 2 exhibited similar microbial community structures, as is evident from the PCoA plot. In contrast, the community structure of SIR 0.5 was considerably different, showing an increase in the abundances of Firmicutes (81.3%) and Proteobacteria (6.4%) in the group. As shown in Table 4, among the Firmicutes, there was no marked variance in the abundance of the Clostridia and Bacilli classes across the distinct SIR groups. However, there was a substantial rise in the Negativicutes class in proportion to the inoculum, with a progression from 0.22% (SIR 4) to 14.9% (SIR 0.5). As reported previously, Negativicutes play a crucial role in propionate degradation and the fermentation of glutamate to butyrate [40]. The results agreed with the butyric acid-type fermentation found in the SIR 0.5 group, in which propionic acid has a low proportion while acetic and butyric acid dominates over the other three groups. Taken together, our findings suggest that different SIRs can lead to substantial alterations in the microbial community, despite the same origin of the inoculum.

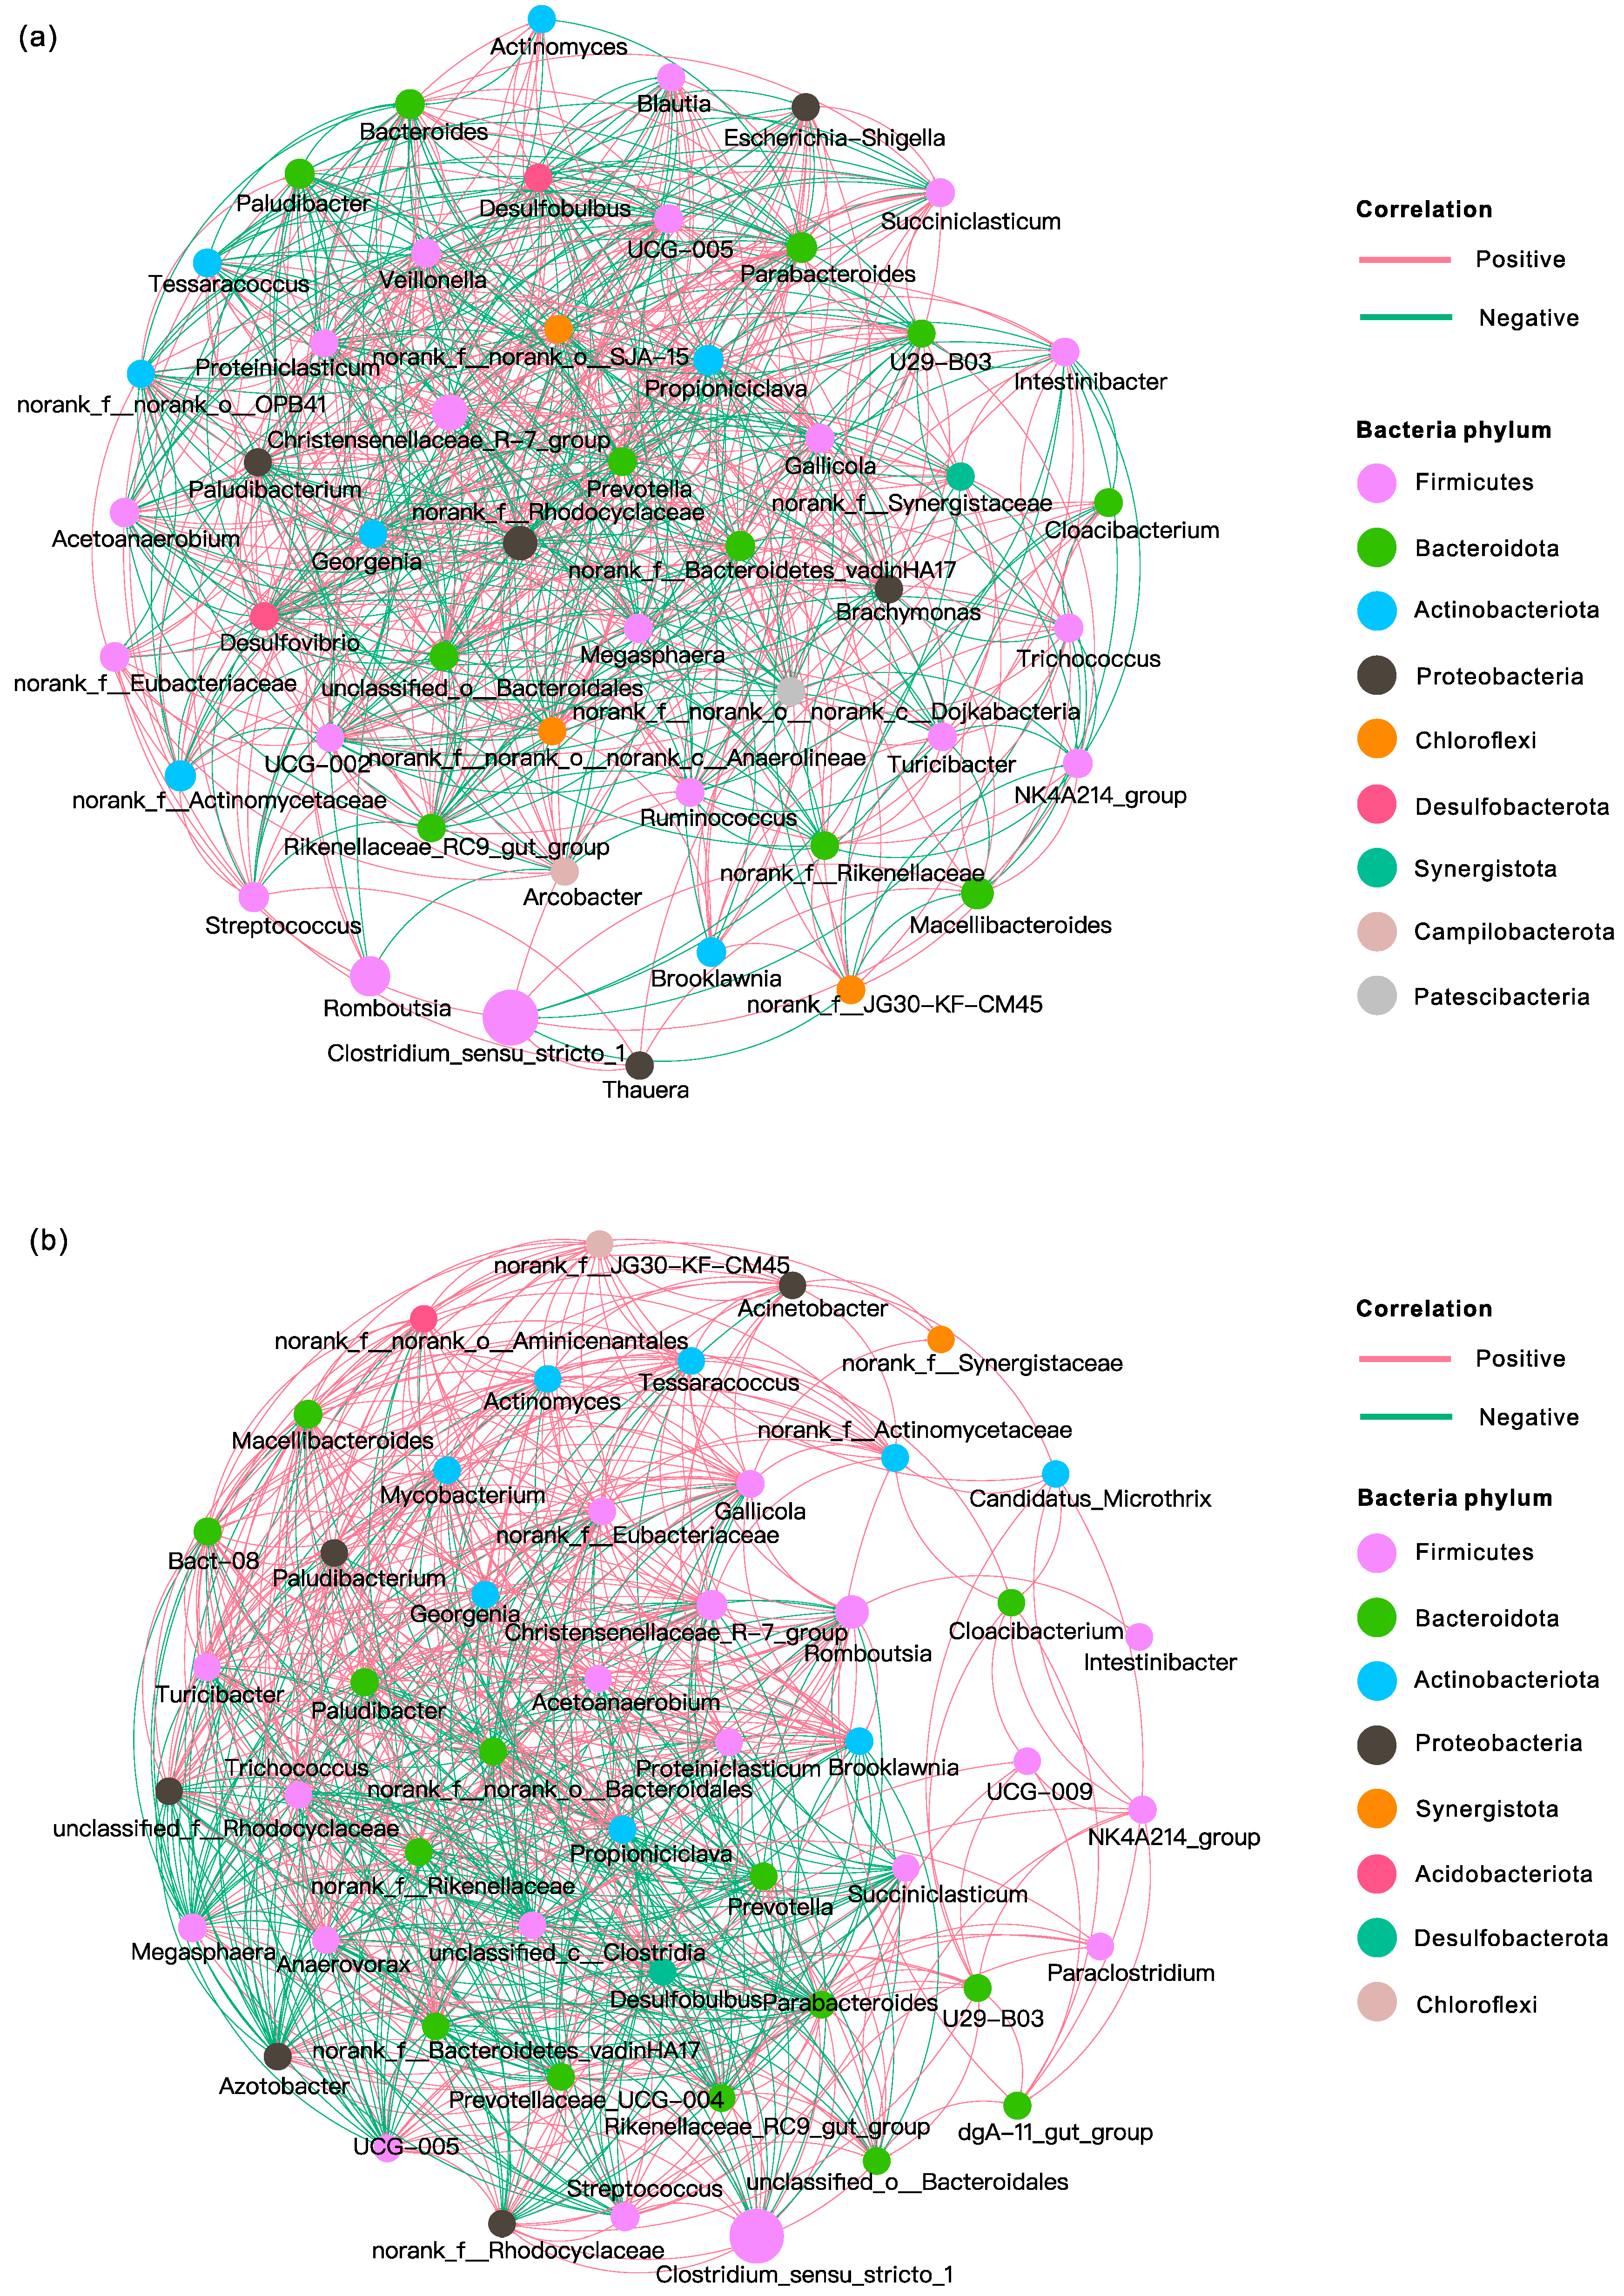
3.4.3. Microbial Correlation Network Analysis

Correlation network analysis was conducted on the top 50 most abundant bacteria in both the pretreatment and SIR groups. The significance of the microorganism relationships was determined by a threshold p value of less than 0.05, and the resulting networks are presented in Figure 6. At the genus level, the analysis revealed 334 positive and 287 negative correlations for the different pretreatment groups, while the different SIR groups had 427 positive and 249 negative correlations.
The Christensenellaceae_R-7_group had the highest abundance in the control group and had a negative correlation with the majority of the associated bacteria, indicating a competitive relationship. The Christensenellaceae_R-7_group plays a crucial role in the degradation of carbohydrates and amino acids to acetate and ammonia [41], consistent with the high proportion of acetic acid and high ammonium release rate of the control group. Clostridium_sensu_stricto_1 was significantly positively correlated with Macellibacteroides, Cloacibacterium, and norank_f__Eubacteriaceae, which are typically acidogenic bacteria and abundant in the heat pretreatment group. This suggested a cooperative relationship among them, which could improve the metabolic function of organic matter fermentation for producing VFAs. The high levels of acetic and butyric acids in the end product of the heat pretreatment group can be attributed to the presence of Clostridium_sensu_stricto_1, which is known for fermenting carbohydrates and proteins into these types of acids [42].
As for the analysis of different SIRs (Figure 6b), Romboutsia was positively related to 23 species of bacteria in this network, including the Christensenellaceae_R-7_group, norank_f__Rikenellaceae, Macellibacteroides, and Propioniciclava. The abundance of these species was highest in the SIR 4 group and decreased as the SIR level decreased. Romboutsia is an acid-producing microorganism that utilizes carbohydrates to produce acetate, formate, and ethanol [43]. The Rikenellaceae_RC9_gut_group was the only genus negatively related to Romboutsia in this network, indicating a competitive relationship between them. Several studies have shown that the Rikenellaceae_RC9_gut_group is the dominant bacteria in anaerobic digesters [44], with a negative correlation with butyrate, valerate, and hydrogen [45], suggesting that it may be involved in VFA utilization and contribute to methanogenesis. The abundance of the Rikenellaceae_RC9_gut_group was extremely low in the SIR 4 group, suggesting that the presence of Romboutsia may inhibit the growth of the Rikenellaceae_RC9_gut_group and suppress the production of methane.

4. Conclusions

The pretreated inoculum was successfully revived and used for acidogenic fermentation. Acid, alkali, and heat pretreatment methods all resulted in enhanced VFA production, with heat pretreatment leading to the highest accumulation of VFAs. Different SIRs led to different yields and distributions of VFAs, with SIR 4 resulting in the highest concentrations of VFAs suitable for denitrification. The production and accumulation of VFAs depended on the microbial communities in the reactors, and the harsh conditions of pretreatment methods eliminated microbial diversity. Different SIRs also caused significant changes in the microbial community. Overall, the heat-pretreated inoculum and SIR 4 condition were found to be more suitable for the growth of acidogenic microorganisms.

Author Contributions

Conceptualization, L.T.; methodology, L.T. and L.P.; investigation, L.T. and L.P.; writing—original draft preparation, L.T.; writing—review and editing, L.W.; funding acquisition, L.W. All authors have read and agreed to the published version of the manuscript.

Funding

This research was funded by [Science and Technology Program for Public Wellbeing of Qingdao] grant number [21-1-4-sf-11-nsh].

Institutional Review Board Statement

Not applicable.

Informed Consent Statement

Not applicable.

Data Availability Statement

All the data are available inside this paper.

Conflicts of Interest

The authors declare no conflicts of interest.

References

  1. Kacprzak, M.; Neczaj, E.; Fijalkowski, K.; Grobelak, A.; Grosser, A.; Worwag, M.; Rorat, A.; Brattebo, H.; Almas, A.; Singh, B.R. Sewage sludge disposal strategies for sustainable development. Environ. Res. 2017, 156, 39–46. [Google Scholar] [CrossRef]
  2. Ignatowicz, K. The impact of sewage sludge treatment on the content of selected heavy metals and their fractions. Environ. Res. 2017, 156, 19–22. [Google Scholar] [CrossRef]
  3. Liu, H.; Han, P.; Liu, H.; Zhou, G.; Fu, B.; Zheng, Z. Full-scale production of VFAs from sewage sludge by anaerobic alkaline fermentation to improve biological nutrients removal in domestic wastewater. Bioresour. Technol. 2018, 260, 105–114. [Google Scholar] [CrossRef]
  4. Niero, L.; Norgren, R.; Kumpiene, J.; Jonsson, A. The effect of pH, temperature, and inoculum on the fermentation of pulp and paper biosludge: Increasing the nutrient availability for rearing of black soldier fly larvae. Biomass Convers. Biorefinery 2022, 13, 16685–16693. [Google Scholar] [CrossRef]
  5. Shewa, W.A.; Dagnew, M. Revisiting Chemically Enhanced Primary Treatment of Wastewater: A Review. Sustainability 2020, 12, 5928. [Google Scholar] [CrossRef]
  6. Lin, L.; Li, Y.-Y.; Li, X.-Y. Acidogenic sludge fermentation to recover soluble organics as the carbon source for denitrification in wastewater treatment: Comparison of sludge types. Front. Environ. Sci. Eng. 2018, 12, 3. [Google Scholar] [CrossRef]
  7. Jayakrishnan, U.; Deka, D.; Das, G. Regulation of volatile fatty acid accumulation from waste: Effect of inoculum pretreatment. Water Environ. Res. 2021, 93, 1019–1031. [Google Scholar] [CrossRef]
  8. Blasco, L.; Kahala, M.; Tampio, E.; Vainio, M.; Ervasti, S.; Rasi, S. Effect of Inoculum Pretreatment on the Composition of Microbial Communities in Anaerobic Digesters Producing Volatile Fatty Acids. Microorganisms 2020, 8, 581. [Google Scholar] [CrossRef]
  9. Montiel-Jarillo, G.; Gea, T.; Artola, A.; Fuentes, J.; Carrera, J.; Suárez-Ojeda, M.E. Towards PHA Production from Wastes: The Bioconversion Potential of Different Activated Sludge and Food Industry Wastes into VFAs Through Acidogenic Fermentation. Waste Biomass Valorization 2021, 12, 6861–6873. [Google Scholar] [CrossRef]
  10. Li, Y.; Chen, Z.; Peng, Y.; Huang, W.; Liu, J.; Mironov, V.; Zhang, S. Deeper insights into the effects of substrate to inoculum ratio selection on the relationship of kinetic parameters, microbial communities, and key metabolic pathways during the anaerobic digestion of food waste. Water Res. 2022, 217, 118440. [Google Scholar] [CrossRef] [PubMed]
  11. Li, Y.; Xu, H.; Hua, D.; Zhao, B.; Mu, H.; Jin, F.; Meng, G.; Fang, X. Two-phase anaerobic digestion of lignocellulosic hydrolysate: Focusing on the acidification with different inoculum to substrate ratios and inoculum sources. Sci. Total Environ. 2020, 699, 134226. [Google Scholar] [CrossRef]
  12. Tawfik, A.; Ni, S.Q.; Awad, H.M.; Ismail, S.; Tyagi, V.K.; Khan, M.S.; Qyyum, M.A.; Lee, M. Recent Approaches for the Production of High Value-Added Biofuels from Gelatinous Wastewater. Energies 2021, 14, 4936. [Google Scholar] [CrossRef]
  13. Lin, L.; Li, X.Y. Acidogenic fermentation of iron-enhanced primary sedimentation sludge under different pH conditions for production of volatile fatty acids. Chemosphere 2018, 194, 692–700. [Google Scholar] [CrossRef]
  14. Sompong, O.T.; Prasertsan, P.; Birkeland, N.K. Evaluation of methods for preparing hydrogen-producing seed inocula under thermophilic condition by process performance and microbial community analysis. Bioresour. Technol. 2009, 100, 909–918. [Google Scholar]
  15. Gavala, H.N.; Yenal, U.; Skiadas, I.V.; Westermann, P.; Ahring, B.K. Mesophilic and thermophilic anaerobic digestion of primary and secondary sludge. Effect of pre-treatment at elevated temperature. Water Res. 2003, 37, 4561–4572. [Google Scholar] [CrossRef]
  16. Ministry of Construction of the People’s Republic of China. Determination Method for Municipal Sludge in Wastewater Treatment Plant; Ministry of Construction of the People’s Republic of China: Beijing, China, 2005. [Google Scholar]
  17. APHA. Standard Methods for the Examination of Water and Wastewater; American Public Health Association (APHA): Washington, DC, USA, 2005; p. 21. [Google Scholar]
  18. Yu, Y.; Ye, H.; Wu, D.; Shi, H.; Zhou, X. Chemoenzymatic quantification for monitoring unpurified polysaccharide in rich medium. Appl. Microbiol. Biotechnol. 2019, 103, 7635–7645. [Google Scholar] [CrossRef]
  19. Da Ros, C.; Conca, V.; Eusebi, A.L.; Frison, N.; Fatone, F. Sieving of municipal wastewater and recovery of bio-based volatile fatty acids at pilot scale. Water Res. 2020, 174, 115633. [Google Scholar] [CrossRef]
  20. Soomro, A.F.; Ni, Z.; Ying, L.; Liu, J. The effect of ISR on OFMSW during acidogenic fermentation for the production of AD precursor: Kinetics and synergies. RSC Adv. 2019, 9, 18147–18156. [Google Scholar] [CrossRef]
  21. Lin, L.; Li, R.-H.; Li, X.-Y. Recovery of organic resources from sewage sludge of Al-enhanced primary sedimentation by alkali pretreatment and acidogenic fermentation. J. Clean. Prod. 2018, 172, 3334–3341. [Google Scholar] [CrossRef]
  22. Ren, N.; Guo, W.; Wang, X.; Xiang, W.; Liu, B.; Wang, X.; Ding, J.; Chen, Z. Effects of different pretreatment methods on fermentation types and dominant bacteria for hydrogen production. Int. J. Hydrogen Energy 2008, 33, 4318–4324. [Google Scholar] [CrossRef]
  23. Toledo-Alarcón, J.; Cabrol, L.; Jeison, D.; Trably, E.; Steyer, J.P.; Tapia-Venegas, E. Impact of the microbial inoculum source on pre-treatment efficiency for fermentative H2 production from glycerol. Int. J. Hydrogen Energy 2020, 45, 1597–1607. [Google Scholar] [CrossRef]
  24. Shao, M.; Guo, L.; She, Z.; Gao, M.; Zhao, Y.; Sun, M.; Guo, Y. Enhancing denitrification efficiency for nitrogen removal using waste sludge alkaline fermentation liquid as external carbon source. Environ. Sci. Pollut. Res. 2019, 26, 4633–4644. [Google Scholar] [CrossRef] [PubMed]
  25. Ahmad, A.A.; Idris, A. Release and recovery of phosphorus from wastewater treatment sludge via struvite precipitation. Desalination Water Treat. 2014, 52, 5696–5703. [Google Scholar] [CrossRef]
  26. Yin, J.; Yu, X.; Wang, K.; Shen, D. Acidogenic fermentation of the main substrates of food waste to produce volatile fatty acids. Int. J. Hydrogen Energy 2016, 41, 21713–21720. [Google Scholar] [CrossRef]
  27. Tomei, M.C.; Braguglia, C.M.; Mininni, G. Anaerobic degradation kinetics of particulate organic matter in untreated and sonicated sewage sludge: Role of the inoculum. Bioresour. Technol. 2008, 99, 6119–6126. [Google Scholar] [CrossRef] [PubMed]
  28. Jianguo, J.; Zhang, Y.; Li, K.; Wang, Q.; Gong, C.; Li, M. Volatile fatty acids production from food waste: Effects of pH, temperature, and organic loading rate. Bioresour. Technol. 2013, 143, 525–530. [Google Scholar] [CrossRef] [PubMed]
  29. Elefsiniotis, P.; Li, D. The effect of temperature and carbon source on denitrification using volatile fatty acids. Biochem. Eng. J. 2006, 28, 148–155. [Google Scholar] [CrossRef]
  30. Zhu, X.; Chen, Y. Reduction of N2O and NO Generation in Anaerobic−Aerobic (Low Dissolved Oxygen) Biological Wastewater Treatment Process by Using Sludge Alkaline Fermentation Liquid. Environ. Sci. Technol. 2011, 45, 2137–2143. [Google Scholar] [CrossRef]
  31. Gao, S.; Huang, Y.; Yang, L.; Wang, H.; Zhao, M.; Xu, Z.; Huang, Z.; Ruan, W. Evaluation the anaerobic digestion performance of solid residual kitchen waste by NaHCO3 buffering. Energy Convers. Manag. 2015, 93, 166–174. [Google Scholar] [CrossRef]
  32. Habicher, T.; John, A.; Scholl, N.; Daub, A.; Klein, T.; Philip, P.; Büchs, J. Introducing substrate limitations to overcome catabolite repression in a protease producing Bacillus licheniformis strain using membrane-based fed-batch shake flasks. Biotechnol. Bioeng. 2019, 116, 1326–1340. [Google Scholar] [CrossRef]
  33. Pu, Y.; Tang, J.; Wang, X.C.; Hu, Y.; Huang, J.; Pan, S.; Li, Y. Enhancing nitrogen removal from wastewater in sequencing batch reactors (SBRs) using additional carbon source produced from food waste acidogenic fermentation at different temperatures. Environ. Sci. Pollut. Res. Int. 2019, 26, 34645–34657. [Google Scholar] [CrossRef] [PubMed]
  34. Hernandez, D.; David, A.; Menges, E.; Searcy, C.A.; Afkhami, M.E. Environmental stress destabilizes microbial networks. ISME J. 2021, 15, 1722–1734. [Google Scholar] [CrossRef] [PubMed]
  35. Zhang, Y.; Carvalho, P.N.; Lv, T.; Arias, C.; Brix, H.; Chen, Z. Microbial density and diversity in constructed wetland systems and the relation to pollutant removal efficiency. Water Sci. Technol. 2015, 73, 679–686. [Google Scholar] [CrossRef] [PubMed]
  36. Iglesias-Iglesias, R.; Campanaro, S.; Treu, L.; Kennes, C.; Veiga, M.C. Valorization of sewage sludge for volatile fatty acids production and role of microbiome on acidogenic fermentation. Bioresour. Technol. 2019, 291, 121817. [Google Scholar] [CrossRef] [PubMed]
  37. Zhou, X.; Du, Y.; Liu, D.; Luo, J.; Yan, H.; Li, P.; Chen, J.; Zhang, Y. Enhanced bioproduction of volatile fatty acids from excess sludge by sodium alcohol ether sulphate. Chem. Eng. J. 2022, 450, 138288. [Google Scholar] [CrossRef]
  38. Yang, H.; Liu, J.; Hu, P.; Zou, L.; Li, Y. Carbon source and phosphorus recovery from iron-enhanced primary sludge via anaerobic fermentation and sulfate reduction: Performance and future application. Bioresour. Technol. 2019, 294, 122174. [Google Scholar] [CrossRef] [PubMed]
  39. Li, R.-H.; Guo, X.; Li, B.; Lin, L.; Li, P.; Wen, L.; Liang, J.; Li, X. Iron-enhanced primary sedimentation and acidogenic sludge fermentation to achieve self-sufficient organic carbon supply for enhanced nutrient removal in wastewater treatment. Resour. Conserv. Recycl. 2021, 164, 105220. [Google Scholar] [CrossRef]
  40. Joyce, A.; Ijaz, U.Z.; Nzeteu, C.; Vaughan, A.; Shirran, S.L.; Botting, C.H.; Quince, C.; Abram, F. Linking Microbial Community Structure and Function During the Acidified Anaerobic Digestion of Grass. Front. Microbiol. 2018, 9, 540. [Google Scholar] [CrossRef] [PubMed]
  41. Wei, X.; Ouyang, K.; Long, T.; Liu, Z.; Li, Y.; Qiu, Q. Dynamic Variations in Rumen Fermentation Characteristics and Bacterial Community Composition during In Vitro Fermentation. Fermentation 2022, 8, 276. [Google Scholar] [CrossRef]
  42. Chen, Y.; Chen, T.; Yin, J. Impact of N-butyryl-l-homoserine lactone-mediated quorum sensing on acidogenic fermentation under saline conditions: Insights into volatile fatty acids production and microbial community. Bioresour. Technol. 2023, 368, 128354. [Google Scholar] [CrossRef]
  43. He, Z.; Zou, Z.; Sun, Q.; Jin, H.; Yao, X.; Yang, W.; Tang, C.; Zhou, A.; Liu, W.; Ren, Y.; et al. Freezing-low temperature treatment facilitates short-chain fatty acids production from waste activated sludge with short-term fermentation. Bioresour. Technol. 2022, 347, 126337. [Google Scholar] [CrossRef] [PubMed]
  44. Rudakiya, D.M.; Narra, M. Microbial Community Dynamics in Anaerobic Digesters for Biogas Production. In Microbial Rejuvenation of Polluted Environment; Springer Singapore: Singapore, 2021; Volume 3, pp. 143–159. [Google Scholar]
  45. Guo, Y.; Hassan, F.U.; Li, M.; Tang, Z.; Peng, L.; Peng, K.; Yang, C. Effect of Hydrogen-Consuming Compounds on In Vitro Ruminal Fermentation, Fatty Acids Profile, and Microbial Community in Water Buffalo. Curr. Microbiol. 2022, 79, 220. [Google Scholar] [CrossRef] [PubMed]
Figure 1. VFA concentration (a) and acidogenesis efficiency (b) after acidogenic fermentation of glucose using different pretreatment methods.
Sustainability 16 03347 g001
Figure 2. Acidogenic fermentation of different sludge pretreatment groups: (a) SCOD and (b) VFAs concentration, (c) VFAs composition.
Sustainability 16 03347 g002
Figure 3. Acidogenic fermentation of CEPT sludge under different SIRs: kinetic analysis of (a) SCOD and (b) VFA concentration, (c) overal comparison of VFA composition; (d) acid production effect of unpretreated inoculum.
Sustainability 16 03347 g003
Figure 4. Acidogenic fermentation performance of CEPT sludge under different SIRs. (a) pH and (b) ammonia, (c) the protein concentrations and (d) protease activity, and (e) the polysaccharide concentration and (f) a-glucosidase activity.
Sustainability 16 03347 g004
Figure 5. Microbial community analysis. Alpha diversity of different (a) pretreatments and (b) SIRs, * represents p < 0.05, ** represents p < 0.01, and *** represents p < 0.001. Beta diversity of different (c) pretreatments and (d) SIRs interpreted by the PCoA based on the Bray–Curtis distance. (e) The abundance of bacteria at the phylum level.
Sustainability 16 03347 g005
Figure 6. Microbial correlation network analysis at the genus level of different (a) pretreatments and (b) SIRs. Lines in pink and green denote positive and negative correlations, respectively. Size and color of the nodes represent relative abundance and bacterial phylum, respectively.
Sustainability 16 03347 g006
Table 1. Characteristics of CEPT sludge.
ParametersUnitMean Value
pH 7.06 ± 0.03 *
TSg/L9.44 ± 0.14
VSg/L6.65 ± 0.22
TCODmgCOD/L11,727.27 ± 29.02
SCODmgCOD/L479.74 ± 32.40
VFAsmgCOD/L339.58 ± 48.95
TNmg/L529.97 ± 20.64
TPmg/L250.02 ± 10.03
Proteinsmg/L421.17 ± 29.18
Polysaccharidemg/L503.72 ± 7.33
* The mean and standard deviation values were calculated based on data from three experimental replicates.
Table 2. Kinetic parameters during CEPT sludge acidogenic fermentation with different pretreated inocula and SIRs.
StepParametersInoculum Pretreatments
ControlAlkaliAcidHeat4210.5
HydrolysisR20.93250.91560.91700.93890.96840.98240.98350.9655
α0.2728 ± 0.17680.3709 ± 0.19600.1896 ± 0.04010.2655 ± 0.02140.2242 ± 0.01040.1970 ± 0.00650.0965 ± 0.00330.0632 ± 0.0137
kH0.0941 ± 0.07380.1241 ± 0.08430.2564 ± 0.08970.4888 ± 0.09540.9195 ± 0.14300.9442 ± 0.10590.7176 ± 0.07840.2668 ± 0.0891
α•kH0.02570.04600.04860.12980.20620.18600.06920.0169
AcidogenesisR20.92090.95450.96510.93540.97820.98580.91960.9371
kVFAs1.074 ± 0.09391.185 ± 0.05951.021 ± 0.04961.798 ± 0.15952.214 ± 0.11973.094 ± 0.14351.437 ± 0.13880.6387 ± 0.0461
Table 3. Performance and effluent characteristics of batch tests with different pretreated inocula and SIRs (on the fifth day of fermentation).
ParametersUnitInoculum PretreatmentsSIRs
ControlAlkaliAcidHeat4210.5
SCODmgCOD/L1867.0 ± 94.52946.8 ± 45.22630.5 ± 61.23764.5 ± 350.22957.1 ± 9.72697.6 ± 144.91632.2 ± 9.7860.5 ± 38.6
VFAsmgCOD/L1330.4 ± 68.22888.6 ± 61.32557.8 ± 45.53215.9 ± 367.92723.0 ± 234.22265.5 ± 27.61453.4 ± 24.5827.0 ± 3.6
NH4-NmgN/L262.1 ± 19.7157.3 ± 20.1147.5 ± 12.6168.0 ± 14.3262.1 ± 0.1216.2 ± 0.3187.1 ± 0.8187.1 ± 0.8
PO4-PmgP/L7.4 ± 1.034.4 ± 7.335.2 ± 3.436.8 ± 6.726.2 ± 2.428.0 ± 1.423.2 ± 0.426.5 ± 0.7
VFAs yieldmgCOD/gVS131.4 ± 6.5372.6 ± 6.5282.4 ± 4.8401.9 ± 56.4331.4 ± 35.2266.9 ± 6.9147.6 ± 3.784.7 ± 0.5
Hydrolysis efficiency%16.3 ± 0.926.2 ± 0.423.1 ± 0.532.7 ± 3.624.6 ± 0.122.4 ± 1.213.6 ± 0.17.2 ± 0.3
Acidogenesis efficiency%11.4 ± 0.626.6 ± 1.421.4 ± 1.727.1 ± 3.022.7 ± 0.417.3 ± 0.411.5 ± 1.26.2 ± 0.03
N release%47.2 ± 2.629.7 ± 3.833.7 ± 7.629.6 ± 0.549.5 ± 0.0240.8 ± 0.0535.3 ± 0.237.2 ± 0.1
P release%2.9 ± 0.413.8 ± 2.914.1 ± 1.414.7 ± 2.710.5 ± 0.911.2 ± 0.69.3 ± 0.10.6 ± 0.3
VFAs/NH4-NmgCOD/mgN5.1 ± 0.318.6 ± 3.0517.7 ± 1.119.3 ± 3.811.3 ± 0.0412.5 ± 0.78.7 ± 0.14.4 ± 0.2
VFAs/PO4-PmgCOD/mgP224.3 ± 35.774.0 ± 2.874.6 ± 9.485.7 ± 4.9113.5 ± 10.796.3 ± 0.470.2 ± 0.632.5 ± 2.3
Table 4. The abundance of bacteria at order level under different inoculum pretreatments and SIRs.
ClassOder (%)Inoculum PretreatmentsSIRs
ControlAlkaliAcidHeat4210.5
ClostridiaClostridia3.6623.0313.8529.1333.3839.7942.9549.54
BacteroidiaBacteroidia15.3016.3518.2011.4112.8613.2119.449.16
ClostridiaClostridia15.8713.208.7510.0817.1613.0910.258.89
ClostridiaClostridia6.215.423.644.959.756.232.720.26
GammaproteobacteriaGammaproteobacteria1.736.9613.556.622.411.811.431.00
ClostridiaClostridia1.426.517.125.691.713.055.772.00
ActinobacteriaActinobacteria5.813.883.374.454.392.951.360.32
BacilliBacilli3.612.442.673.432.522.884.603.16
NegativicutesNegativicutes0.492.116.801.550.160.270.5512.86
ActinobacteriaActinobacteria3.022.601.883.251.181.730.750.23
SynergistiaSynergistia4.770.550.550.491.191.050.350.40
BacilliBacilli1.341.211.351.281.461.050.950.79
ActinobacteriaActinobacteria2.790.870.671.271.081.200.460.14
NegativicutesNegativicutes0.141.802.561.410.060.300.362.08
ClostridiaClostridia0.771.231.701.540.750.671.100.53
GammaproteobacteriaGammaproteobacteria0.220.440.690.550.310.450.244.87
ClostridiaClostridia0.711.281.611.850.740.740.500.28
AlphaproteobacteriaAlphaproteobacteria1.530.770.880.980.710.700.420.17
BacteroidiaBacteroidia0.281.170.831.560.220.430.500.05
ChloroflexiaChloroflexia2.050.300.380.250.550.600.430.26
Disclaimer/Publisher’s Note: The statements, opinions and data contained in all publications are solely those of the individual author(s) and contributor(s) and not of MDPI and/or the editor(s). MDPI and/or the editor(s) disclaim responsibility for any injury to people or property resulting from any ideas, methods, instructions or products referred to in the content.

