Abstract
In the past four years, the number of prosumers utilizing photovoltaic (PV) installations in Poland has increased significantly, exceeding 1.3 million, reaching a total power capacity of 10.5 GW by the end of 2023. This paper presents a three-year energy yield analysis of the prosumer PV systems operating in Eastern Poland. The 9.6 kW system consists of high-efficiency monocrystalline photovoltaic modules in half-cut technology. Over the three years of operation, specific yields have been analyzed along with weather parameters, such as solar intensity, outdoor temperature, humidity, wind speed, rainfall, or snowfall. The average annual final yield was found to be relatively high, exceeding 1000 kWh·kW−1 in each of the analysed years. The highest monthly specific yields of the analysed period were noticed during the summer, reaching the maximum value of 164 kWh·kW−1 in 2022. The daily final yields varied from a minimum of 0.15 kWh·kW−1 in Winter 2021 to a maximum of 6.8 kWh·kW−1 in Spring 2022. Weather conditions increasing the energy yields, such as low average ambient temperatures together with high insolation periods, were noticed. Energy production in such favorable conditions reached a surprisingly high value of energy yield in April 2020, comparable to the summer months (151.0 kWh·kW−1). The occurrence of heavy rainfall in summer was also noted as a desirable effect that leads to the natural cleaning of the PV modules. The average performance ratio during the analyzed period was found to be 0.85. The energy production of the PV system allowed the reduction of about 21 tons of CO2 emission.
1. Introduction
Energy production from renewable sources (RESs) has emerged as a critical issue in many countries worldwide. The share of fossil fuels in the electricity mix is predicted to decline from 59% to 12% by 2050; therefore, replacing fossil fuels with renewable sources is of high importance [1,2]. Among others, photovoltaics play a pivotal role in the RES sector. In accordance with EU Parliament Regulation and the long-term outlook (2021–2030) for energy and climate in Poland [3,4], the development of the PV sector in Poland aligns with the fundamental objectives for renewable energy sources (RES) share in gross final energy consumption. It also leads to the achievement of the objectives related to the greenhouse gas (GHG) reduction target proposed by the European Commission in [5] and new RES targets outlined in the REPowerEU plan [6].
In our previous works related to the energy yield assessment of several PV rooftop systems located in the temperate climate of Poland [7,8], attention was paid to the sharp increase in the sector of prosumer’s photovoltaic installations due to several government programs, some of which are described in [9]. The significant growth of Poland’s photovoltaic (PV) market has continued. The total power capacity in Poland, at the end of the first quarter of 2023, exceeded 13 GW, of which 74% belonged to the prosumers (micro installations up to 50 kW), 21% to small systems up to 1000 kW, and 5% to large PV plants. The share of PV systems in electric power production from renewable sources increased from about 3% in 2019 to above 23% three years later [10].
Many papers related to the performance evaluation of rooftop PV systems can be found in the scientific literature. A long-term evaluation study of PV specific yields in Germany has been presented by te Heesen et al. [11]. The analysis showed the south–north gradient with the lowest value in the north of the country (816 kWh/kW in 2017) and the highest in the south (1049 kWh/kW in 2018). The performance of several European countries, such as the Netherlands, Belgium, France, and Italy, has also been comprehensively investigated by Schardt and te Heesen [12]. The performance ratio ranged from a minimum value of 0.72 to a maximum of 0.76 over the entire period (2012–2019). The average specific yield varied from 947 kWh·kW−1 in the Netherlands to 1195 kWh·kW−1 in Italy and was also characterized by a latitude-dependent gradient. Other research on the PV systems energy yield in Croatia revealed a range of specific yields between 1065 kWh·kW−1 and 1116 kWh·kW−1 depending on the technology of the PV modules. The yearly performance ratio of the monocrystalline PV array was found to be 74.59%, while, for the polycrystalline, it was 73.75% [13]. Annual specific yield and performance of PV systems in Hungary were presented in the work of Atsu et al. [14]. The energy output ranged from 796.16 kWh·kW−1 for a-Si technology to 1106.47 kWh·kW−1, with a performance ratio of about 77%, for the pc-Si system. A final yield of about 1296 kWh·kW−1 with the PR of 0.83 was obtained for the PV system located in Spain by Muñoz-Rodriguez et al. [15]. In the papers of Adaramola [16,17], a final yield of 931 kWh/kW and performance ratio of 83% were noticed. An in-depth analysis of rooftop PV installations in a tropical monsoon region of central Vietnam, covering a longer period, was presented in the work of Nguyen et al. [18]. PR varied from 58% to 78%. The results of the average daily final yield (about 3 kWh/kW/d) were compared with the results obtained by other researchers worldwide. The performance of the PV system of a domestic house in Bahrain in 2 years of operation was investigated by Alnaser [19]. The average PR was found to be 73%. The annual energy production of the PV rooftop systems installed on several buildings was also investigated by Khairi et al. [20]. The yearly final yield values changed in the range of 1159 kWh·kW−1–1302 kWh·kW−1. Several research studies related to rooftop systems in Poland can also be found in the scientific literature [21,22,23,24].
In this work, significant attention was paid to the performance analysis of the rooftop PV system situated in Poland. The main objective was to present a wide perspective of the PV system operation in order to provide useful information about the energy production from photovoltaics in high-latitude locations. A long period of analysis was shown, which is new in terms of research about PV systems installed in Poland, especially if the newest monocrystalline half-cut technology is considered. Moreover, a detailed analysis of the weather conditions during the analysed period was carried out to understand their positive and negative impact on the PV system performance. Among others, such weather conditions as low temperature combined with high insolation periods or occurrence of heavy rains in summer months or snow in the winter were presented. Finally, similarly to other work in the field [25], the paper demonstrates long-term environmental benefits by showing the amount of CO2 emission that can be avoided due to the investment in rooftop PV systems in the location of Poland.
To the best of the authors’ knowledge, there is a limited number of papers in the literature considering the performance of rooftop PV systems in Poland over an extensive period. The presented work addresses the gap in knowledge in this field.
2. Materials and Methods
2.1. PV System Description
The rooftop PV system under scrutiny (Figure 1) was installed in the Lublin Voivodeship of Poland (51°126′ N and 23°427′ E) and was commissioned in June 2019. In accordance with the Köeppen−Geiger classification, the Lublin region is determined by a temperate climate with full humidity and warm summers [26]. According to the Polish standard, PN-EN 12831:2006 [27], it is characterized by a mean value of yearly temperature and irradiation of 7.6 °C and 1123 kWh/m2, respectively [28,29].
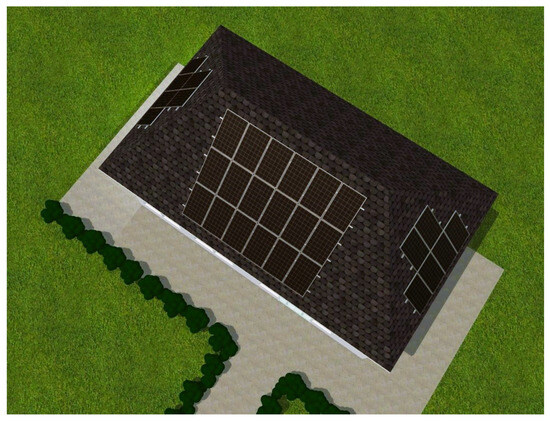
Figure 1.
Visualization of the PV system.
The PV system, with a total power capacity of 9.6 kW, contained 30 monocrystalline silicon PV modules fabricated with mono-PERC, half-cut technology, with different orientations and inclinations. It consisted of two parts. In the first, 18 series-connected PV modules were installed facing south at a 45° tilt angle. Another part comprises 12 PV modules, with six oriented eastward and six westward. The most relevant parameters of the equipment used in the PV installation provided by the manufacturer can be found in Table 1.

Table 1.
Electrical parameters of the PV modules (at STC) and inverter used in the PV system.
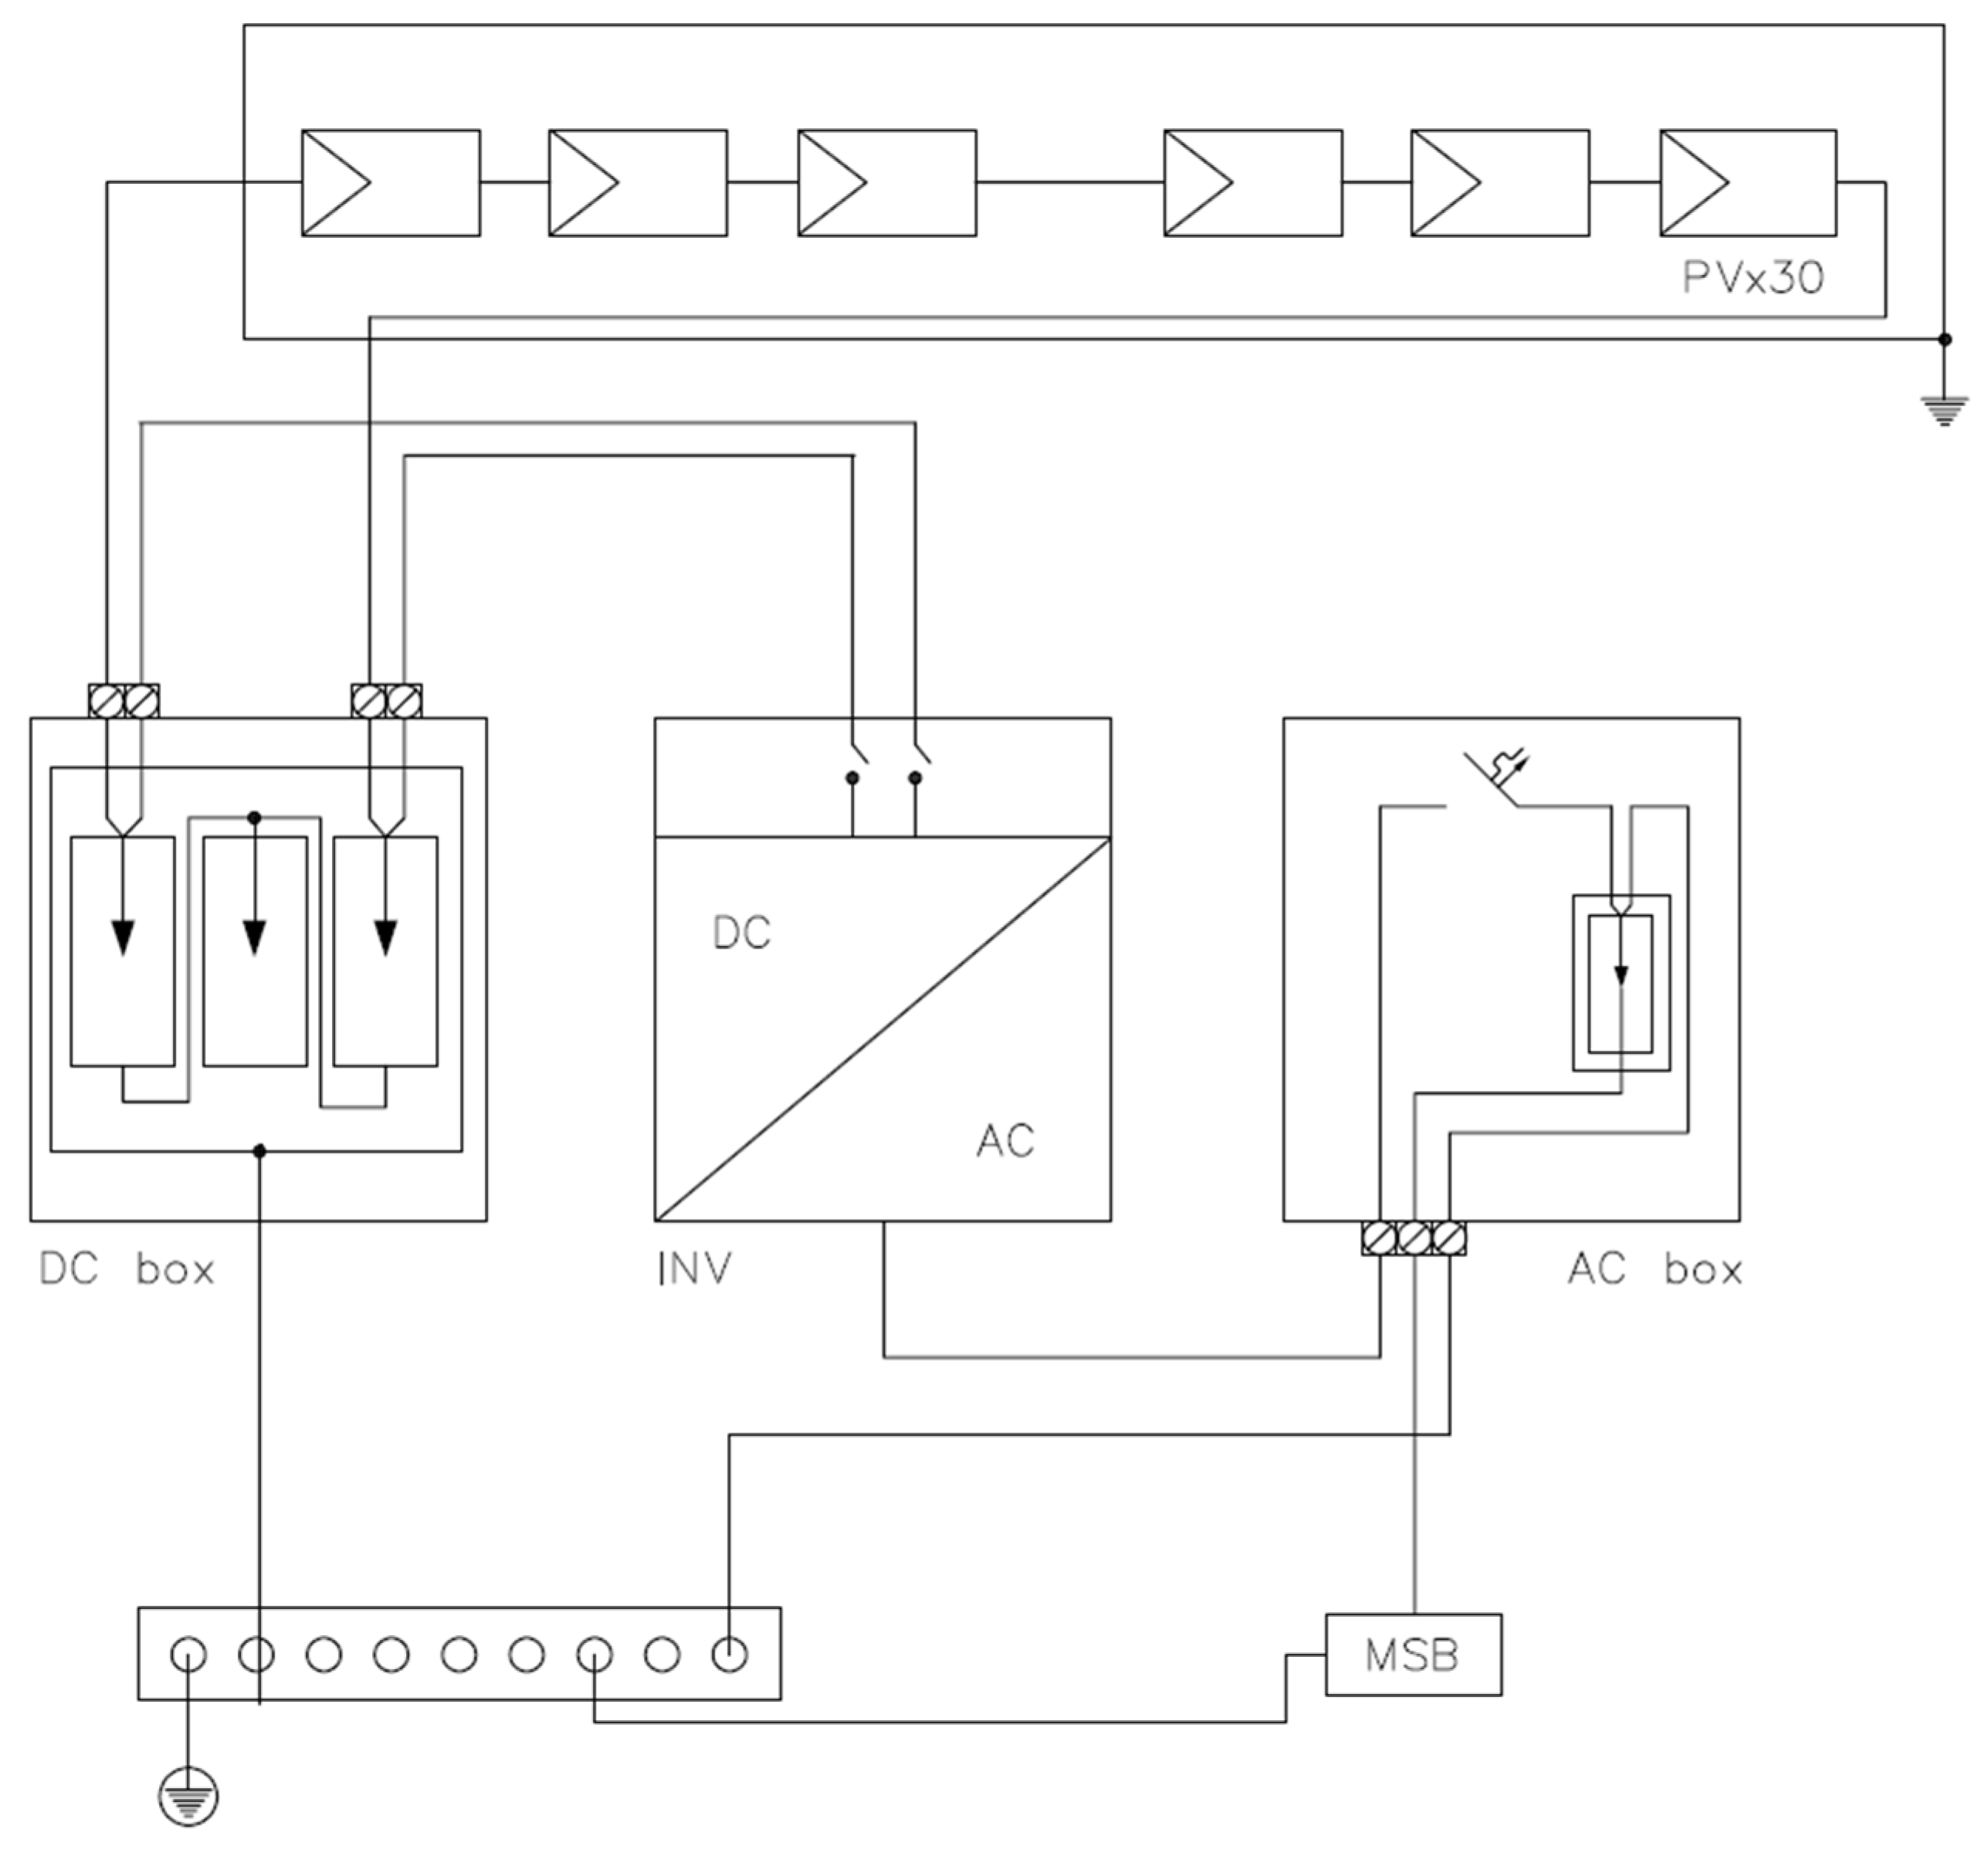
Both subfields were connected to an 8000 W Solar Edge inverter SE50K, characterized by a high-efficiency factor of 98%, dedicated to small and medium-sized photovoltaic installations up to 10 kW. Due to the consistent input voltage system, the SolarEdge inverter functions optimally, irrespective of the solar panel quantity or prevailing weather conditions. During the analyzed period, the PV system was operating without interruption, and the data was collected without any failures or interruptions due to a smart optimization system which ensures high efficiency of conversion. The energy generated by on-grid installation is directly used to fulfill the energy requirements of households, and the surplus is then transferred to the grid. The scheme of connections can be found in Figure 2. More details about the system can be found in the work of Grochecka [30].
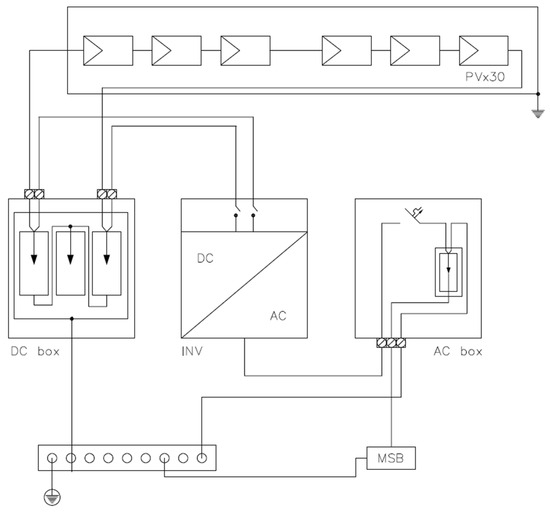
Figure 2.
Schematic diagram of analyzed PV system.
To investigate the influence of the climate conditions on the performance of the PV system, the weather data were measured by a weather station located about 50 km away from the analyzed PV system and provided by the Institute of Meteorology and Water Management [31]. Parameters such as irradiance (in W/m2), temperature (in °C), humidity (in %), wind speed (m/s), precipitation (mm) and snow depth (cm) were taken into account. A measurement of 1 mm denotes 1 L of water from precipitation per m2 of surface.
The data was analyzed and presented using Matlab/Simulink® R2022b (Natick, MA, USA) computing software.
2.2. Performance Metrics
Based on the works of [32,33,34,35], in relation to the performance of the PV systems and in accordance with the IEC 61724:2021-1 standard [36], relevant metrics were computed to evaluate the PV rooftop system under scrutiny. These include daily and monthly reference yields (Yr, in Wh∙W−1), daily and monthly final (AC) yields (Yf, in Wh∙W−1), as well as monthly performance ratios (PR).
The reference yield (Yr), which denotes the reference irradiance hours, can be calculated using Equation (1) in which Hi denotes in-plane irradiation collected during a given period (here: a day and Hm in terms of a month) and G* is the irradiance at standard test conditions (1000 W/m2). Daily insolation was computed according to Equation (2) as a numerical integration of the irradiance () data, measured by the nearest weather station, with a time interval () equal to one minute. Monthly irradiation was computed using Equation (3).
In the equations related to the performance metrics (2)–(5), L is the total number of irradiance values collected during the analyzed period, while N is the number of days in a month. It should be mentioned that subscript i refers to daily values, while m refers to a monthly period.
Similarly, daily energy can be computed using power output produced by the PV system over a day, according to Equation (4).
where is the k-th registered output AC power and is the k-th time step. The power data were collected by inverters’ monitoring software with an interval of 5 min. Monthly energy is given by Equation (5).
The final yield Yf (kWh∙kW−1) was calculated based on daily (Ei) or monthly (Em) energy output divided by the power capacity of the PV system P* (Equation (6)). It represents the number of hours the system has been operating at its rated power.
The performance ratio of the PV system can be computed by dividing the final yield by the reference yield using Equation (7). PR provides information about the quality of the PV system regardless of the power capacity or location [37].
3. Results and Discussion
3.1. Weather Conditions
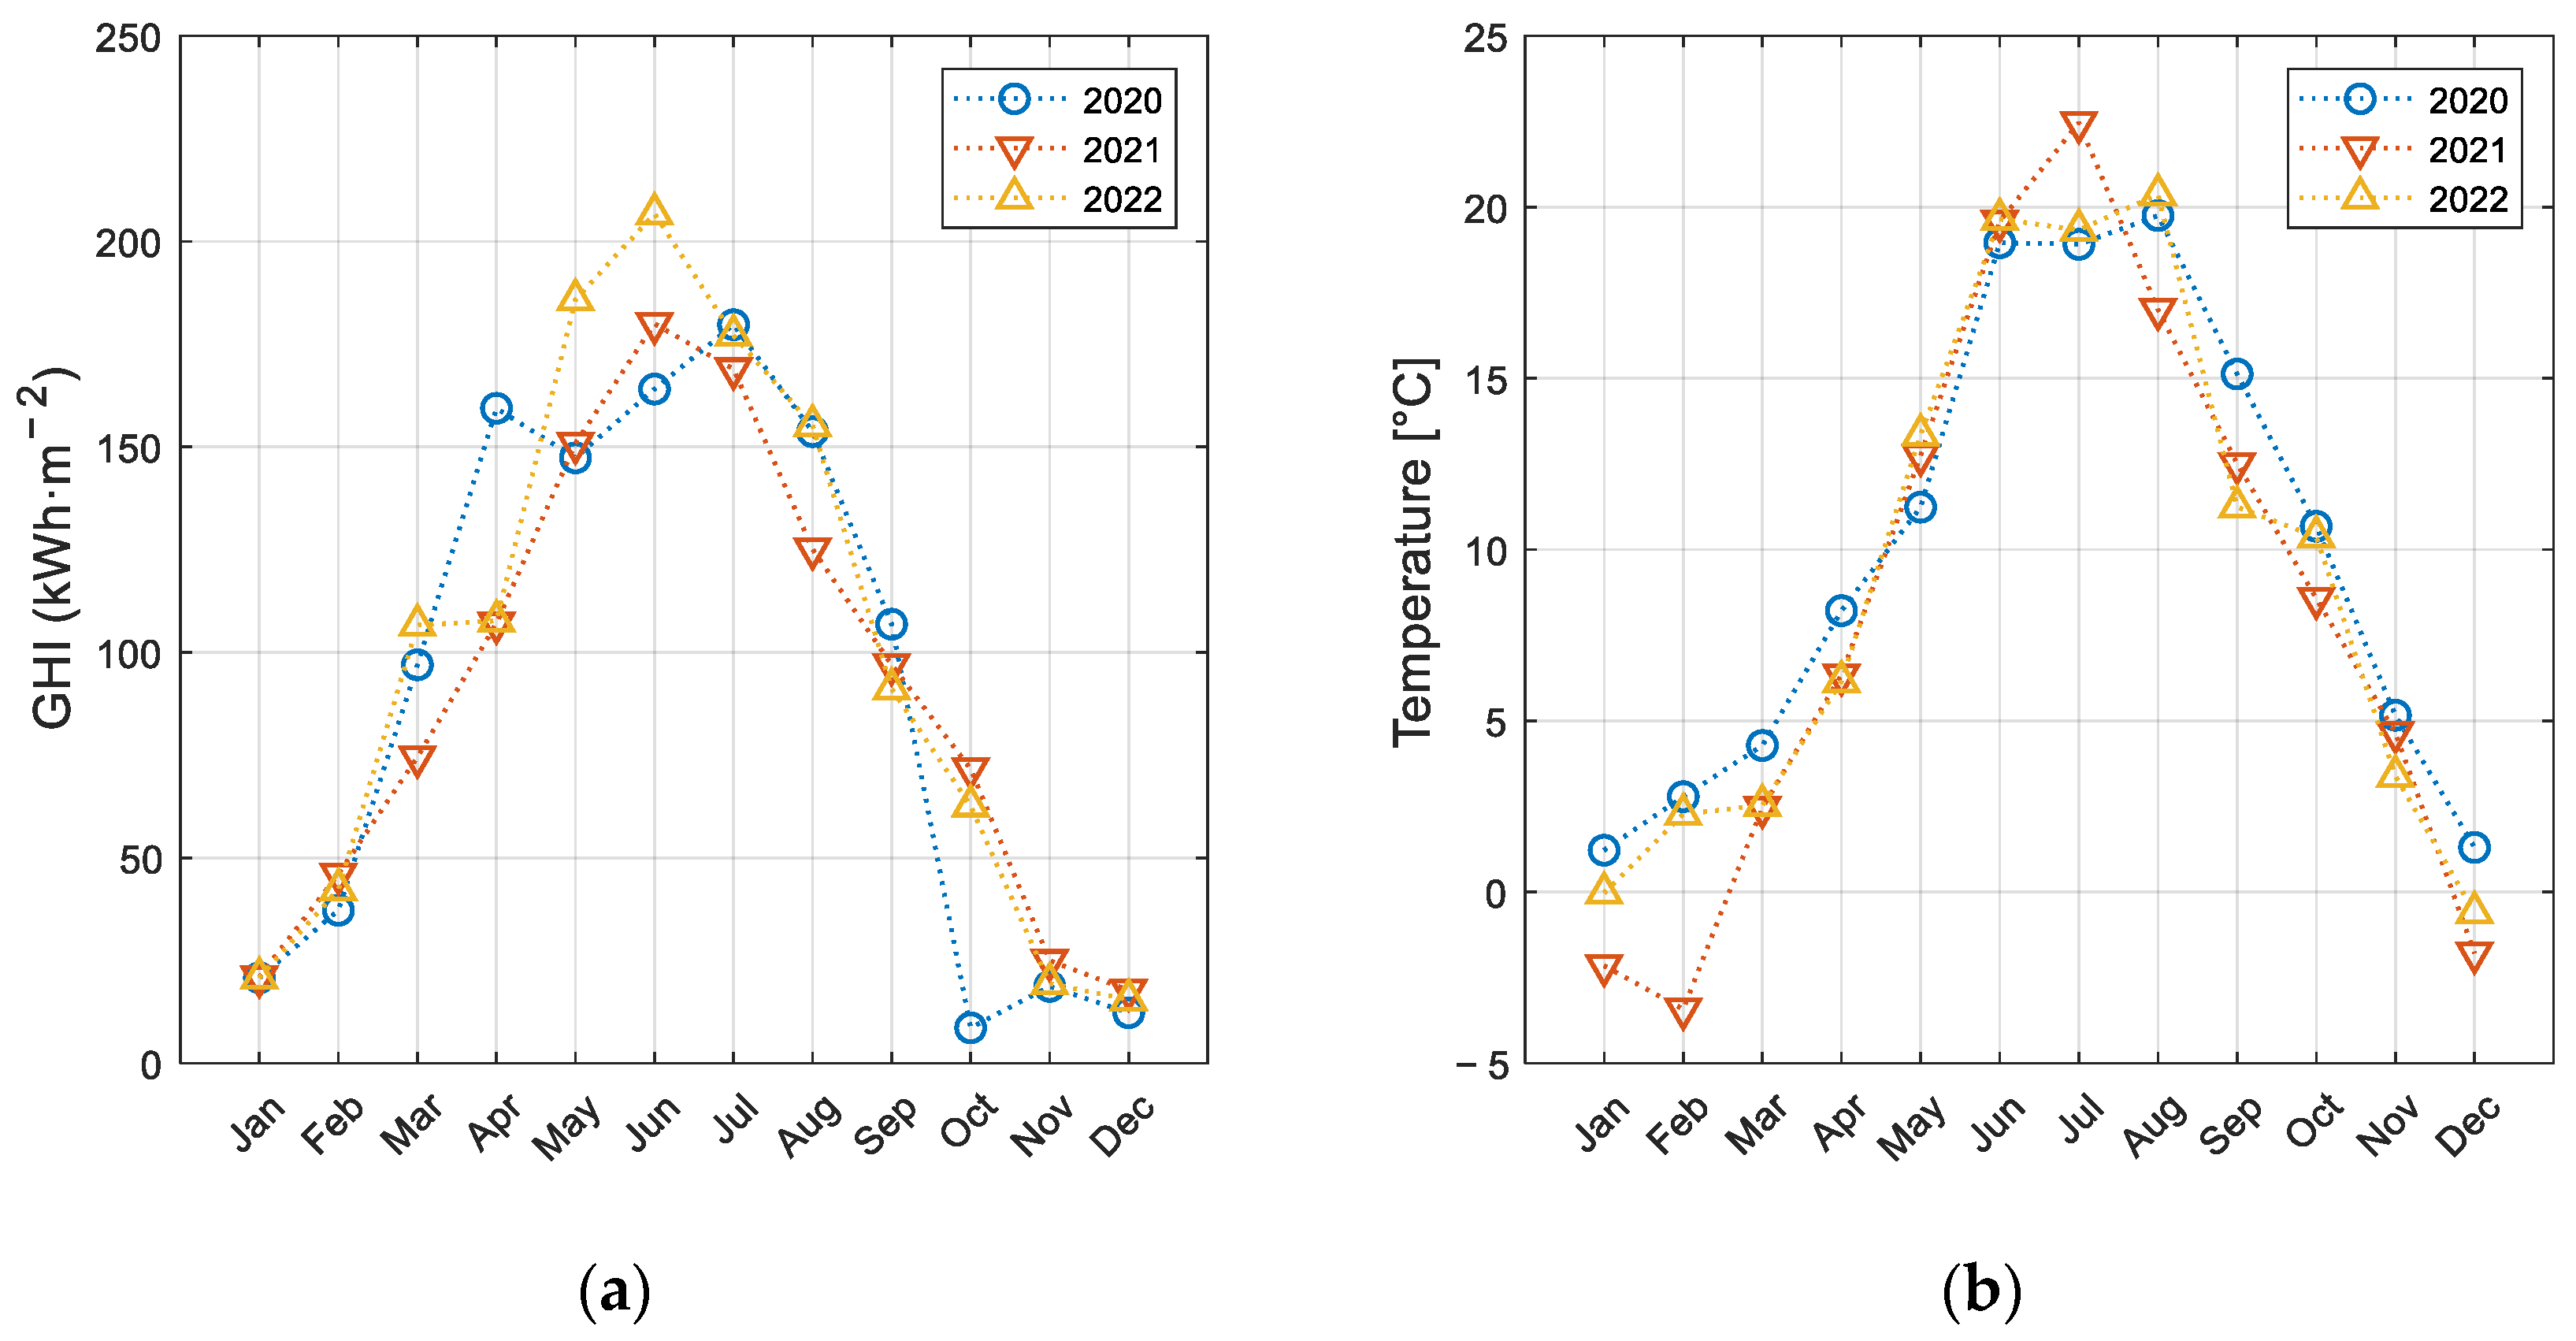
Figure 3 shows the results of monthly global horizontal irradiation (GHI) and ambient temperature measured by the weather station located 50 km away from the PV system under study. The measurements were taken during the years of PV system operation, i.e., from 2020 to 2022. The characteristic shape of the irradiation plot for high-latitude locations, with low insolation during the winter months and high in the summer half-year, can be observed in Figure 3a. The peak irradiation over the three-year period was recorded in June 2022 at a value of about 206 kWh·m−2. June was also characterized by favorable irradiance conditions in 2021 with a value of about 180 kWh·m−2. A similar value (179.7 kWh·m−2) was measured in July 2020. The months with the least insolation, from November to January, mostly did not exceed 20 kWh·m−2. Yearly irradiation measured by the weather station ranged between 1084.9 kWh·m−2 in 2021 and 1191.0 kWh·m−2 in 2022.
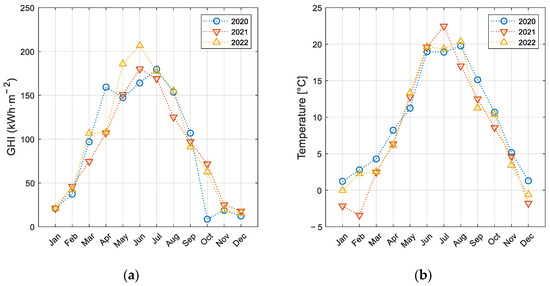
Figure 3.
Monthly global irradiation on horizontal plane (GHI) (a) and ambient temperature (b) registered over the studied period of 2020–2022.
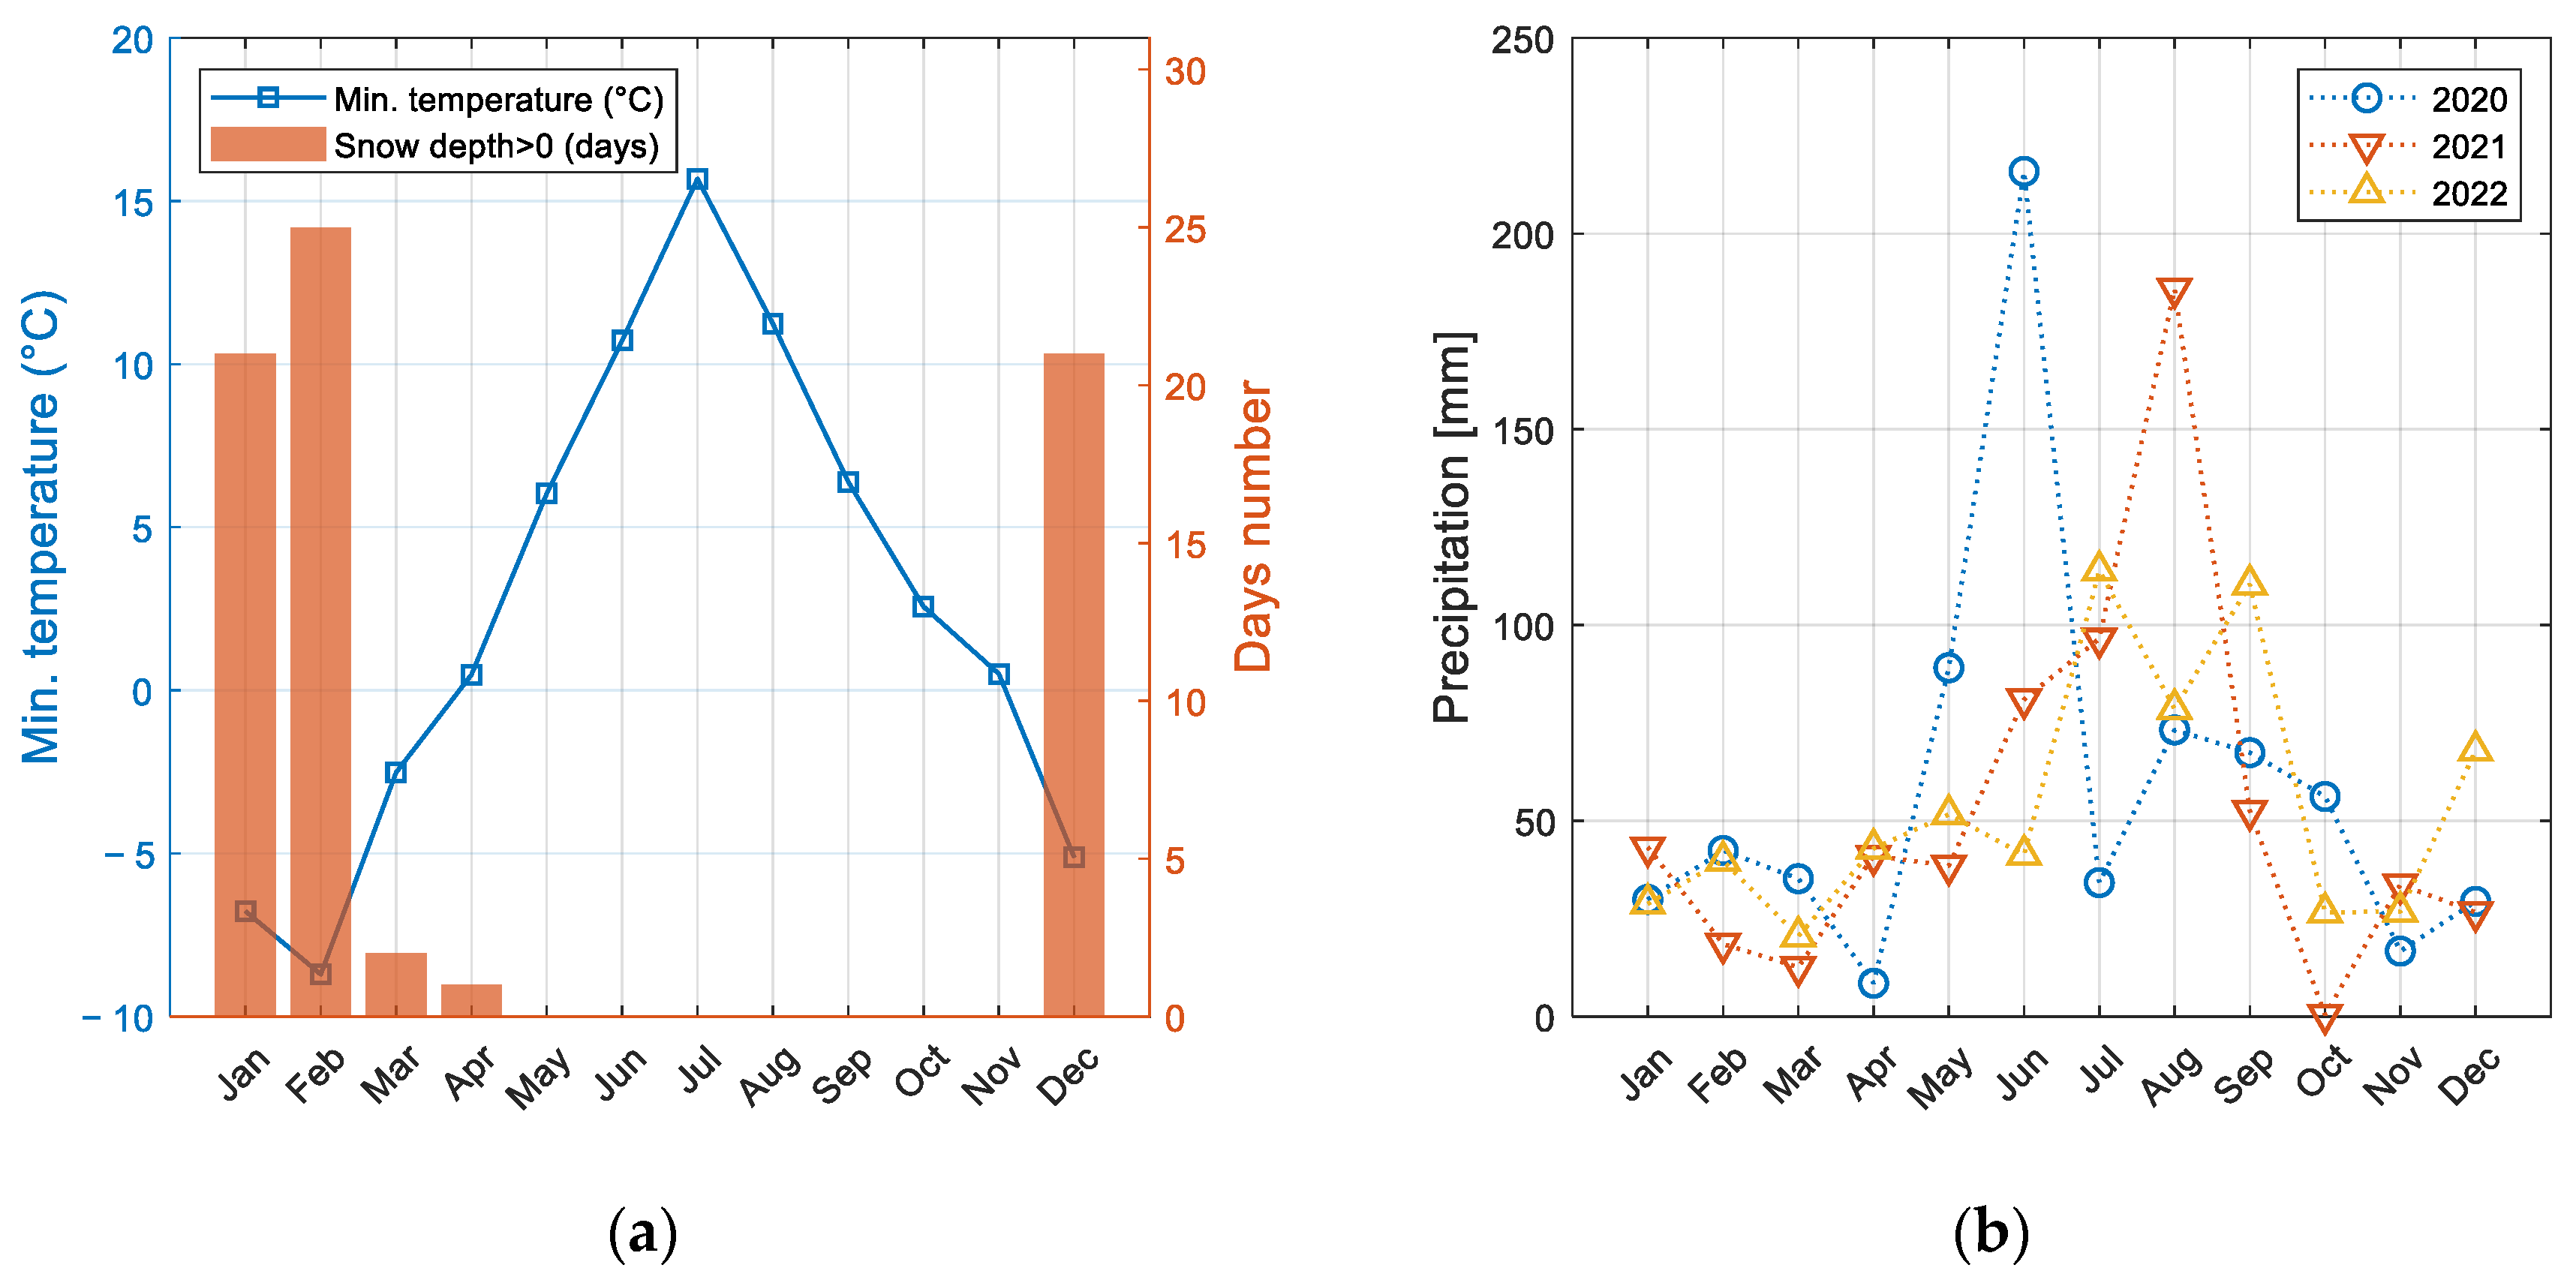
The monthly average ambient temperature shown in Figure 3b strongly depends on the season of the year. During the analyzed period, the temperature ranged from −3.4 °C in February 2021 to 22.5 °C in July of the same year. In the summer months (from June to August), it fluctuated at around 20 °C, while in winter it was around 0 °C. The spring and autumn months were characterized by average temperatures of around 10 °C. Figure 4a shows the monthly average minimum temperature along with the number of days with registered snow depths in 2021. Relatively low average minimum temperatures in the winter months of 2021, ranging between −5.1 °C in December and −8.7 °C in February, provided favorable conditions for the maintenance of snow cover on most winter days. Additionally, 21 days with snow cover were detected in January and December, while 25 days with snow cover were noticed in February. Compared with other years in the period under scrutiny, a relatively high number of days with snow cover was observed in 2022, with 13 days featuring in January and 20 in December. The average minimum temperatures in these months were equaled to −3.3 °C and −4.0 °C, respectively. Unlike the following years, 2020 was characterized by a low number of days with snow depth (five in winter months) and a slightly higher average minimum temperature of about −2.2 °C. As was studied in the work of Øgaard et al. [38], snow cover significantly affects the performance of the PV system due to shading or partial shading of the PV modules.
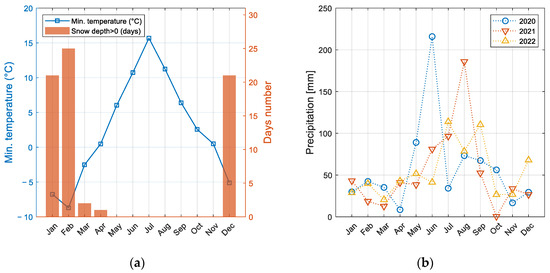
Figure 4.
The monthly minimum temperature, days with snow depth above zero (a) and monthly precipitation (b) measured over the studied period of 2020–2022.
Precipitation is an important factor that can prevent a decrease in PV system efficiency due to dust or dirt through natural cleaning [39]. Figure 4b depicts the monthly precipitation registered in the analyzed three years. As shown in the figure, a relatively high level of rainfall was observed in the months of the summer half-year, which is desirable taking into account that the solar insolation is also the highest in these months. Yearly sums of precipitation in the analyzed period ranged from 630 mm (2021) to 698 mm (2020).
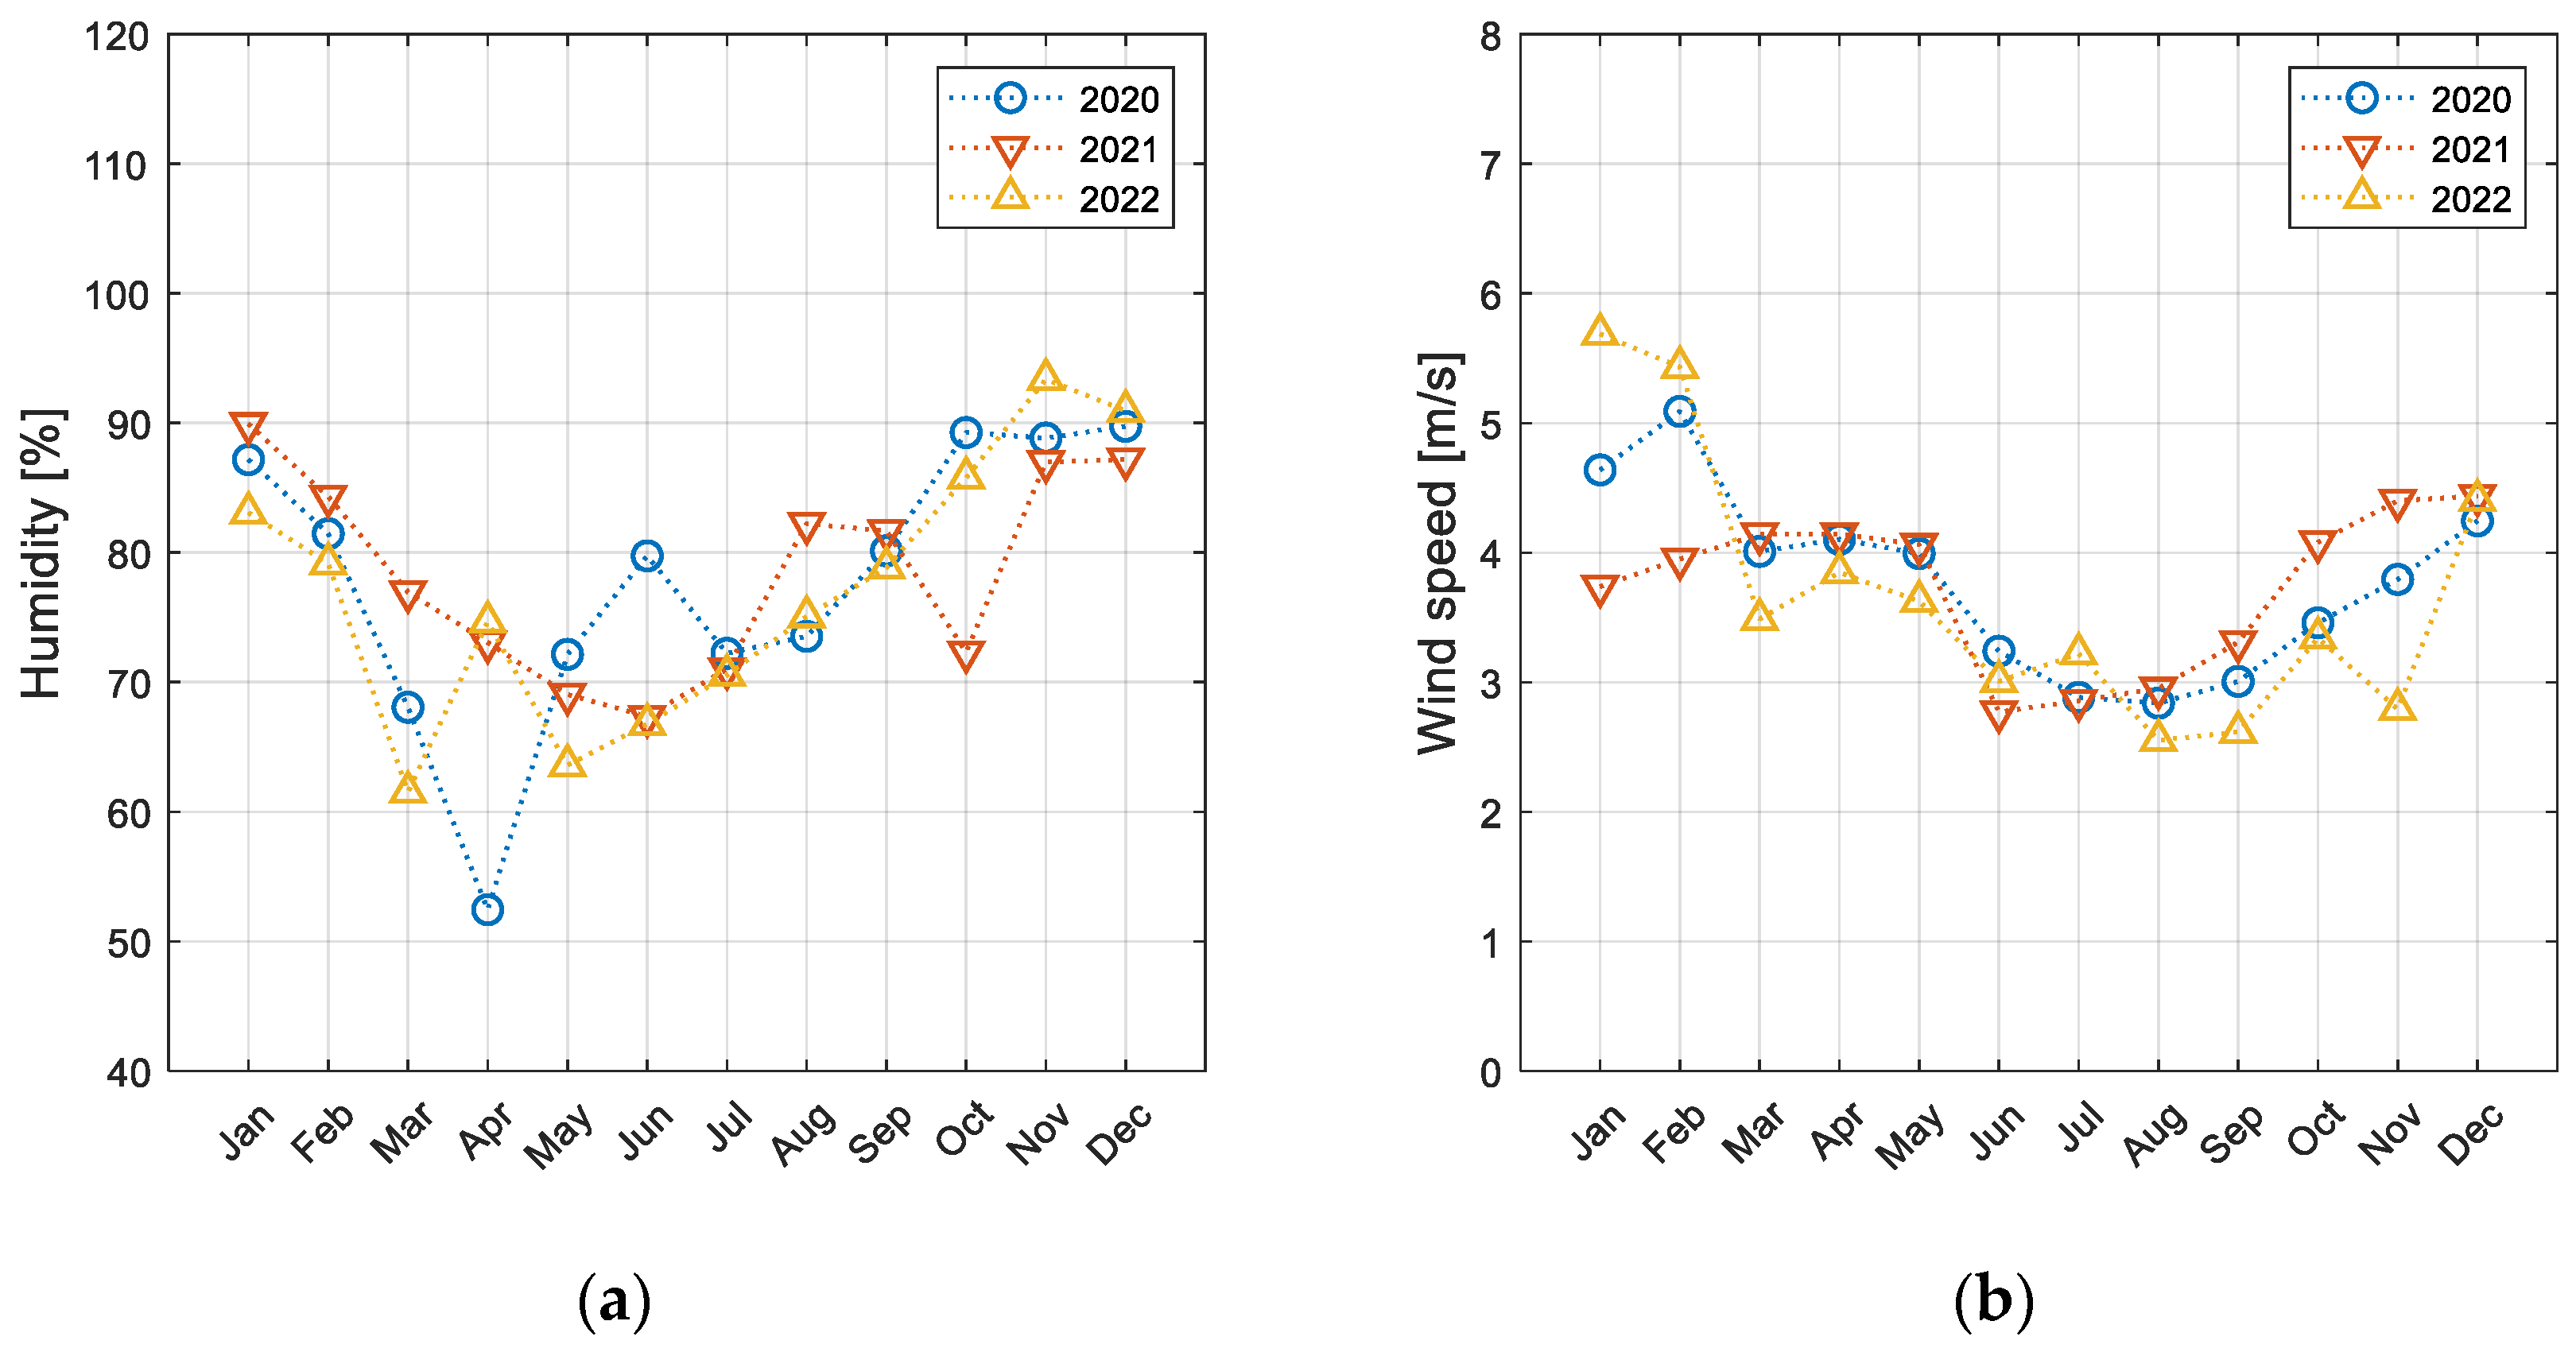
In Figure 5a,b, the average daily humidity with average daily wind speed were shown. The winter half-year period is characterized by a higher average relative humidity, ranging from about 70% in March 2020 to a maximum of 93.3% in November 2022. In the summer half-year, the relative humidity ranges between 60% and 80%. The daily average wind speed reached its highest value in the winter months, with a maximum of about 5.7 m/s in January 2022. The minimum value, 2.5 m/s, was noticed in August 2022. During the high-insolation period, when the energy production from the PV system was at its highest, the daily average wind speed was about 3 m/s.
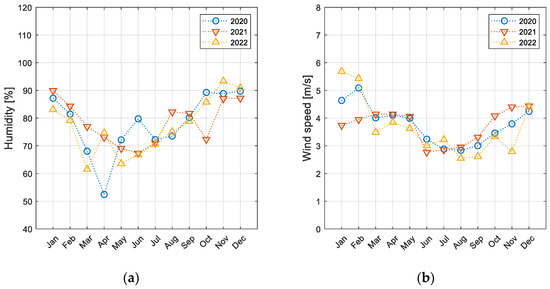
Figure 5.
Daily average humidity (a) and average daily wind speed (b) in each month over the studied period of 2020–2022.
The weather conditions have a significant impact on PV systems’ energy yield, especially solar radiation and temperature. Presented analysis allows a certain regularity to be assumed, which is of high importance in terms of energy production prognosis. However, the occurrence of periods with relatively high insolation during cold spring months (e.g., in March of 2022 or in April 2020) can be noticed. As can be seen in the further analysis, it has a significant influence on energy production, which should be taken into account for energy production prognoses from PV.
3.2. PV System Performance
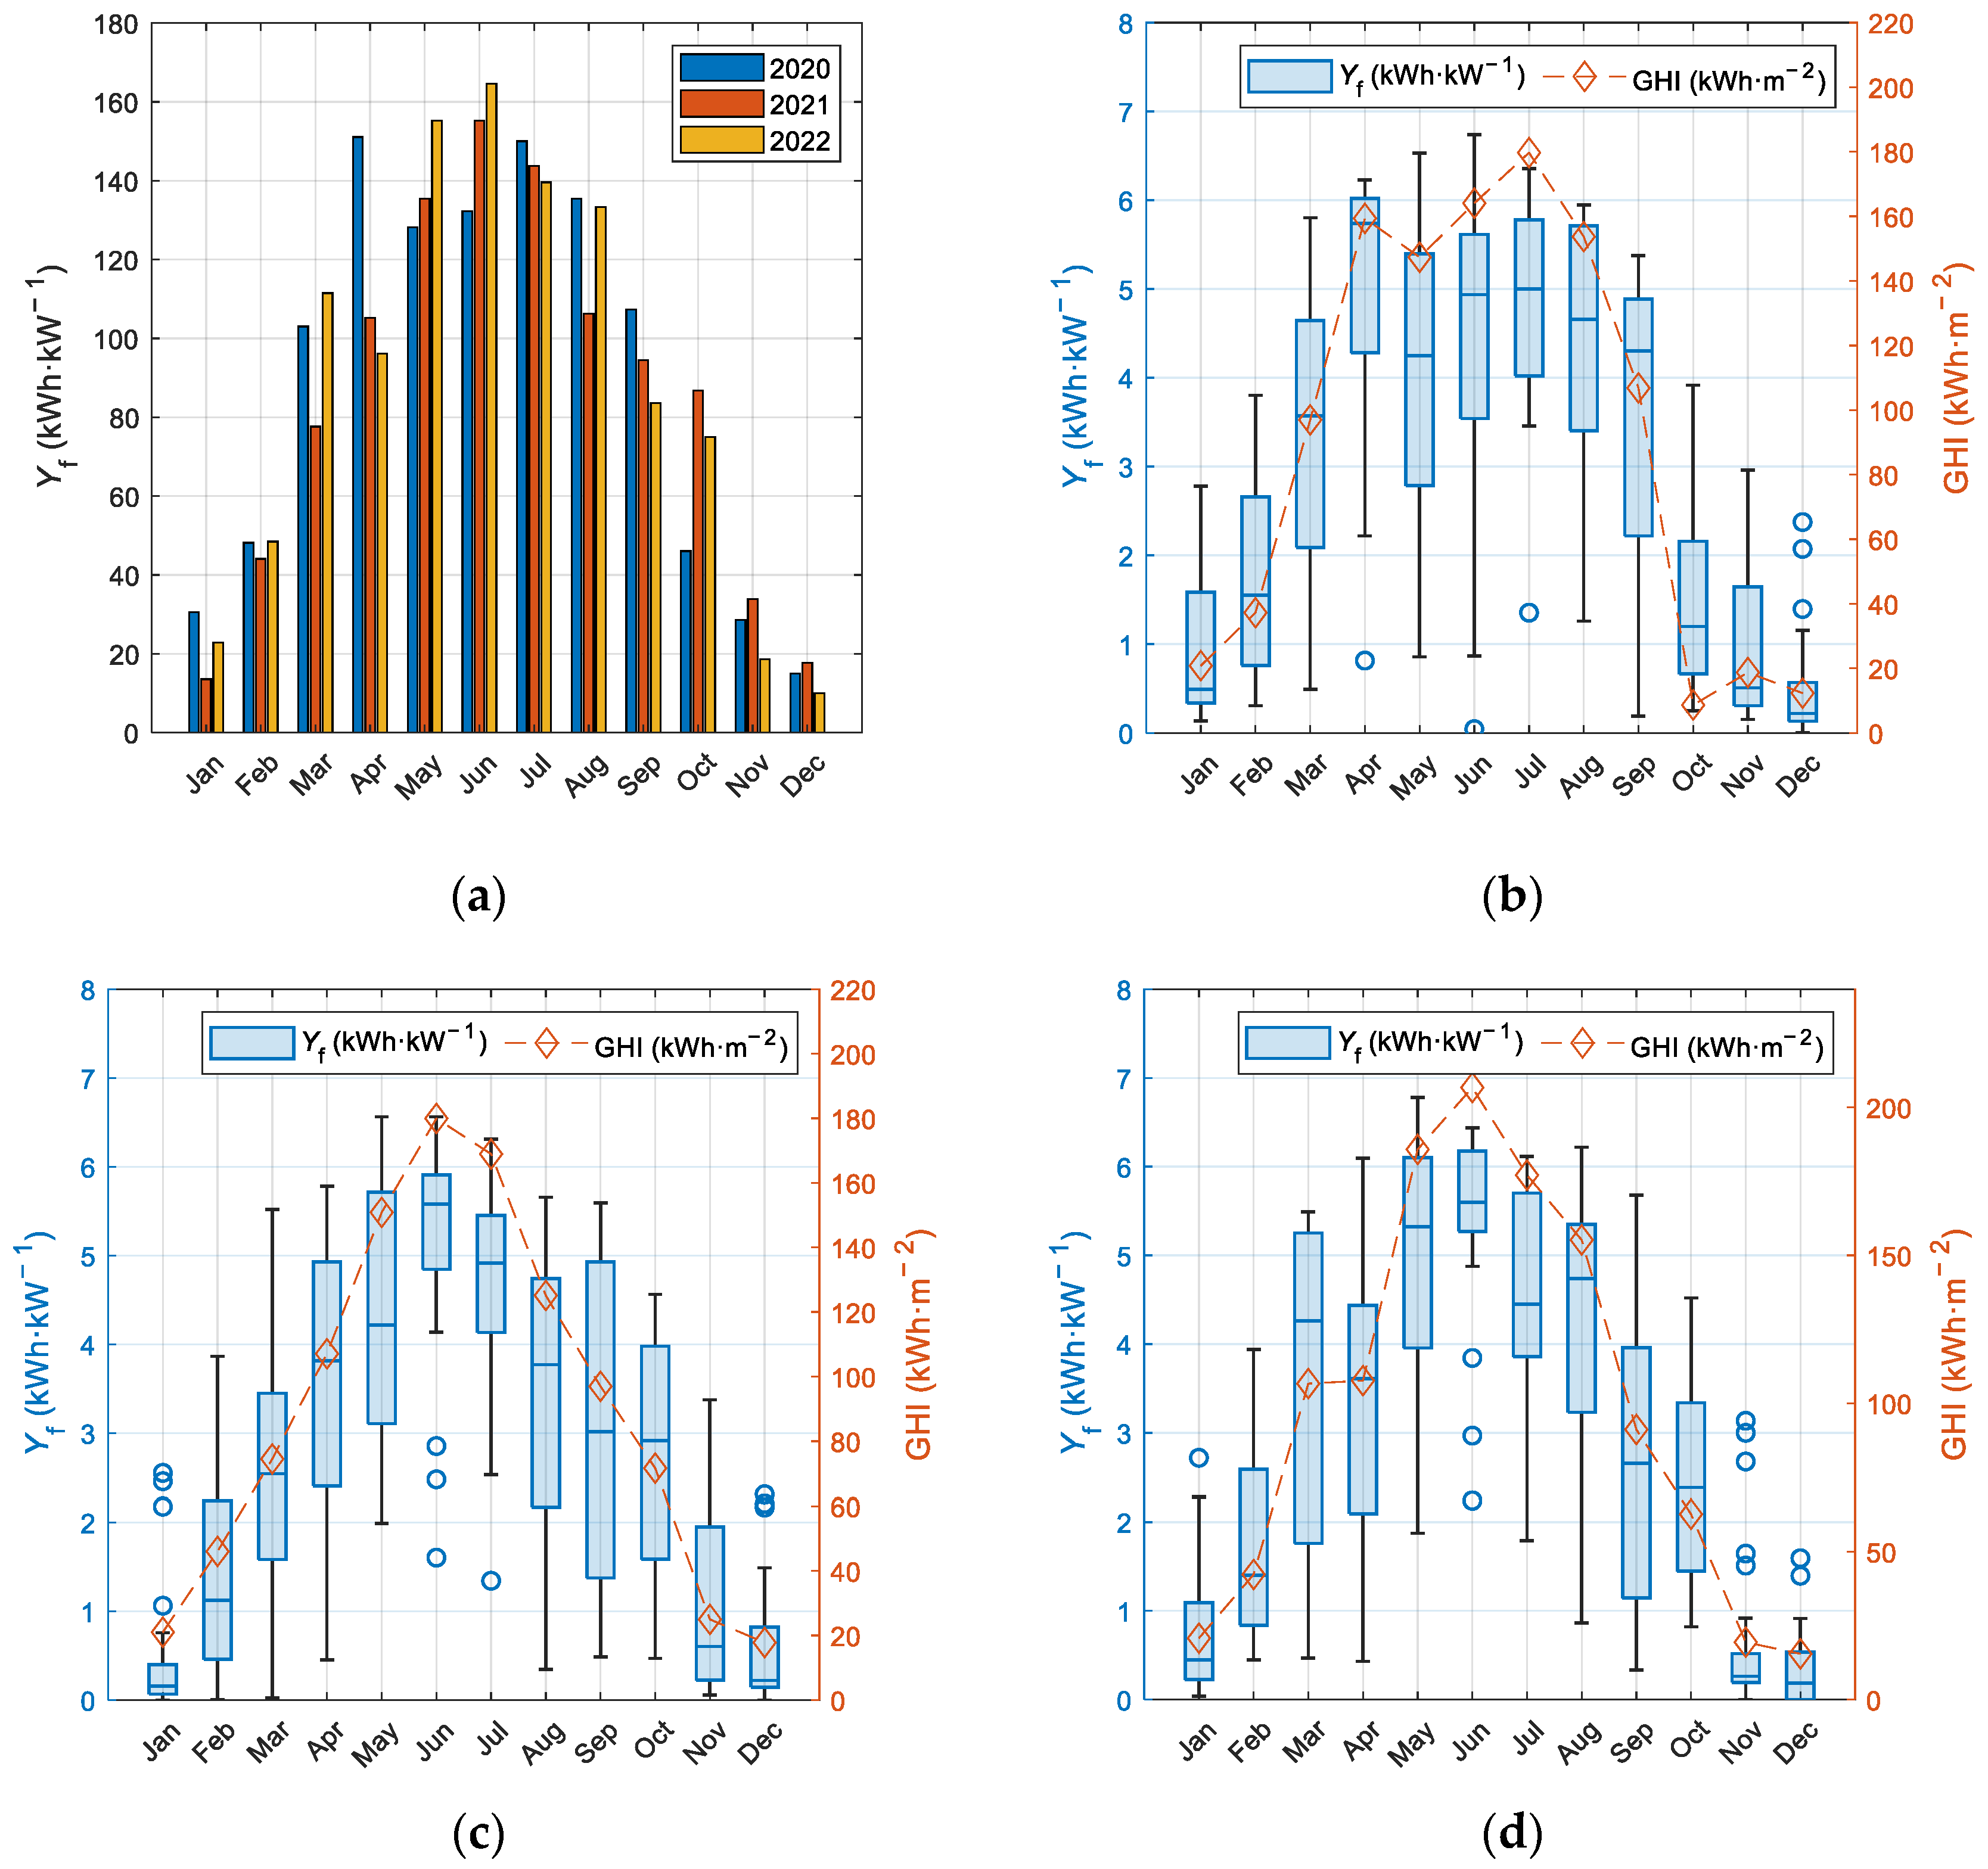
Figure 6a shows the results of the monthly final yield of the PV system registered during 2020–2022. The highest value (165 kWh·kW−1) was noticed in June 2022, the same month that also experienced the highest insolation (see Figure 3a). Considering the three years of the PV system operation, the highest energy production period was from June to July, during which the monthly final yield ranged between 132 kWh·kW−1 and 165 kWh·kW−1 (in June) and 140 kWh·kW−1 and 150 kWh·kW−1 (in July), depending on the year. A slightly lower range was noticed in May (from 128 kWh·kW−1 and 155 kWh·kW−1) and August (from 106 kWh·kW−1 and 135 kWh·kW−1). The exceptional energy production, comparable to levels characteristic of the summer months, was noticed in April 2020 (151 kWh·kW−1), which was caused by a relatively high insolation month with a low average temperature (compared with Figure 3a,b). The worst period in terms of energy production from the PV system was from November to January. The lowest final yield values of 9.9 kWh·kW−1, 13.5 kWh·kW−1 and 15 kWh·kW−1 were noticed in December 2022, January 2021 and December 2020, respectively, corresponding to periods with a significant number of snowy days.
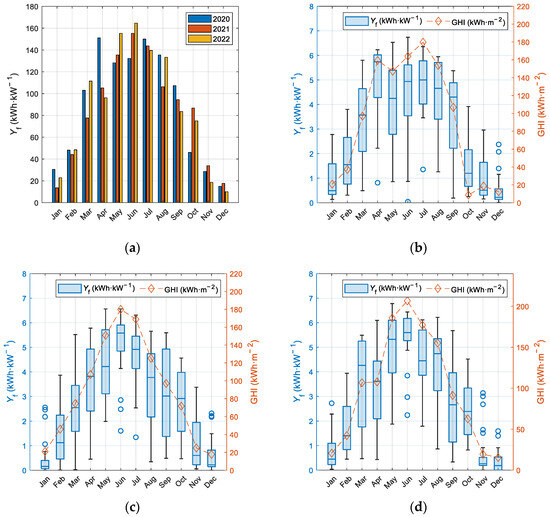
Figure 6.
Monthly final yield of the PV rooftop system during three years of operation (a) and daily final yield together with global horizontal irradiation in 2020 (b), 2021 (c), and 2022 (d).
In Figure 6b–d, the distribution of daily final yields in the years 2020–2022 is presented. During the analyzed period, June 2022 is characterized by the lowest interquartile range, from 5.3 kWh·kW−1 to 6.2 kWh·kW−1, with a median of 5.6 kWh·kW−1. It denotes a relatively high number of sunny hours compared to other months. A similar median value was found for 2021. The interquartile range in June was between 4.8 kWh·kW−1 and 5.9 kWh·kW−1. A slightly lower range was observed in June 2020 (from 3.5 kWh·kW−1 to 5.6 kWh·kW−1), which denoted the occurrence of a higher number of cloudy or partly cloudy days. However, an interesting month of this year turned out to be March, which featured a low interquartile range (between 4.3 and 6.0 kWh·kW−1) and a relatively high median of final yield (5.7 kWh·kW−1) in comparison to summer months. The high level of energy production was caused by high irradiation values (the monthly GHI value was equaled 160 kWh·m−2) and a low average ambient temperature of 8.2 °C compared to summer months, when the value often reaches 20 °C (compare with Figure 3b). It was also the month of 2020 with the lowest precipitation and humidity, reaching 8.5 mm and 52%, respectively (see Figure 4b and Figure 5a). Spring and autumn months are characterized by relatively high interquartile ranges and median levels between 1 and 4 kWh·kW−1.
However, there were also exceptions of higher values, e.g., in September 2020 or March 2022, with a median final yield of about 4.3 kWh·kW−1. In the worst period for PV production in this study, i.e., from November to January, the median final yield was very low, ranging between 0.15 kWh·kW−1 in January 2021 and 0.6 kWh·kW−1 in November 2021. This means that most days during this period were fully cloudy. Additionally,, there was a number of days with snow cover registered by the weather station (see Figure 4), which makes it possible to assume that the PV modules were also covered by the snow.
The average annual energy production of the PV system under scrutiny during the three years of operation was found to be 1049.3 kWh·kW−1 (see Table 2). This result is comparable to previously published findings about the PV systems of similar efficiency rooftop systems [7], as well as ground mounted ones [40]. The majority of the energy is obtained in the summer half-year. In the period from April to September, the final yield ranged from 740 kWh·kW−1 (in 2021) to 804 kWh·kW−1 (in 2020). In the winter half-year, this value reached approximately 270 kWh·kW−1 in 2020–2021 and 286 kWh·kW−1 in 2022. The performance ratio of the PV system in each year was computed and presented in Table 2, together with the computed in-plane irradiation and the final yield of the PV system under study. The in-plane irradiation was calculated using the GHI data provided by the weather station and monthly transposition coefficients, which can be found in the work of Haberlin [41] for a given azimuth and tilt of the analyzed PV installation. The yearly PR was determined based on monthly performance ratios, the values of which changed depending on the period of the year. Excluding snowy winter days, high PR was observed on sunny winter days due to the low temperatures of the PV modules. In summer months, the temperature influenced the efficiency, leading to a decrease in the performance to the range of 80–85%, depending on the year. On heavily snowy days, the PR decreased to 40%. An analogous decrease in PR for November or December was shown in the previous work [40].
Table 2.
Yearly final yield and performance ratios of the PV rooftop system under three years of operation.
Lower PR values were observed in the summer season compared to winter due to the influence of temperature in Patagonia [42]. The authors observed that PV modules were cooled by northwest cold winds in the winter season (from April to September), preventing the PV modules from overheating. The yearly PR was found to be almost the same as in this study (85.5%). A range of monthly PR values between 0.79 and 0.9 was observed also in Andalusia (Spain) by Muñoz-Rodriguez et al. [15]. The annual value was slightly higher than 0.8.
3.3. Greenhouse Gas Emission Analysis
The combustion of fossil fuels significantly contributes to the emission of greenhouse gases into the atmosphere. The reduction in carbon dioxide, CO2, sulphur dioxide SO2, nitrogen oxides NOx, carbon moNOxide CO, and dust particles can be achieved by the production energy from renewable energy sources. According to coefficients for each year (Table 3) presented by the National Center for Emissions Balancing and Management in Poland [43,44,45], the environmental analysis has been carried out (Table 4).
Table 3.
Greenhouse gas emissions coefficients.
Table 4.
Greenhouse gas emissions analysis.
Referring to energy production by photovoltaic installation, a significant reduction in CO2 emission, exceeding 21 tons, can be observed. The greatest decrease in greenhouse gas emissions occurred in the year 2020, which corresponds to the highest energy production. The average reductions over the analysed period are 7.2 tons, 4.87 kg, 4.98 kg, 2.35 kg, and 0.22 kg for CO2, SO2, NOX, CO, and dust, respectively. The greater the energy production from renewable energy sources (RES), the larger the reduction in negative environmental impact. Replacement of fossil fuels with renewable energy sources, such as solar energy, has led to a reduction in GHG emissions and thus decarbonization and the energy transition process. Assuming the energy generated by the installation will remain at a comparable level throughout the project’s lifetime of approximately 20 years, the average reduction in CO2 emissions can be estimated at an average of 140 tons.
4. Conclusions
The analysis demonstrates the results of a long-term study of the prosumers’ rooftop system of 9.6 kW located in Eastern Poland. The PV system performance, combined with a comprehensive analysis of the weather parameters, such as temperature, irradiance, humidity, and wind speed, was analysed over three years of system operation. As was shown in the paper, such unexpectedly favorable conditions as high insolation during cold early spring months lead to energy production comparable to summer months. This fact is of great importance for the national operator of the energy system, which is responsible for keeping the control between energy production and demand. Another positive aspect of the weather conditions was the occurrence of heavy rain in months of high energy production (summer). Rain allows for the natural cleaning of the PV modules, preventing the performance decrease due to soiling. This fact answers the question about the reasoning of cleaning the PV modules, which seems to be unnecessary due to natural processes caused by the rain. The influence of snow cover on low energy production in winter periods due to coverage of the PV module’s surface was also shown.
To conclude, a long-term analysis in high-latitude countries is of crucial importance for investors and companies not only from an energy production perspective, but also for evaluation of the system stability after cold and snowy winters. Considering the slight PR change during the analysed period, in the range between 0.87 in 2020 and 0.83 in 2022, no significant problems with the PV system functioning were observed. This fact is also confirmed by the relatively high yearly final yields, which obtained values between 1014 kWh·kW−1 in 2021 and 1075 kWh·kW−1 in 2020, and so it can be considered as a good prognostic for clean energy production in the analysed location in the future in terms of the amount of avoided CO2 emissions.
The total production of about 30 MWh during the three years of the PV system operation led to a reduction in CO2 emissions of 21 tons, which presents around 140 tons for a 20-year perspective. Future studies containing a degradation analysis will increase the precision of this prognosis. Considering the number of prosumer installations in Poland exceeding 1.3 million, it can be concluded that they make an important contribution to environmental protection.
Author Contributions
Conceptualization, S.G.; methodology, S.G. and E.K.; software, S.G. and E.K.; validation, S.G. and E.K.; formal analysis, S.G. and E.K.; investigation, S.G. and E.K.; data curation, S.G. and E.K.; writing—original draft preparation, S.G. and E.K.; visualization, S.G. and E.K.; supervision, S.G. All authors have read and agreed to the published version of the manuscript.
Funding
This research was supported by the statutory funds granted to the Faculty of Environmental Engineering, Lublin University of Technology, Poland, grant number FD-20/IS-6/013 and FD-20/IS-6/999.
Institutional Review Board Statement
Not applicable.
Informed Consent Statement
Not applicable.
Data Availability Statement
Data are contained within the article.
Acknowledgments
The author would like to thank IMGW for providing the additional irradiance data.
Conflicts of Interest
The authors declare no conflicts of interest.
References
- DNV. Energy Transition Outlook 2022. In A Global and Regional Forecast to 2050; DNV: Oslo, Norway, 2023. [Google Scholar]
- Semshchikov, E.; Negnevitsky, M.; Hamilton, J.; Wang, X. Cost-Efficient Strategy for High Renewable Energy Penetration in Isolated Power Systems. IEEE Trans. Power Syst. 2020, 35, 3719–3728. [Google Scholar] [CrossRef]
- Regulation (EU) 2018/1999 of European Parliament and of the Council of 11 December 2018 on the Governance of the Energy Union and Climate Action, Amending Regulations (EC) No 663/2009 and (EC) No 715/2009 of the European Parliament and of the Council, Directives 94/22/EC, 98/70/EC, 2009/31/EC, 2009/73/EC, 2010/31/EU, 2012/27/EU and 2013/30/EU of the European Parliament and of the Council, Council Directives 2009/119/EC and (EU) 2015/652 and Repealing Regulation (EU) No 525/2013 of the European Parliament and of the Council 2018. Available online: https://eur-lex.europa.eu/legal-content/EN/TXT/?uri=uriserv%3AOJ.L_.2018.328.01.0001.01.ENG (accessed on 5 February 2024).
- Ministry of Climate and Environment. Poland’s National Energy and Climate Plan for the Years 2021–2030 (NECP PL); Ministry of Climate and Environment: Warsaw, Poland, 2021. [Google Scholar]
- Proposal for a Regulation of the European Parliament and of the Council Amending Regulation (EU) 2018/842 on Binding Annual Greenhouse Gas Emission Reductions by Member States from 2021 to 2030 Contributing to Climate Action to Meet Commitments under the Paris Agreement. 2021. Available online: https://www.eumonitor.eu/9353000/1/j9vvik7m1c3gyxp/vlki7cctu2z5 (accessed on 5 February 2024).
- Revision of the Renewable Energy Directive: Fit for 55 Package. In EU Legislation in Progress’ Briefings, 3rd ed.; European Parliament: Strasbourg, France, 2023.
- Gulkowski, S. Specific Yield Analysis of the Rooftop PV Systems Located in South-Eastern Poland. Energies 2022, 15, 3666. [Google Scholar] [CrossRef]
- Krawczak, E. A Comparative Analysis of Measured and Simulated Data of PV Rooftop Installations Located in Poland. Energies 2023, 16, 5975. [Google Scholar] [CrossRef]
- Igliński, B.; Piechota, G.; Kiełkowska, U.; Kujawski, W.; Pietrzak, M.B.; Skrzatek, M. The Assessment of Solar Photovoltaic in Poland: The Photovoltaics Potential, Perspectives and Development. Clean Technol. Environ. Policy 2023, 25, 281–298. [Google Scholar] [CrossRef] [PubMed]
- Institute for Renewable Energy. Report PV Market in Poland 2023; Institute for Renewable Energy: Warsaw, Poland, 2023. [Google Scholar]
- te Heesen, H.; Herbort, V.; Rumpler, M. Performance of Roof-Top PV Systems in Germany from 2012 to 2018. Sol. Energy 2019, 194, 128–135. [Google Scholar] [CrossRef]
- Schardt, J.; te Heesen, H. Performance of Roof-Top PV Systems in Selected European Countries from 2012 to 2019. Sol. Energy 2021, 217, 235–244. [Google Scholar] [CrossRef]
- Žnidarec, M.; Šljivac, D.; Došen, D.; Dumniŋ, B. Performance Assessment of Mono and Poly Crystalline Silicon Photovoltaic Arrays under Pannonian Climate Conditions. In Proceedings of the IEEE EUROCON 2019—18th International Conference on Smart Technologies, Novi Sad, Serbia, 1–4 July 2019; pp. 1–6. [Google Scholar]
- Atsu, D.; Seres, I.; Farkas, I. The State of Solar PV and Performance Analysis of Different PV Technologies Grid-Connected Installations in Hungary. Renew. Sustain. Energy Rev. 2021, 141, 110808. [Google Scholar] [CrossRef]
- Muñoz-Rodríguez, F.J.; Snytko, A.; de la Casa Hernández, J.; Rus-Casas, C.; Jiménez-Castillo, G. Rooftop Photovoltaic Systems. New Parameters for the Performance Analysis from Monitored Data Based on IEC 61724. Energy Build. 2023, 295, 113280. [Google Scholar] [CrossRef]
- Adaramola, M.S. Techno-Economic Analysis of a 2.1 kW Rooftop Photovoltaic-Grid-Tied System Based on Actual Performance. Energy Conv. Manag. 2015, 101, 85–93. [Google Scholar] [CrossRef]
- Adaramola, M.S.; Vågnes, E.E.T. Preliminary Assessment of a Small-Scale Rooftop PV-Grid Tied in Norwegian Climatic Conditions. Energy Conv. Manag. 2015, 90, 458–465. [Google Scholar] [CrossRef]
- Nguyen, T.H.; Dang, Q.V.; Ngo, X.C.; Do, N.Y. Long-Term Performance of Roof-Top GCPV Systems in Central Viet Nam. Int. J. Renew. Energy Dev. 2023, 12, 998–1007. [Google Scholar] [CrossRef]
- Alnaser, N.W. A Domestic Rooftop PV System: A Step towards Retrofitting the Built Environment to Combat Climate Change in Bahrain. Front. Built Environ. 2023, 9, 1178512. [Google Scholar] [CrossRef]
- Md Khairi, N.H.; Akimoto, Y.; Okajima, K. Suitability of Rooftop Solar Photovoltaic at Educational Building towards Energy Sustainability in Malaysia. Sustain. Horiz. 2022, 4, 100032. [Google Scholar] [CrossRef]
- Pietruszko, S.M.; Gradzki, M. Performance of a Grid Connected Small PV System in Poland. Appl. Energy 2003, 74, 177–184. [Google Scholar] [CrossRef]
- Zdyb, A.; Szałas, G. Rooftop Low Angle Tilted Photovoltaic Installation under Polish Climatic Conditions. J. Ecol. Eng. 2021, 22, 223–233. [Google Scholar] [CrossRef]
- Sarniak, M.T. Researches of the Impact of the Nominal Power Ratio and Environmental Conditions on the Efficiency of the Photovoltaic System: A Case Study for Poland in Central Europe. Sustainability 2020, 12, 6162. [Google Scholar] [CrossRef]
- Olczak, P.; Żelazna, A.; Stecuła, K.; Matuszewska, D.; Lelek, Ł. Environmental and Economic Analyses of Different Size Photovoltaic Installation in Poland. Energy Sustain. Dev. 2022, 70, 160–169. [Google Scholar] [CrossRef]
- Anang, N.; Syd Nur Azman, S.N.A.; Muda, W.M.W.; Dagang, A.N.; Daud, M.Z. Performance Analysis of a Grid-Connected Rooftop Solar PV System in Kuala Terengganu, Malaysia. Energy Build. 2021, 248, 111182. [Google Scholar] [CrossRef]
- Dane Publiczne. Instytut Meteorologii i Gospodarki Wodnej-Państwowy Instytut Badawczy. Available online: https://danepubliczne.imgw.pl/ (accessed on 19 March 2024).
- PN–EN 12831:2006; Instalacje Ogrzewcze w Budynkach. Metoda Obliczania Projektowego Obciążenia Cieplnego. Polish Committee for Standardization: Warsaw, Poland, 2006.
- Krawczak, E. Energy, Economical and Ecological Analysis of a Single-Family House Using Photovoltaic Installation. E3S Web Conf. 2018, 49, 00060. [Google Scholar] [CrossRef]
- Krawczak, E. BAPV system modeling for the single-family house: A case study. Inform. Autom. Pomiary Gospod. Ochr. Sr. 2020, 10, 44–47. [Google Scholar] [CrossRef]
- Grochecka, W. The Performance Assessment of the Photovoltaic System Located in Zawadówka. Master’s Thesis, Lublin University of Technology, Lublin, Poland, 2023. [Google Scholar]
- Instytut Meteorologii i Gospodarki Wodnej—Państwowy Instytut Badawczy. Available online: https://www.imgw.pl/ (accessed on 19 March 2024).
- Solís-Alemán, E.M.; de la Casa, J.; Romero-Fiances, I.; Silva, J.P.; Nofuentes, G. A Study on the Degradation Rates and the Linearity of the Performance Decline of Various Thin Film PV Technologies. Sol. Energy 2019, 188, 813–824. [Google Scholar] [CrossRef]
- Romero-Fiances, I.; Livera, A.; Theristis, M.; Makrides, G.; Stein, J.S.; Nofuentes, G.; de la Casa, J.; Georghiou, G.E. Impact of Duration and Missing Data on the Long-Term Photovoltaic Degradation Rate Estimation. Renew. Energy 2022, 181, 738–748. [Google Scholar] [CrossRef]
- Ameur, A.; Berrada, A.; Bouaichi, A.; Loudiyi, K. Long-Term Performance and Degradation Analysis of Different PV Modules under Temperate Climate. Renew. Energy 2022, 188, 37–51. [Google Scholar] [CrossRef]
- Malvoni, M.; Leggieri, A.; Maggiotto, G.; Congedo, P.M.; De Giorgi, M.G. Long Term Performance, Losses and Efficiency Analysis of a 960 kWP Photovoltaic System in the Mediterranean Climate. Energy Conv. Manag. 2017, 145, 169–181. [Google Scholar] [CrossRef]
- IEC 61724-1:2021 Photovoltaic System Performance—Part 1: Monitoring. Available online: https://webstore.iec.ch/publication/65561 (accessed on 19 March 2024).
- Malvoni, M.; Kumar, N.M.; Chopra, S.S.; Hatziargyriou, N. Performance and Degradation Assessment of Large-Scale Grid-Connected Solar Photovoltaic Power Plant in Tropical Semi-Arid Environment of India. Sol. Energy 2020, 203, 101–113. [Google Scholar] [CrossRef]
- Øgaard, M.B.; Riise, H.N.; Haug, H.; Sartori, S.; Selj, J.H. Photovoltaic System Monitoring for High Latitude Locations. Sol. Energy 2020, 207, 1045–1054. [Google Scholar] [CrossRef]
- Santhakumari, M.; Sagar, N. A Review of the Environmental Factors Degrading the Performance of Silicon Wafer-Based Photovoltaic Modules: Failure Detection Methods and Essential Mitigation Techniques. Renew. Sustain. Energy Rev. 2019, 110, 83–100. [Google Scholar] [CrossRef]
- Gulkowski, S. Modeling and Experimental Studies of the Photovoltaic System Performance in Climate Conditions of Poland. Energies 2023, 16, 7017. [Google Scholar] [CrossRef]
- Häberlin, H. Photovoltaics: System Design and Practice Introduction; John Wiley & Sons, Ltd.: Hoboken, NJ, USA, 2012; ISBN 978-1-119-97699-8. [Google Scholar]
- Vidal, H.; Rivera, M.; Wheeler, P.; Vicencio, N. The Analysis Performance of a Grid-Connected 8.2 kWp Photovoltaic System in the Patagonia Region. Sustainability 2020, 12, 9227. [Google Scholar] [CrossRef]
- Wskaźniki Emisyjności CO2, SO2, NOx, CO i Pyłu Całkowitego Dla Energii Elektrycznej Na Podstawie Informacji Zawartych w Krajowej Bazie o Emisjach Gazów Cieplarnianych i Innych Substancji Za 2020 Rok; Krajowy Ośrodek Zarządzania i Bilansowania Emisjami: Warszawa. 2021. Available online: https://www.kobize.pl/uploads/materialy/materialy_do_pobrania/wskazniki_emisyjnosci/Wskazniki_emisyjnosci_grudzien_2021.pdf (accessed on 19 March 2024).
- Wskaźniki Emisyjności CO2, SO2, NOx, CO i Pyłu Całkowitego Dla Energii Elektrycznej Na Podstawie Informacji Zawartych w Krajowej Bazie o Emisjach Gazów Cieplarnianych i Innych Substancji Za 2021 Rok; Krajowy Ośrodek Zarządzania i Bilansowania Emisjami: Warszawa. 2022. Available online: https://www.kobize.pl/uploads/materialy/materialy_do_pobrania/wskazniki_emisyjnosci/Wska%C5%BAniki_emisyjno%C5%9Bci_dla_energii_elektrycznej_grudzie%C5%84_2022.pdf (accessed on 19 March 2024).
- Wskaźniki Emisyjności CO2, SO2, NOx, CO i Pyłu Całkowitego Dla Energii Elektrycznej Na Podstawie Informacji Zawartych w Krajowej Bazie o Emisjach Gazów Cieplarnianych i Innych Substancji Za 2022 Rok; Krajowy Ośrodek Zarządzania i Bilansowania Emisjami: Warszawa. 2023. Available online: https://www.kobize.pl/uploads/materialy/materialy_do_pobrania/wskazniki_emisyjnosci/Wskazniki_emisyjnosci_2022.pdf (accessed on 19 March 2024).

Disclaimer/Publisher’s Note: The statements, opinions and data contained in all publications are solely those of the individual author(s) and contributor(s) and not of MDPI and/or the editor(s). MDPI and/or the editor(s) disclaim responsibility for any injury to people or property resulting from any ideas, methods, instructions or products referred to in the content. |
© 2024 by the authors. Licensee MDPI, Basel, Switzerland. This article is an open access article distributed under the terms and conditions of the Creative Commons Attribution (CC BY) license (https://creativecommons.org/licenses/by/4.0/).