
Iterative Investigation of Wind Environments Influenced by Bulge-Part Geometries of Typical T-Form High-Rise Buildings Using Parametric Modelling, CFD and IAs Analysis


Abstract
1. Introduction
1.1. Outdoor Wind Environments around Buildings
1.2. Review of T-Form Buildings
1.3. Summary
- (1)
- Research gaps
- (2)
- Research framework
2. Methodology
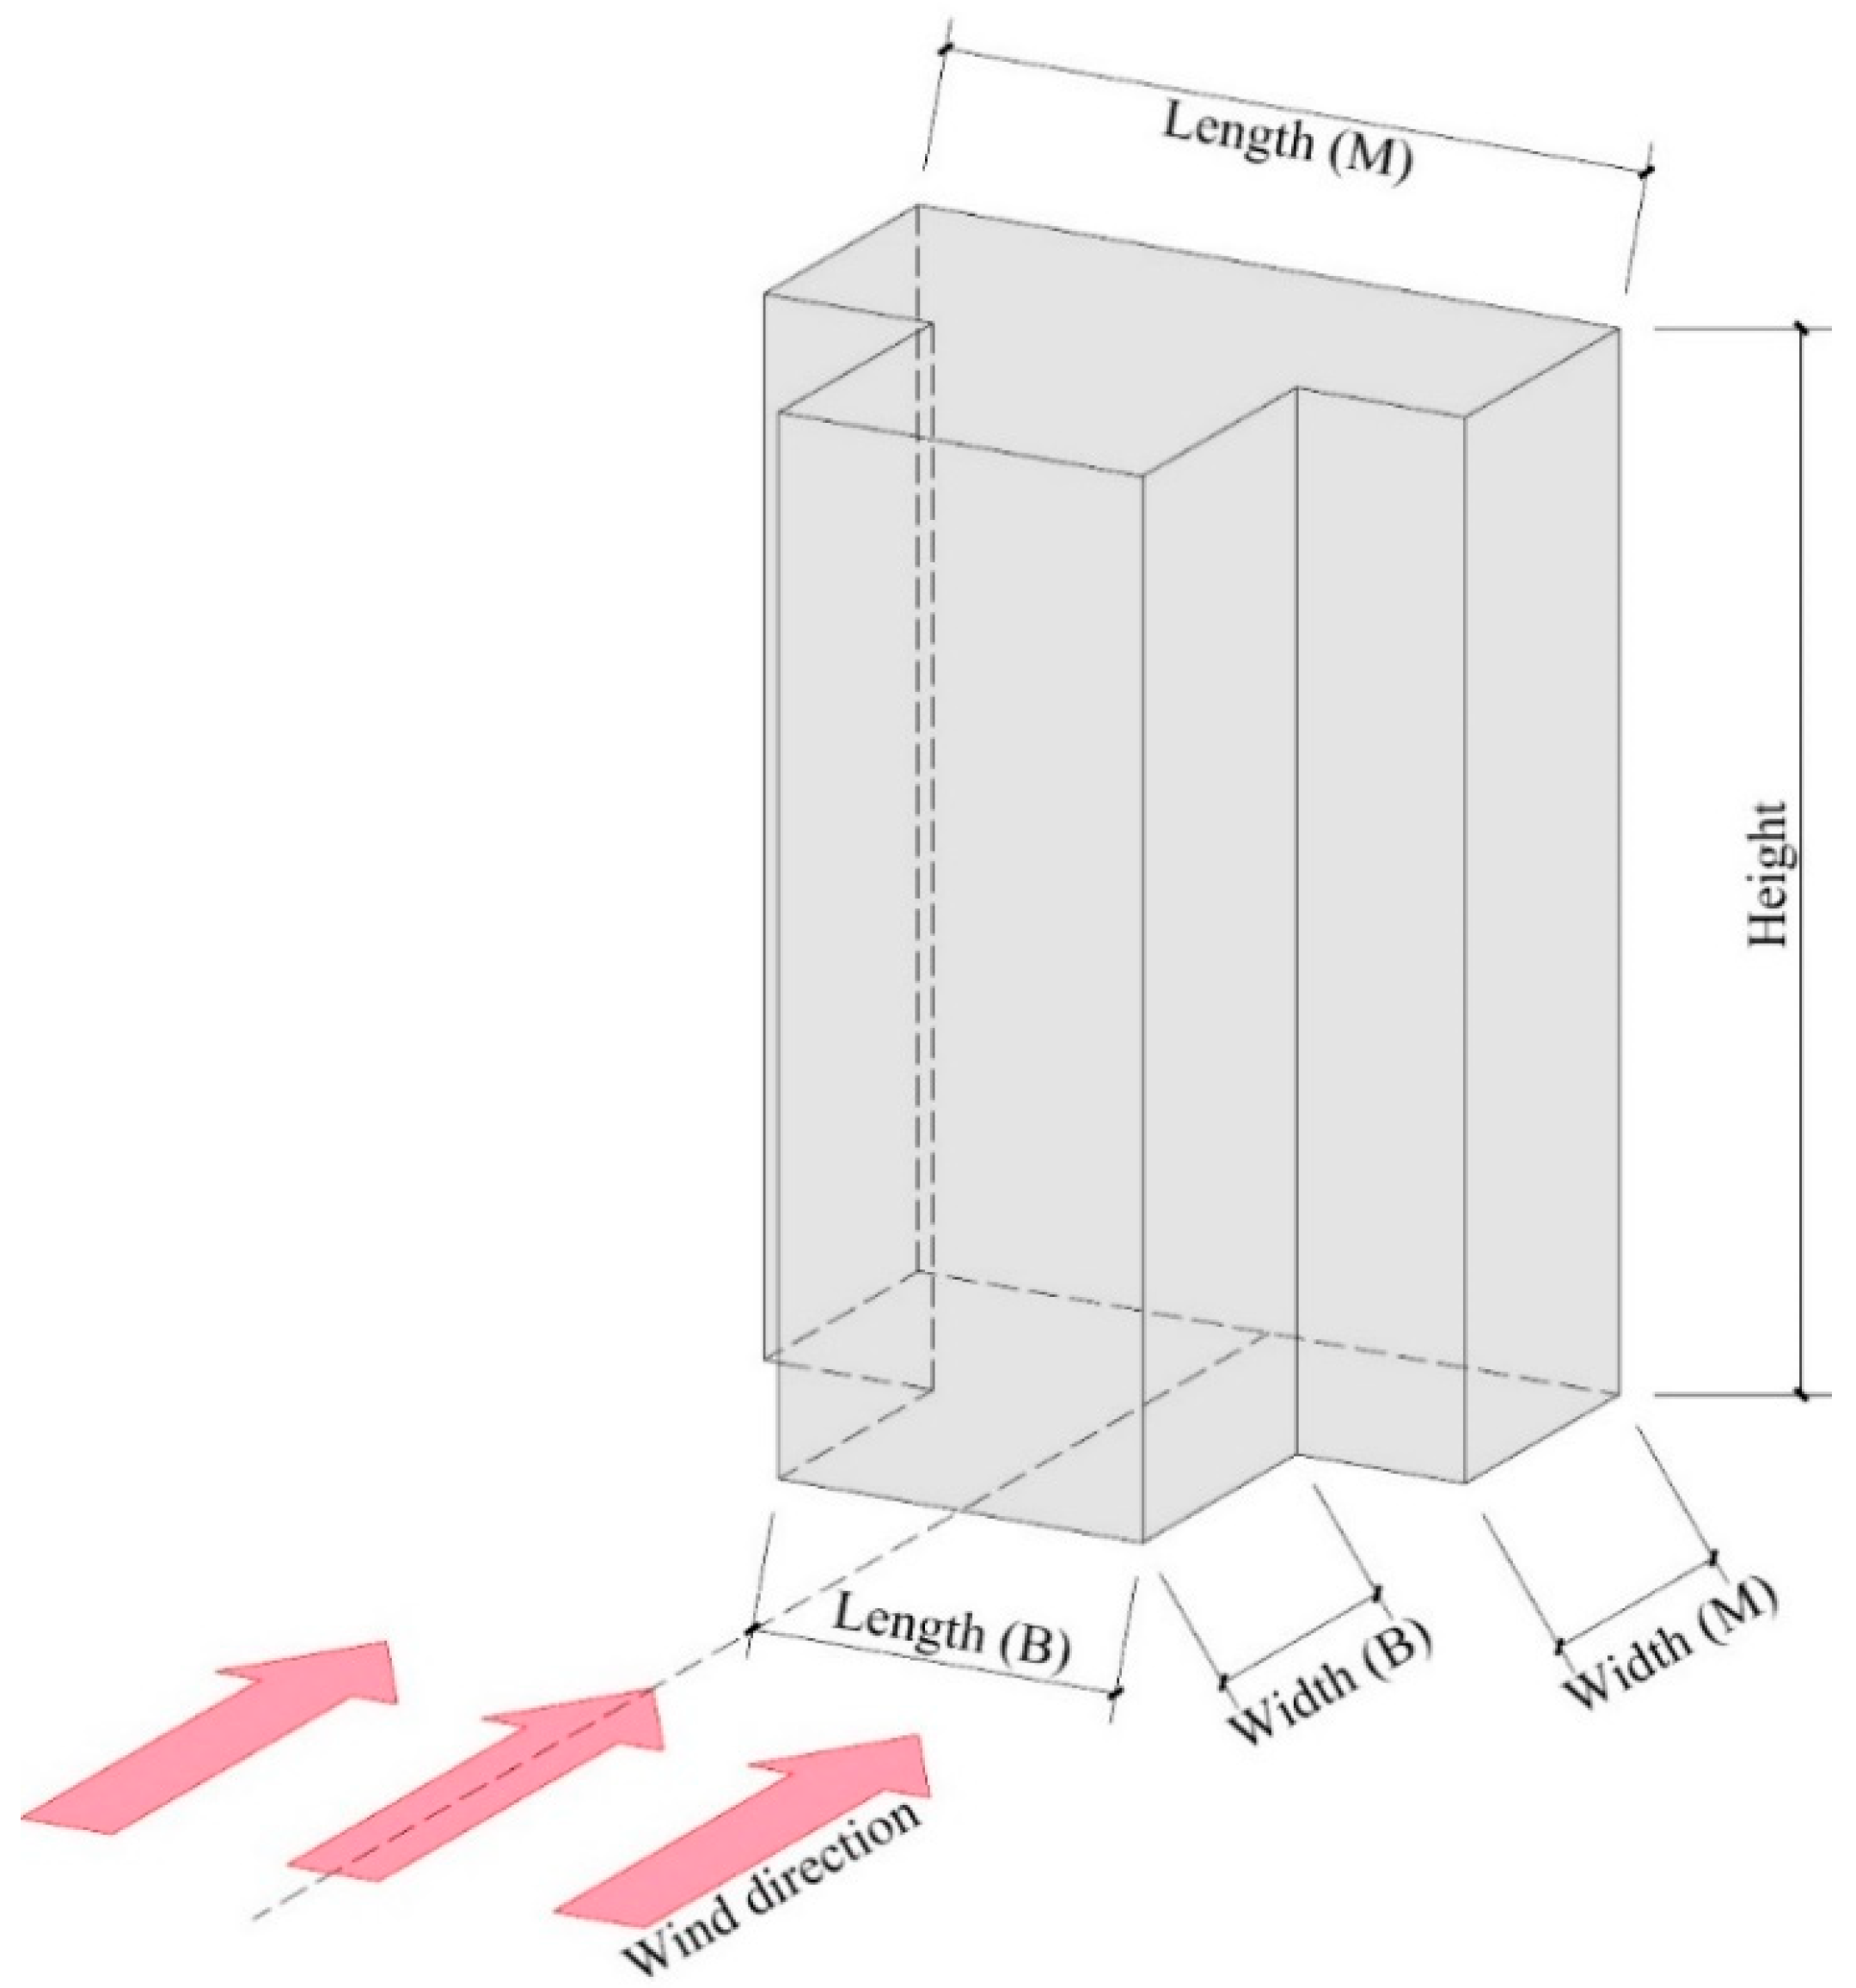
2.1. Building Geometries and Case Settings
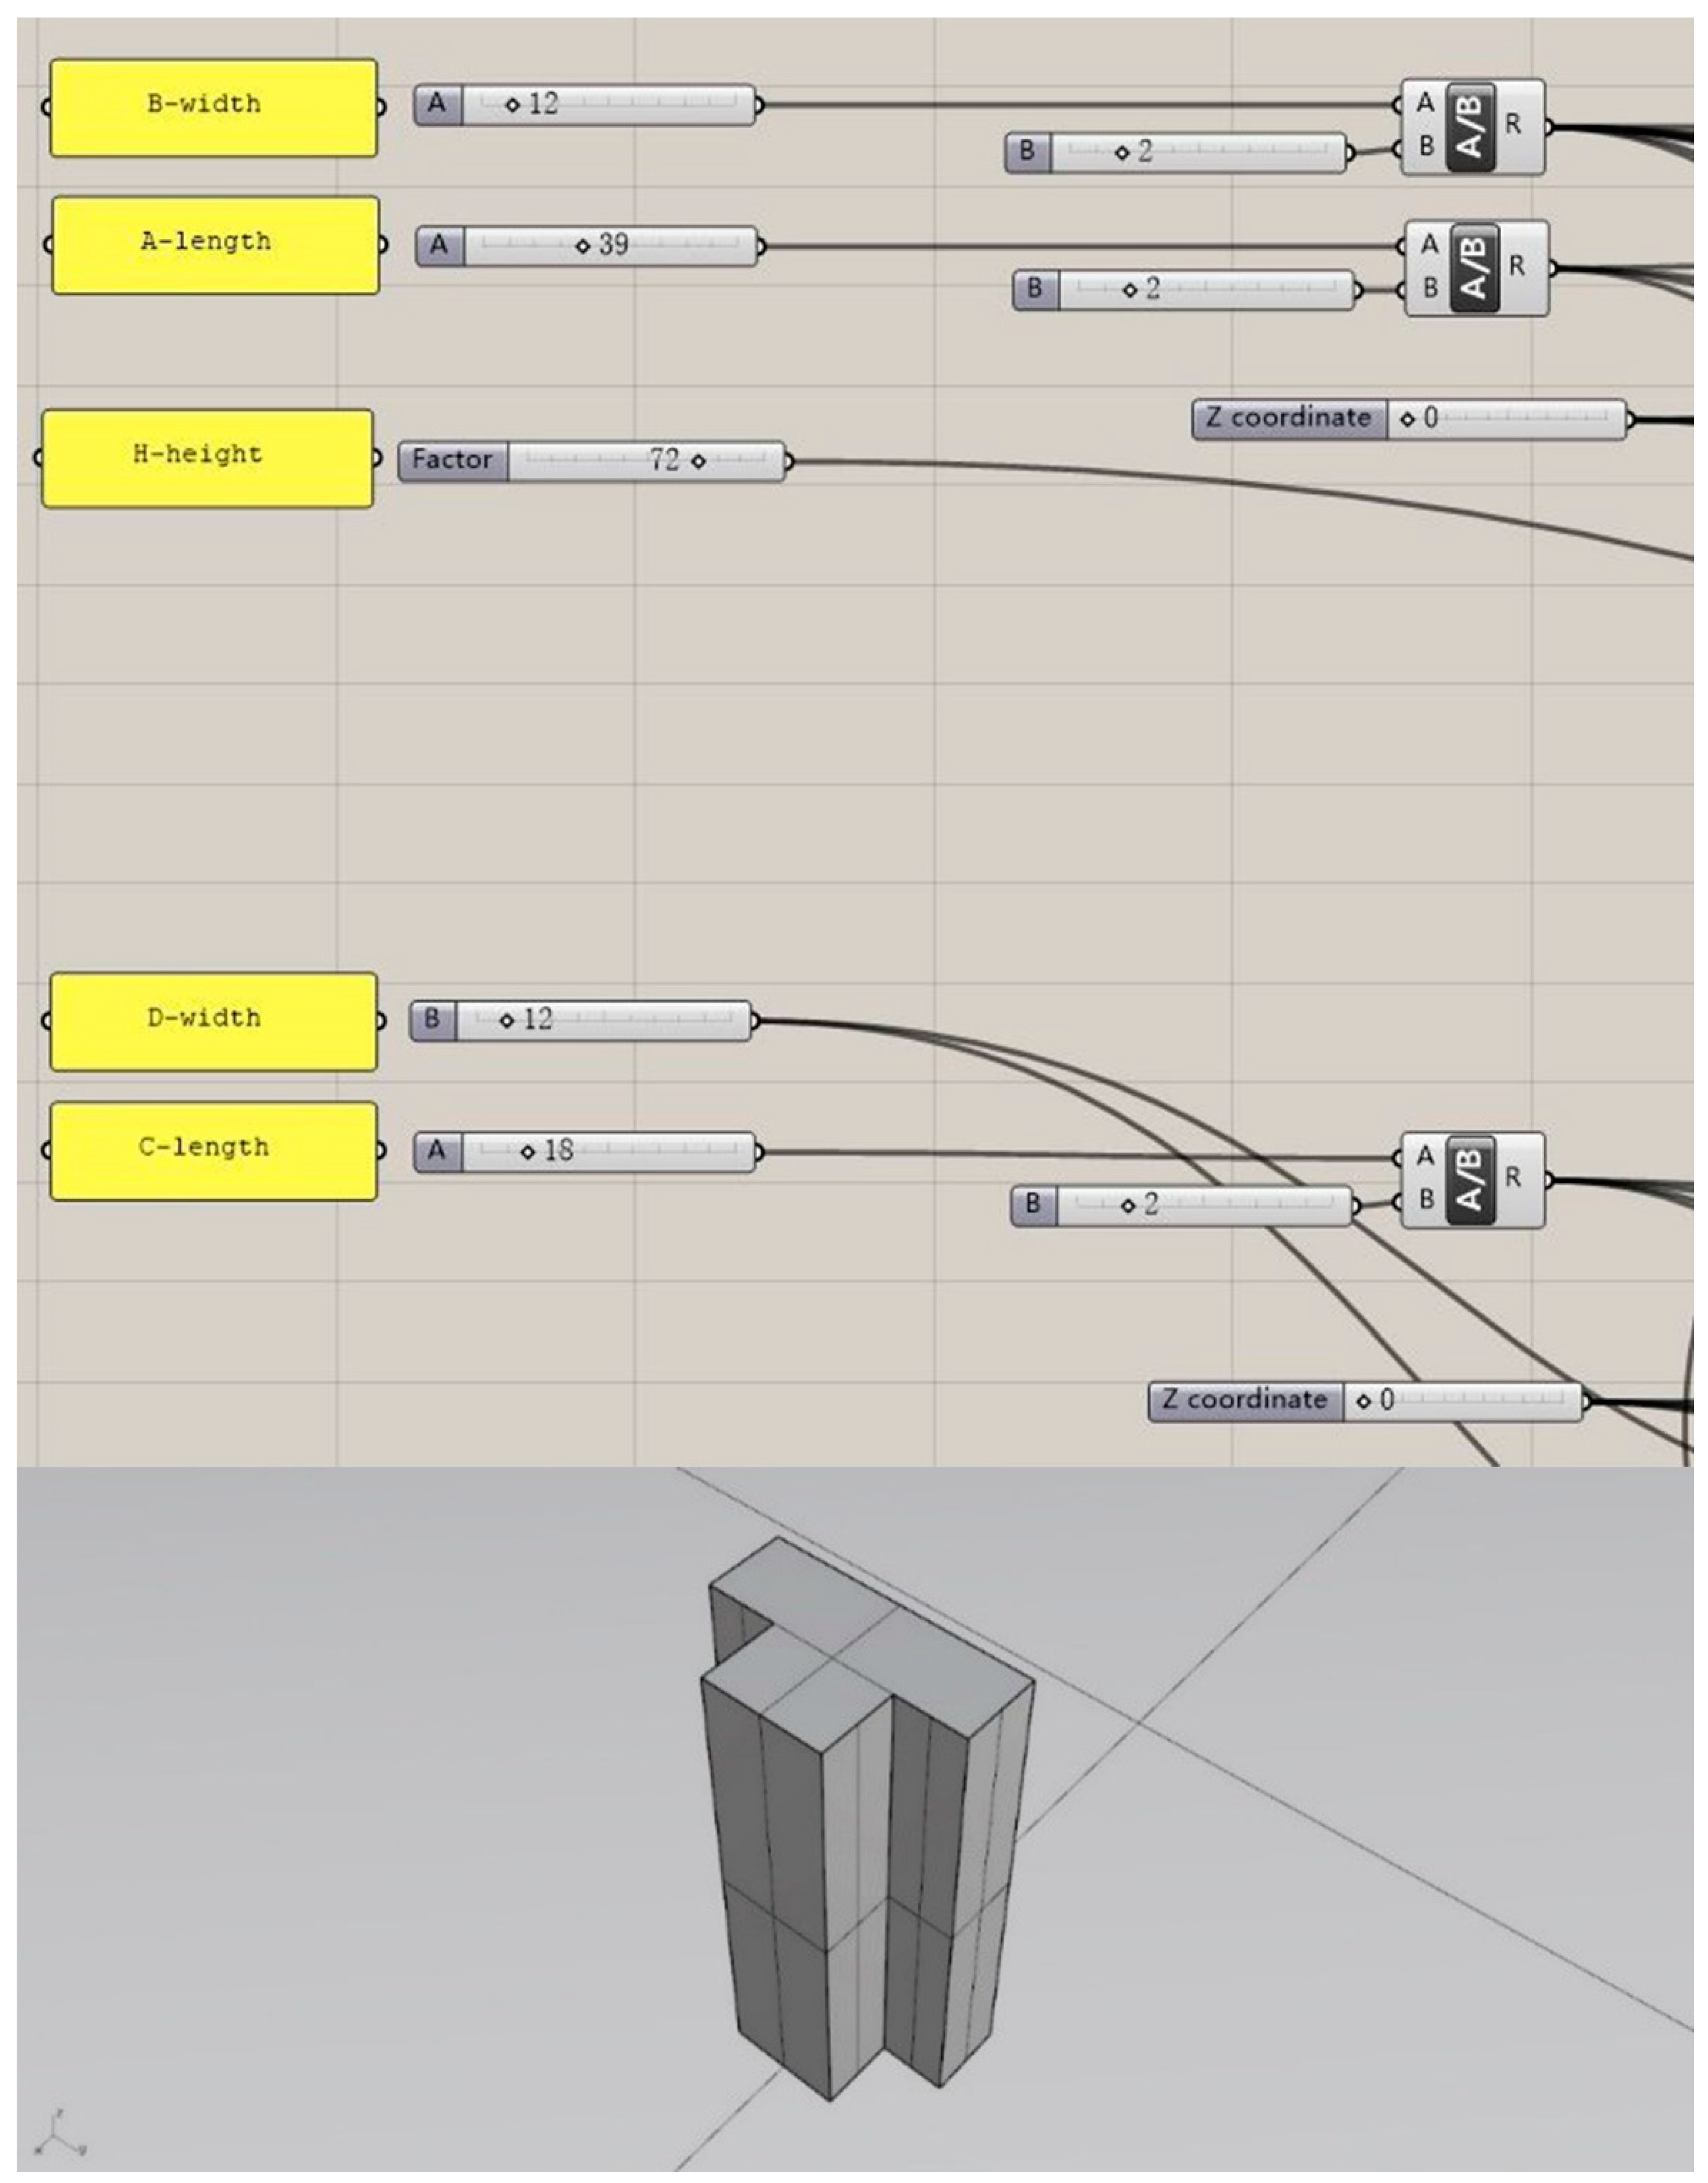
2.2. Parametric Modelling of T-Form Buildings
2.3. Governing Equations
2.4. Computational Domain and Boundary Condition
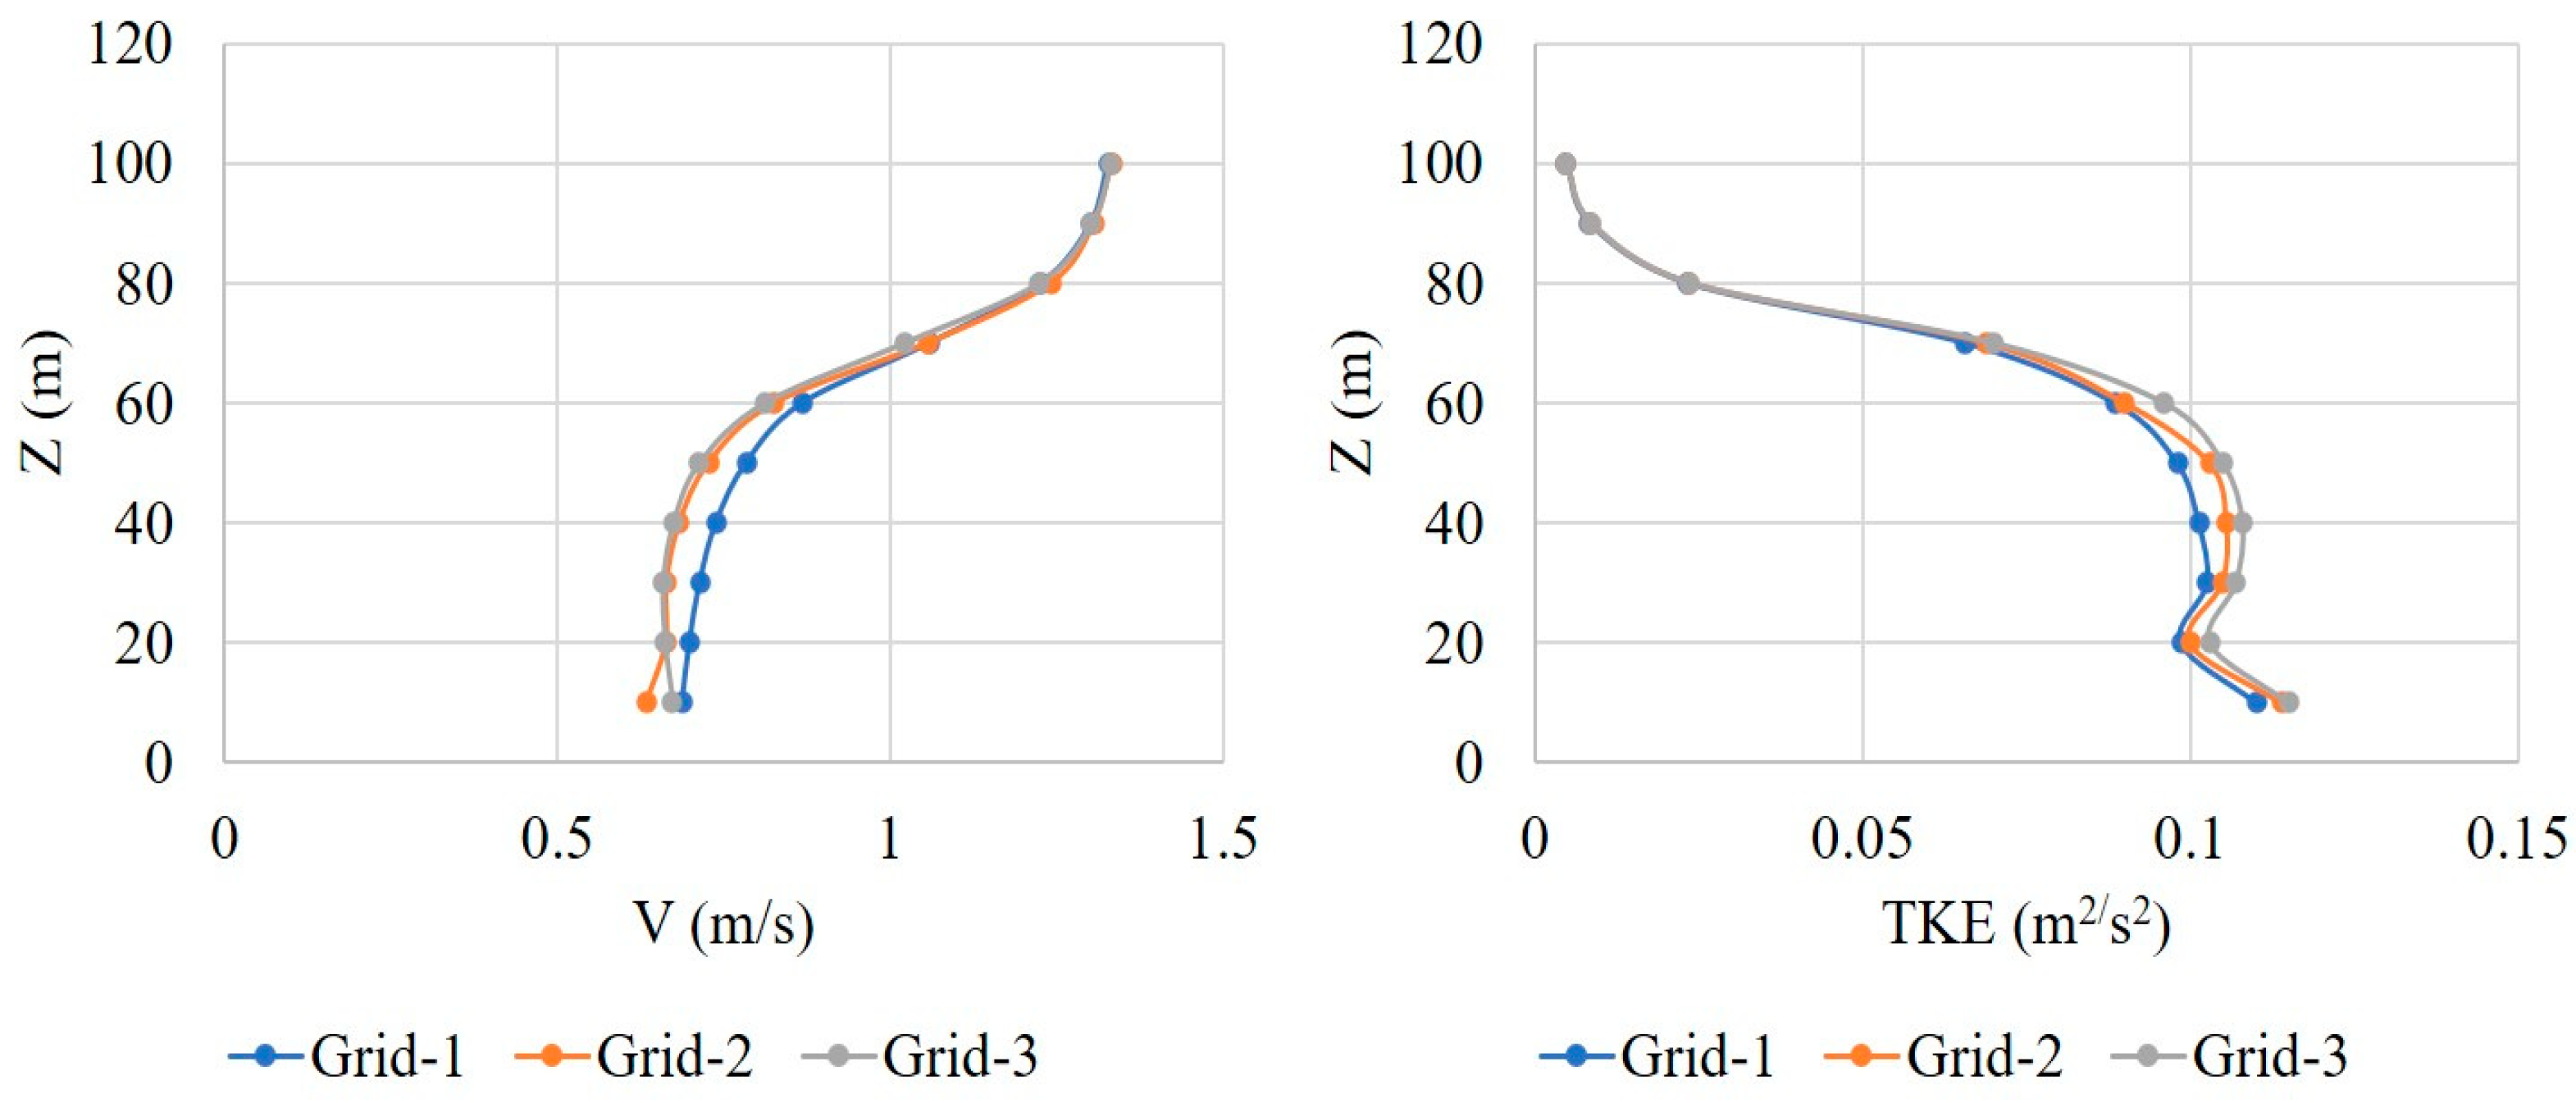
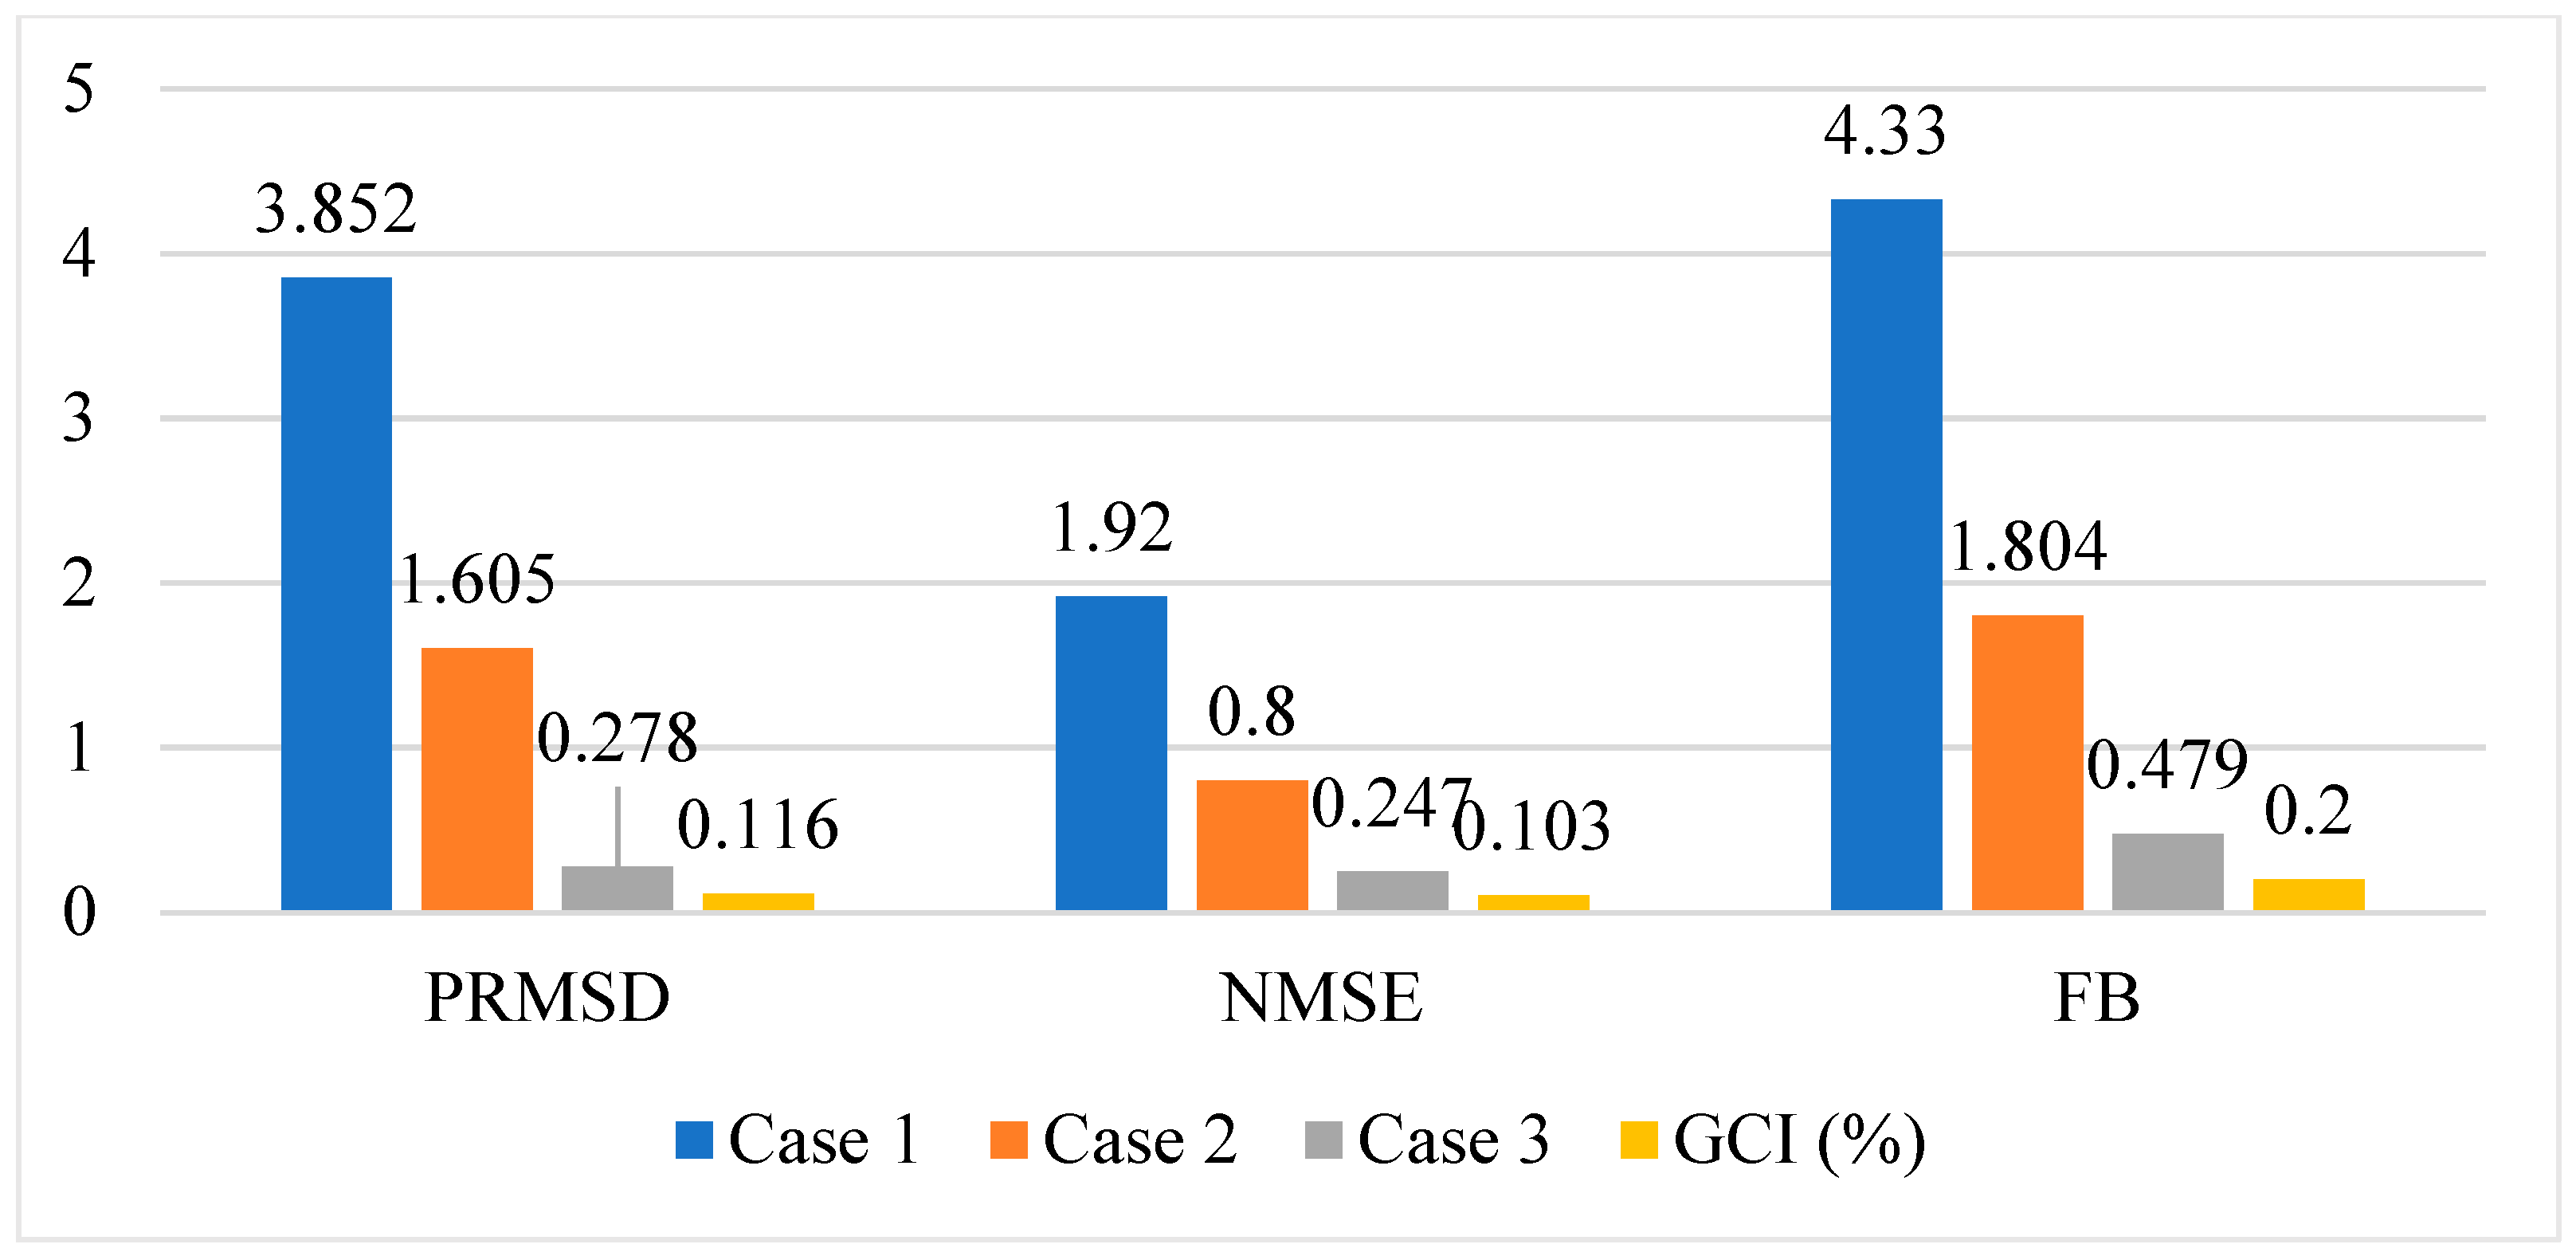
2.5. Grid-Dependence Analysis
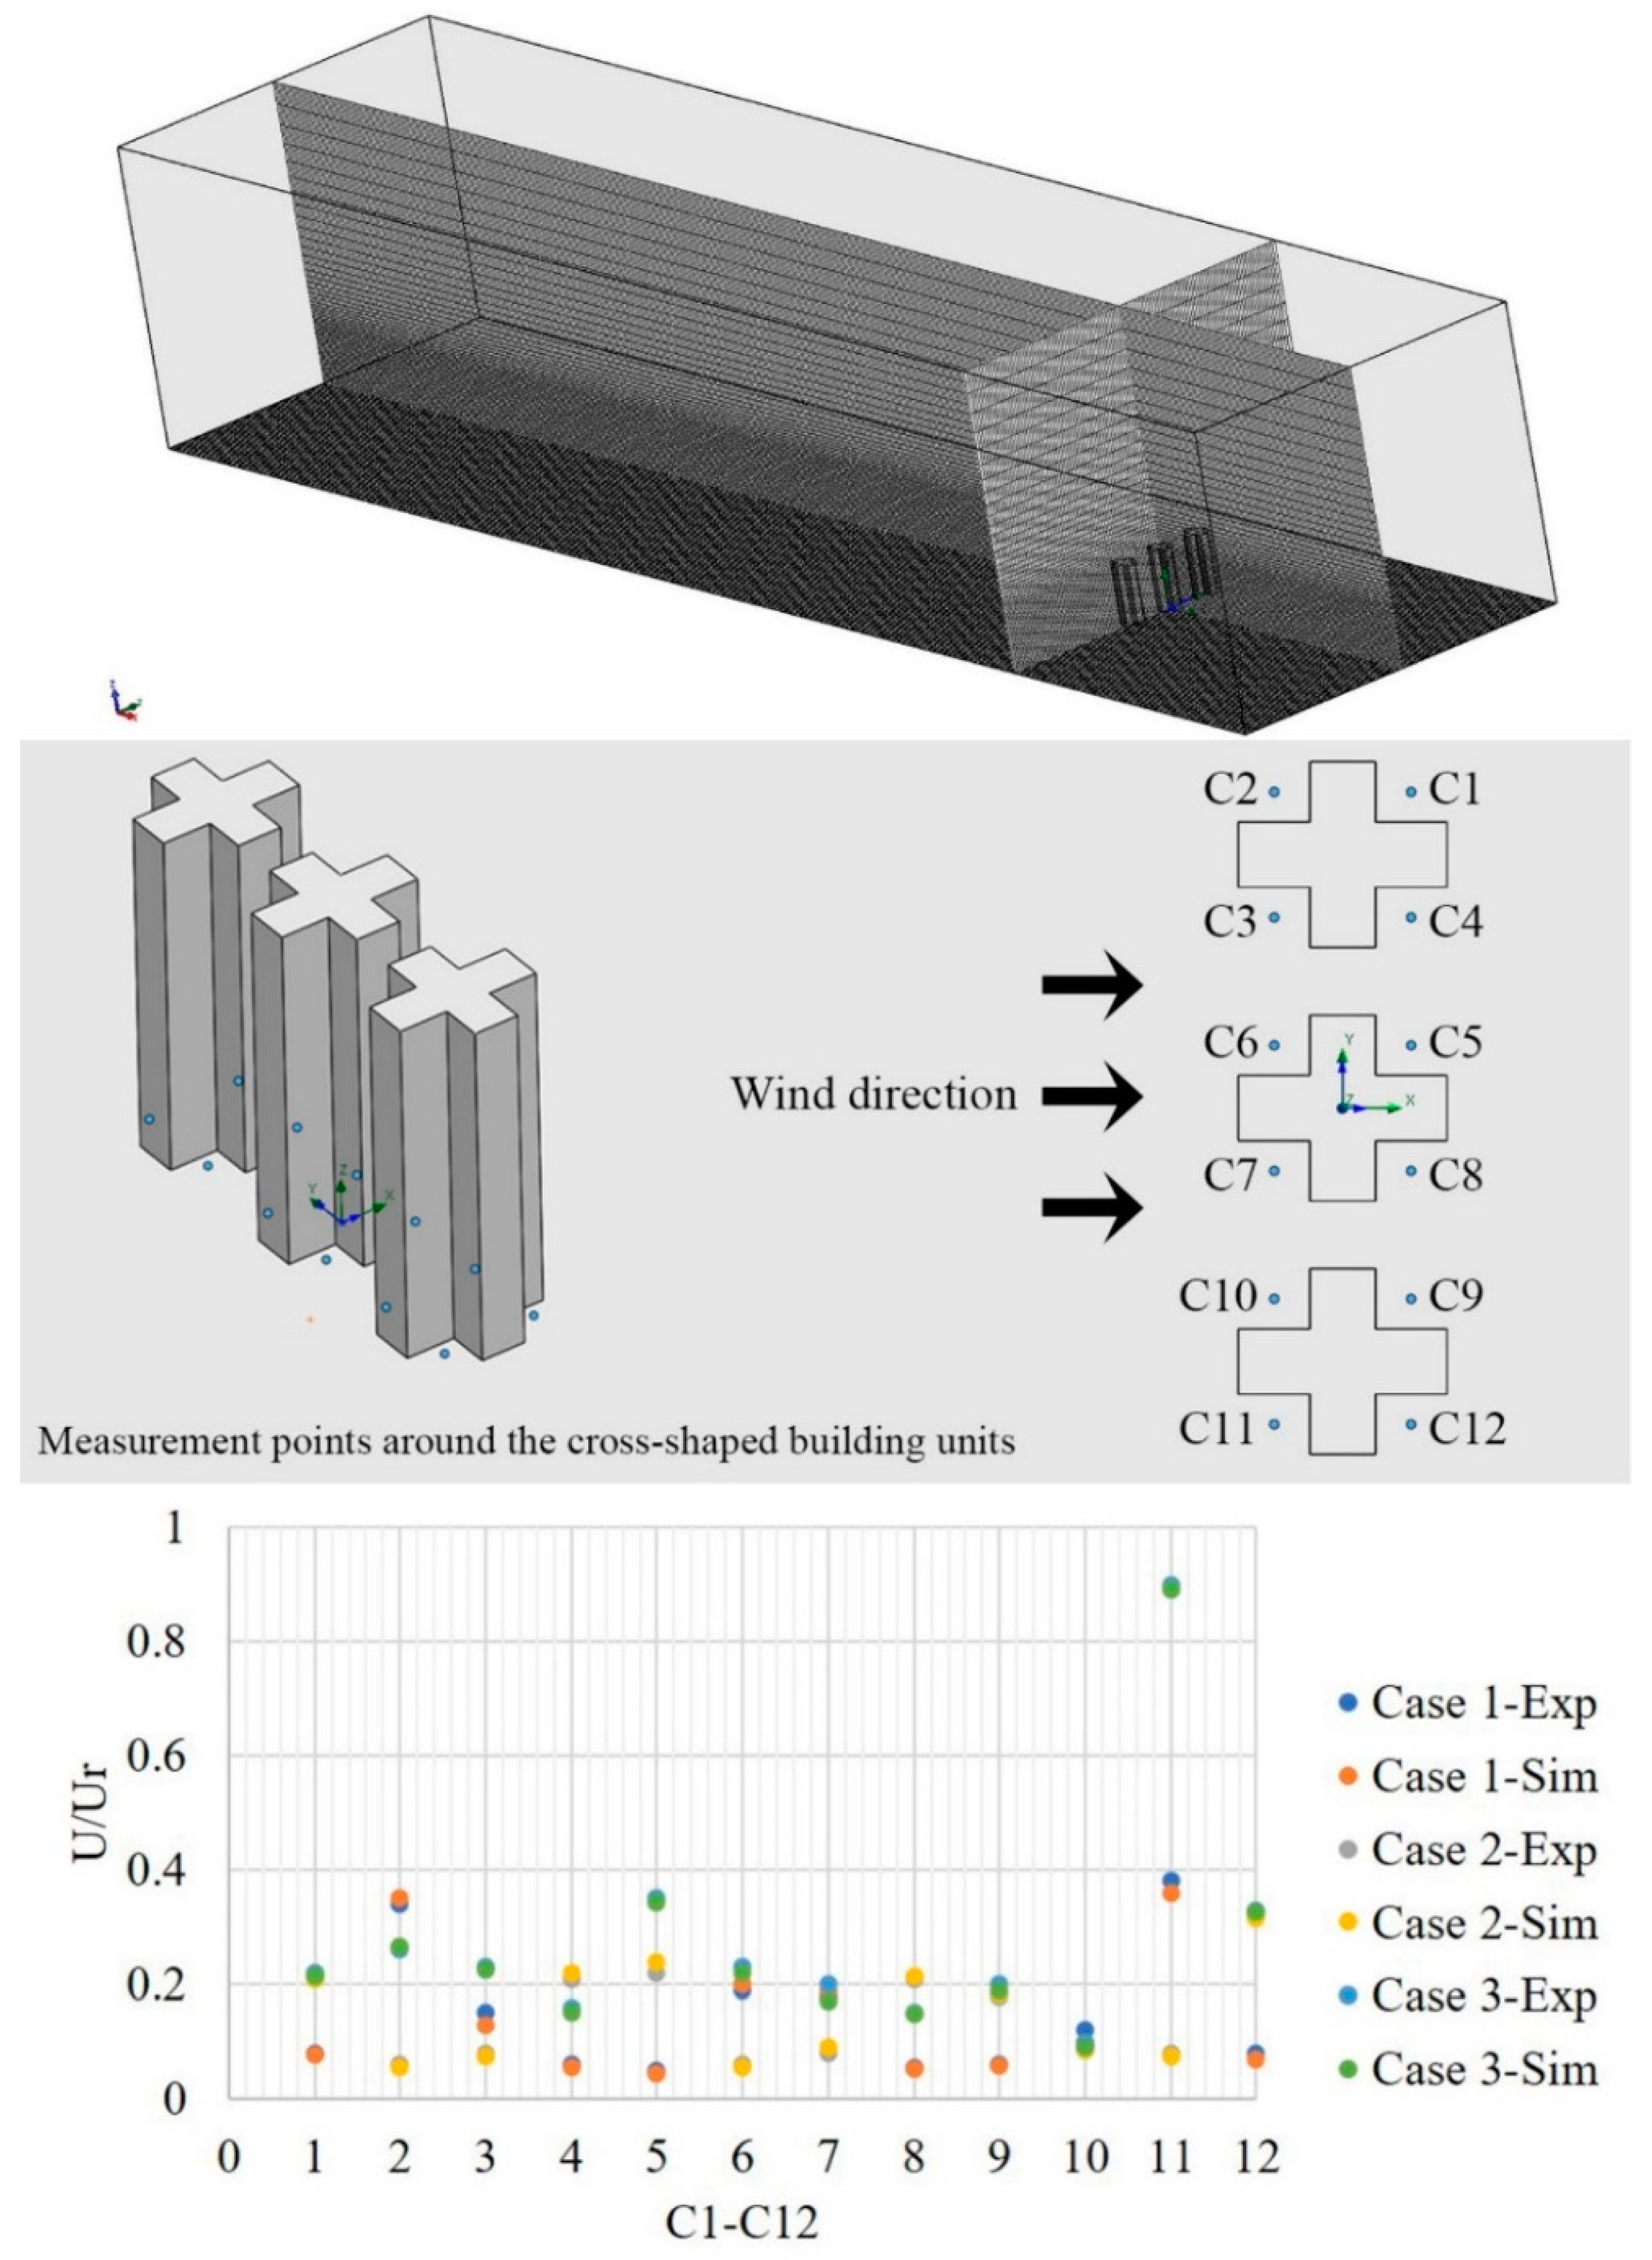
2.6. CFD Simulation Validation Based on Experiment
2.7. Influence Evaluation
- (1)
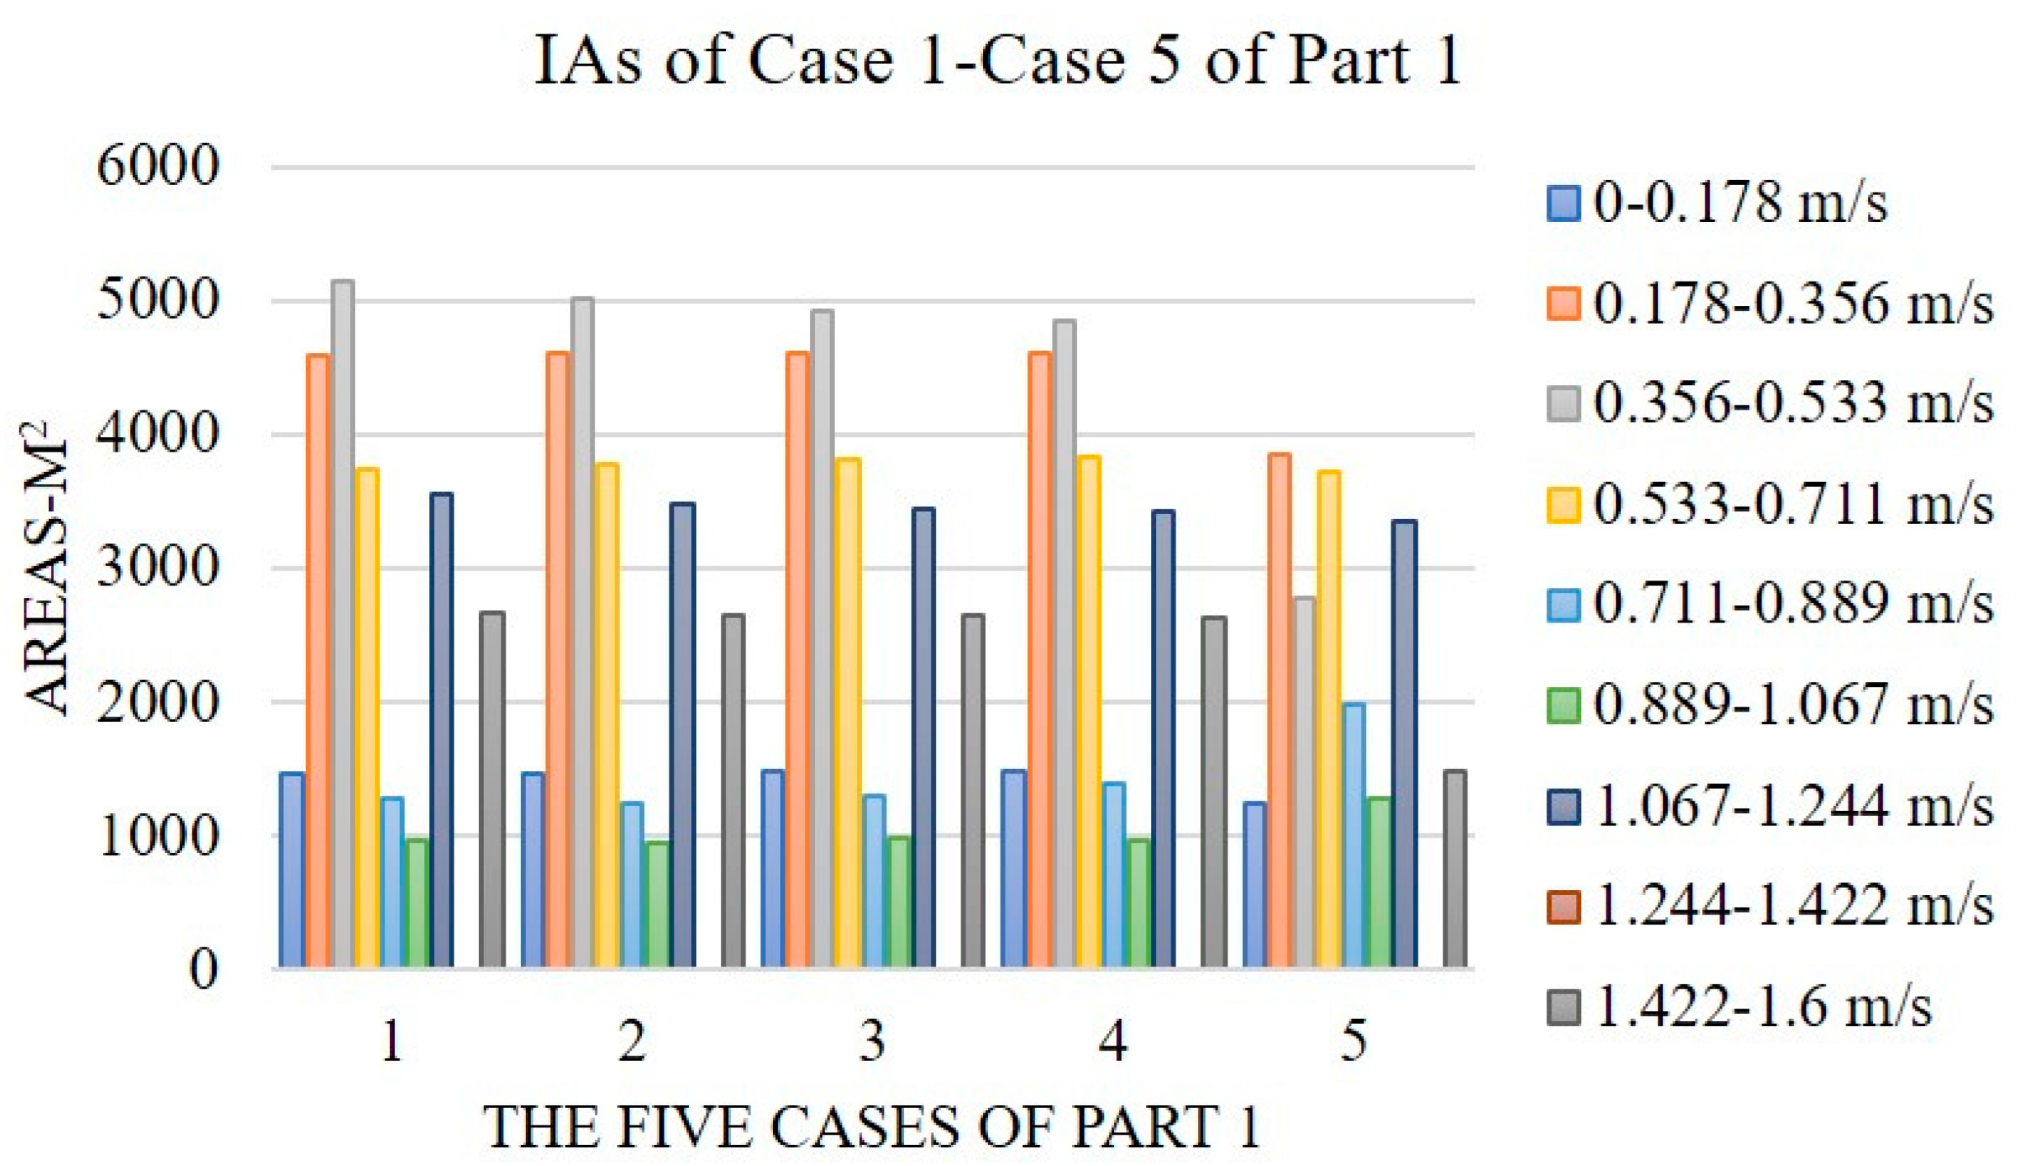
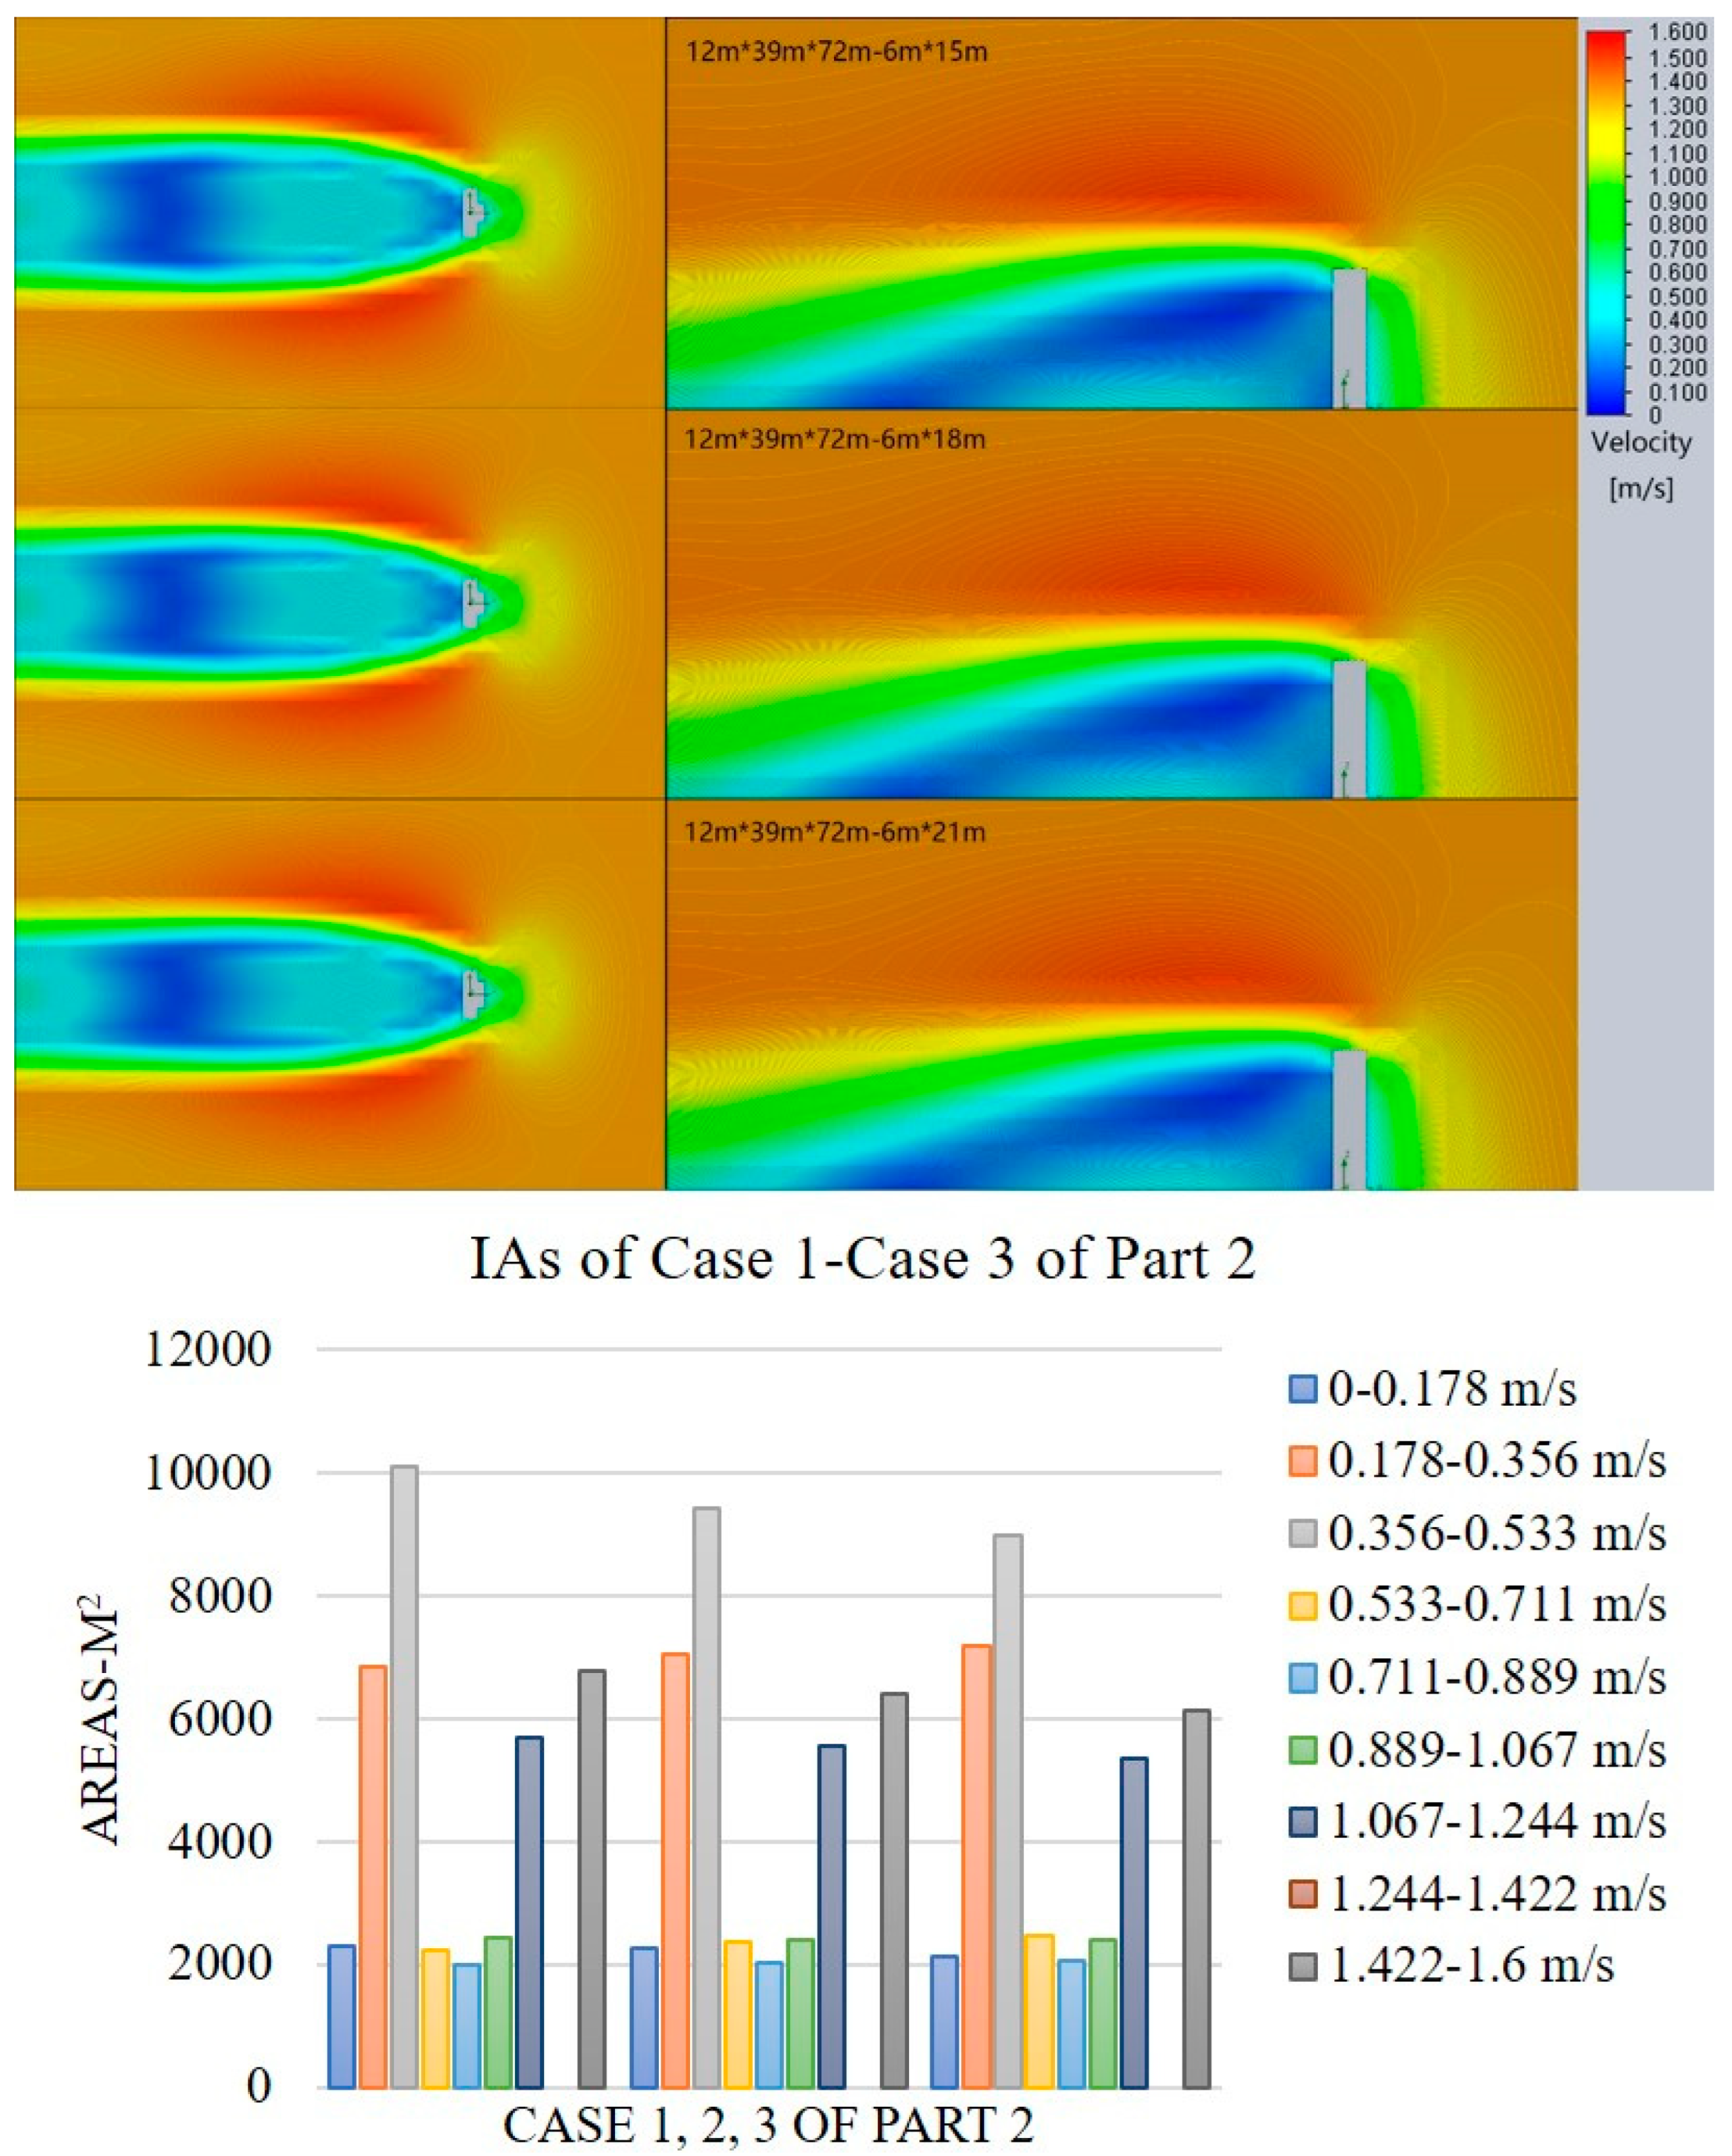
- Analysis of IAs
- (2)
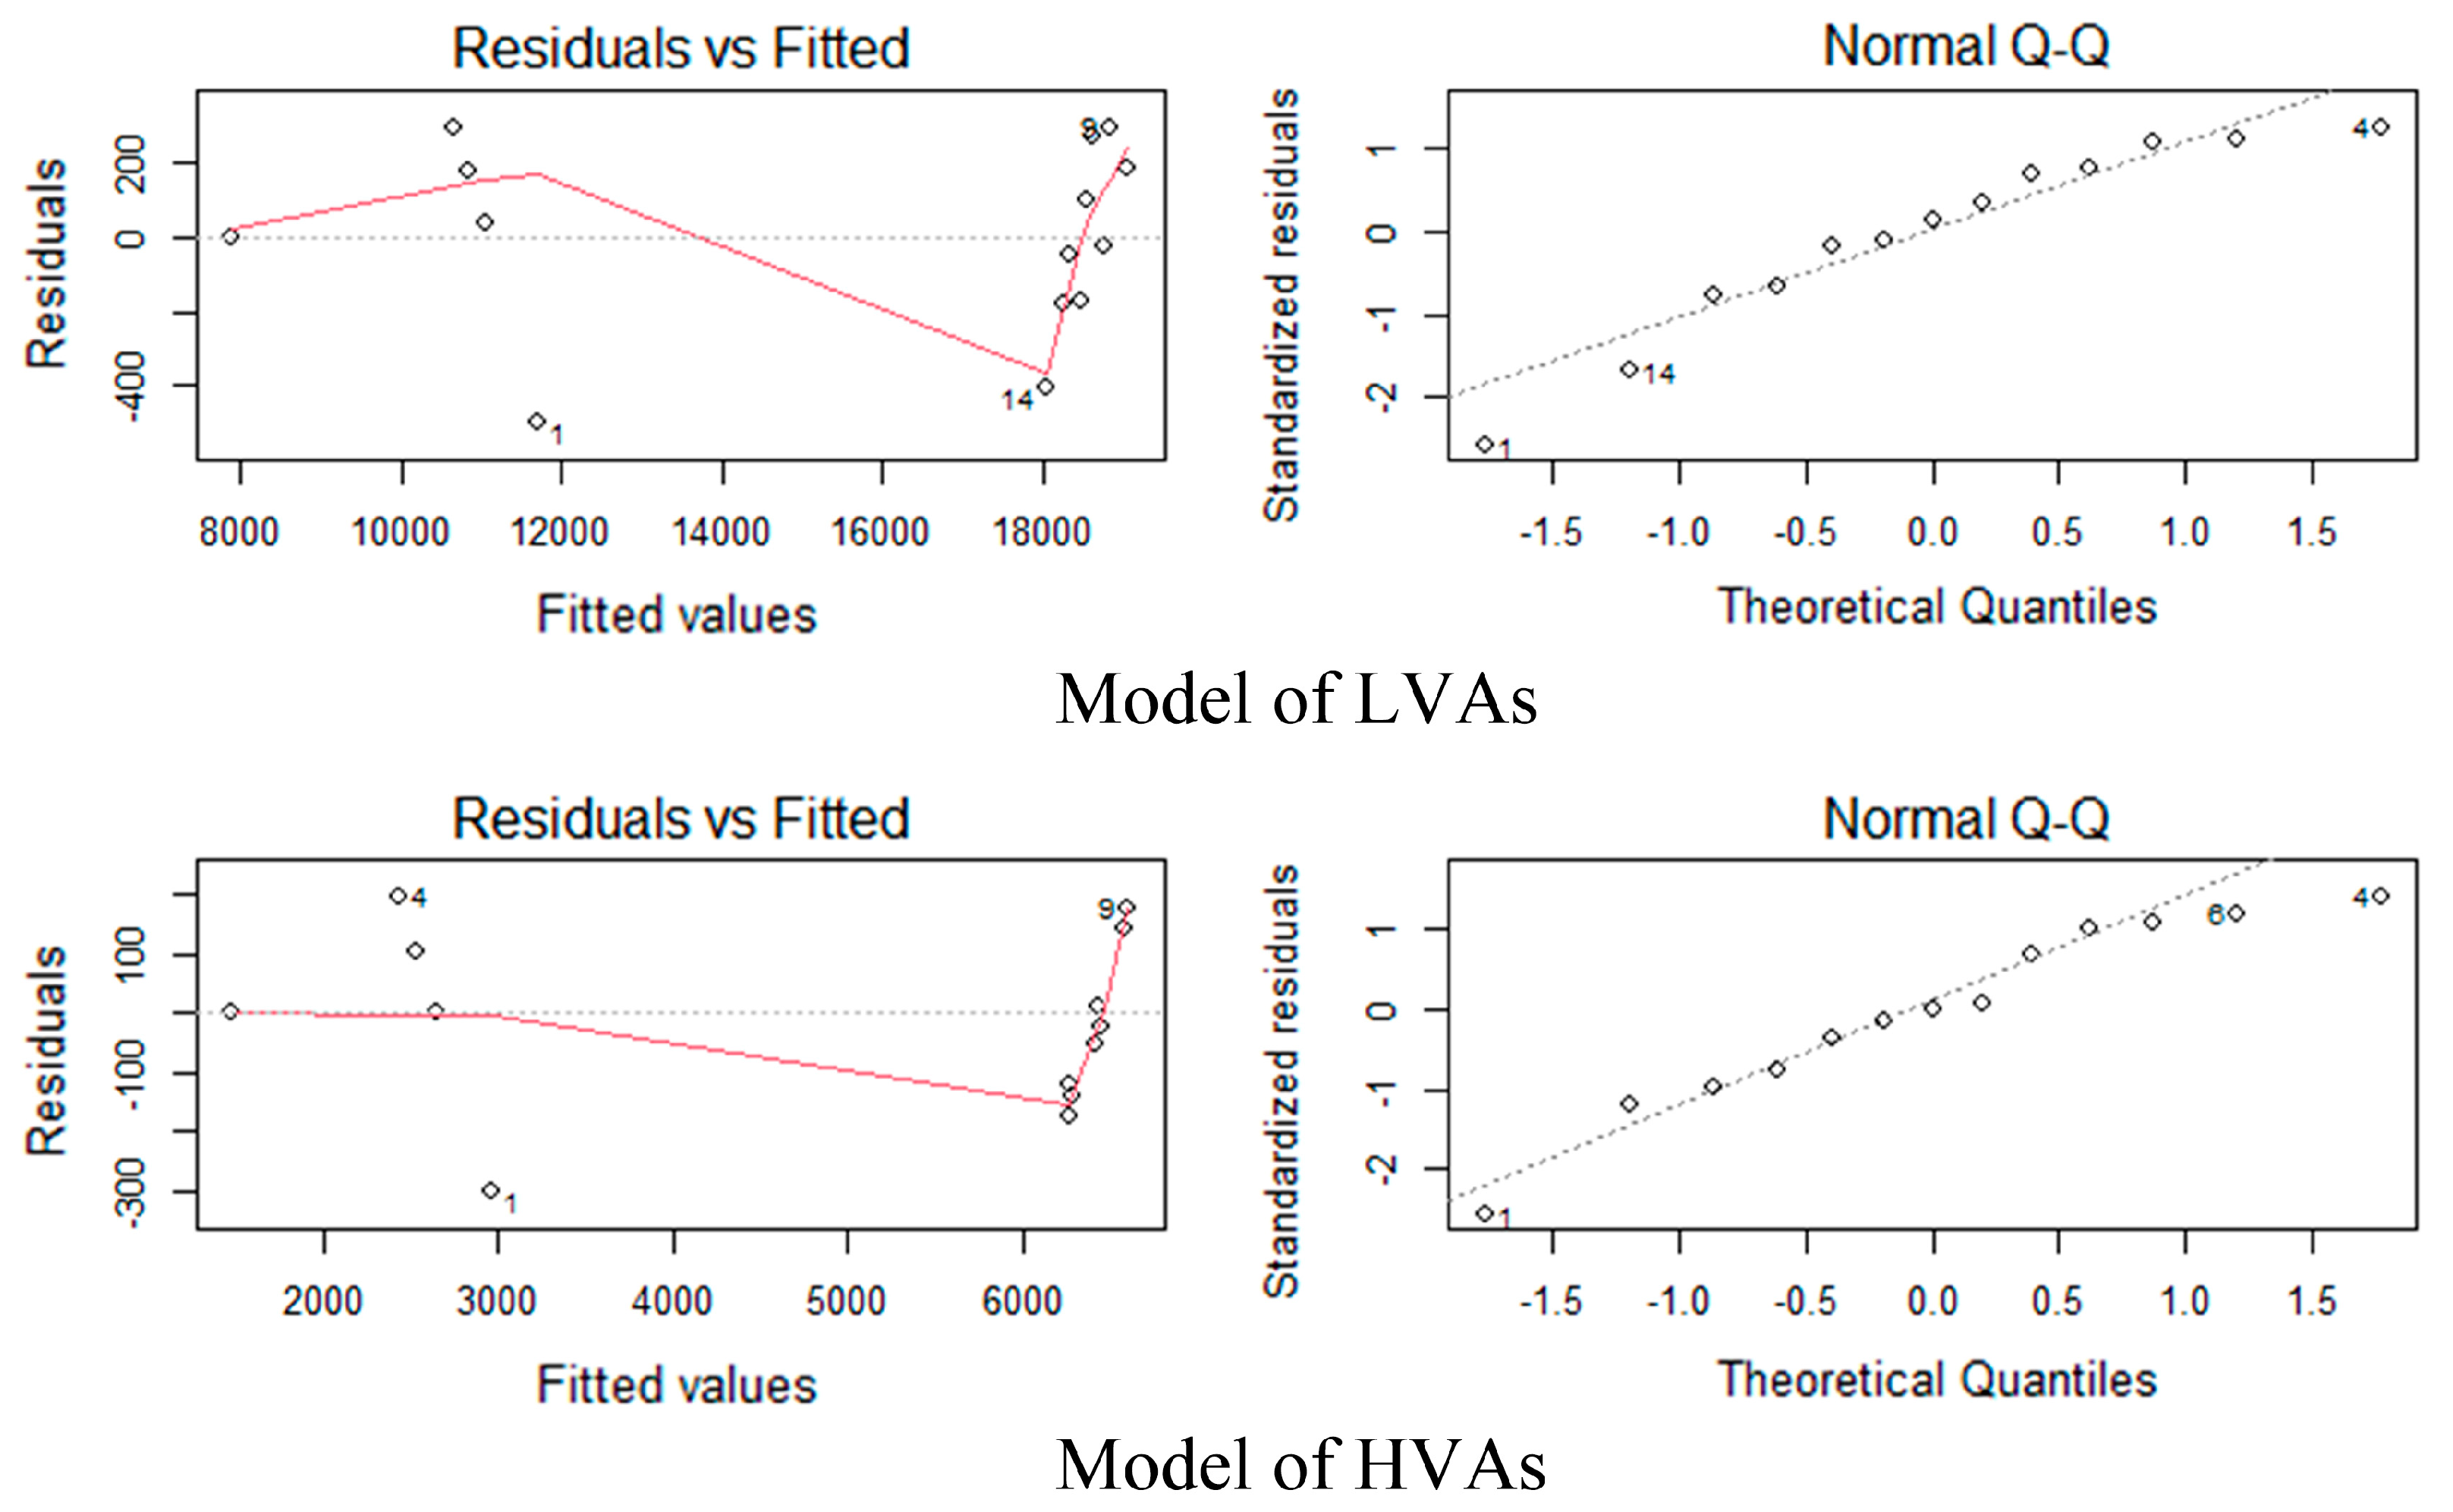
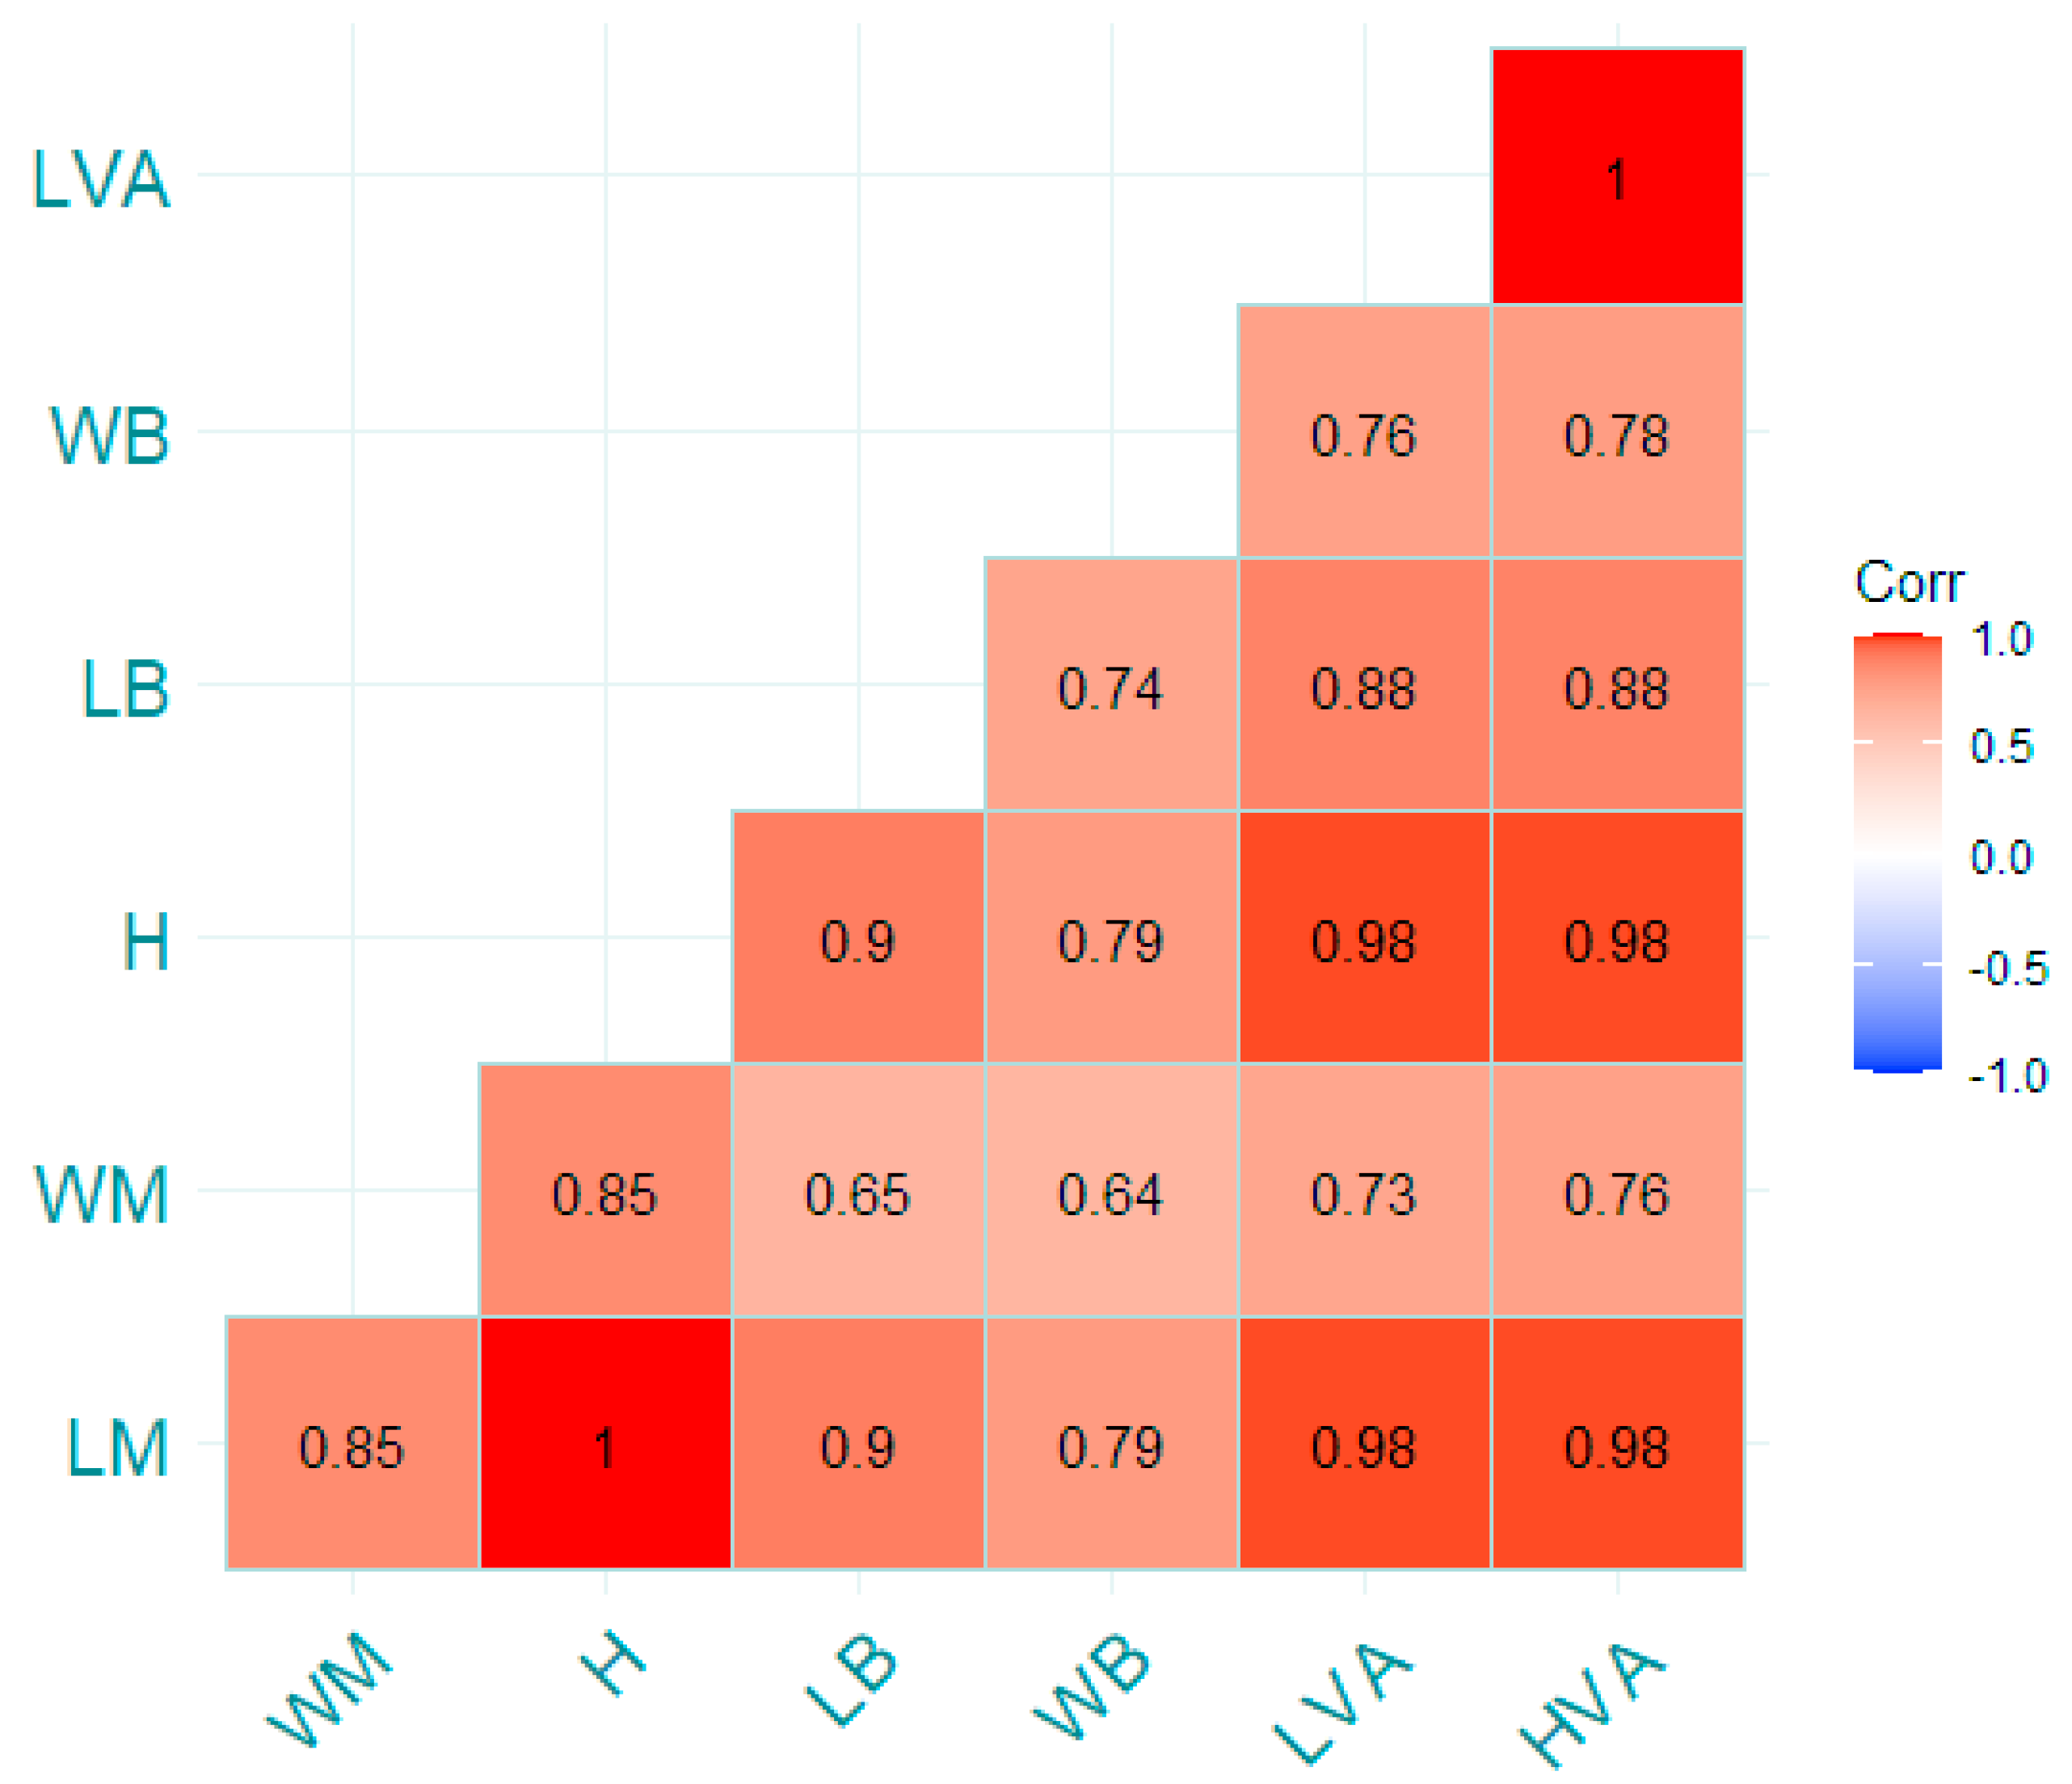
- Correlation and MLR analysis of influences from geometrical variables
3. Results Analysis and Discussion
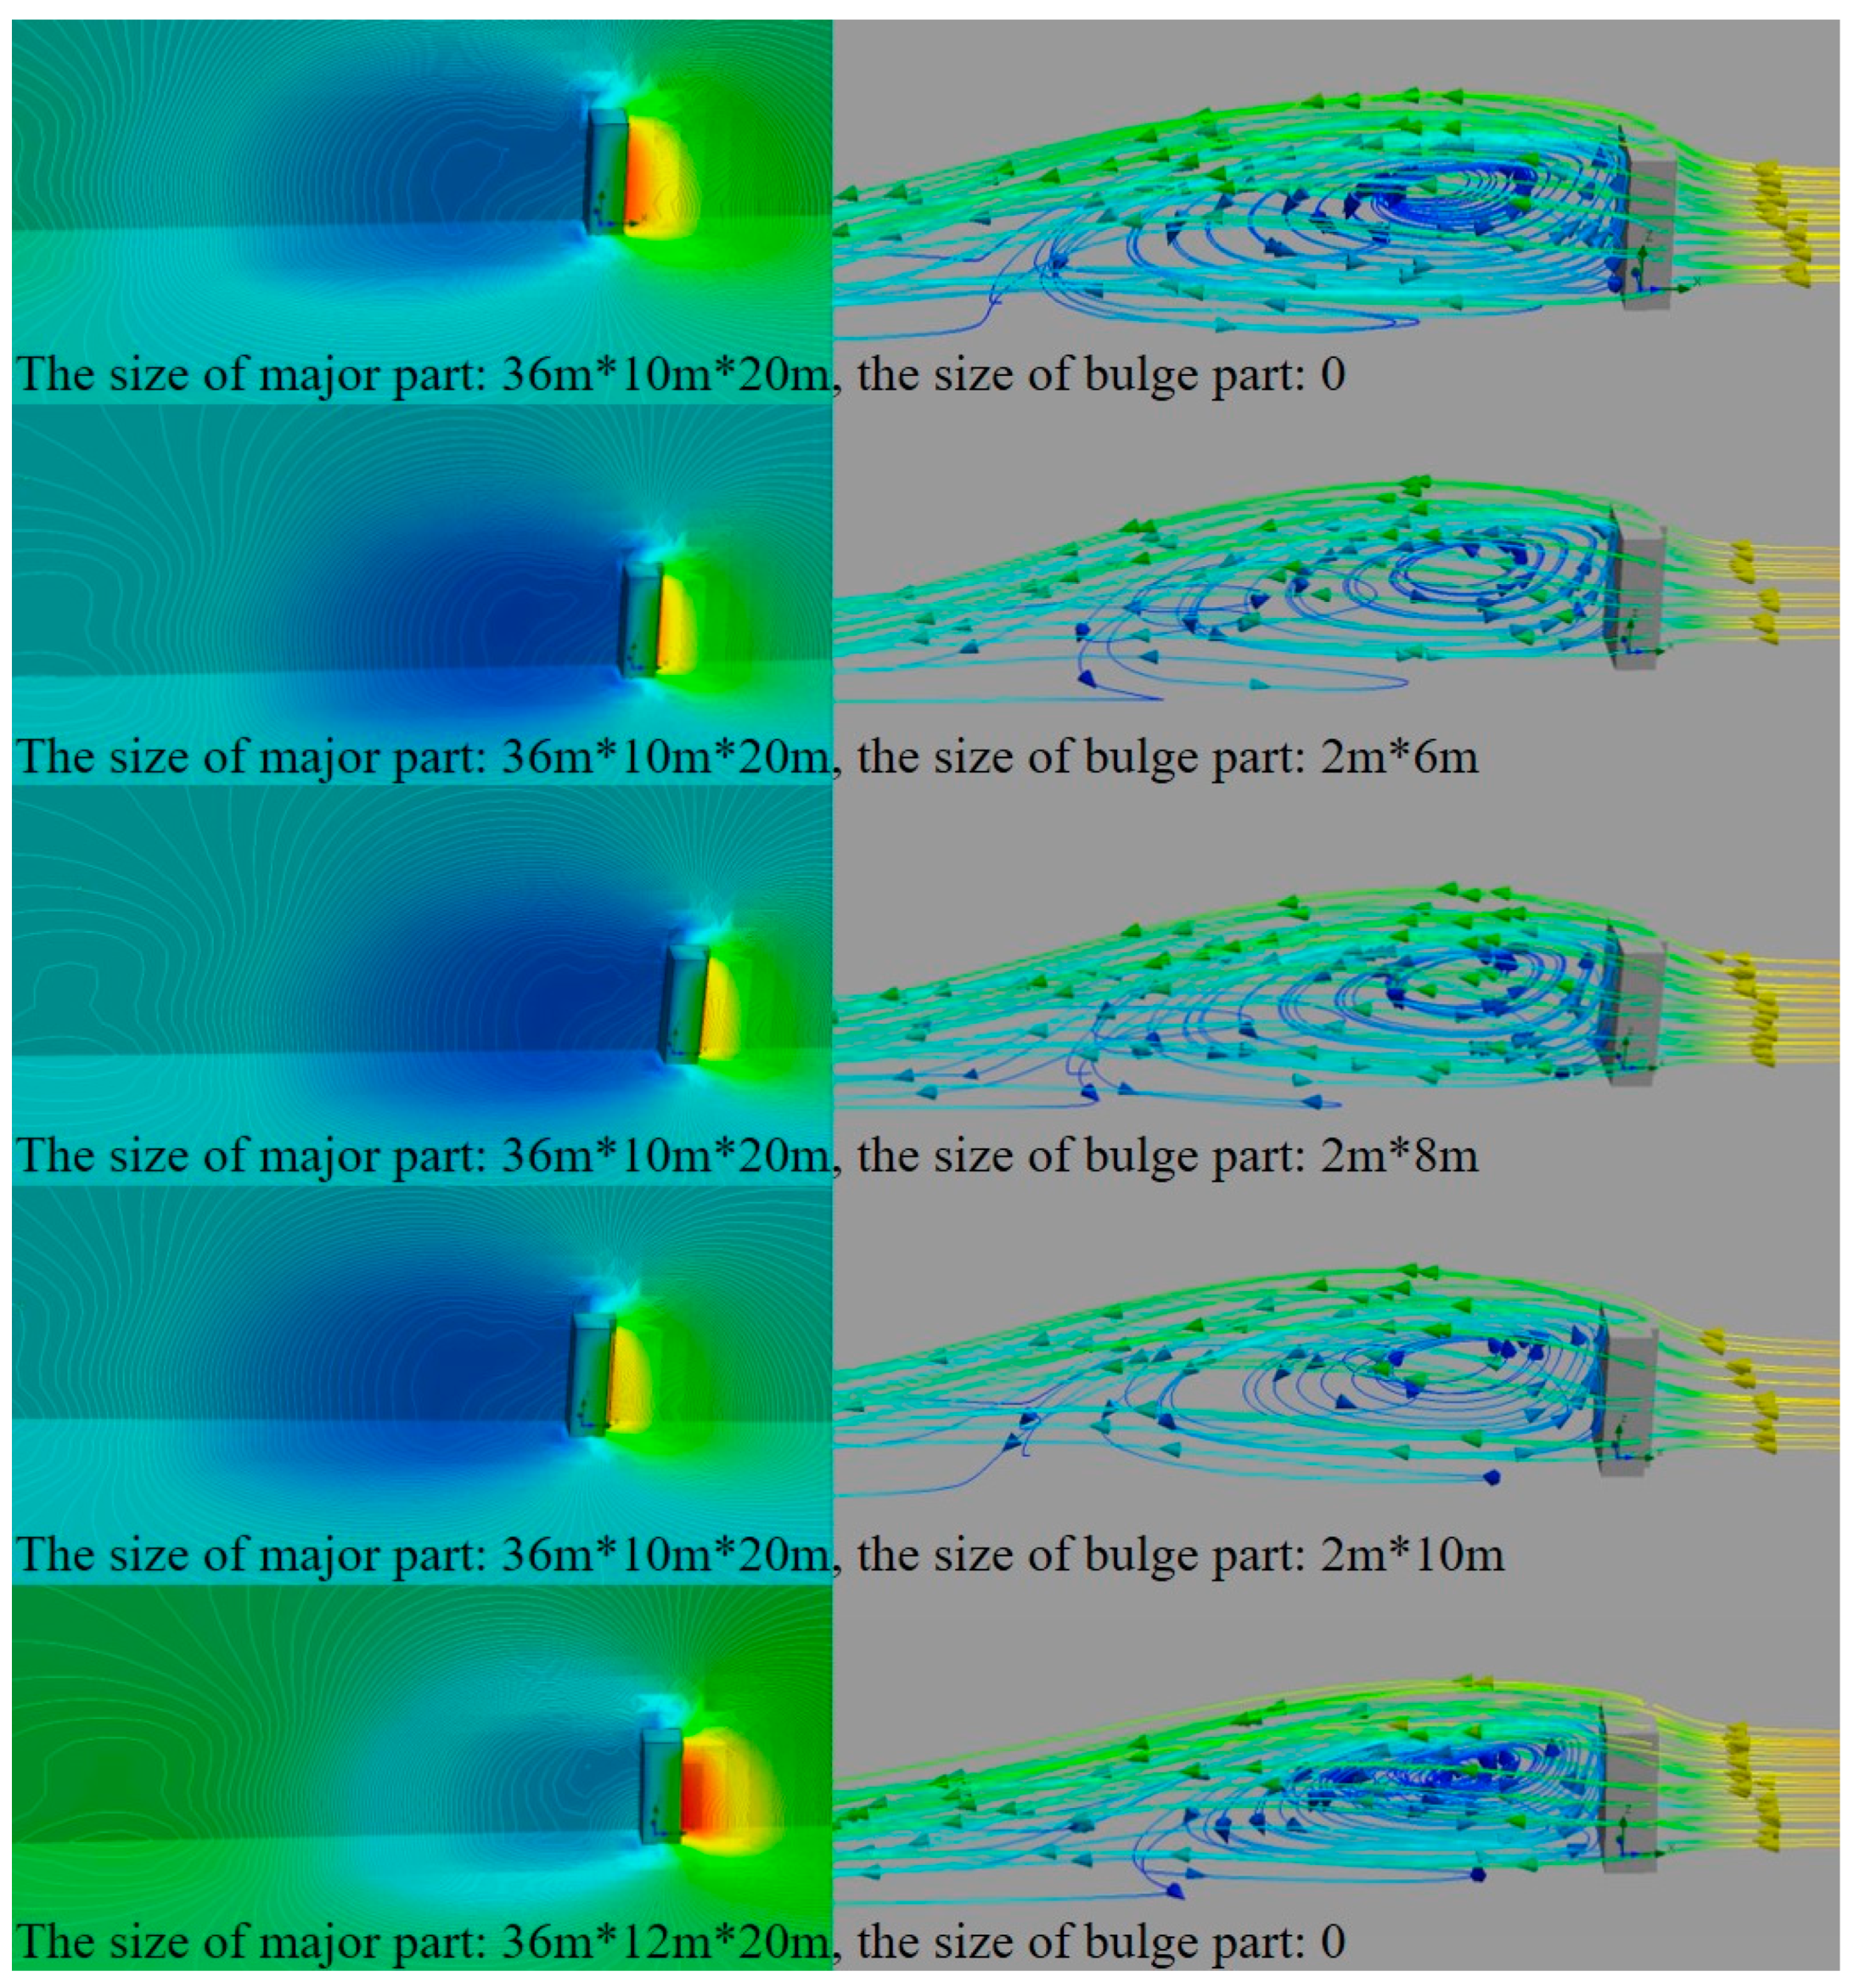
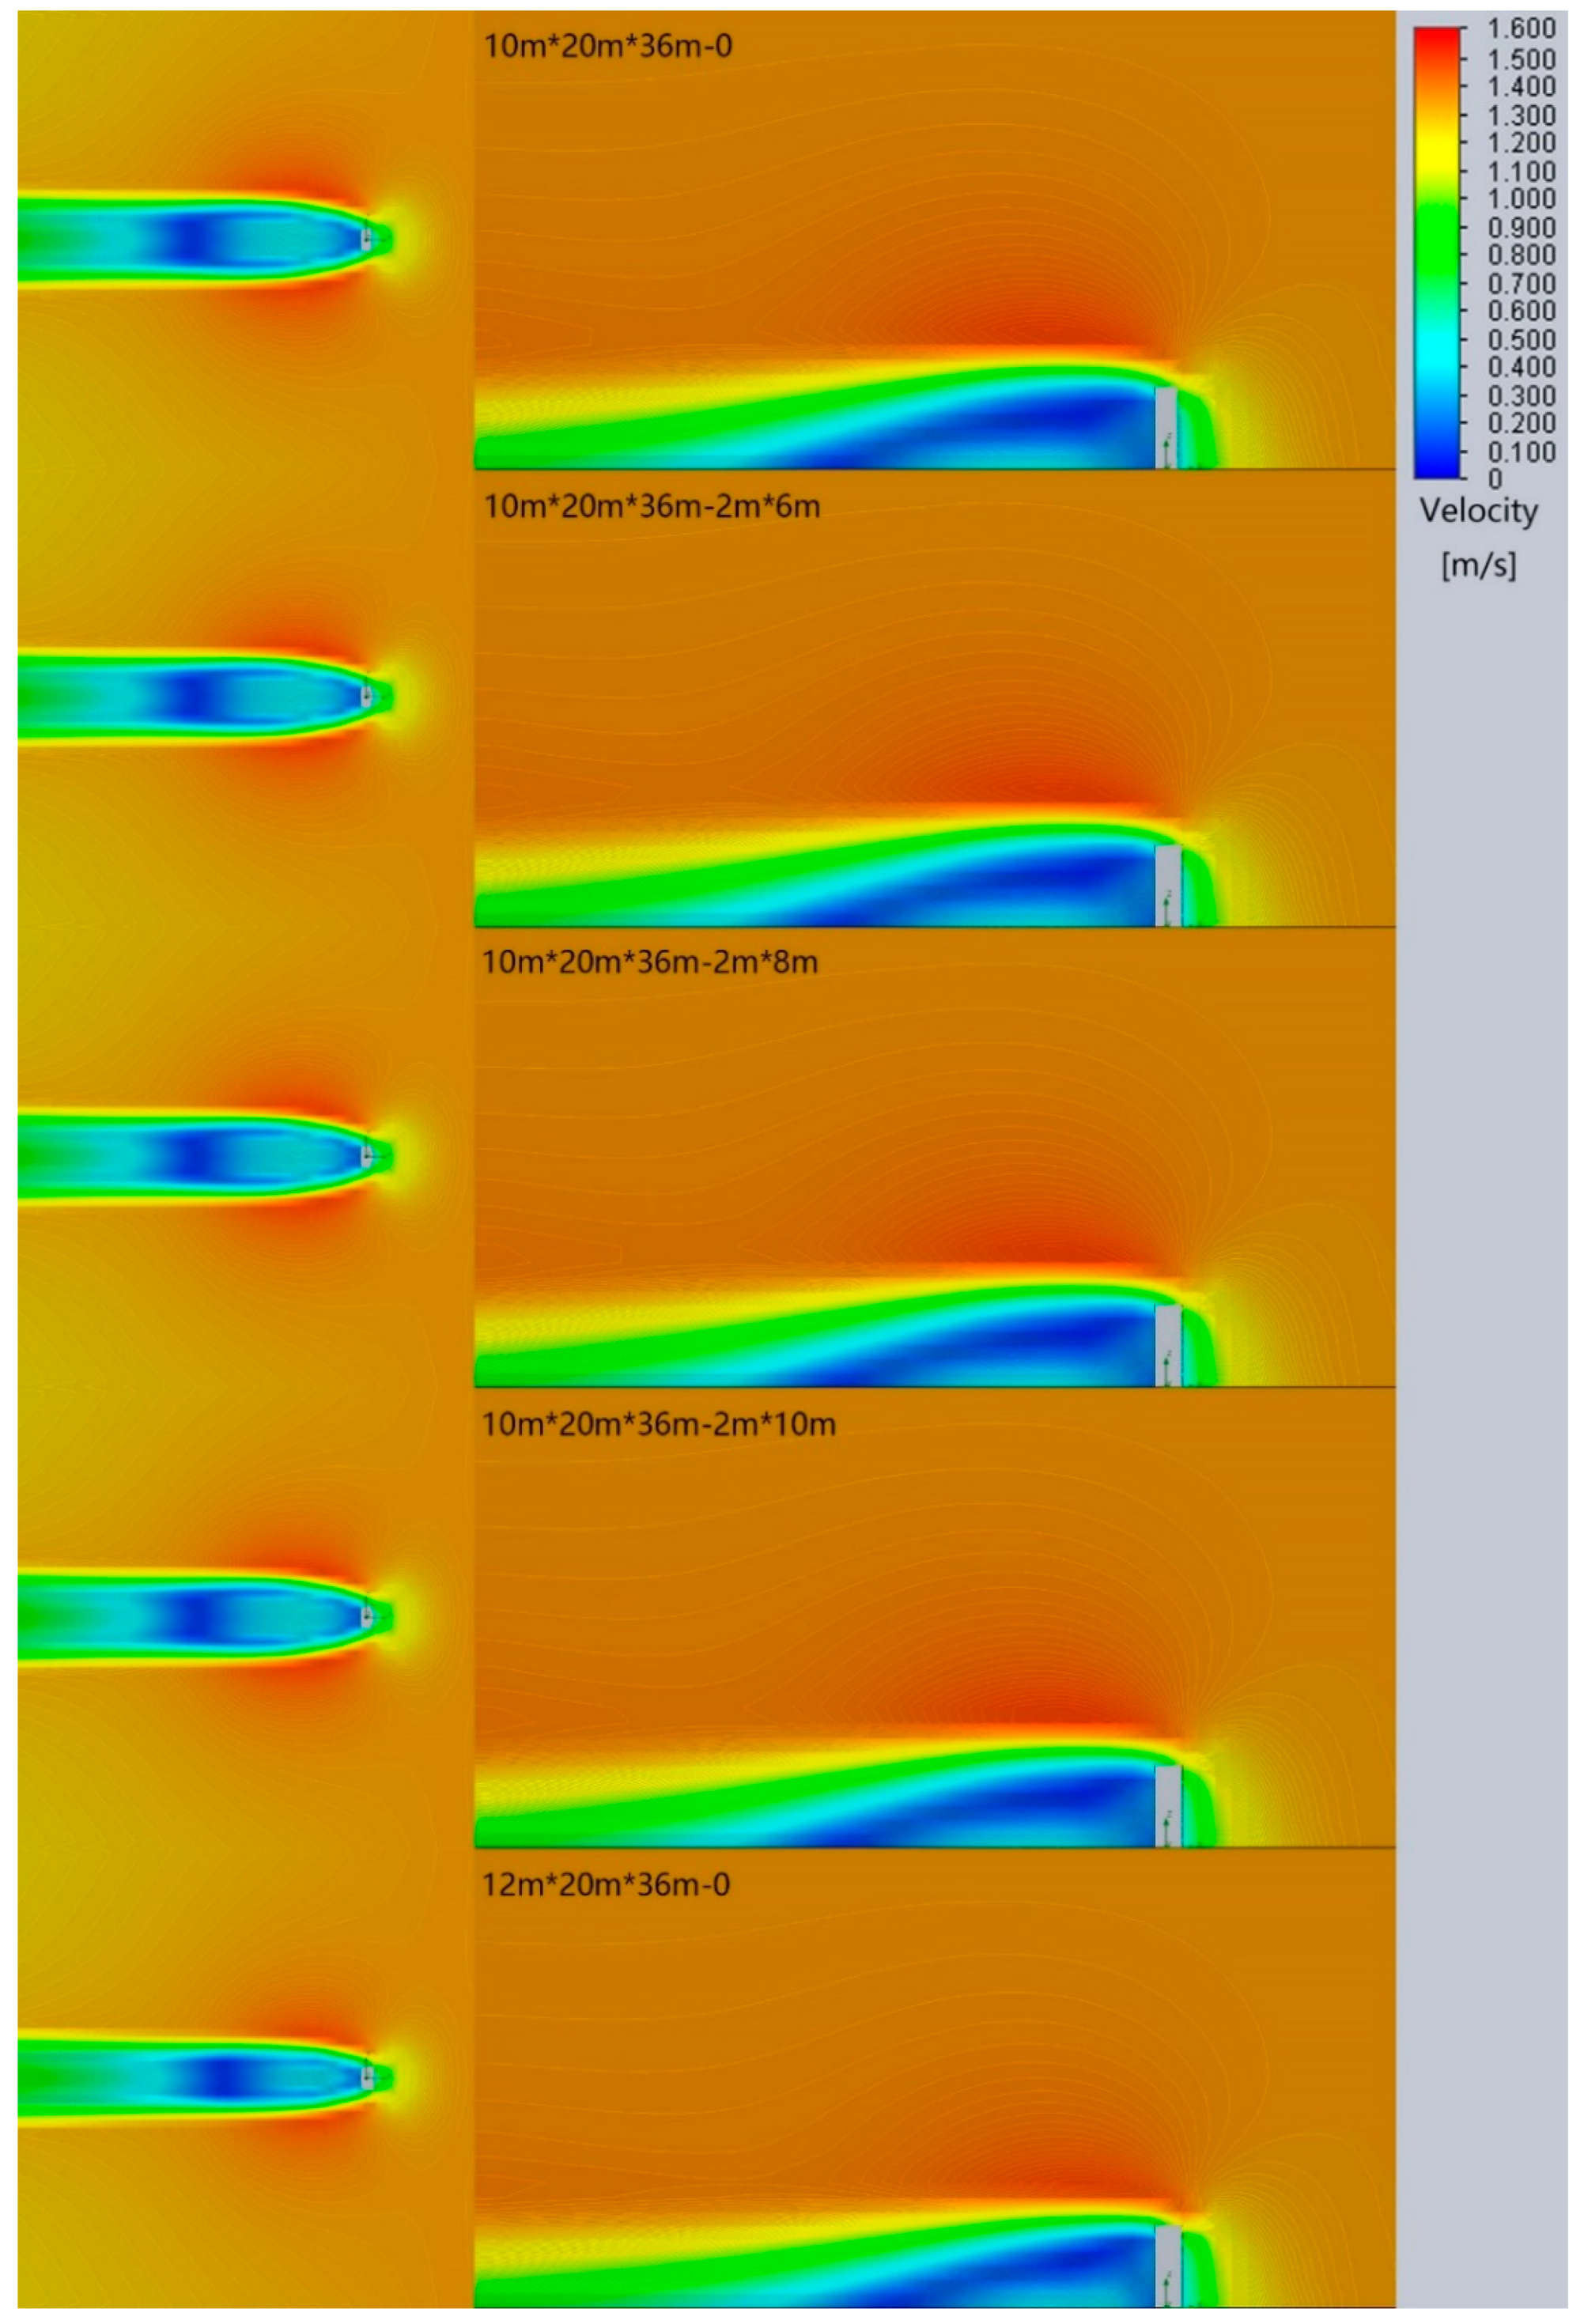
3.1. Part 1: 36 m-Height Buildings with Different Bulge-Part Lengths
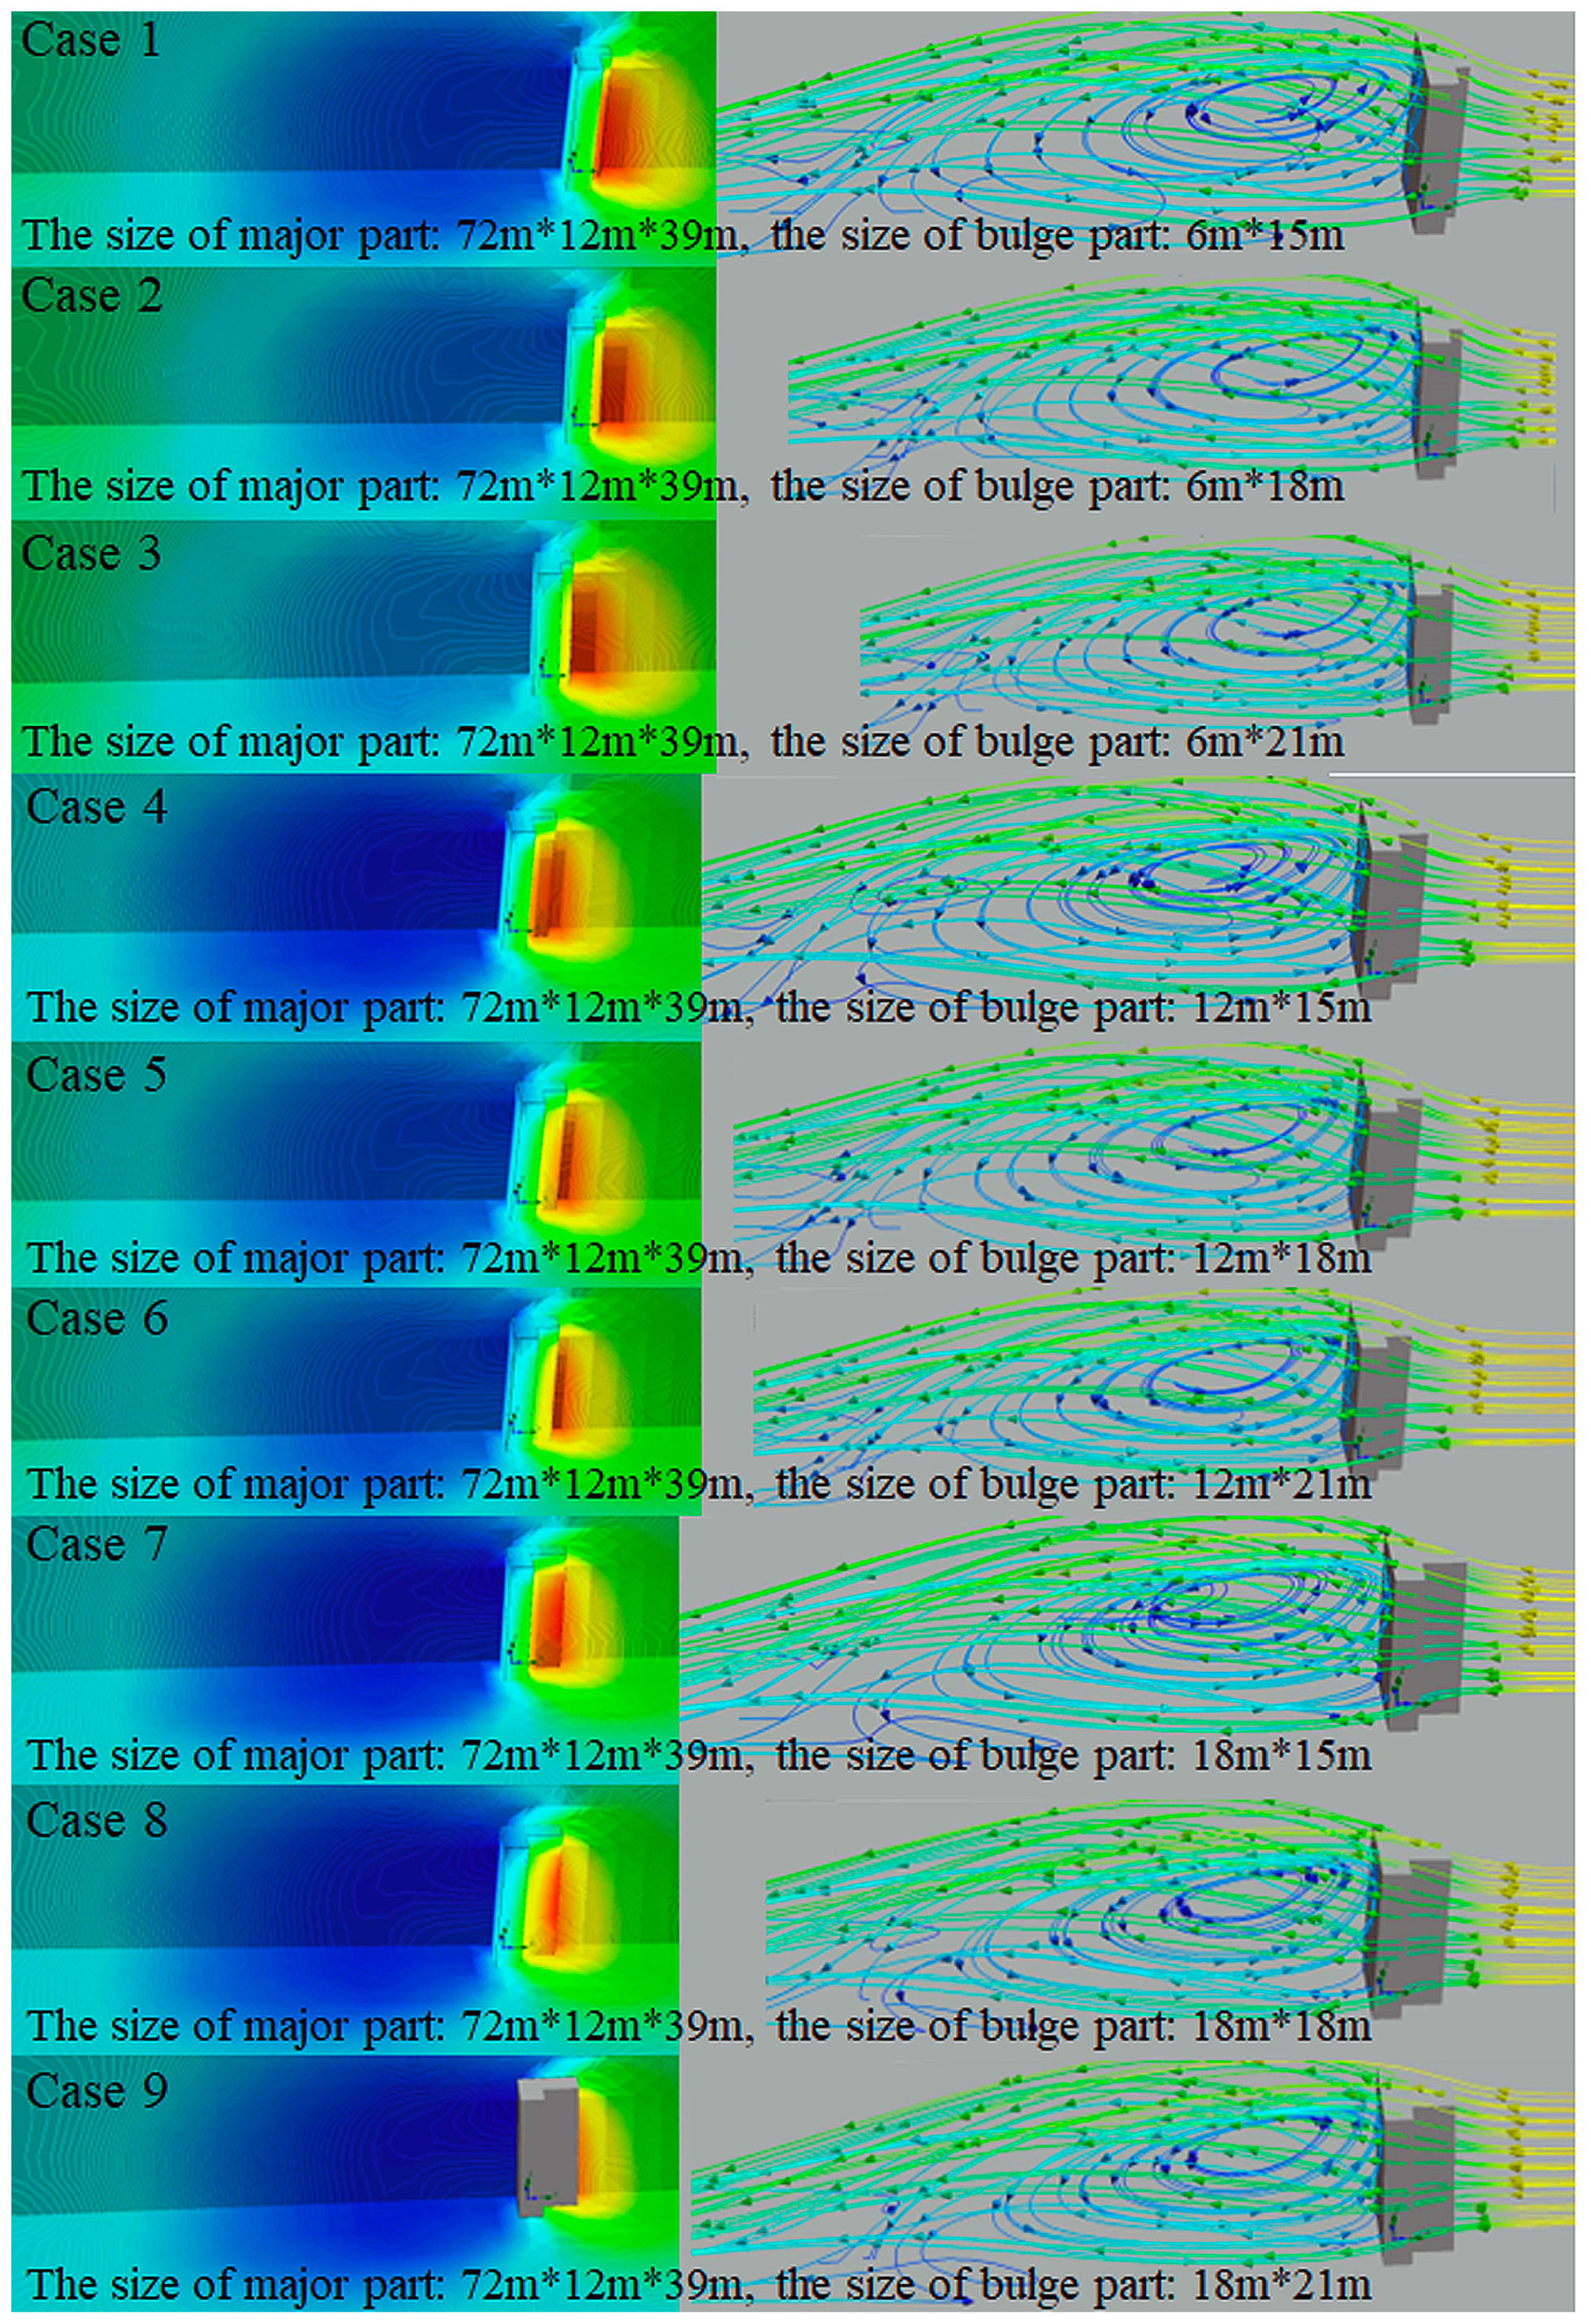
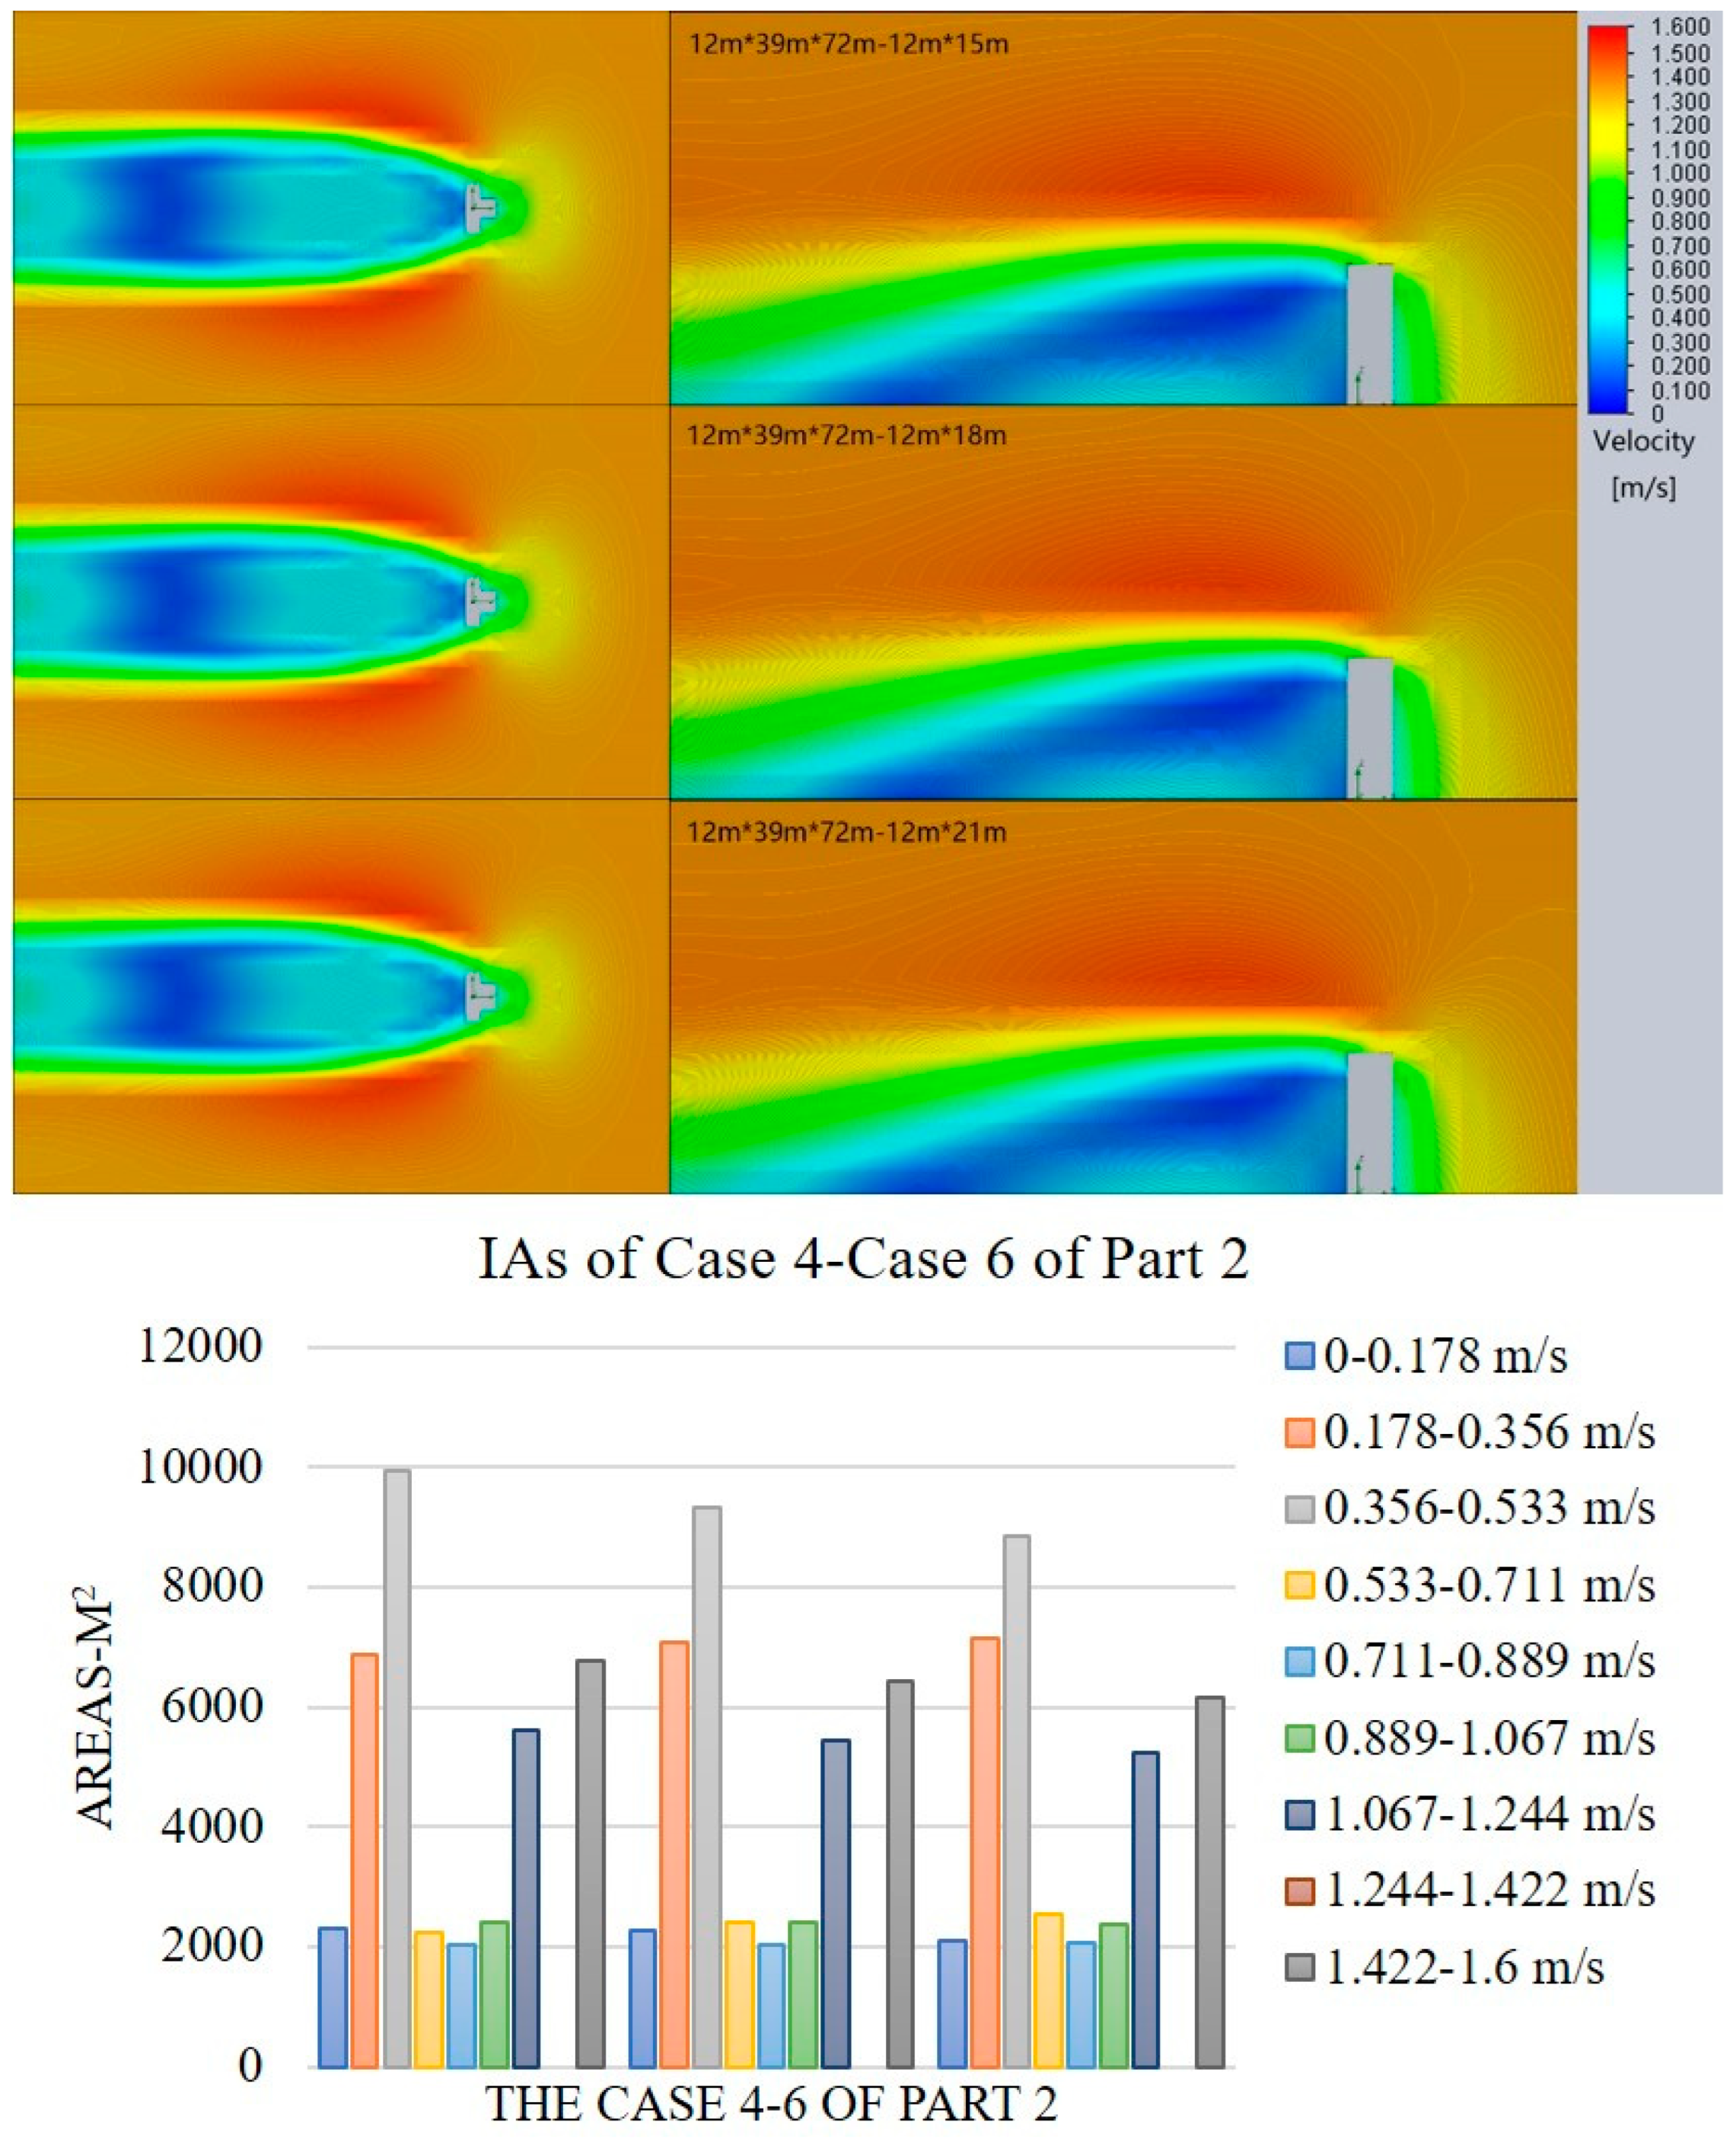
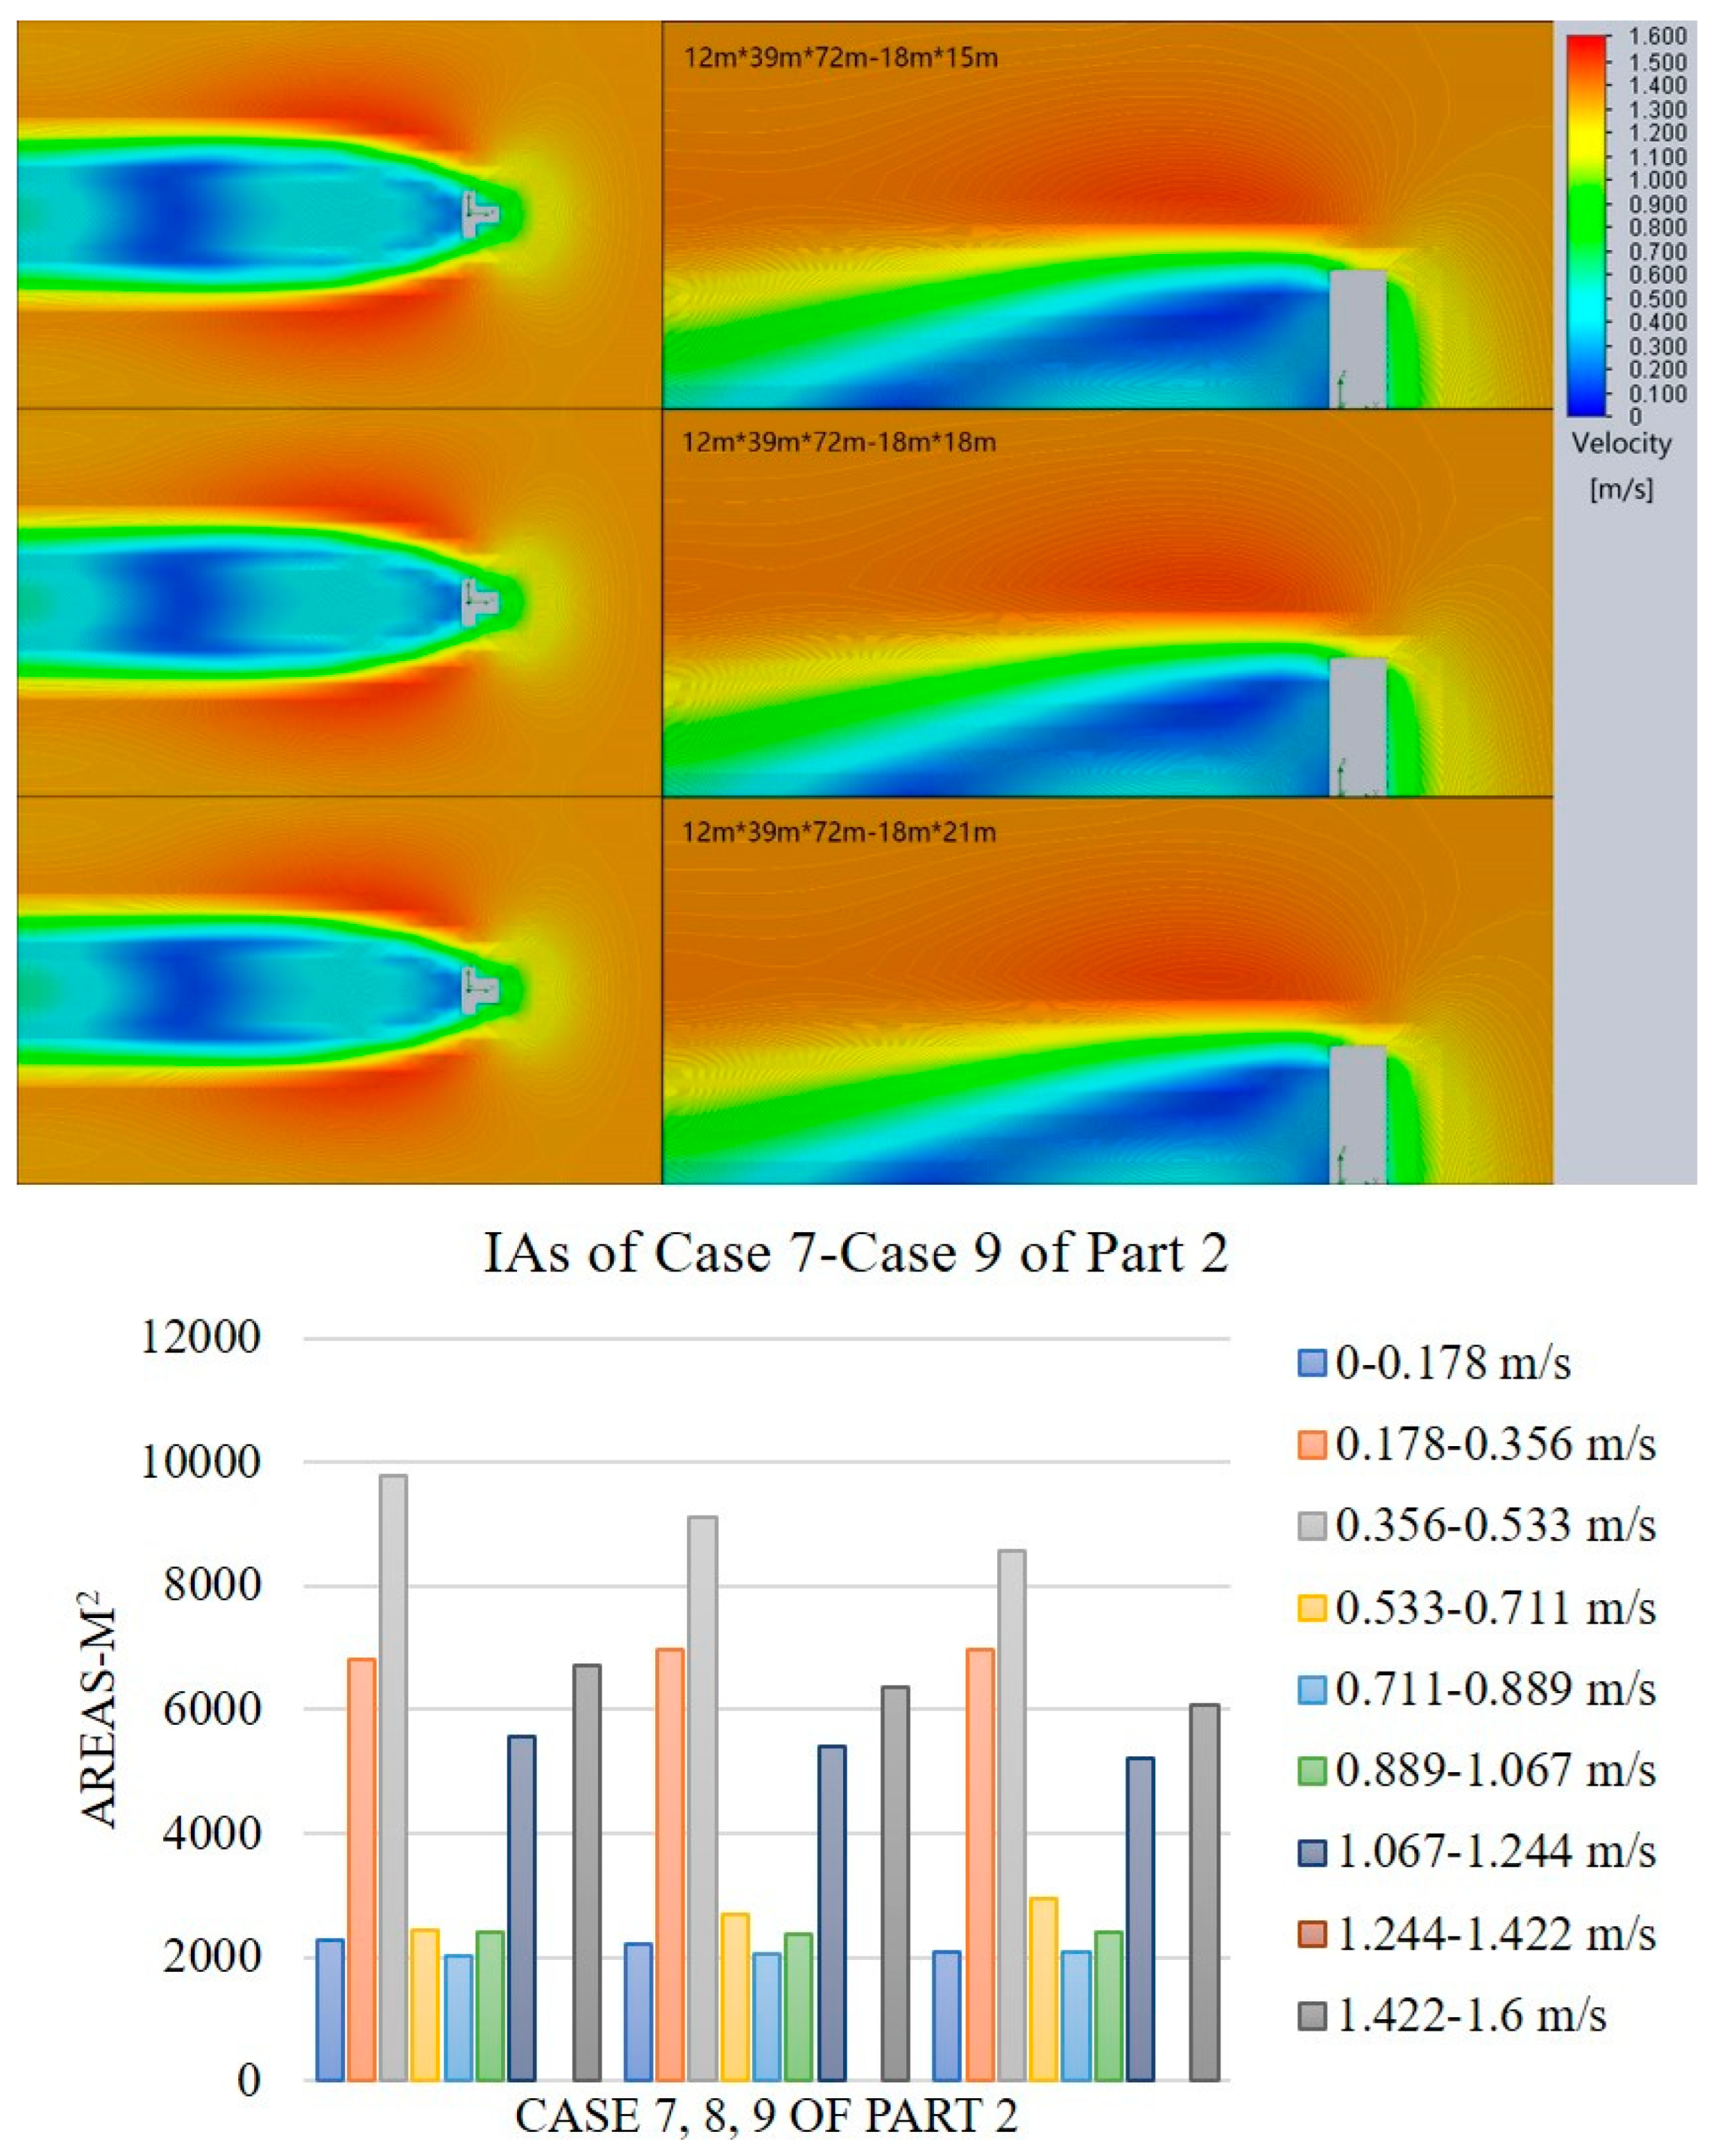
3.2. Part 2: 72 m-Height Buildings with Different Bulge-Part Lengths and Widths
3.3. Comparison of Influences on LVAs and HVAs from Geometrical Variables
3.4. Research Limitations and Future Research
4. Conclusions
- (1)
- The influences on wind environments decrease as the bulge-part sizes increase; the decrease of the bulge-part sizes can cause a contrary effect. The study reveals that increasing bulge-part sizes lead to decreased influences on wind environments, with changes in IAs, LVAs, and HVAs correlating with variations in air pressure and vortices. Both length and width extensions of bulge parts contribute to reducing wind environment influences, thereby promoting outdoor ventilation around T-form buildings.
- (2)
- Our quantitative comparison indicates that the promotion of outdoor ventilation caused by the increase of the bulge-part length is more than the increase of the bulge-part width for a T-form building. Quantitative comparisons demonstrate that increasing bulge-part length yields greater promotion of outdoor ventilation compared to width extensions for T-form buildings. The analysis highlights a notable decrease in LVAs on the leeward side with elongation of the bulging part, indicating enhanced airflow circulation around windward corners.
- (3)
- It is recommended to design the T-form buildings with relatively large bulge parts on the windward side for enhancing outdoor ventilation. Recommendations suggest designing T-form buildings with relatively large bulge parts on the windward side to enhance outdoor ventilation. Prioritizing length extensions over width increases is advised, as longer bulge parts demonstrate more significant effects in promoting outdoor ventilation and avoiding potential sunlight blockage associated with wider bulge parts.
Author Contributions
Funding
Institutional Review Board Statement
Informed Consent Statement
Data Availability Statement
Conflicts of Interest
References
- Angel, S.; Sheppard, S.C.; Civco, D.L. The Dynamics of Global Urban Expansion. Transport and Urban Development Department; The World Bank: Washington, DC, USA, 2005. [Google Scholar]
- United Nations. World Urbanization Prospects: The 2014 Revision; United Nations: New York, NY, USA, 2014. [Google Scholar]
- Zhou, C.; Wang, Z.; Chen, Q.; Jiang, Y.; Pei, J. Design optimization and field demonstration of natural ventilation for high-rise residential buildings. Energy Build. 2014, 82, 457–465. [Google Scholar] [CrossRef]
- United Nations. Transforming Our World: The 2030 Agenda for Sustainable Development; United Nations: New York, NY, USA, 2015. [Google Scholar]
- Blocken, B.; Carmeliet, J. Pedestrian wind environment around buildings: Literature review and practical examples. J. Therm. Envel. Build. Sci. 2003, 28, 1097–1963. [Google Scholar] [CrossRef]
- Stathopoulos, T. Pedestrian level winds and outdoor human comfort. J. Wind. Eng. Ind. Aerodyn. 2006, 94, 769–780. [Google Scholar] [CrossRef]
- Blocken, B.; Janssen, W.D.; Hooff, T.V. CFD simulation for pedestrian wind comfort and wind safety in urban areas: General decision framework and case study for the Eindhoven University campus. Environ. Model. Softw. 2012, 30, 15–34. [Google Scholar] [CrossRef]
- Stathopoulos, T.; Baskaran, B.A. Computer Simulation of Wind Environmental Conditions around Buildings. Eng. Struct. 1996, 18, 876–885. [Google Scholar] [CrossRef]
- Tsang, C.W.; Kwok, K.C.S.; Hitchcock, P.A. Wind tunnel study of pedestrian level wind environment around tall buildings: Effects of building dimensions, separation and podium. Build. Environ. 2012, 49, 167–181. [Google Scholar] [CrossRef]
- Luo, W.; Dong, Z.; Qian, G.; Lu, J. Wind tunnel simulation of the three-dimensional airflow patterns behind cuboid obstacles at different angles of wind incidence, and their significance for the formation of sand shadows. Geomorphology 2012, 139, 258–270. [Google Scholar] [CrossRef]
- Du, Y.X.; Mak, C.M.; Tang, B.S. Effects of building height and porosity on pedestrian level wind comfort in a high-density urban built environment. Build. Simul. 2018, 11, 1215–1228. [Google Scholar] [CrossRef]
- Jiang, Z.; Gao, W.; Yao, W. Research on the wind environment in an enclosed courtyard: Effect of the opening position, size and wind angle. Urban Clim. 2023, 52, 101737. [Google Scholar] [CrossRef]
- Jie, P.; Su, M.; Gao, N.; Ye, Y.; Kuang, X.; Chen, J.; Li, P.; Grunewald, J.; Xie, X.; Shi, X. Impact of urban wind environment on urban building energy: A review of mechanisms and modeling. Build. Environ. 2023, 245, 110947. [Google Scholar] [CrossRef]
- Oh, G.; Yang, M.; Choi, J.-I. Large-eddy simulation-based wind and thermal comfort assessment in urban environments. J. Wind. Eng. Ind. Aerodyn. 2024, 246, 105682. [Google Scholar] [CrossRef]
- Ying, X.; Qin, X.; Shen, L.; Yu, C.; Zhang, J. An intelligent planning method to optimize high-density residential layouts considering the influence of wind environments. Heliyon 2023, 9, e13051. [Google Scholar] [CrossRef] [PubMed]
- Chen, L.; Mak, C.M.; Hang, J.; Dai, Y.; Niu, J.; Tse, K.T. Large eddy simulation study on pedestrian-level wind environments around elevated walkways and influential factors in ideal urban street canyons. Build. Environ. 2023, 235, 110236. [Google Scholar] [CrossRef]
- Liu, J.; Niu, J. CFD simulation of the wind environment around an isolated high-rise building: An evaluation of SRANS, LES and DES models. Build. Environ. 2016, 96, 91–106. [Google Scholar] [CrossRef]
- Zhu, C.L.; Wei, H.Y.; Long, H. Design Theories of Residential Architecture; China Architecture & Building Press: Beijing, China, 2011. [Google Scholar]
- Iqbal, Q.M.Z.; Chan, A.L.S. Pedestrian level wind environment assessment around group of high-rise cross-shaped buildings: Effect of building shape, separation and orientation. Build. Environ. 2016, 101, 45–63. [Google Scholar] [CrossRef]
- Franke, J.; Hellsten, A.; Schlünzen, H.; Carissimo, B. Best Practice Guideline for the CFD Simulation of Flows in the Urban Environment; COST Office: Hamburg, Germany, 2007. [Google Scholar]
- He, Y.; Schnabel, M.A.; Mei, Y. A novel methodology for architectural wind environment study by integrating CFD simulation, multiple parametric tools and evaluation criteria. Build. Simul. 2019, 13, 609–625. [Google Scholar] [CrossRef]
- Li, Y.; Chen, L. Study on the influence of voids on high-rise building on the wind environment. Build. Simul. 2019, 13, 419–438. [Google Scholar] [CrossRef] [PubMed]
- Aynsley, R.M. Politics of pedestrian level urban wind control. Build. Environ. 1989, 24, 291–295. [Google Scholar] [CrossRef]
- Sobachkin, A.; Dumnov, G. Numerical Basis of CAD-Embedded CFD. In Proceedings of the NAFEMS World Congress, Salzburg, Austria, 28–30 May 2014. [Google Scholar]
- Lam CK, G.; Bremhorst, K. A modified form of the k-ε model for predicting wall turbulence. J. Fluids Eng. 1981, 103, 456. [Google Scholar] [CrossRef]
- Launder, B.E.; Spalding, D.B. The numerical computation of turbulent flows. Comput. Methods Appl. Mech. Eng. 1974, 3, 269–289. [Google Scholar] [CrossRef]
- Richards, P.J.; Hoxey, R.P. Appropriate boundary conditions for computational wind engineering models using the k-ε turbulence model. J. Wind. Eng. Ind. Aerodyn. 1993, 46, 145–153. [Google Scholar] [CrossRef]
- Wieringa, J. Updating the Davenport roughness classification. J. Wind. Eng. Ind. Aerodyn. 1992, 41, 357–368. [Google Scholar] [CrossRef]
- Hang, J.; Li, Y. Age of air and air exchange efficiency in high-rise urban areas and its link to pollutant dilution. Atmos. Environ. 2011, 45, 5572–5585. [Google Scholar] [CrossRef]
- Richardson, L.F. The approximate arithmetical solution by finite differences of physical problems involving differential equations, with an application to the stresses in a masonry dam. R. Soc. 1911, 210, 307–357. [Google Scholar]
- Roache, P.J. Perspective: A method for uniform reporting of grid refinement studies. J. Fluids Eng. 1994, 116, 405–413. [Google Scholar] [CrossRef]
- Vinchurkar, S.; Longest, P.W. Evaluation of hexahedral, prismatic and hybrid mesh styles for simulating respiratory aerosol dynamics. Comput. Fluids 2008, 37, 317–331. [Google Scholar] [CrossRef]
- Wilks, D. Statistical Methods in the Atmospheric Sciences, 2nd ed.; Academic Press: Cambridge, MA, USA, 2006. [Google Scholar]
- Chang, J.C.; Hanna, S.R. Air quality model performance evaluation. Meteorol. Atmos. Phys. 2004, 87, 167–196. [Google Scholar] [CrossRef]
- Efthimiou, G.; Sabatino, J.; Martilli, A. Cost 732 in practice: The MUST model evaluation exercise. Int. J. Environ. Pollut. 2011, 44, 403. [Google Scholar]
- Blocken, B.; Stathopoulos, T. CFD simulation of pedestrian-level wind conditions around buildings: Past achievements and prospects. J. Wind. Eng. Ind. Aerodyn. 2013, 121, 138–145. [Google Scholar] [CrossRef]
- Schneider, C.A.; Rasband, W.S.; Eliceiri, K.W. NIH Image to ImageJ: 25 years of image analysis. Nat. Methods 2012, 9, 671–675. [Google Scholar] [CrossRef]
- Liang, J.; Tang, M.-L.; Chan, P.S. A generalized Shapiro–Wilk W statistic for testing high-dimensional normality. Comput. Stat. Data Anal. 2009, 53, 3883–3891. [Google Scholar] [CrossRef]
- Delong, E.R.; Delong, D.M.; Clarke-Pearson, D.L. Comparing the areas under two or more correlated receiver operating characteristic curves: A nonparametric approach. Biometrics 1988, 44, 837. [Google Scholar] [CrossRef]
- Park, S.K.; Moon, H.J.; Min, K.C.; Hwang, C.; Kim, S. Application of a multiple linear regression and an artificial neural network model for the heating performance analysis and hourly prediction of a large-scale ground source heat pump system. Energy Build. 2018, 165, 206–215. [Google Scholar] [CrossRef]
- Muddu, R.D.; Gowda, D.; Robinson, A.J.; Byrne, A. Optimisation of retrofit wall insulation: An Irish case study. Energy Build. 2021, 235, 110720. [Google Scholar] [CrossRef]


| Cases | Lengths (M) | Widths (M) | Heights | Lengths (B) | Widths (B) |
|---|---|---|---|---|---|
| Case 1 | 20 m | 10 m | 36 m | 0 m | 0 m |
| Case 2 | 20 m | 10 m | 36 m | 6 m | 2 m |
| Case 3 | 20 m | 10 m | 36 m | 8 m | 2 m |
| Case 4 | 20 m | 12 m | 36 m | 0 m | 0 m |
| Cases | Lengths (M) | Widths (M) | Heights | Lengths (B) | Widths (B) |
|---|---|---|---|---|---|
| Case 1 | 39 m | 12 m | 72 m | 15 m | 6 m |
| Case 2 | 39 m | 12 m | 72 m | 18 m | 6 m |
| Case 3 | 39 m | 12 m | 72 m | 21 m | 6 m |
| Case 4 | 39 m | 12 m | 72 m | 15 m | 12 m |
| Case 5 | 39 m | 12 m | 72 m | 18 m | 12 m |
| Case 6 | 39 m | 12 m | 72 m | 21 m | 12 m |
| Case 7 | 39 m | 12 m | 72 m | 15 m | 18 m |
| Case 8 | 39 m | 12 m | 72 m | 18 m | 18 m |
| Case 9 | 39 m | 12 m | 72 m | 21 m | 18 m |
| Grids | Grid 1-2 | Grid 2-3 | Grid 1-3 | |
|---|---|---|---|---|
| V | (%) | 3.852 | 1.920 | 4.330 |
| GCI (%) | 1.605 | 0.800 | 1.804 | |
| TKE | (%) | 0.278 | 0.247 | 0.479 |
| GCI (%) | 0.116 | 0.103 | 0.200 |
Disclaimer/Publisher’s Note: The statements, opinions and data contained in all publications are solely those of the individual author(s) and contributor(s) and not of MDPI and/or the editor(s). MDPI and/or the editor(s) disclaim responsibility for any injury to people or property resulting from any ideas, methods, instructions or products referred to in the content. |
© 2024 by the authors. Licensee MDPI, Basel, Switzerland. This article is an open access article distributed under the terms and conditions of the Creative Commons Attribution (CC BY) license (https://creativecommons.org/licenses/by/4.0/).
Share and Cite
Guo, H.; Liu, Y.; He, Y. Iterative Investigation of Wind Environments Influenced by Bulge-Part Geometries of Typical T-Form High-Rise Buildings Using Parametric Modelling, CFD and IAs Analysis. Sustainability 2024, 16, 3354. https://doi.org/10.3390/su16083354
Guo H, Liu Y, He Y. Iterative Investigation of Wind Environments Influenced by Bulge-Part Geometries of Typical T-Form High-Rise Buildings Using Parametric Modelling, CFD and IAs Analysis. Sustainability. 2024; 16(8):3354. https://doi.org/10.3390/su16083354
Chicago/Turabian StyleGuo, Han, Yawen Liu, and Yi He. 2024. "Iterative Investigation of Wind Environments Influenced by Bulge-Part Geometries of Typical T-Form High-Rise Buildings Using Parametric Modelling, CFD and IAs Analysis" Sustainability 16, no. 8: 3354. https://doi.org/10.3390/su16083354
APA StyleGuo, H., Liu, Y., & He, Y. (2024). Iterative Investigation of Wind Environments Influenced by Bulge-Part Geometries of Typical T-Form High-Rise Buildings Using Parametric Modelling, CFD and IAs Analysis. Sustainability, 16(8), 3354. https://doi.org/10.3390/su16083354