Article

System Dynamics Simulation and Influencing Factors of the Interaction between Urbanization and Eco-Environment in Hebei Province, China

1
School of Mining and Geomatics Engineering, Hebei University of Engineering, Handan 056038, China
2
College of Mining Engineering, Taiyuan University of Technology, Taiyuan 030024, China
*
Author to whom correspondence should be addressed.
Sustainability 2024, 16(8), 3365; https://doi.org/10.3390/su16083365
Submission received: 10 March 2024 / Revised: 14 April 2024 / Accepted: 15 April 2024 / Published: 17 April 2024
(This article belongs to the Special Issue Urbanization and Environmental Sustainability—2nd Edition)

Abstract

:
Searching for an urbanization development model that is suitable for the eco-environment can provide important references for regional sustainable development. By comprehensively using models such as system dynamics (SD), distance coordination coupling degree, symbiosis degree, and grey correlation degree, the interaction between urbanization and eco-environment in Hebei Province from 2020 to 2035 was dynamically simulated based on the historical data from 2000 to 2019. In addition, the key bidirectional influence factors of urbanization and eco-environment were identified. The entire process analysis from model construction, scenario simulation, and preferred scenarios to factor identification was achieved. The results showed the following. (1) The constructed SD model was reliable and effective, and could be used to simulate future strategies. (2) Three evaluation methods could effectively reveal the advantages and disadvantages of the phased scenario schemes during the simulation period, and the obtained results had strong consistency. The urbanization priority development scenario was more suitable for short-term and medium-term planning, while the friendly development scenario was more suitable for the entire simulation period. (3) Five indicators of urbanization and seven indicators of the eco-environment were highly relevant to the evaluation levels of the eco-environment and urbanization, respectively. The study extended the application of the symbiosis theory and the evaluation methods of scenario simulation schemes for urbanization and eco-environment systems.

1. Introduction

Since the turn of the century, China’s urbanization rate has increased rapidly from 36.2% (2000) to 65.22% (2022). Urbanization, as a driving force for promoting socio-economic development and enhancing residents’ sense of happiness and gain, causes serious coercive effects and far-reaching impacts on resources and the eco-environment [1]. The human–land relationship and the eco-environment system are facing unprecedented challenges, and the contradiction between the destruction of the eco-environment and urban sustainable development is becoming increasingly pronounced. The overloading of urban resources and the environment has gradually become a bottleneck that limits the high-quality urbanization [2]. The development of the eco-environment and urbanization is an interactive and synergistic balancing process. On the one hand, the eco-environment plays a significant controlling role in the development of urbanization, and the deterioration of the eco-environment has a great restraining effect on the urbanization construction, which restricts the speed and quality of urbanization development. On the other hand, urbanization development has both coercive and promoting effects on the eco-environment [3,4]. Research on the coordinated development of urbanization and the eco-environment has become one of the key issues that should be urgently addressed in promoting regional socio-economic development, with important theoretical and practical significance.
There is an extremely complex interactive relationship between urbanization, resources, and the environment, which has always been one of the key frontiers of research into the relationship between human activities and the environment at home and abroad [5]. In recent years, the study of the coupling relationship between urbanization and the eco-environment has been in full swing and has achieved fruitful results. Existing studies have investigated the measurement, spatiotemporal development characteristics, and mechanisms of the interaction between urbanization and the eco-environment using improved Environmental Kuznets Curve (EKC) models [6], coupled coordination degree models [7,8,9], grey correlation degree models [10], Tapio models [11], etc. The study scales cover different administrative units, such as urban agglomeration, province, city, and county [12,13,14]. These studies reveal the complex interaction between urbanization and the eco-environment, but further study is needed to quantitatively characterize the extent of their mutual influence and impact mechanisms [15,16]. In accordance with the needs of urbanization development, the process simulation study on the interaction between urbanization and the eco-environment should be highly valued [17], and related studies should gradually move from quantitative description to dynamic simulation [18]. Simulation methods include grey prediction models, geographic detectors, SD models, and cellular automata [19,20,21,22]. The SD model has been favored by researchers for its ability to better reflect the complex nonlinear relationships and feedback mechanisms between various subsystems and elements [23]. For example, Fang et al. established an SD model to investigate nonlinear relationships and feedback mechanisms between urbanization and eco-environment in the Beijing–Tianjin–Hebei region [24]. Wang et al. constructed an SD model based on the intrinsic relationships between water, energy, food, society, economy, and ecological environment in order to simulate different development scenarios in Hunan Province from 2021 to 2035 [25]. The evaluation of the scenario simulation results and the selection of the optimal scenario are an important part of simulation research, and the most used methods include single indicator comparative analysis [26], composite index evaluation [27], and coupling degree and coupling coordination model [28]. Of the existing studies, there is still room for further study on the urbanization and eco-environment scenario simulation, and the evaluation methods for scenario optimization schemes are relatively unique, lacking quantitative evaluation and analysis of the interaction mode and intensity between urbanization and the eco-environment of future scenarios. Furthermore, they cannot effectively reveal the quantitative relationship between the interaction and reaction between the two in the future scenarios, which weakens the reference significance of scenario simulation results for guiding the coordinated development of regional urbanization and eco-environment.
As the main battlefield and eco-environment support area of the national strategy of Beijing–Tianjin–Hebei integration and the construction of Xiong’an New Area, the functional positioning of each city in Hebei Province has its own particularity, and the coordinated and healthy development of urbanization and eco-environment is particularly important [29]. Guided by national strategies such as the coordinated development of Beijing–Tianjin–Hebei and the construction of new urbanization, the level of urbanization in Hebei Province has improved significantly. In 2021, the urbanization rate in Hebei Province was 61.14%, but there is still a significant gap compared to 87.5% and 84.88% in Beijing and Tianjin, respectively. At the same time, Hebei Province is facing the pressure of water resources, land resources, and the eco-environment, which limits the development of social economy and new urbanization to some extent. Therefore, searching for a coordinated development model between urbanization and the eco-environment in Hebei Province is an urgent scientific issue to be investigated. However, existing studies mainly focus on the quantitative measurement [13], discrimination of coupling types [29,30], and scenario simulation of the interaction between urbanization and eco-environment in the Beijing–Tianjin–Hebei urban agglomeration [24]. Some studies have also investigated the coupling relationship between urbanization and eco-environment in Beijing, Tianjin, and Hebei Province [31,32,33], but there are several studies on the multi-scenario simulation of the interaction development trend between urbanization and eco-environment in Hebei Province, which has a slightly insufficient guiding significance for regional coordinated development. The study on the coordinated development of urbanization and eco-environment in Hebei Province still needs to be deepened.
In our previous study, based on panel data from 1985 to 2019 in Hebei Province, we proposed and verified the symbiosis hypothesis between urbanization and the eco-environment, and constructed a quantitative study method system in order to reveal the interaction relationship between them from the two dimensions of coupling and decoupling [34]. To further investigate the possible future development trends and the main factors affecting the interaction between urbanization and the eco-environment in Hebei Province, this study constructs an SD model and simulates the short- and long-term development trends through multiple scenarios. Based on the constructed evaluation index system and the proposed symbiosis hypothesis between urbanization and eco-environment in the previous study, the single indicator evaluation method, distance coordination coupling degree model, and symbiosis degree model were comprehensively adopted, and the study compared and analyzed the evolution trends of coupling coordination degree and symbiosis between urbanization and eco-environment under different scenarios, as well as the mode and size of mutual influence between the two from the dimensions of coupling and decoupling, in order to select future scenarios for urbanization and eco-environment development plans. The grey correlation degree model is used to identify key factors influencing the interaction between urbanization and the eco-environment in the past to the next 50 years. The study will provide references for decision making in order to promote the coordinated development of new urbanization and the eco-environment in Hebei Province, and enrich the dynamic simulation study ideas and methods of interaction between urbanization and the eco-environment.

2. Materials and Methods

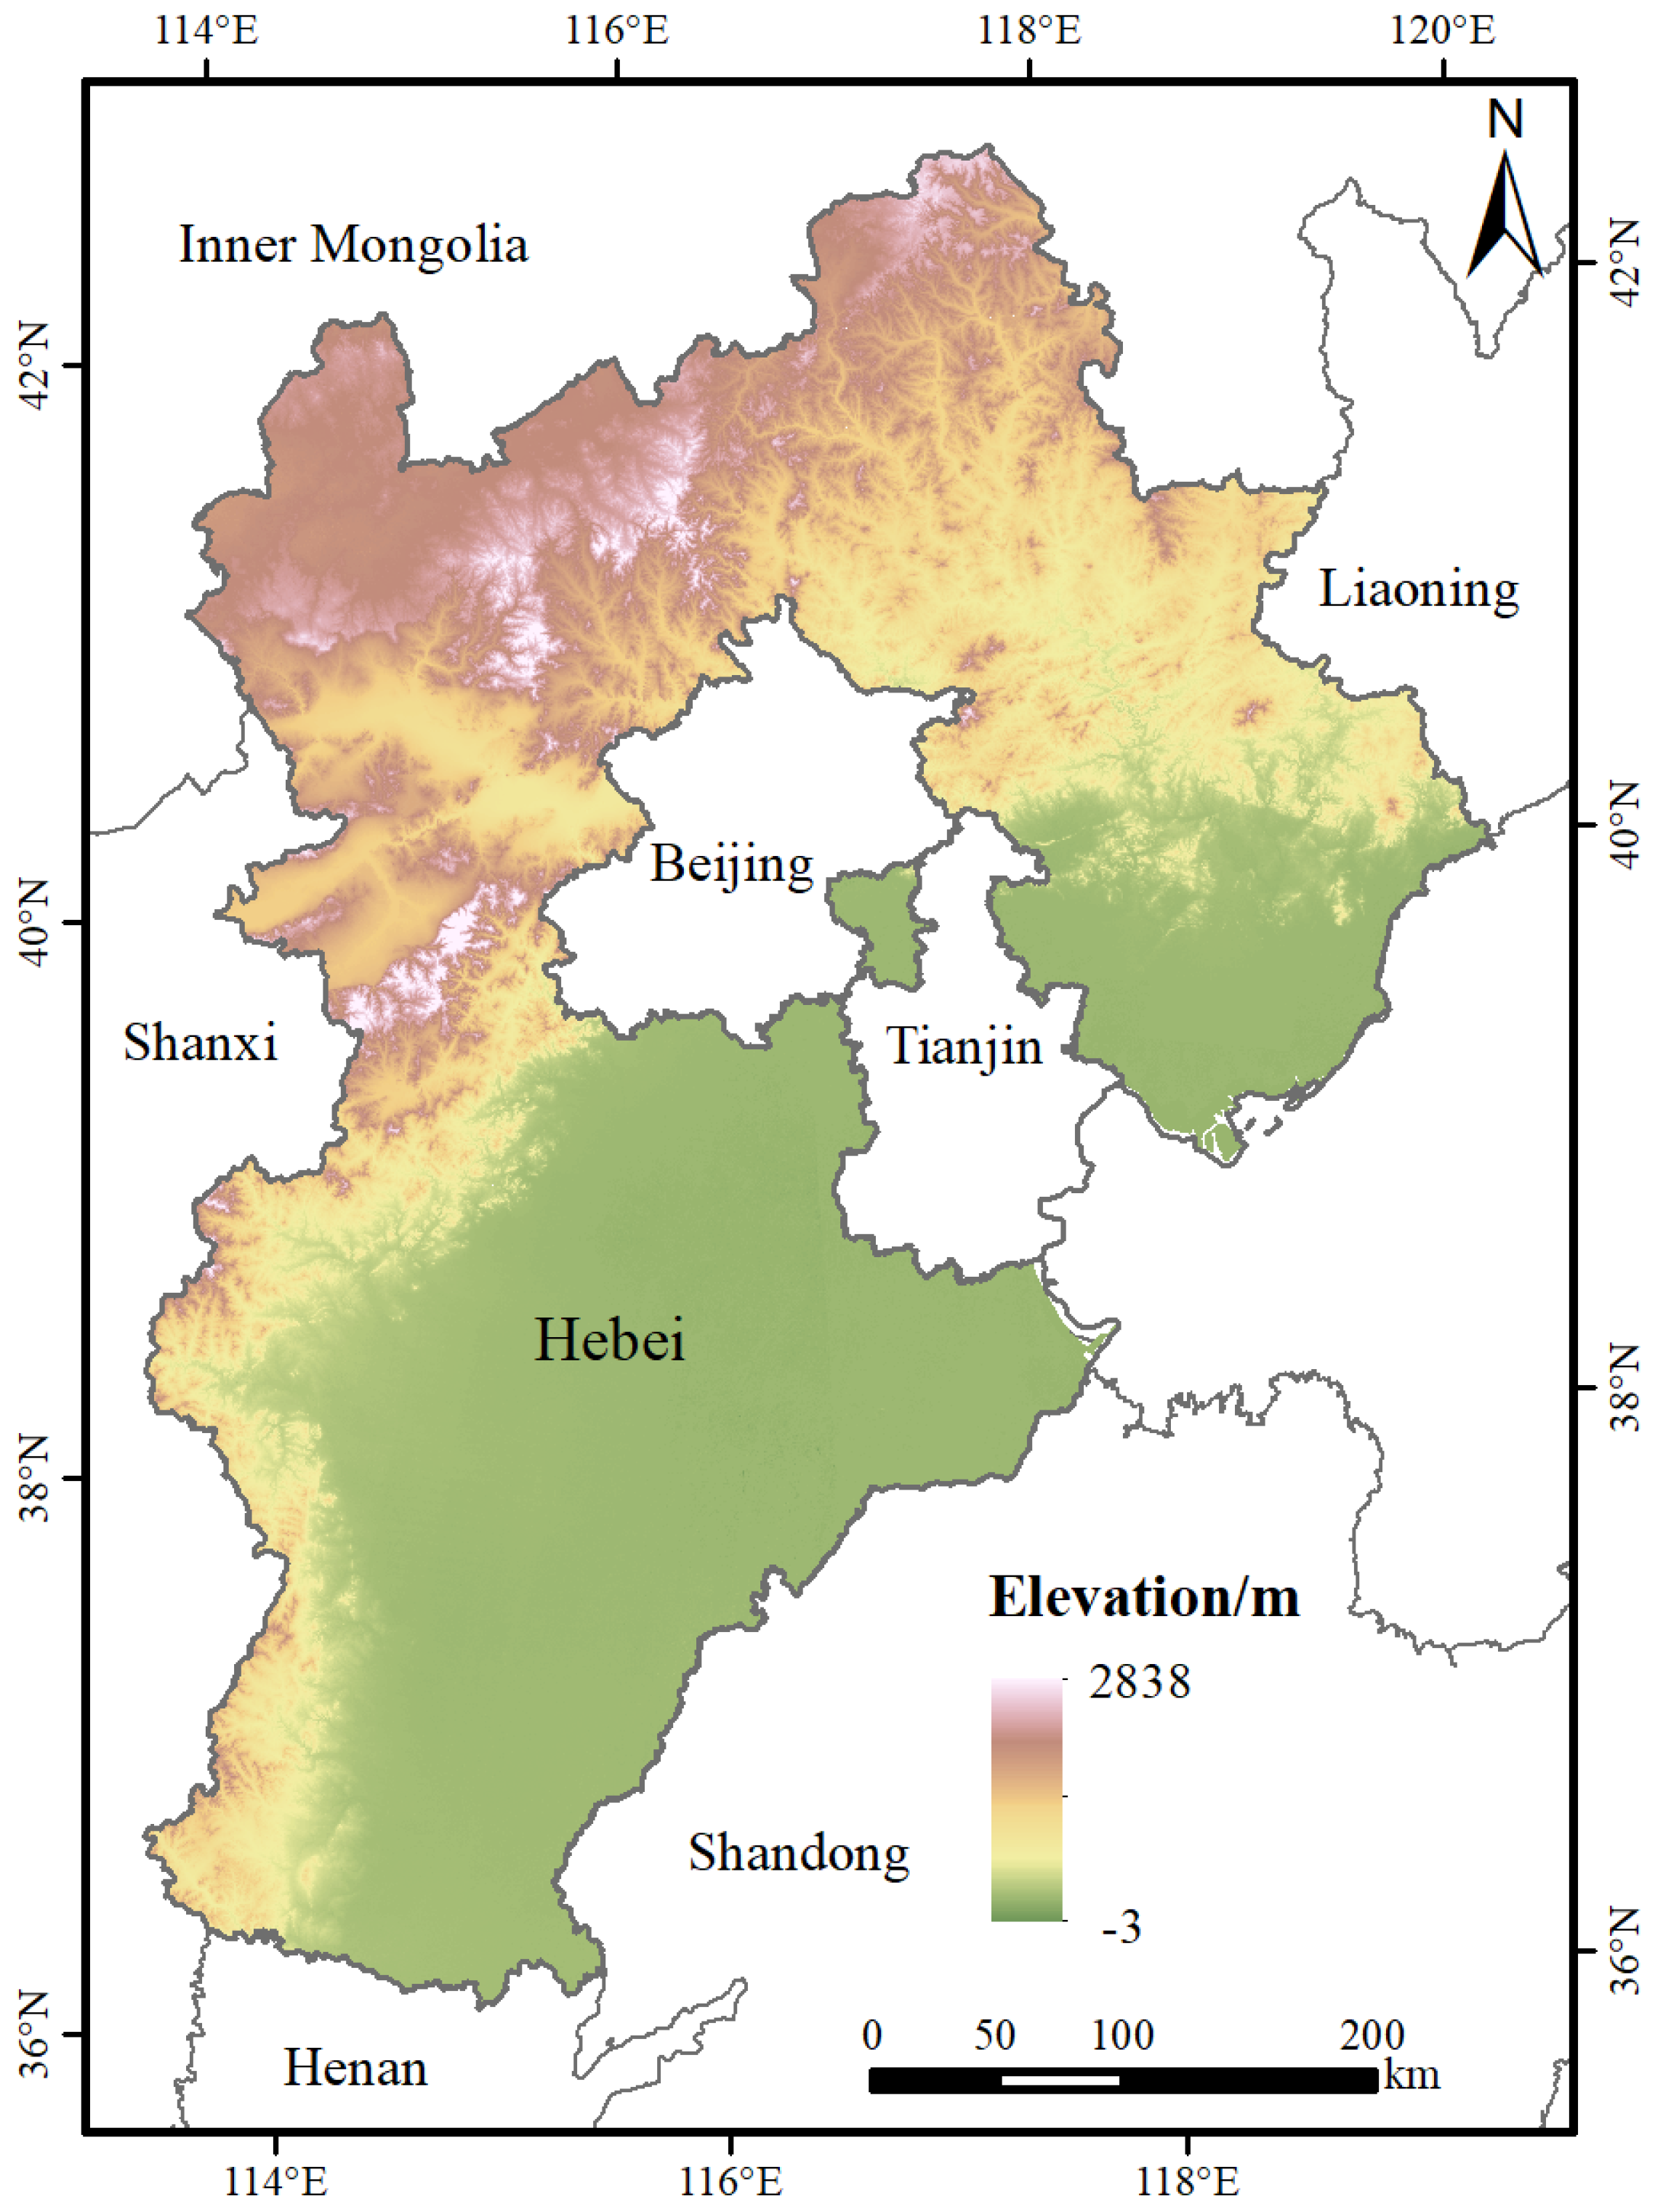
2.1. Study Area and Data Sources

Hebei Province is in the North China Plain, between 36°0′–42°40′ N and 113°27′–119°50′ E. Its terrain is high in the northwest and low in the southeast, sloping from northwest to southeast. It surrounds the Chinese capital Beijing and borders Tianjin and the Bohai Sea (Figure 1). The area is a moat that guards the political security of Beijing and an important barrier to safeguard the ecological security of Beijing and Tianjin. Against the background of Beijing–Tianjin–Hebei coordinated development, Hebei Province has a good socio-economic development trend. In 2021, the gross domestic product of the province reached CNY 4039.13 billion, and the urbanization rate of the permanent population reached 61.14%. With the high concentration of population and industry, excessive development and use of urban land, and extensive development of industrial enterprises, the contradiction between people and land in Hebei Province is becoming increasingly pronounced, and the pressure on the carrying capacity of resources and the eco-environment is increasing. It is facing eco-environment issues such as air pollution, water quality decline, land resources shortage, and eco-environment pattern imbalance. All these issues restrict the development process of urbanization. Simultaneously, the low level of urbanization also brings about a lack of attention to environmental protection in urban and rural construction. The ecological and living environment in urban and rural areas is worrying, and there are problems such as poor environment and fragmented layout in some areas, which restrict the sustainable development of economy and society and the improvement of the eco-environment quality in the province.
The data mainly come from the China Statistical Yearbook (1986–2020), China Urban Statistical Yearbook (1986–2020), China Population and Employment Statistics Yearbook (2007–2020), China Population Statistics Yearbook (1988–2020), China Urban Construction Statistical Yearbook (2007–2020), China Statistical Yearbook of Environment (1988–2020), Hebei Economic Yearbook (1986–2019), Hebei Rural Statistical Yearbook (1995–2020), Hebei Statistical Yearbook (2020), Hebei Provincial Water Resources Bulletin (http://slt.hebei.gov.cn/, accessed on 12 December 2023), and statistical bulletins on national economic and social development for relevant years. In addition, the data on Impermeable Surface Percentage (ISP) come from the Fine Resolution Observation and Monitoring—Global Land Cover at Tsinghua University [35]. The spatial resolution of the data is 30 m, which is interpreted from Landsat images (TM/ETM+/OLI) provided by the Google Earth Engine platform, with an overall accuracy of over 90%. It should be noted that Hebei Economic Yearbook is adjusted to Hebei Statistical Yearbook after 2019, and the deadline of statistical data is consistent. In order to better establish functional relationships between parameters in the SD model, the study expands the time dimension of data collection as much as possible, and there are some differences in the duration of data sources. In addition, economic statistics are converted based on the constant prices in 2000.

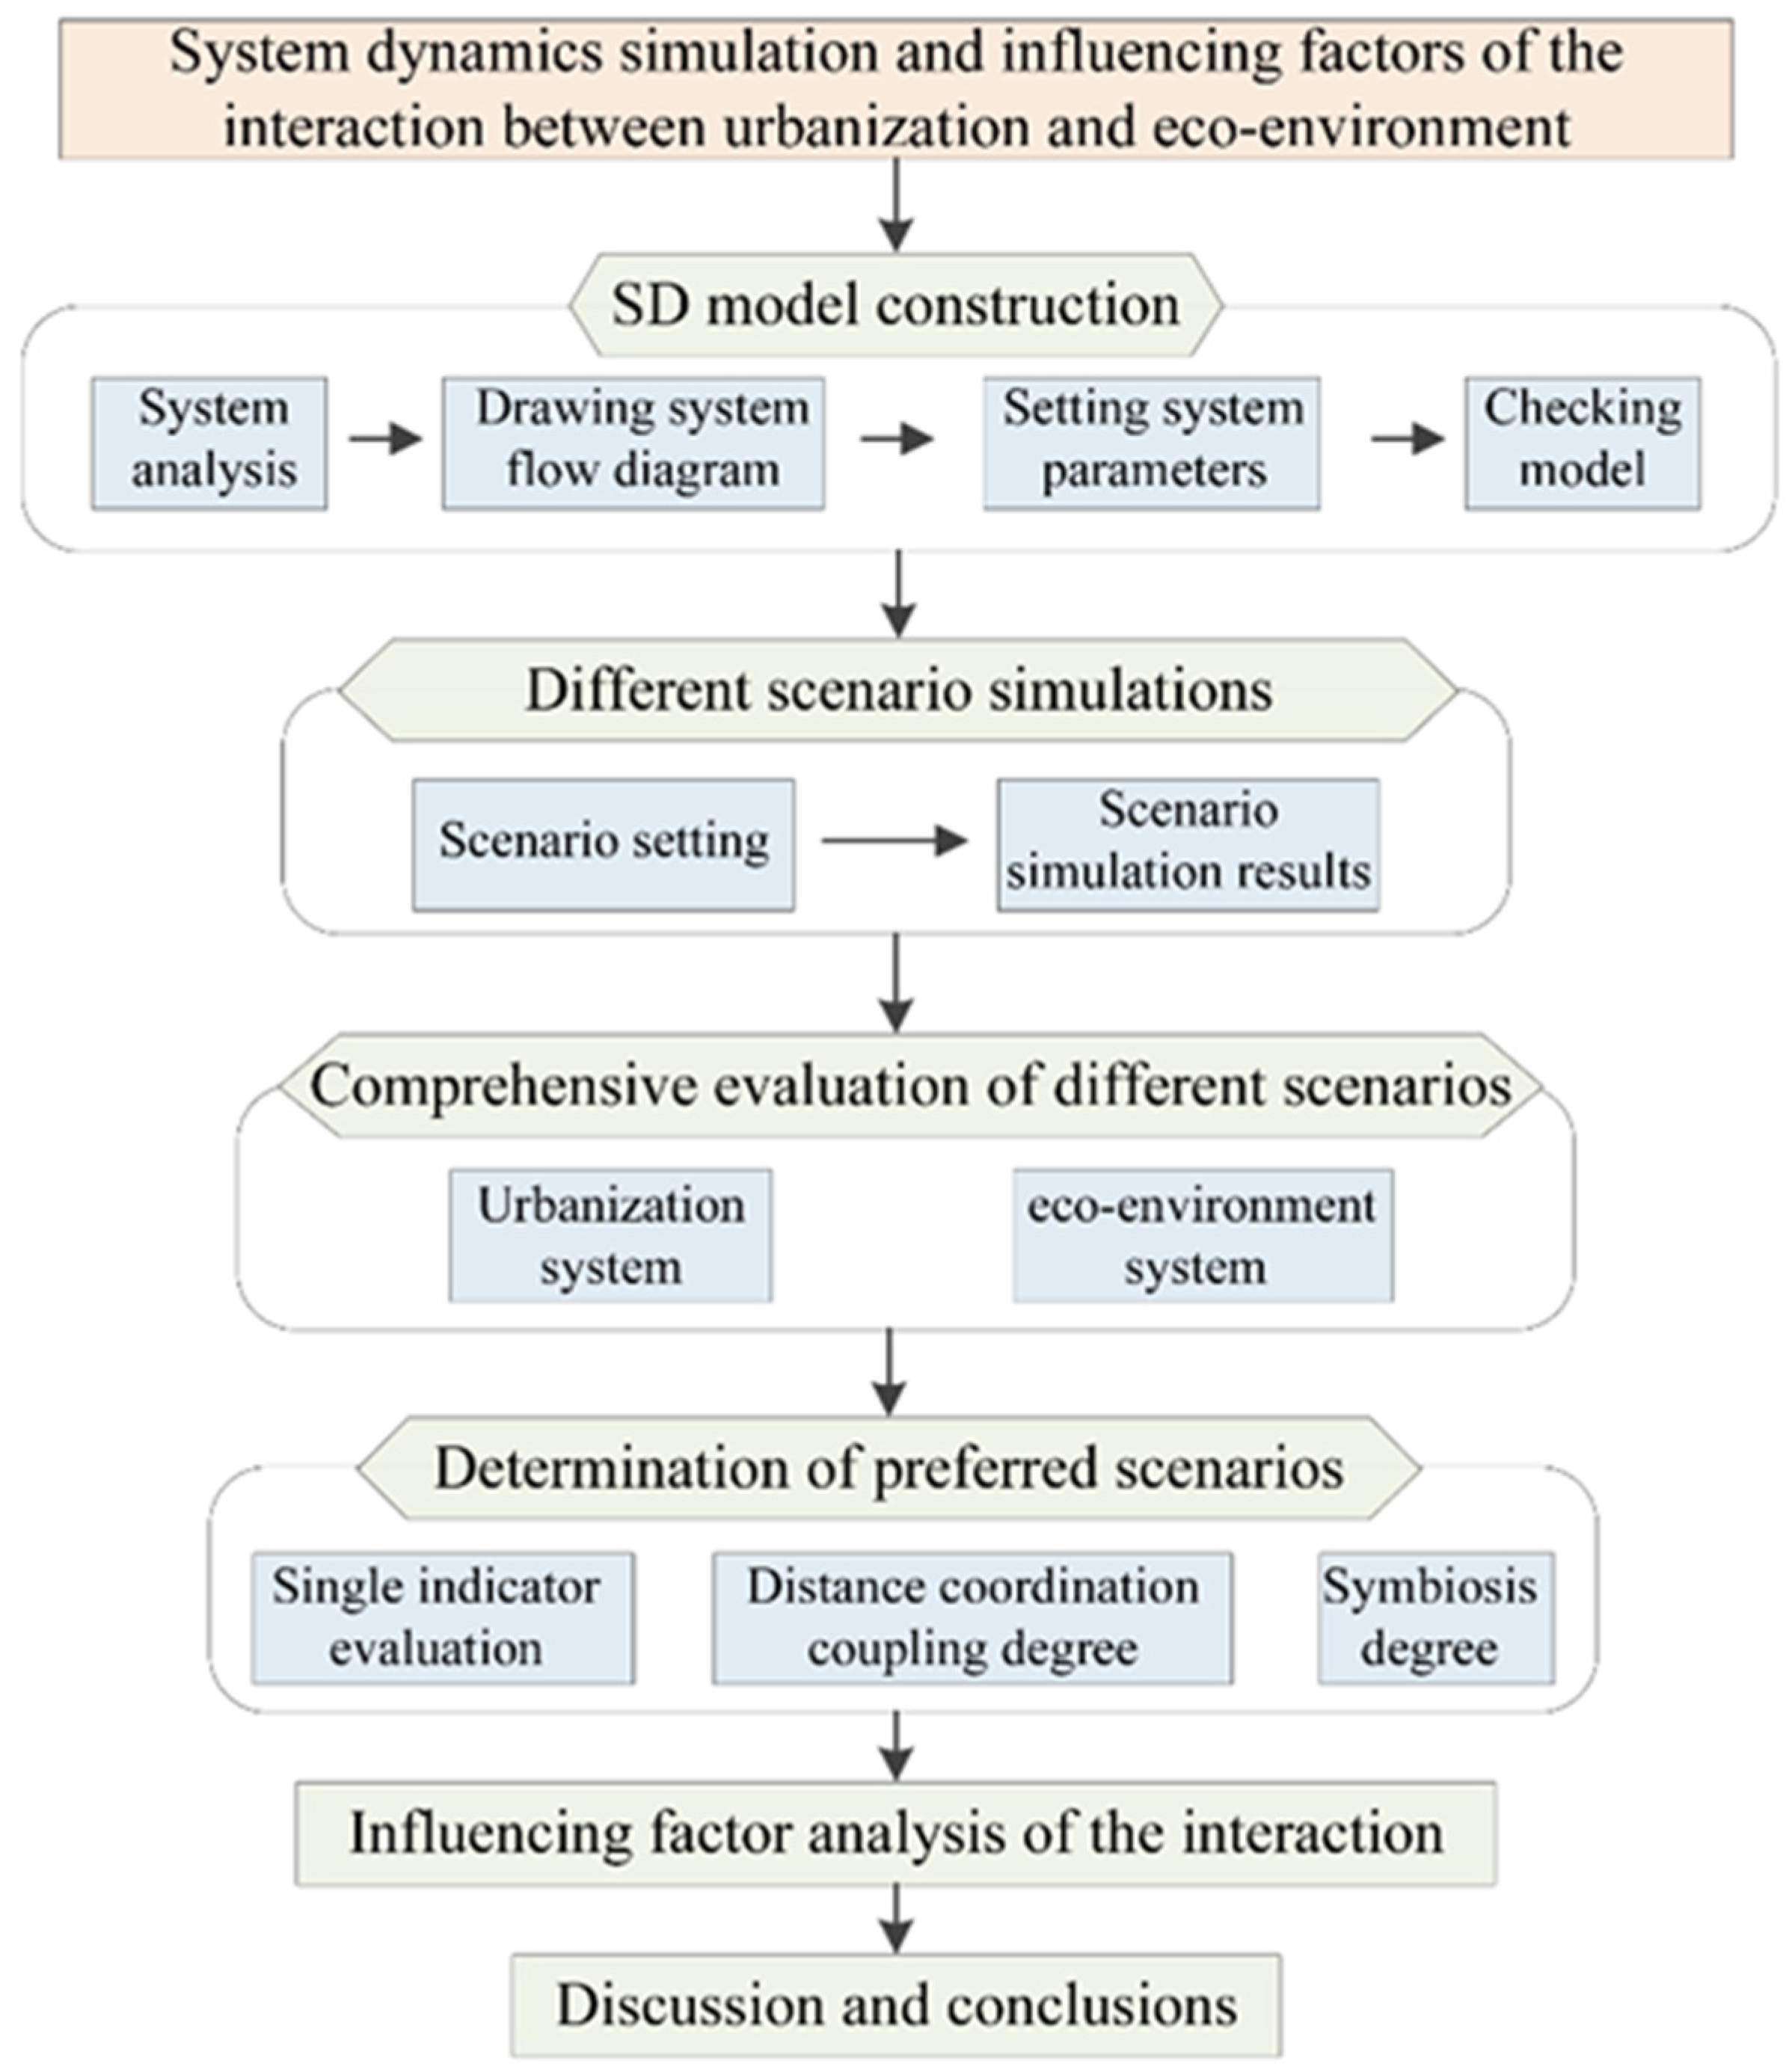
2.2. Research Method

Based on the previous study, this study attempts to construct an SD model to simulate the interaction between urbanization and eco-environment in different scenarios, evaluate the comprehensive levels of urbanization and eco-environment predicted results, and use the single indicator evaluation method, distance coordination coupling degree model, and symbiosis degree model to determine optimal scenarios. Then, the main influence factors of the interaction between urbanization and eco-environment in the past to the next 50 years are identified. Finally, based on the results, references for decision making are given. A detailed flow chart is shown in Figure 2.

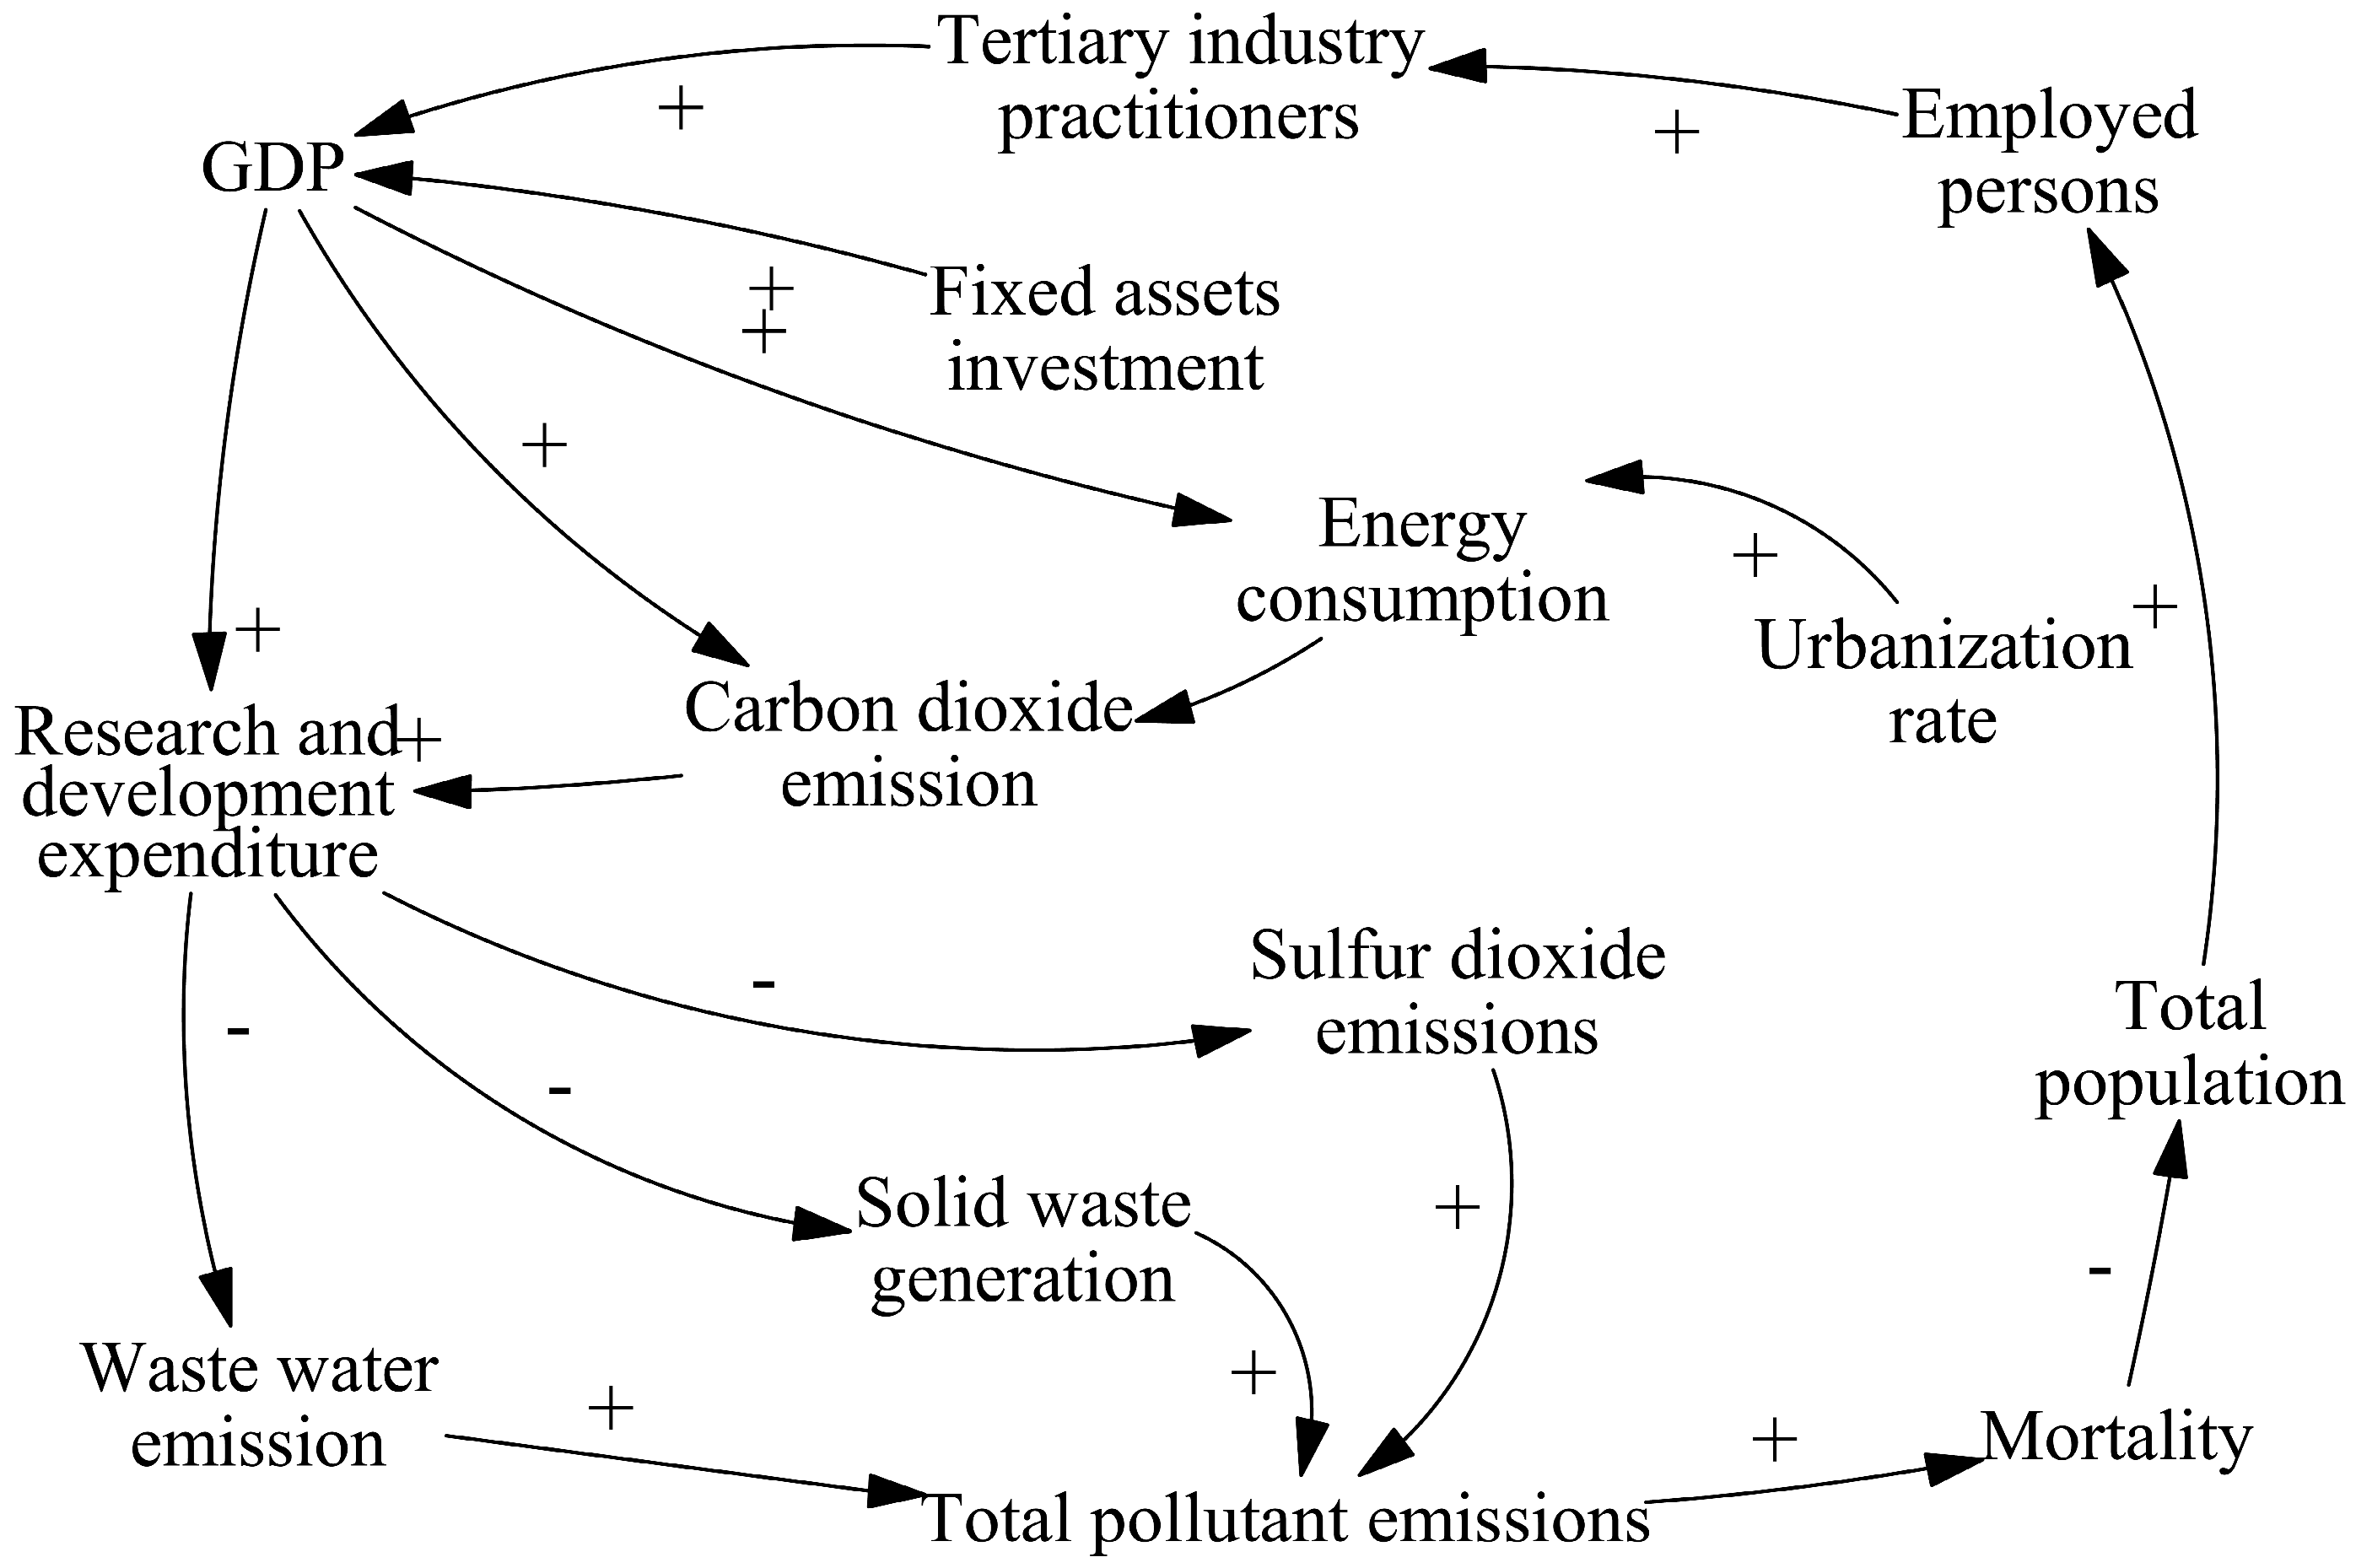
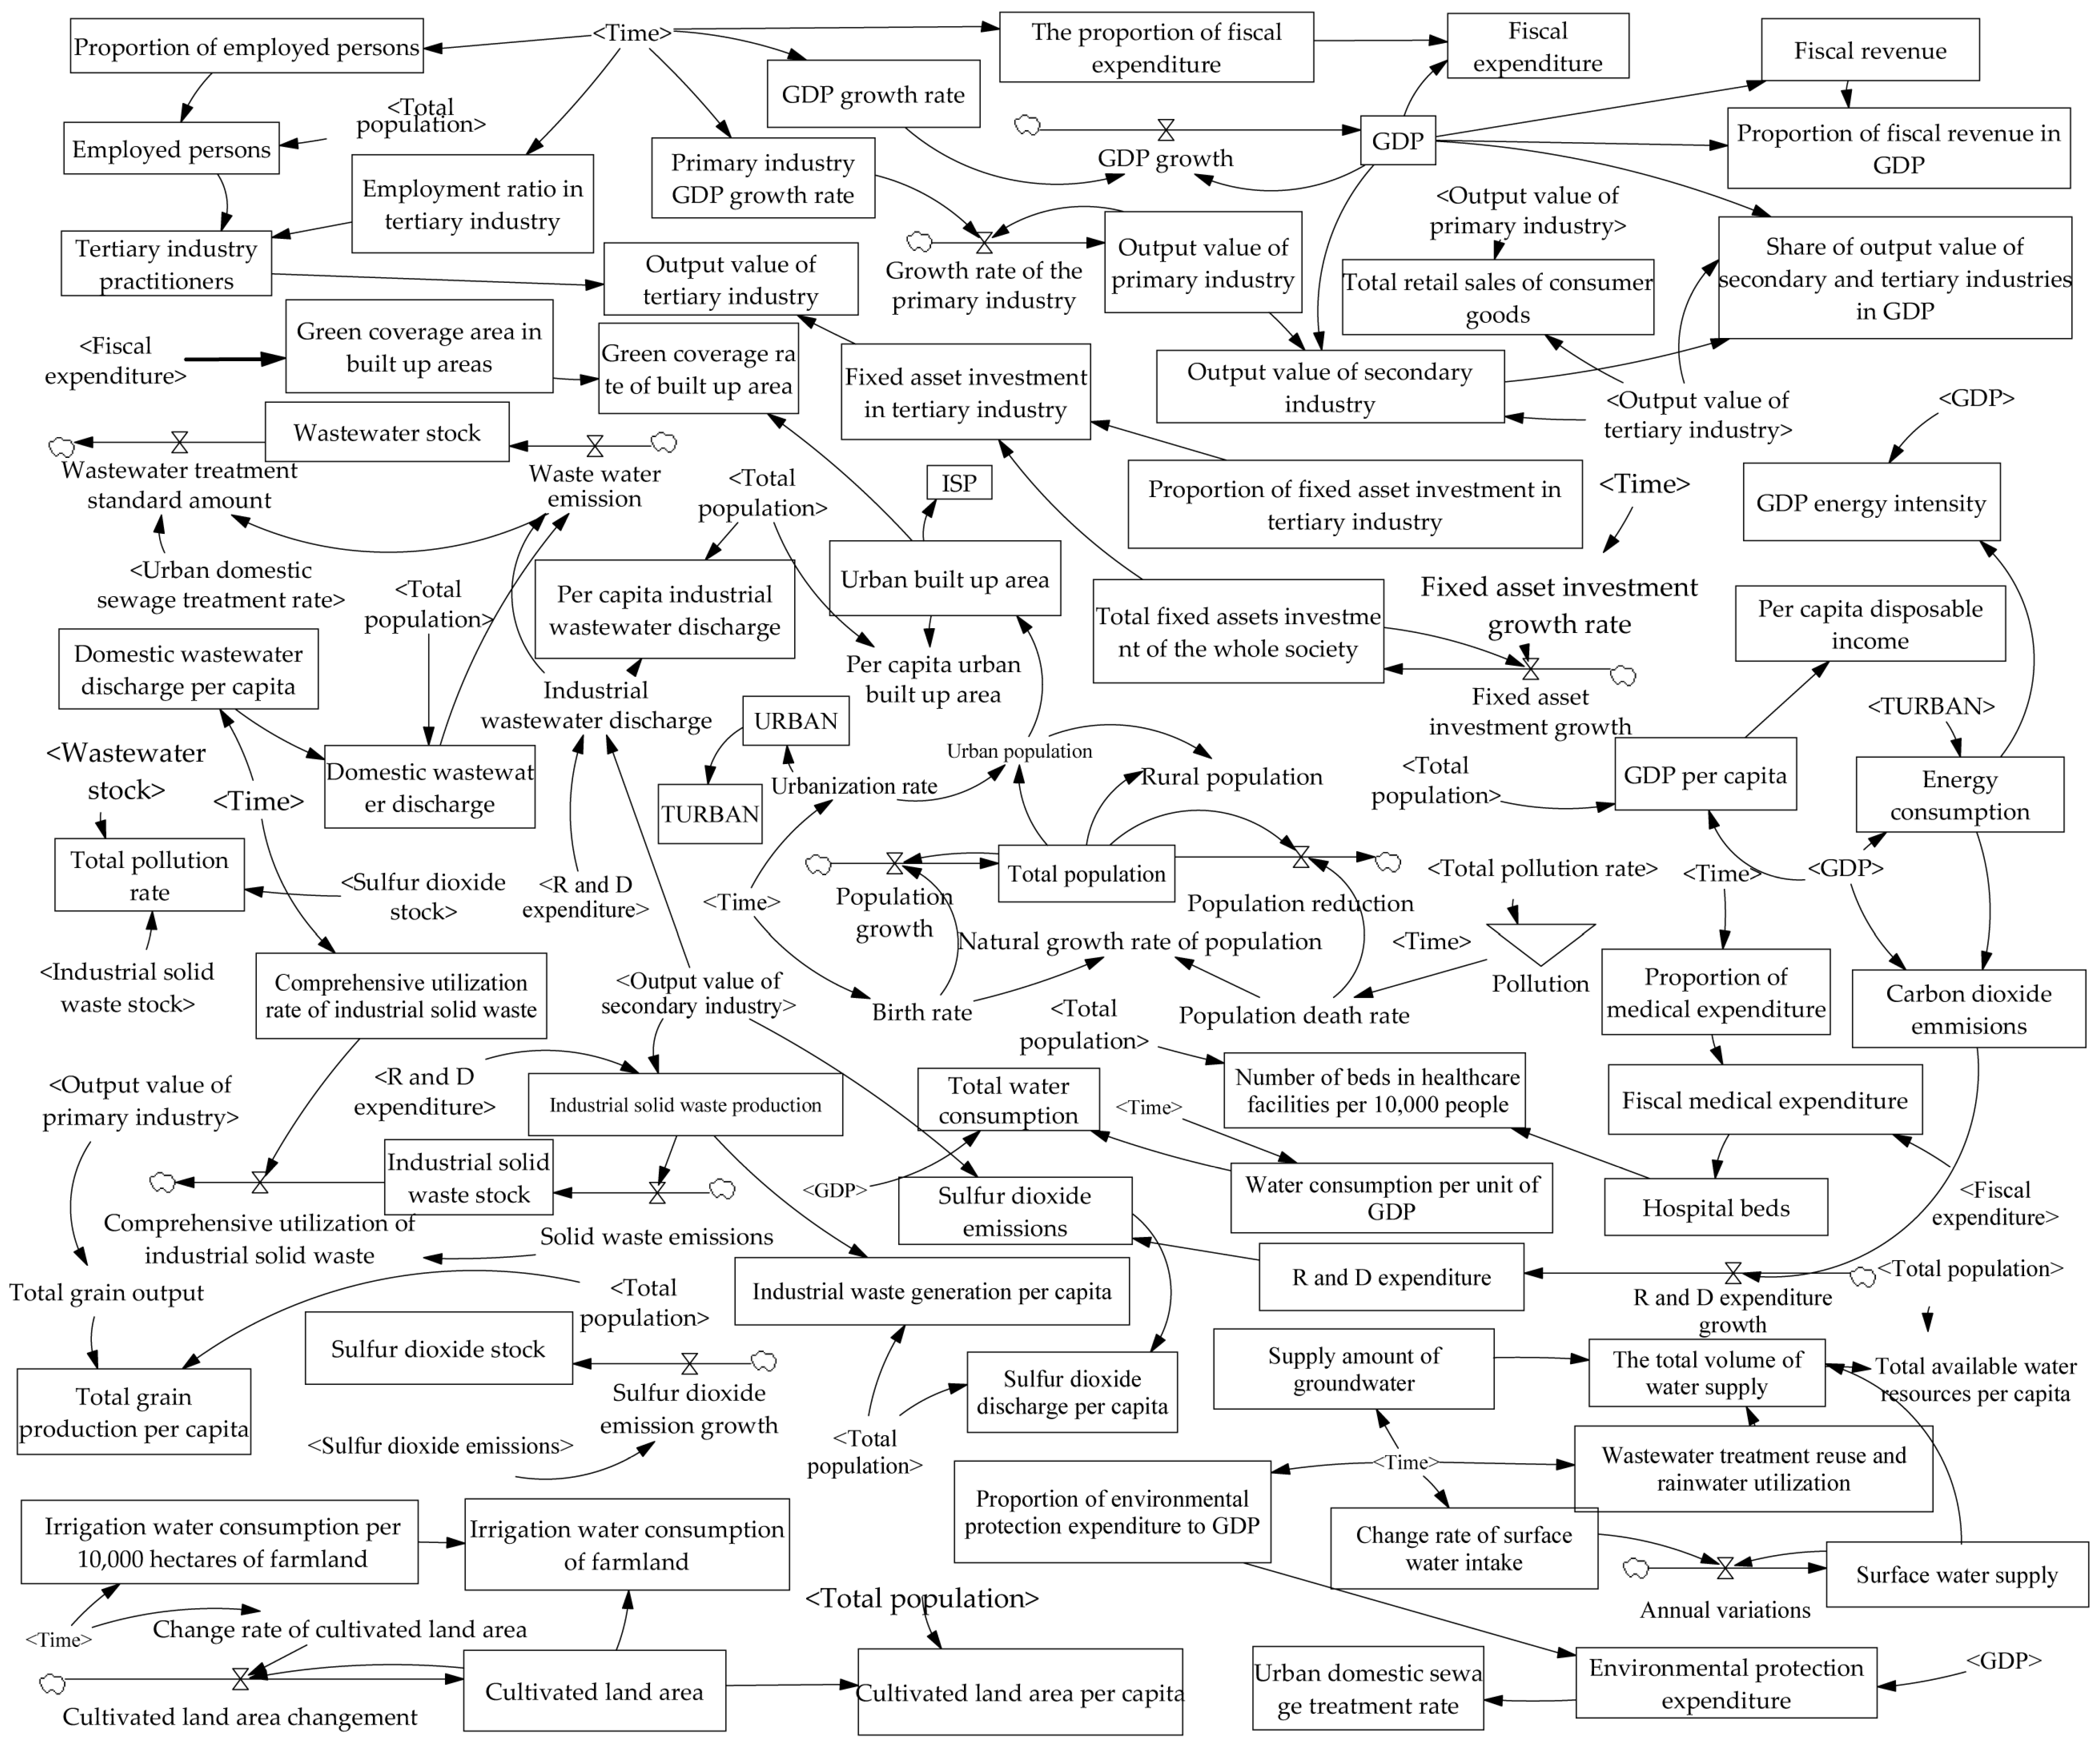
2.2.1. SD Model Construction

The SD model is a system simulation method combining structure, function, and history and was pioneered by Professor Jay W. Forrester from the Massachusetts Institute of Technology in 1956. This method used systematic analysis technology based on feedback control theory by establishing the DYNAMO model and using computer simulation technology, combining qualitative and quantitative analyses in order to process problems with nonlinear, multiple feedback, and complex time-varying phenomena, The method can be used for long-term dynamic quantitative simulation analysis and research [36].
  • System analysis and causal loop diagram
Based on the objectives of the study, it is crucial to determine the system boundary of the SD model for urbanization and eco-environment in Hebei Province. Since start of the 21st century, the driving urbanization forces in Hebei Province have been developing towards diversification, and the protection of eco-environment has expanded in multiple dimensions. On the one hand, Hebei Province is adjusting its industrial structure, deepening supply side structural reform, building environmentally friendly enterprises, following the development path of new industrialization, and vigorously building an ecological economic system. On the other hand, it actively encourages investment, promotes the development of tertiary industry, expands the share of tertiary industry in GDP, emphasizes innovation, and increases investment in research and development. At the same time, Hebei Province is focusing on energy conservation and intensive utilization, reducing wastewater, waste gas, and solid waste, improving the eco-environment, and reducing mortality rates. As a result, more people participate in the overall process of economic and social construction, with significant economies of scale and the promotion of the steady development of economic and social construction. The aforementioned analysis represents the basic internal elements and system boundaries of the system of interaction between urbanization and eco-environment in Hebei Province, and a diagram of the systematic causal loop of the SD model was constructed (Figure 3). With the increase in investment in fixed assets and the number of employees in the tertiary industry, the GDP will also increase, which will promote the investment of research funds, develop more environmentally friendly products and more efficient pollution treatment equipment in order to reduce eco-environmental pollution. With the development of the economy and society and the improvement of the eco-environment quality, it will promote population growth, and therefore more people will participate in social production, and create greater social and economic value.
2.
Model construction
Based on the diagram of the causal relationship between urbanization and the eco-environment system in Hebei Province, considering the relatively small changes in natural geographic elements such as topography and landforms at the provincial level, as well as the availability of corresponding time series data, this study does not consider the restrictive effects of natural geographic elements or extend the SD model of the interaction between urbanization and eco-environment from the aspects of population, economy, society, space, and environment (Figure 4). The entire model consists of 94 different variables, such as birth rate, total population, GDP (2000 prices), total energy consumption (10,000 tons of coal equivalent), and total pollutant emissions.
3.
Variable parameters and methods of determining relationships
Before simulating predictions, initial values, constants, table functions, etc., of all state variable equations need to be assigned in the model. By combining different elements of the basic data of the interaction system between urbanization and eco-environment, the relationships between the variables are determined. The main methods for setting system parameters are as follows. ① Based on historical statistical data, regression methods are used to establish functional relationships between some variables in the model, and their rationalities are tested and analyzed. ② Integral function. Integral equations, such as GDP and total population, are established based on the variation of parameters. ③ Table function method. The functional relationships between the two variables are established on the basis of relevant planning and standard values, as well as annual average changes in statistical data over the years. ④ Based on the relevant planning and standards, the variable parameter values are determined. The variable parameters and established equations are presented in Table 1.

2.2.2. Distance Coordination Coupling Degree Model

The distance coordination coupling degree model introduces the Euclidean distance formula based on the calculation of the coordination degree calculation in order to measure the distance between the actual and ideal state of the system, i.e., the deviation between the actual and ideal values of the evaluation variables. When in ideal coordination, the two systems pull each other and are in a state of coordinated development [37,38]. This study uses the distance coordination coupling degree model to quantitatively estimate the coordination degree of the interaction coupling between the urbanization system and the eco-environment system, which can provide a detailed understanding of their development problems. The symbols x 1 t , x 1 t and x 2 t , x 2 t are used to represent the t th year actual and ideal values of the urbanization system and the eco-environment system, then there is ( x 1 t , x 2 t ) T = ( x 2 t , x 1 t ) T , and the formula for calculating the distance coordination degree is developed as follows [37]:
c t = 1 i = 1 2 x i t x i t 2 i = 1 2 S i 2 k
S 1 ,   S 2 are taken as 1 by assuming that the two systems are equally important. Furthermore, k is taken as 2 and represents the adjustment coefficient. The distance coordination degree between the urbanization system and the eco-environment system can be expressed as follows [37]:
c t = 1 x 1 t x 1 t 2 + x 2 t x 2 t 2 2 2 = 1 x 1 t x 2 t
where c t represents the coordination degree (CD) of the system in the t th year, and a higher c t value indicates a higher level of coordination between the urbanization system and the eco-environment system.
The coordinated development degree (CDD) can be used to reflect the level of coordinated development of the system as follows [37]:
d t = D ( x t , c t ) = x t c t
where d t represents the CDD of the system in the t year. A higher d t value indicates a higher level of coordinated system development.

2.2.3. Symbiosis Model of Urbanization and Eco-Environment

In our previous study, we confirmed the symbiosis hypothesis between urbanization and eco-environment, and quantitatively characterized the interdependence between the two using the symbiosis model, which revealed the interaction and reaction between urbanization and eco-environment [34]. Therefore, this study continues to use the symbiosis degree model to quantitatively measure the symbiosis of the simulation results between urbanization and eco-environment. The comprehensive urbanization level estimated by simulation data is the main quality parameter of urbanization, and the comprehensive level of eco-environment is the main quality parameter of eco-environment for calculating the degree of symbiosis to decouple the mode and size of mutual influence between the two. The formula for calculating the symbiosis degree of them is [39,40]:
δ x y = d x / x d y / y = d x d y · y x
δ y x = d y / y d x / x = d y d x · x y
where δ x y represents the symbiosis degree of the urbanization system to the eco-environment system. It denotes the change that the main parameters of the eco-environment system cause to the main parameters of the urbanization system. Furthermore, it reflects the contribution of the eco-environment system symbiosis unit to the urbanization system symbiosis unit. Next, δ y x indicates the symbiosis degree of the eco-environment system to the urbanization system and it represents the relative change that the main urbanization system parameters cause within the eco-environment system. This also reflects the contribution of the urbanization system symbiosis unit to the eco-environment system symbiosis unit. Taking zero as the critical value, the symbiosis mode can be divided into four categories: parasitic symbiosis, partial symbiosis, asymmetric mutualism, and symmetric mutualism (Table 2).

2.2.4. Grey Correlation Degree Model

The grey correlation model calculates the correlation degree between factors based on the similarity of their development trends. It is suitable for handling and analyzing multi-factor and nonlinear problems [41]. This model is adopted to process and analyze the nonlinear relationship between multiple factors, and the main influencing factors of the interaction between urbanization and eco-environment are quantitatively revealed. The grey correlation model is as follows [42]:
ξ i j ( k ) = min j = 1 n   min k = 1 q x i ( k ) y j ( k ) + ρ   max j = 1 n   max k = 1 q x i ( k ) y j ( k ) x i ( k ) y j ( k ) + ρ   max j = 1 n   max k = 1 q x i ( k ) y j ( k )
γ i j = 1 q k = 1 q ξ i j ( k )                 ( i = 1 , 2 , , m ;   j = 1 , 2 , , n )
where ρ denotes the resolution coefficient, in general, the interval of ρ values is [0, 1], ρ is usually taken as 0.5, and ξ i j ( k ) and γ i j represent the correlation coefficient between the i th urbanization indicator and the j th eco-environment indicator in the k th study unit. The average correlation coefficient of m samples is the correlation degree. Taking 0, 0.35, 0.65, 0.85, and 1 as the critical value, the degree of correlation can be divided into four grades: weak correlation, medium correlation, strong correlation, and extremely strong correlation [43] (Table 3).

3. Results

3.1. Analysis of SD Simulation Results

3.1.1. SD Model Check

Before running the model, it is necessary to perform a comprehensive inspection of its structure and functionality in order to ensure its effectiveness and authenticity, and to avoid significant errors in the model operation. Various indicators from 2000 to 2019 were simulated using the constructed SD model; in order to verify the reliability of the model simulation effect, 14 main variables were selected from all variables to test the average relative errors between their simulated values and actual statistical values from 2000 to 2019 (Table 4). The fitting degree between the simulated values and the actual statistical values is good, and the mean error rate is within ±5%. The simulation accuracy is high, which indicates that the model simulation results have good consistency with the actual behavior. The pattern of parameter change can represent the development trend of actual variables and fulfill the modeling requirements.
A robust SD model should be insensitive to changes in most parameters [44]. Therefore, further sensitivity analysis of the model parameters is required, which involves changing the parameter values and running the model to check whether positive and negative changes in the parameters significantly affect the model output. The calculation of parameter sensitivity is as follows [45]:
S Q i = Δ Q ( t ) Q ( t ) X ( t ) Δ X ( t )
S = 1 n i = 1 n S Q i
where t denotes time, and Q ( t ) and X ( t ) represent the values of variable Q and parameter X at time t , respectively. S Q i is the sensitivity of the horizontal variable Q to parameter X , and Δ Q ( t ) and Δ X ( t ) are the variation values of variable Q and parameter X at time t , respectively. n is the number of key variables, S Q i is the sensitivity of variable Q i , and S is the average sensitivity level of the horizontal variable Q .
The GDP growth rate and urbanization rate are selected for sensitivity analysis, and then both parameters are increased or decreased by 10% and the sensitivity of the model to parameter changes is tested. The sensitivity of the GDP growth rate increasing and decreasing by 10% is 0.57% and 0.51%, respectively. The sensitivity of increasing and decreasing the urbanization rate by 10% is 0.48% and 0.49%, respectively. The sensitivity of the parameters is less than 5%, which indicates that the model is not sensitive to parameter changes. Combining the validity verification and sensitivity testing of the SD model, the average error rate and sensitivity are less than 5%, indicating that the SD model constructed in this study is reliable and stable and can be used to simulate scenarios of the interaction between urbanization and eco-environment in the future.

3.1.2. Scenario Settings

Based on relevant historical statistical data, combined with the “Urban System Planning of Hebei Province (2016–2030)”, “Statistical Bulletin of Hebei Province”, “The 14th Five Year Plan for National Economic and Social Development in Hebei Province and the Outline of Long Range Objectives for 2035”, “the Proposal of the Communist Party of China Hebei Provincial Committee on Formulating the 14th Five Year Plan for National Economic and Social Development and the Long Range Objectives for 2035”, “Population Development Plan of Hebei Province(2018–2035)”, and other related planning, the variables of GDP growth rate, tertiary industry employment ratio, urbanization rate, birth rate, share of environmental protection expenditure in GDP, and change rate of surface water abstraction were selected as control variables of the system. Four scenarios were set up for simulating the dynamic changes of urbanization and eco-environment in Hebei Province from 2020 to 2035 by adjusting different value combinations of control variables (Table 5).
(1) The current development scenario is mainly based on historical data from 2000 to 2019, maintaining the parameters of each subsystem in accordance with the current development mode. The Urban System Planning of Hebei Province (2016–2030) clearly proposes that the urbanization rate in the province reach 70% in 2030. Combining the planning value, the scenario sets the urbanization rate at 70% in 2030, and considering the future decline in urban population growth rate and the slowdown in the rate of population urbanization, the urbanization rate is set at 72% in 2035. According to the coordinated development strategy of Beijing–Tianjin–Hebei, the economy of the province will maintain a relatively stable development trend, and the GDP growth rate will be set at 6%. The annual average birth rate is set at 12.34‰ and the share of environmental protection expenditure in GDP is set at 2% in 2030 and 2.5% in 2035. The South to North Water Diversion Project provides surface water to the province, with a rate of change in surface water abstraction of 2.4% in 2030 and 2.8% in 2035. The predicted value of the tertiary industry employment ratio is set to 44% in 2035 and is calculated using an index prediction model based on historical data.
(2) The urbanization priority development scenario is the achievement of rapid urban development through regulation, ensuring the improvement of social and economic development speed based on the current situation. Thus, the scenario sets the urbanization rate at 70% in 2030, and in combination with the target requirements of some prefecture-level cities in Hebei Province to achieve 75% or even higher urbanization rate by 2035, the urbanization rate in the province will continue to maintain a high growth rate, with a set urbanization rate of 74% in 2035. At the same time, in order to ensure the water resources needed for the rapid development of urbanization, the change rate of surface water abstraction is set at 3.1% in 2030 and 4.5% in 2035. Driven by the continuous deepening of Beijing–Tianjin–Hebei coordinated development, Hebei Province has a promising prospect for social and economic development, and the GDP growth rate is set at 7% in 2030 and 7.5% in 2035.
(3) The eco-environment priority scenario is set to achieve the goal of building a beautiful Hebei by 2035. This should be achieved by coordinating pollution control and ecological protection, deepening the battle for pollution prevention and control, and promoting continuous improvement of the eco-environment. This scenario reduces resource dependence and consumption while increasing investment in environmental protection. Therefore, the share of environmental protection expenditure in GDP is set at 3% in 2030 and 3.5% in 2035. At the same time, ensuring a moderate GDP growth rate and the level of urbanization development, the GDP growth rate is set at 6% in 2030 and 5.5% in 2035. Considering the target of urbanization rate of around 70% in the population development plan of Hebei Province in 2035 and maintaining a moderate growth rate, the urbanization rate is set at 70% in 2030 and 71% in 2035.
(4) The urbanization and eco-environment friendly development scenario is based on the above three scenarios by comprehensively considering urbanization development and eco-environment protection and ensuring economic and social development. Furthermore, it promotes the protection of the eco-environment, coordinated development and mutualism between urbanization and eco-environment. Thus, the parameter values of the scenario adopt the median values of the three control variables mentioned above. For example, according to the corresponding planning values, the urbanization rate is set to 70% in 2030, and taking the middle value of the above three scenarios, it is set to 73% in 2035.

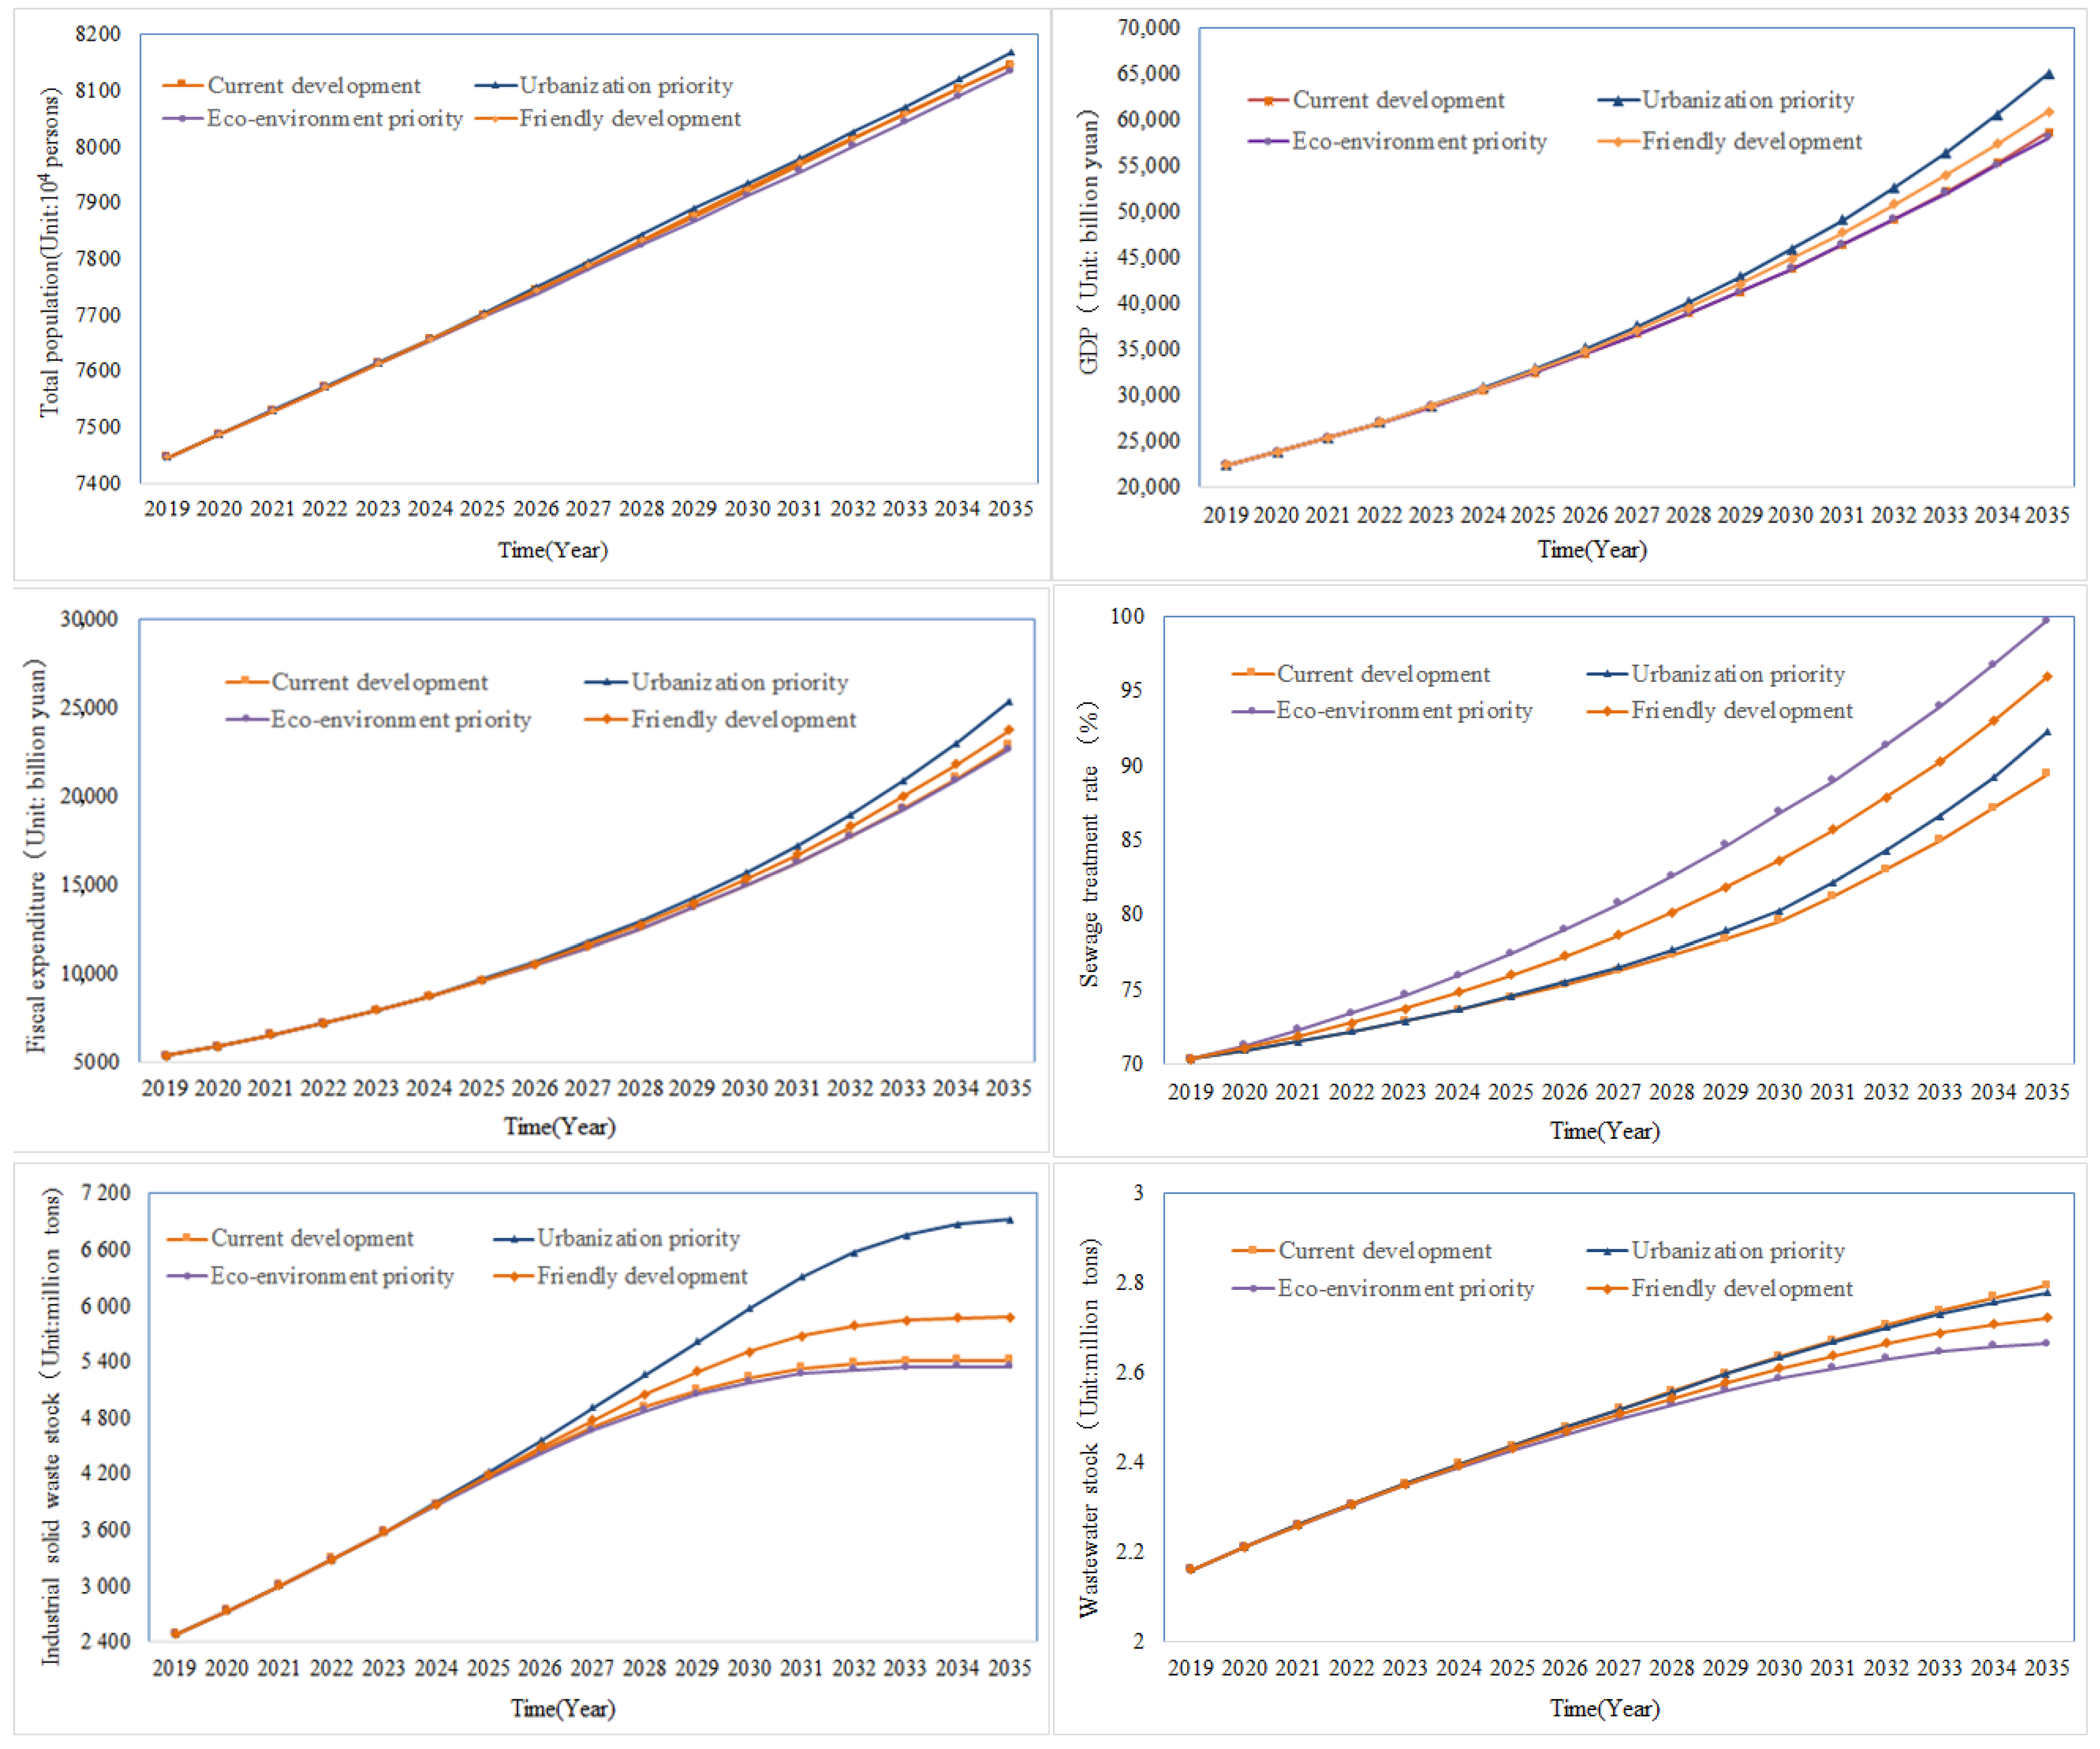
3.1.3. Analysis of Scenario Simulation Results

Based on the values of the control variable set in the four scenarios, future development trends of urbanization and eco-environment were simulated separately. Referring to the ideas of Grossman et al. [46] and Stern et al. [47] using sulfur dioxide emissions and GDP per capita as evaluation indicators for eco-environment and urbanization level, this study selected GDP, fiscal expenditure, and total population as evaluation indicators of urbanization, and wastewater stock, industrial solid waste stock, and sewage treatment rate as evaluation indicators of the eco-environment in order to compare and analyze the simulation results of four scenarios (Figure 5).
From the perspective of urbanization indicators, the simulated GDP, fiscal expenditure, and total population showed the same sustained upward trend in the four scenarios ordered as follows: urbanization priority development scenario > friendly development scenario > current development scenario > eco-environment priority scenario. It indicated that under the scenarios of setting a higher urbanization rate, social and economic development would be better, among which the urbanization priority development and the friendly development scenarios showed a better level of urbanization. Regarding the eco-environment indicators, the sewage treatment rate showed the same upward trend in the four scenarios, and the eco-environment priority scenario had a faster growth rate, followed by the friendly development scenario, the urbanization priority development scenario, and the current development scenario. The wastewater stock also showed an increasing trend, but with the increase in treatment rate, the increase rate in wastewater stock showed a more obvious trend with the following order: eco-environment priority scenario < friendly development scenario < urbanization priority development scenario < current development scenario. As for the industrial solid waste stock, the urbanization priority development scenario maintained rapid growth during the simulation period and was significantly higher than the other scenarios in the middle and later phases. Furthermore, the industrial solid waste stock in the other three scenarios remained relatively stable in the later stage, with the eco-environment priority scenario having the smallest stock. The comparative analysis showed that the eco-environment priority scenario was better, followed by the friendly development scenario.

3.2. Interaction Analysis of Different Scenario Simulation Results

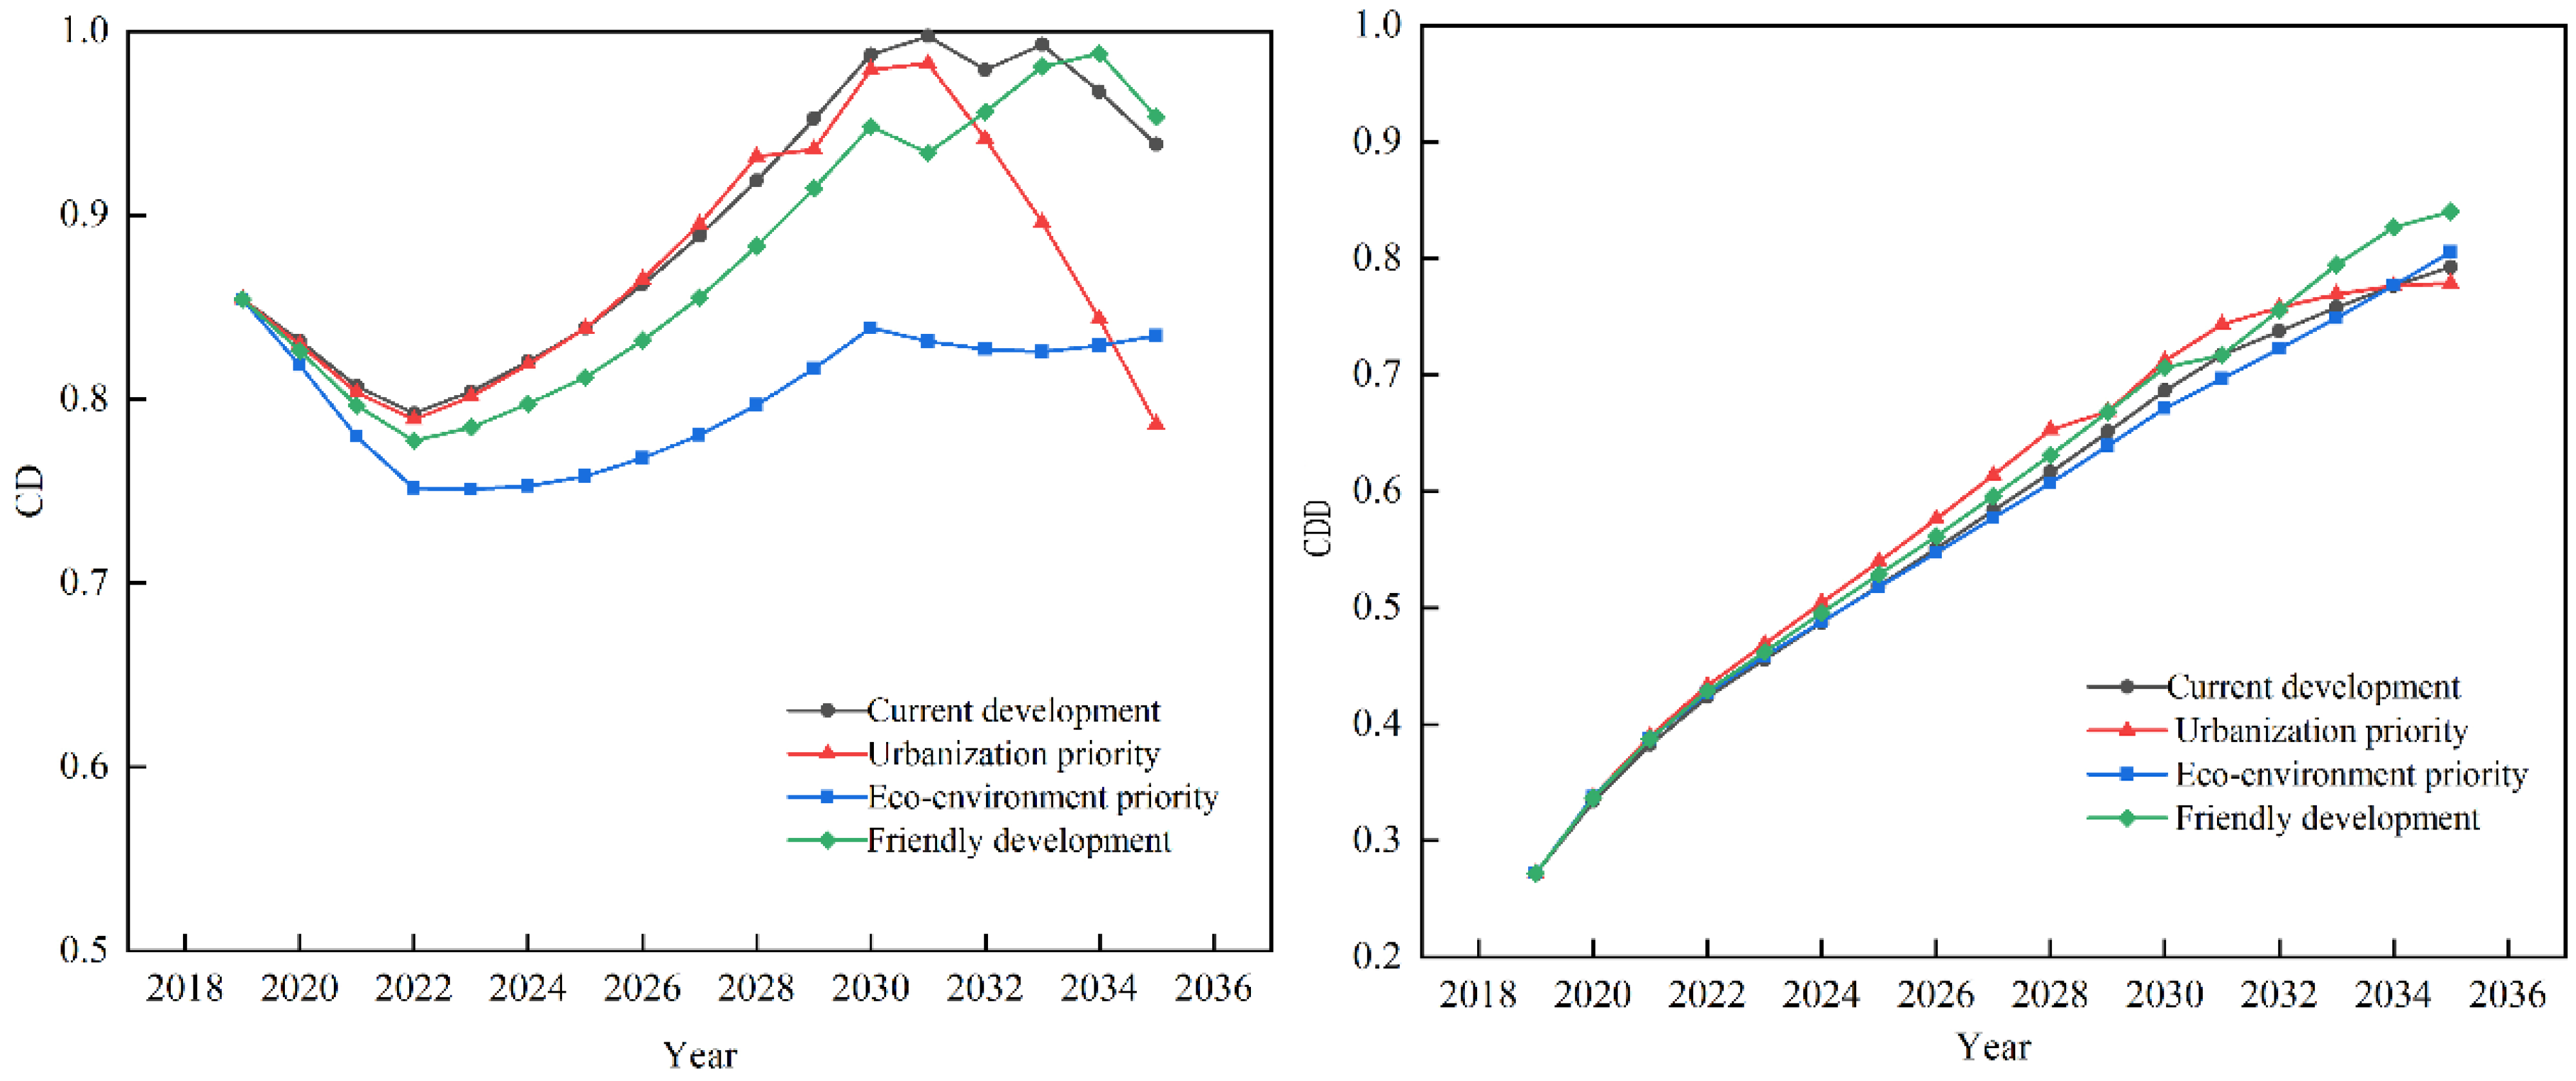
3.2.1. Analysis of the Coupling Relationship between Urbanization and Eco-Environment

Using the comprehensive evaluation index system for urbanization and eco-environment constructed in the previous study [34], the entropy weight method was applied in order to determine the weight of each evaluation index based on the simulation results of different scenarios. Linear weighted regression was used to calculate the comprehensive evaluation levels of urbanization and eco-environment for the four scenarios. According to Equations (2) and (3), the CD and CDD between urbanization and eco-environment system were calculated for the four scenarios (Figure 6). The CD of four scenarios showed a downward trend before 2022, with the eco-environment priority scenario showing the largest decrease. After that, the CD of the four scenarios showed an upward trend and reached its peak in 2030 or 2031. The CD of the current development and the urbanization priority development scenarios increased rapidly, while the eco-environment priority scenario increased slowly during this phase. The CD of all three scenarios had decreased after the peak, with the urbanization priority development scenario showing the most significant decline, while the friendly development scenario showed a slow and fluctuating upward trend. During the simulation period, the CD of the eco-environment priority scenario was consistently lower than the initial value of the baseline year. However, in the early and middle phases of the scenario simulation from 2019 to 2031, the CD of the current development and the urbanization priority development scenarios was relatively close and higher compared to the other two scenarios. This indicates that the current development and the urbanization priority development scenarios were more suitable for short- and medium-term planning. At the end of the scenario simulation period from 2032 to 2035, the CD of the friendly development scenario remained high and slowly increasing, indicating that this scenario is more suitable for long-term planning.
The CDD of the four scenarios showed an upward trend, indicating that the coupling coordination degree between urbanization and eco-environment system is constantly improving. In the early and middle phases of the scenario simulation from 2019 to 2031, the CDD of the urbanization priority development scenario was the highest, indicating a high coordinated development level between urbanization and eco-environment. Thus, this scenario is more suitable for short- and medium-term planning. At the end of the scenario simulation period from 2032 to 2035, the CDD of the urbanization priority development scenario tended to flatten and slightly decrease, while the CDD of the friendly development scenario continued to increase and was the highest among the scenarios. The CDD of the friendly development scenario maintained an upward trend during the entire simulation period, further indicating that this scenario is suitable for long-term planning.

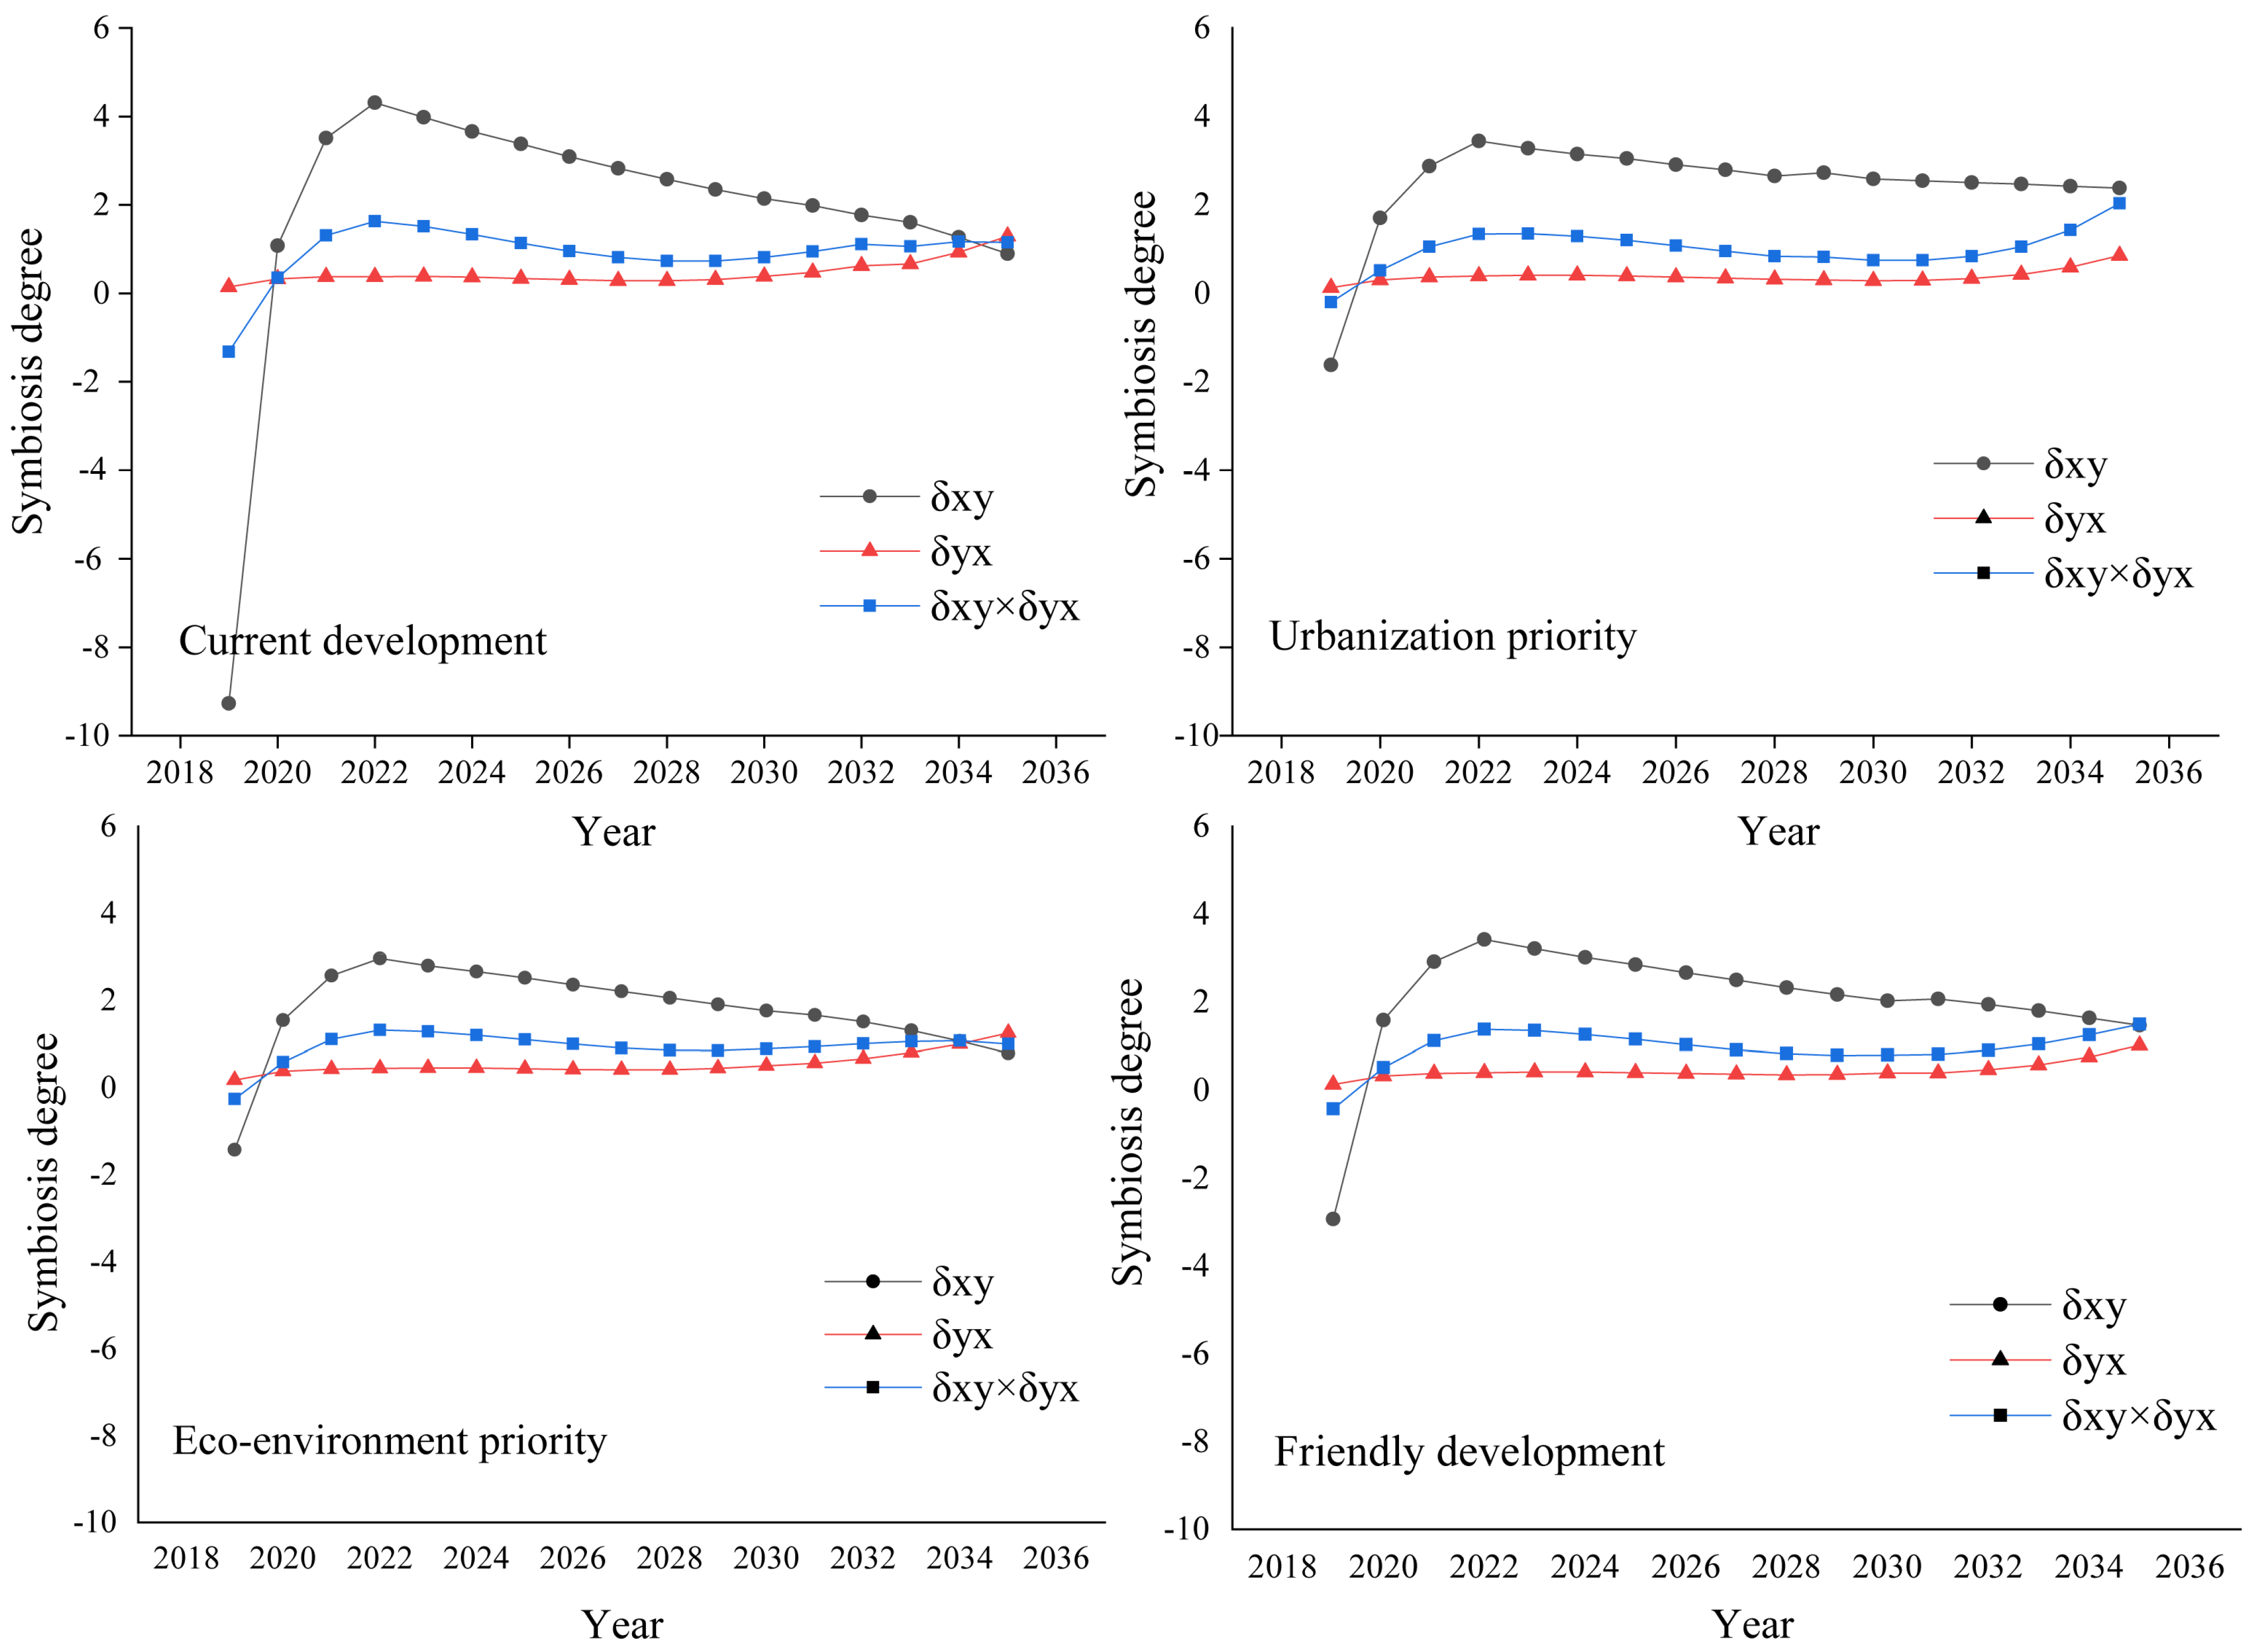
3.2.2. Analysis of the Symbiotic Relationship between Urbanization and Eco-Environment

Using the comprehensive evaluation level of urbanization and eco-environment as quality parameters, a linear regression model was used to construct quantitative expressions between urbanization and eco-environment quality parameters in the four scenarios (Table 6). The Adj.R2 values were all above 0.98, and the regression models had good explanatory ability. The study substituted the obtained regression model into Equations (4) and (5) and calculated the symbiotic degree of urbanization on eco-environment and the symbiotic degree of eco-environment on urbanization in different scenarios (Figure 7). The year 2019 was used as a benchmark year based on actual data, and the symbiosis analysis did not consider this year. Combined with the classification criteria of symbiosis mode (Table 2), the symbiosis mode between urbanization and eco-environment was asymmetric mutualism in the four scenarios from 2020 to 2035. The symbiosis degree of urbanization on eco-environment and the symbiosis degree of eco-environment on urbanization were greater than 0 in the four scenarios. The symbiosis degree of eco-environment on urbanization showed an increasing trend, i.e., the promoting effect of urbanization on the eco-environment was constantly strengthening. The symbiosis degree of urbanization on eco-environment first increased and then decreased, showing a stretched inverted U-shaped curve, i.e., that is, the promoting effect of eco-environment on urbanization first strengthened and then weakened. Overall, except for the current development and the eco-environment priority scenarios in 2035, in which δ x y was less than δ y x , in the overall performance of the four scenarios, δ y x was greater than δ x y . In other words, during the scenario simulation period, the promoting effect of eco-environment on urbanization development was stronger than that of urbanization effect on eco-environment. In addition, at the end of the scenario simulation, except for the urbanization priority development scenario, δ x y and δ y x values of the other three scenarios gradually approached each other. Furthermore, the mutual promotion effect between the two tended to be consistent. Among them, the product of δ x y and δ y x in the friendly development scenario was higher than that in the current development scenario and the eco-environment priority scenario, which indicates that at the end of the scenario simulation, the friendly development scenario was the most coordinated between urbanization and eco-environment, and the interaction between the two was more favorable, tending towards the mode of symmetric mutualism.

3.3. Determination of Preferred Scenarios

The relatively optimal scenario will be determined based on the single indicators of urbanization and eco-environment system, distance coordination coupling degree, and symbiosis. (1) From the perspective of single indicators, three indicators that reflected the level of urbanization development, namely GDP, fiscal expenditure, and total population, were ranked as the top two in the simulation results of the urbanization priority development and the friendly development scenarios. By comparing and analyzing the wastewater stock, industrial solid waste stock, and sewage treatment rate as indicators of the eco-environment quality, it was determined that the eco-environment priority scenario was better and was followed by the friendly development scenario. Regarding comprehensive individual indicators, the friendly development scenario was considered the optimal scenario as it considered the development of urbanization and also effectively protected the eco-environment. (2) In terms of distance coordination, the CDs of the current development and the urbanization priority development scenarios were close and higher than the other two scenarios in the early and middle phases of the simulation, and then showed a downward trend in the later stage, especially for the urbanization priority development, which decreased rapidly, while the CD of the friendly development scenario remained high and slowly increased. These results indicate that the current development scenario and the urbanization priority development scenarios were suitable for short-term and medium-term planning, while the friendly development scenario was more suitable for long-term planning. At the same time, the CDD trend among the four scenarios also showed that the urbanization priority development scenario was more suitable for short- and medium-term planning, while the friendly development scenario was suitable for long-term planning. Accordingly, the friendly development scenario was the preferred scenario from a long-term simulation perspective. (3) Regarding the symbiosis between urbanization and eco-environment, although the symbiosis mode between them exhibited asymmetric mutualism in the four scenarios, there was still a significant gap between δ x y and δ y x for the urbanization priority scenario, while the other three scenarios gradually approached each other at the end of the scenario simulation. In addition, the product of δ x y and δ y x for the friendly development scenario was greater than that for the current development and eco-environment priority scenario. This indicates that the friendly development scenario had a similar mutual promotion effect between urbanization and eco-environment, tending towards the symmetric mutualism mode at the end of the simulation. Based on the analysis of the abovementioned three aspects, it was determined that the friendly development scenario was the optimal scenario for long-term planning.

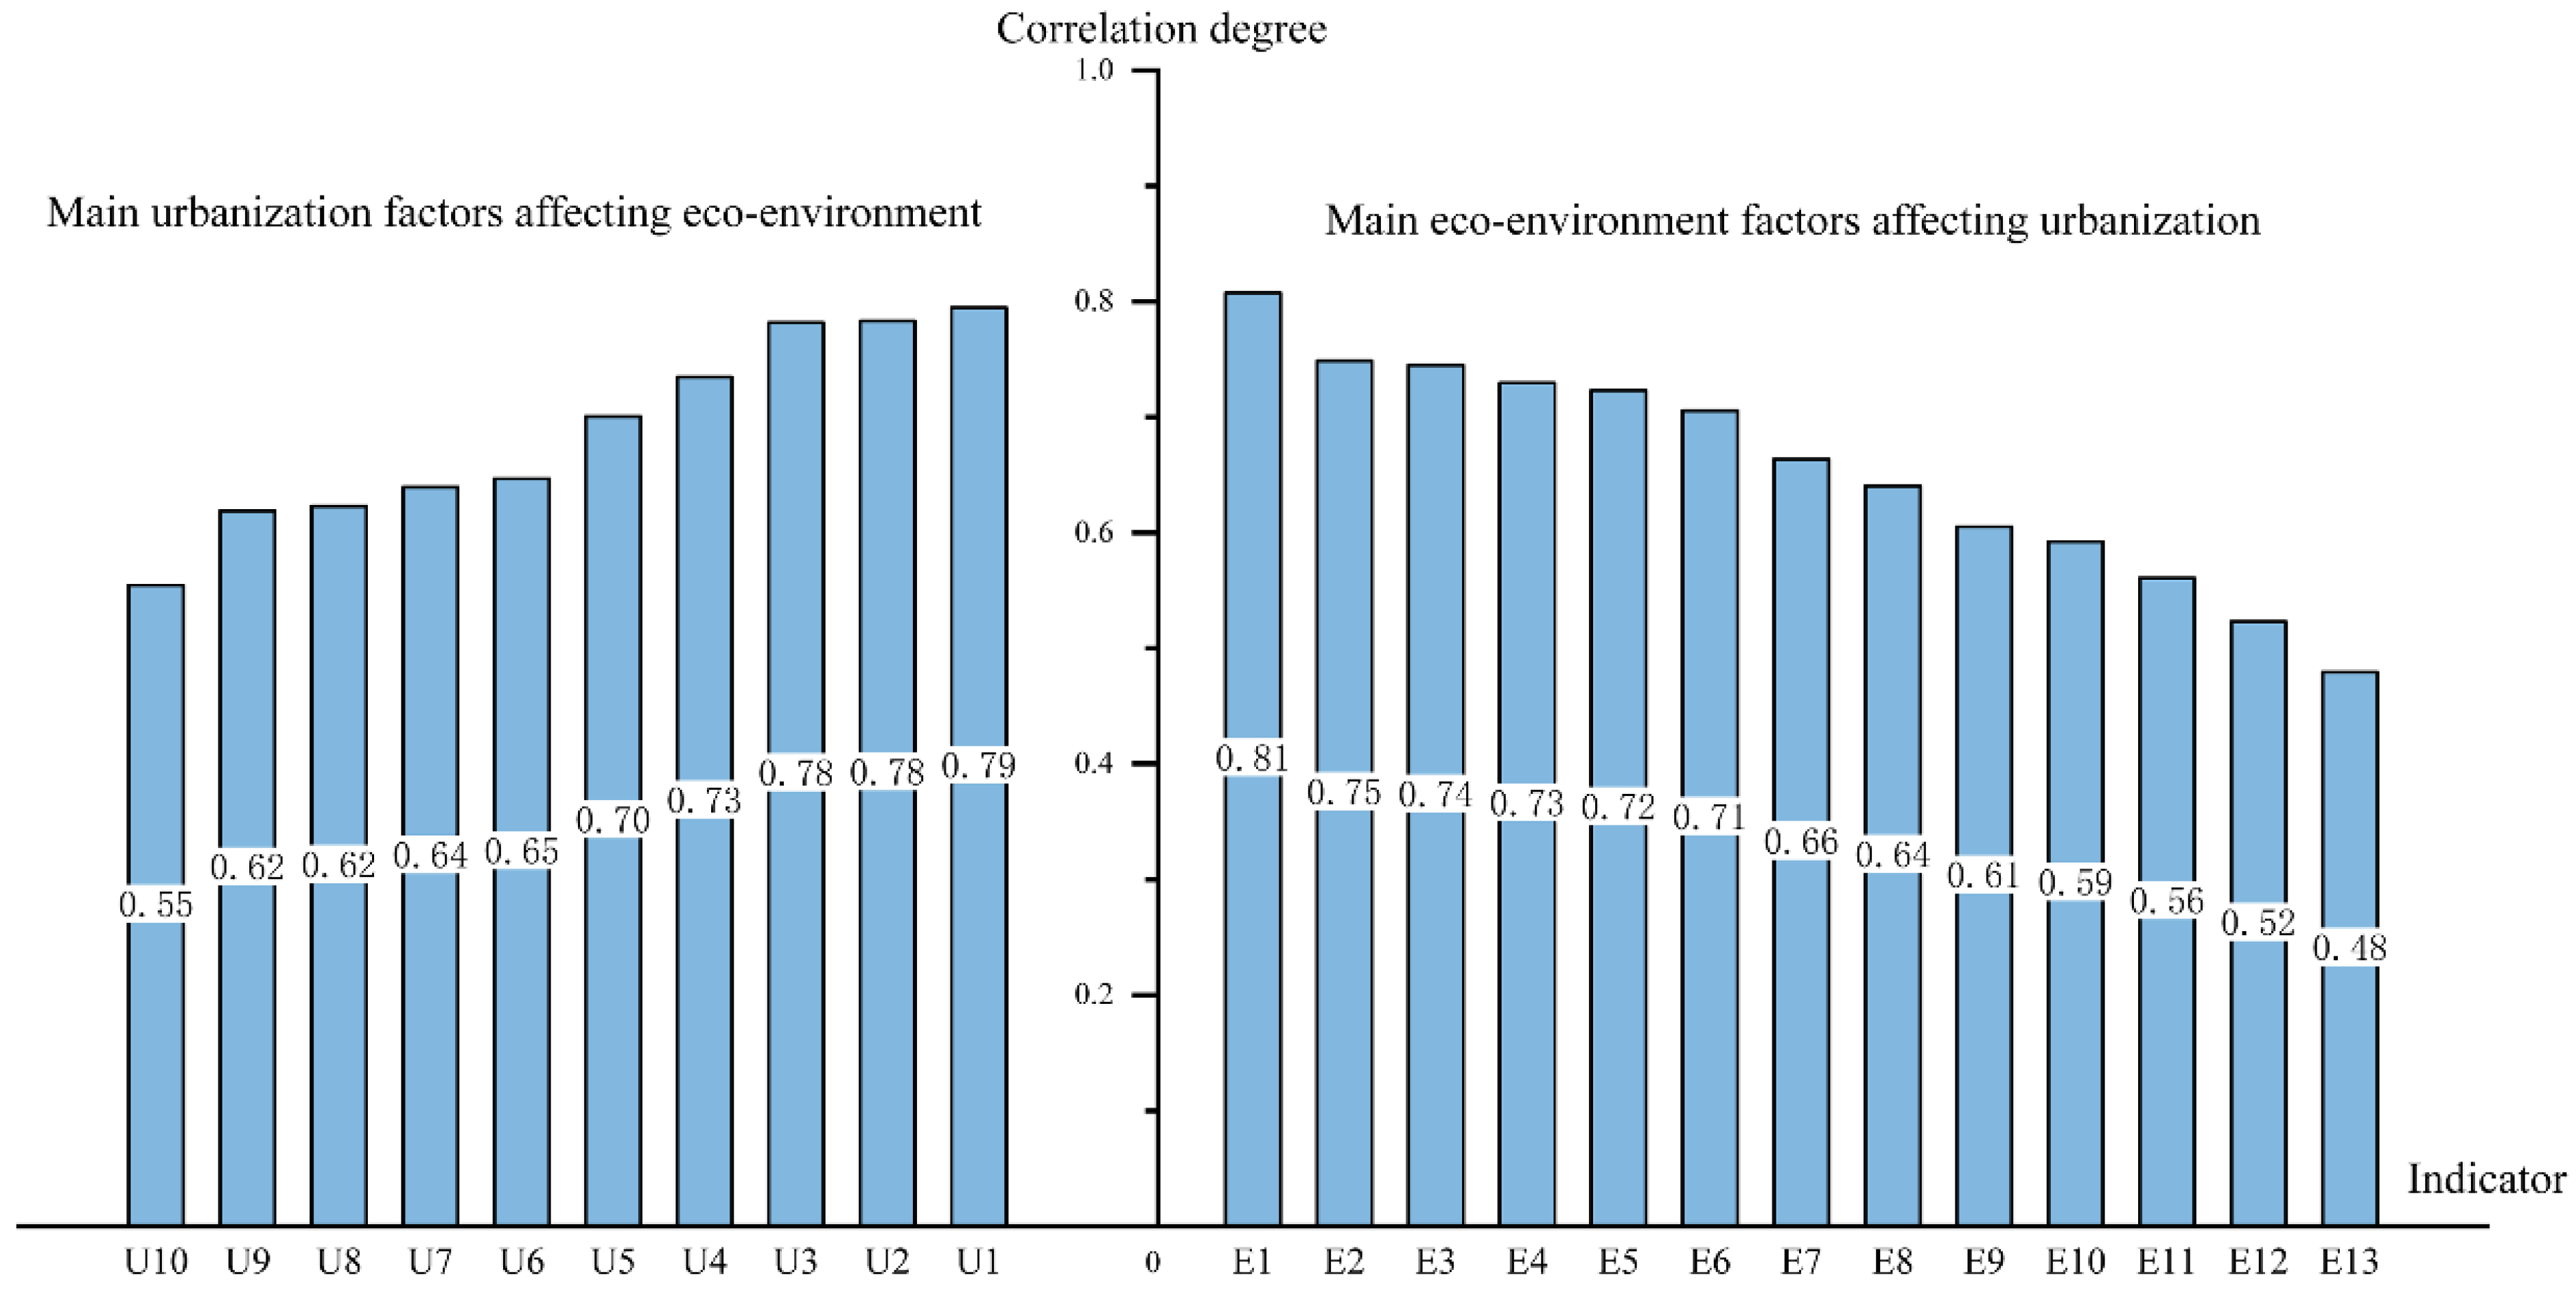
3.4. Analysis of Influence Factor on the Interaction between Urbanization and Eco-Environment

A dataset of urbanization and eco-environment evaluation indicator system was constructed from 1985 to 2035 based on the optimal scenario determined in the abovementioned text and combined with historical data and scenario simulation data. The correlation degrees between each indicator and the comprehensive evaluation level of urbanization and eco-environment were calculated using Equations (6) and (7), respectively, and the results are shown in Figure 7. Overall, the degrees of correlation were in the range of [0.47, 0.81], and combined with the correlation grading in Table 3, they belonged to moderate and strong correlation. These results indicate that there was a close connection between various elements of the interaction between urbanization and eco-environment in Hebei Province. We further ranked the calculated correlation and analyzed the main influencing factors of urbanization on eco-environment and vice versa.
The impacts of urbanization on eco-environment were often manifested in urban spatial expansion, population migration, and adjustment of the industrial structure. Based on 50 years of data, out of ten urbanization evaluation indicators, the top five indicators with the highest correlation degree with the eco-environment comprehensive evaluation level were urban built-up area per capita, urban per capita disposable income, urbanization rate, GDP per capita, and share of fiscal revenue in GDP (Figure 8), with correlation degrees greater than 0.7, indicating strong correlation. Among them, the urban built-up area per capita was the most important influencing factor, which is consistent with the results obtained by Liu et al. [48] and Sun et al. [49]. Cities, through various activities such as urban expansion, population growth, technological advancement, and industrial transformation and upgrading, have not only threatened the eco-environment, but also promoted the improvement and enhancement of eco-environment.
The impacts of eco-environmental factors were mainly manifested as support or limitation of the urbanization process. Among the thirteen indicators in the eco-environment evaluation system, the top seven indicators with the highest degree of correlation with urbanization level were total grain production per capita, industrial wastewater discharge per capita, forest coverage rate, total available water resources per capita, comprehensive utilization rate of industrial solid waste, sulfur dioxide discharge per capita, and green space area per capita (Figure 8), with correlation degree greater than 0.65, indicating strong correlation. For a long time in the past and in the future, sufficient grain production will provide solid material support for urbanization development in Hebei Province, and the gradual reduction in pollutant emissions will reduce the pressure on the eco-environment. At the same time, the gradually increasing rate of forest coverage, green space area per capita, and sufficient water resources will provide important support for urbanization development.

4. Discussion

The dynamic simulation study of the interaction between urbanization and eco-environment can provide references for decision making to implement high-quality coordinated regional development. Faced with the constraints of regional resources and the environment, searching for a coordinated mode of urbanization development with the eco-environment is a scientific problem that urgently needs to be solved in regional development. In recent years, some scholars have simulated the future development of the relationship between urbanization and eco-environment using various predictive models based on historical data [50,51], and conducted strategic decision analysis based on simulation results of relevant indicators. Compared with existing research, this study built an SD model of urbanization and eco-environment in Hebei Province, and based on different emphases and ideas for future development, four scenarios were defined in order to simulate the evaluation indicators related to the two systems. In the evaluation of the results of the scenario simulation, the symbiosis hypothesis between urbanization and eco-environment was introduced. Based on the comparative analysis of indicators, coupling and decoupling of different dimensions, the indicator evaluation method, distance coordination coupling degree model, and symbiosis degree model were applied to quantitatively evaluate the simulation results of different scenarios and obtain the optimal scenarios for different simulation periods. Thus, this study expanded the application of symbiosis theory and the SD dynamic simulation and evaluation methods to the interaction between urbanization and eco-environment and achieved a quantitative evaluation of various policy simulations.
There is a specific feedback relationship between the elements of the coupling system of urbanization and eco-environment. Therefore, in SD modeling, this study referred to existing research for feedback loops between some elements, such as the construction of feedback loops between carbon dioxide emissions, energy consumption, urbanization rate [52,53,54], Cobb–Douglas equation construction of the relationship between tertiary industry output, fixed asset investment in tertiary industry, employees of tertiary industry, and the response relationship between mortality and pollutant emissions [24]. This study obtained relevant knowledge, determined system boundaries, and made modeling more reasonable. The results of the study showed that the constructed SD model of urbanization and eco-environment had strong robustness and could be used to simulate the indicator specific values of urbanization and eco-environment in Hebei Province for different scenarios. In addition, by quantitative evaluating the simulation results using three methods, it was found that the evaluation results had a strong consistency. At the same time, it was also noted that the indicator evaluation method determined the optimal scenario by comparing and analyzing the evolution trend of indicators during the simulation period. The distance coordination coupling degree model and the symbiosis degree model could comprehensively and periodically reveal the advantages and disadvantages of different scenarios based on comprehensive evaluation. Furthermore, the symbiosis degree model could effectively depict the size and mode of the mutual influence between urbanization and eco-environment. Therefore, this study integrated multiple evaluation methods and carried out quantitative optimization of the simulation scheme from a holistic and phased perspective, which had a strong objectivity and reference significance. The study results also provided references for the formulation of medium- and long-term coordinated development strategies between urbanization and eco-environment in the province.
The complex interaction between urbanization and eco-environment has a consensus in academic circles, but the main factors influencing the interaction between the two have not been effectively explained. This study combined historical and simulated data and used the grey correlation model in order to quantitatively identify the main factors influencing the interaction between urbanization and eco-environment in Hebei Province in the past 50 years. The five evaluation indicators of urbanization have been identified to have major impacts on eco-environment, and they are manifested in urban spatial expansion, urban population, and urban economic status. The evaluation indicators of eco-environment had seven main influencing factors on urbanization, manifested in the support of food, water, and green space, as well as the constraints on pollutant emissions. In addition, the per capita urban built-up area and per capita total grain production had become the main factors affecting the interaction between urbanization and eco-environment in the province. These results suggest that Hebei Province should coordinate the relationship between urban expansion and grain production land, which was consistent with the concept of striving for “frugality” as much as possible by Lu et al., from the perspective of human economic geography, and that the national new urbanization construction should control the urban land area per capita [17]. The identification of the main factors reflects some problems faced by the coordinated development of urbanization and eco-environment in Hebei Province currently and in the future. Based on the optimal result, the urbanization priority development scenario is suitable for short- and medium-term planning, while the friendly development scenario is more suitable for long-term planning. Therefore, in the short and medium term, the government should take county towns as important carriers, coordinate urban and rural population, territorial space, and socio-economic development, emphasize rational resource allocation and eco-environment protection, deepen urbanization construction, and improve the level of urbanization in the province. In the long term, the government should emphasize the relationship between the urbanization development quality and ecological environment protection, clarify the main problems that the urbanization development is facing, adhere to the problem and policy guidance, implement measures from aspects such as food supply, water resources, territorial space development, and pollution control, improve the quality of urbanization development, enhance the carrying capacity of eco-environment, and promote the coordinated development of urbanization and eco-environment in the province.
The SD model for the interaction between urbanization and eco-environment in Hebei Province was established, and four scenarios were set up for dynamic simulation. However, the development of urbanization and eco-environment were influenced by many factors, and model parameter values and the complexity of modeling variables would bring many uncertainties to the simulation results. Therefore, future study will further enrich the model variables, carry out reasonable analysis of parameter values and analysis of redundant variables, in order to more reasonably simulate the interaction between urbanization and eco-environment and provide a reference basis for the implementation of regional coordinated development in Hebei Province.

5. Conclusions

Based on historical panel data, an SD model of the interaction between urbanization and eco-environment in Hebei Province was constructed, and four scenarios were simulated and predicted. The symbiosis theory is introduced into scenario evaluation, and the single indicator evaluation method, the distance coordination coupling degree model, and the symbiosis degree model are comprehensively used in order to evaluate and select the coordinated development scenarios for urbanization and eco-environment that are suitable for medium- and long-term development. Furthermore, the grey correlation model is used to quantitatively identify the main influencing factors of urbanization and eco-environment system in the past and in the future. The main conclusions are as follows:
(1) The constructed SD model of the interaction between urbanization and eco-environment has passed sensitivity and effectiveness testing, and has strong robustness, which can be used to simulate future policies. Six control variables were selected and four scenarios were set to dynamically simulate urbanization and eco-environment development trends in Hebei Province from 2020 to 2035.
(2) During the simulation period, the CD of the four scenarios shows phased and differentiated changes, while the CDD shows the same overall upward trend, but the change trend at the end of the scenario simulation is different. The symbiosis mode between urbanization and eco-environment of the four scenarios shows asymmetric mutualism, and eco-environment has a stronger promoting effect on urbanization development and shows a weakening trend during the entire simulation period. Three methods are applied to quantitatively evaluate the scenarios, and the results show strong consistency. The distance coordination coupling degree model and the symbiosis degree model can be used to reveal the advantages and disadvantages of the overall and phased scenarios. The urbanization priority development scenario is more suitable for short- and medium-term planning, while the friendly development scenario should be selected for the entire simulation period.
(3) The five indicators of urbanization are strongly correlated with the comprehensive evaluation of eco-environment, and the corresponding seven eco-environment indicators are strongly correlated with urbanization level. Among them, urban built-up area per capita and total grain production per capita are the main factors influencing the interaction between urbanization and eco-environment in Hebei Province.

Author Contributions

H.W. and J.Z. participated in the design of this study. H.W. and A.Z. wrote the original draft. H.W. and Y.C. reviewed and edited the manuscript. K.W. collected data. A.Z. and J.Z. processed the relevant data. J.Z. drew diagrams. All authors have read and agreed to the published version of the manuscript.

Funding

This work was funded by the National Natural Science Foundation of China, grant number 42171212, Science Research Project of Hebei Education Department, grant number ZD2020312.

Institutional Review Board Statement

Not applicable.

Informed Consent Statement

Not applicable.

Data Availability Statement

The data presented in this study are available on request from the corresponding author.

Conflicts of Interest

The authors declare that they have no known competing financial interests.

References

  1. Gu, C.L. Urbanization: Positive and negative effects. Sci. Bull. 2019, 64, 281–283. [Google Scholar] [CrossRef]
  2. Li, L.B.; Gao, X.L.; Huang, J.L. Prospects for major issues of China’s new urbanization development during the “14th Five-Year Plan” period. J. Manag. World 2020, 36, 7–22. [Google Scholar]
  3. Yu, Y.; Tong, Y.; Tang, W.W.; Yuan, Y.B.; Chen, Y. Identifying Spatiotemporal Interactions between Urbanization and Eco-Environment in the Urban Agglomeration in the Middle Reaches of the Yangtze River, China. Sustainability 2018, 10, 290. [Google Scholar] [CrossRef]
  4. Fang, C.L. Basic rules and key paths for high-quality development of the new urbanization in China. Geogr. Res. 2019, 38, 13–22. [Google Scholar]
  5. Fang, C.L.; Zhou, C.H.; Gu, C.L.; Chen, L.D. Theoretical analysis of interactive coupled effects between urbanization and eco-environment in mega-urban agglomerations. Acta Geogr. Sin. 2016, 71, 531–550. (In Chinese) [Google Scholar] [CrossRef]
  6. Zhao, Y.; Wang, S.; Zhou, C. Understanding the relation between urbanization and the eco-environment in China’s Yangtze River Delta using an improved EKC model and coupling analysis. Sci. Total Environ. 2016, 571, 862–875. [Google Scholar] [CrossRef]
  7. Zhou, D.Y.; Tian, Y.Y.; Jiang, G.G. Spatio-temporal investigation of the interactive relationship between urbanization and ecosystem services: Case study of the Jingjinji urban agglomeration, China. Ecol. Indic. 2018, 95, 152–164. [Google Scholar] [CrossRef]
  8. Gong, Z.; Mao, R.; Jiang, J.J. Coupling and coordination degree between urbanization and ecological environment in guizhou, China. Discret. Dyn. Nat. Soc. 2021, 2021, 8436938. [Google Scholar] [CrossRef]
  9. Fang, C.L.; Liang, L.W.; Chen, D. Quantitative simulation and verification of urbanization and eco-environment coupling coil in Beijing-Tianjin-Hebei urban agglomeration, China. Sustain. Cities Soc. 2022, 83, 103985. [Google Scholar] [CrossRef]
  10. Zeng, W.X.; Chen, X.; Wu, Q.R.; Dong, H.Z. Spatiotemporal heterogeneity and influencing factors on urbanization and eco-environment coupling mechanism in China. Environ. Sci. Pollut. Res. 2023, 30, 1979–1996. [Google Scholar] [CrossRef]
  11. Guo, S.S.; Chen, M.X.; Liu, H. Coupling procedure and decoupling analysis of urbanization and resource environment: The study of Beijing. Geogr. Res. 2018, 37, 1599–1608. (In Chinese) [Google Scholar]
  12. Liang, J.Y.; Xie, Y.C.; Sha, Z.Y.; Zhou, A. Modeling urban growth sustainability in the cloud by augmenting Google Earth Engine (GEE). Comput. Environ. Urban Syst. 2020, 84, 101542. [Google Scholar] [CrossRef]
  13. Yang, H.; Wu, C.W.; Zhou, S.Y.; Yang, Y. Coordinated development of urbanization, resources and environment in Beijing-Tianjin-Hebei Region. J. Arid. Land Resour. Environ. 2020, 34, 17–24. (In Chinese) [Google Scholar]
  14. Zheng, H.; Khan, Y.A.; Abbas, S.Z. Exploration on the coordinated development of urbanization and the eco-environmental system in central China. Environ. Res. 2022, 204, 112097. [Google Scholar] [CrossRef]
  15. Xie, Y.; Liu, C.; Chang, S.; Jiang, B. Urban Sustainability:Integrating Socioeconomic and Environmental Data for Multi-Objective Assessment. Sustainability 2022, 14, 9142. [Google Scholar] [CrossRef]
  16. Shang, J.; Dong, L.; Ali, R.; Shen, X.; Rehman, R. The influence mechanism of new-type urbanization on the eco-environment in western china-guanzhong using improved entropy weight method. Int. J. Environ. Sci. Technol. 2023, 20, 6395–6418. [Google Scholar] [CrossRef]
  17. Lu, D.D.; Chen, M.X. Several viewpoints on the background of compiling the “National New Urbanization Planning (2014–2020)”. Acta Geogr. Sin. 2015, 70, 179–185. (In Chinese) [Google Scholar]
  18. Cui, X.G.; Fang, C.L.; Liu, H.M.; Liu, X.F.; Li, Y.H. Dynamic simulation of urbanization and eco-environment coupling: A review on theory, methods and applications. Acta Geogr. Sin. 2019, 74, 1079–1096. (In Chinese) [Google Scholar]
  19. Itami, R.M. Simulating spatial dynamics: Cellular automata theory. Landsc. Urban Plan. 1994, 30, 27–47. [Google Scholar] [CrossRef]
  20. Tan, X.L.; Ouyang, Q.L.; Jiang, Z.; Liu, Z.; Tan, J.; Zhou, G.H. Urban spatial expansion and its influence factors based on RS/GIS: A case study in Changsha. Econ. Geogr. 2017, 37, 81–85. (In Chinese) [Google Scholar]
  21. Cao, Q.W.; Gu, C.L.; Guan, W.H. China’s urbanization SD modelling and simulation based on land use. J. Nat. Resour. 2021, 36, 1062–1084. (In Chinese) [Google Scholar] [CrossRef]
  22. Chen, X.; Liu, X. Geographical Detection Analysis and Spatiotemporal Disparity Characteristics of the Coupling Coordination Development between Urbanization and the Eco-Environment. Sustainability 2023, 15, 3931. [Google Scholar] [CrossRef]
  23. Wilkerson, B.; Romanenko, E.; Barton, D.N. Modeling reverse auction-based subsidies and stormwater fee policies for Low Impact Development (LID) adoption: A system dynamics analysis. Sustain. Cities Soc. 2022, 79, 103602. [Google Scholar] [CrossRef]
  24. Fang, C.L.; Cui, X.G.; Li, G.D.; Bao, C.; Wang, Z.B.; Ma, H.T.; Sun, S.A.; Liu, H.M.; Luo, K.; Ren, Y.F. Modeling regional sustainable development scenarios using the Urbanization and Eco-environment Coupler: Case study of Beijing-Tianjin-Hebei urban agglomeration, China. Sci. Total Environ. 2019, 689, 820–830. [Google Scholar] [CrossRef]
  25. Wang, X.K.; Dong, Z.C.; Sušnik, J. System dynamics modelling to simulate regional water-energy-food nexus combined with the society-economy-environment system in Hunan Province, China. Sci. Total Environ. 2023, 863, 160993. [Google Scholar] [CrossRef]
  26. Wang, H.; Bao, C. Scenario modeling of ecological security index using system dynamics in Beijing-Tianjin-Hebei urban agglomeration. Ecol. Indic. 2021, 125, 107613. [Google Scholar] [CrossRef]
  27. Chen, G.J.; Yao, C.Y.; Fan, L.R.; Li, L.Z.; Cao, H.Q. Sustainability-oriented system dynamics method for coordinated megacity ecosystem development: The case of Beijing, China. Environ. Dev. Sustain. 2021, 24, 11027–11057. [Google Scholar] [CrossRef]
  28. Han, B.Y.; Ma, Z.L.; Wu, M.L.; Liu, Y.; Peng, Z.M.; Yang, L. Simulation research on the coordinated development path of urbanization and real estate market using system dynamics in Chongqing City, Southwest China. Ecol. Indic. 2022, 143, 109328. [Google Scholar] [CrossRef]
  29. Wang, S.J.; Ma, H.T.; Zhao, Y.B. Exploring the relationship between urbanization and the eco-environment—A case study of Beijing–Tianjin–Hebei region. Ecol. Indic. 2014, 45, 171–183. [Google Scholar] [CrossRef]
  30. Wang, S.J.; Fang, C.L.; Wang, Y. Quantitative investigation of the interactive coupling relationship between urbanization and eco-environment. Acta Ecol. Sin. 2015, 35, 2244–2254. (In Chinese) [Google Scholar]
  31. Liu, H.B.; Liu, Y.Y.; Wang, H.N.; Yang, J.Y.; Zhou, X. Research on the coordinated development of greenization and urbanization based on system dynamics and data envelopment analysis: A case study of Tianjin. J. Clean. Prod. 2019, 214, 195–208. [Google Scholar] [CrossRef]
  32. Li, H.; Song, W. Evolution of rural settlements in the Tongzhou District of Beijing under the new-type urbanization policies. Habitat Int. 2020, 101, 102198. [Google Scholar] [CrossRef]
  33. Liu, Y.M.; Tian, M.; Yang, Y.J. Research on the Model and Characteristics of In Situ Urbanization: A Case Study of Four Villages in Hebei Province. Urban Dev. Res. 2021, 28, 10–16. (In Chinese) [Google Scholar]
  34. Wang, H.F.; Zhao, A.; Cao, Y.; Xie, Y.; Guo, L.X. Interaction between Urbanization and Eco-Environment in Hebei Province, China. Sustainability 2022, 14, 9214. [Google Scholar] [CrossRef]
  35. Gong, P.; Li, X.C.; Wang, J.; Bai, Y.Q.; Chen, B.; Hu, T.Y.; Liu, X.P.; Xu, B.; Yang, J.; Zhang, W.; et al. Annual maps of global artificial impervious area (GAIA) between 1985 and 2018. Remote Sens. Environ. 2019, 236, 111510. [Google Scholar] [CrossRef]
  36. Xu, J.H. Mathematical Methods in Contemporary Geography, 3rd ed.; Higher Education Press: Beijing, China, 2020; pp. 370–390. (In Chinese) [Google Scholar]
  37. Tang, L.; Li, J.P.; Yu, L.A.; Tang, D.H. Quantitative evaluation methodology for system coordination development based on distance coordination degree model. Syst. Eng.-Theory Pract. 2010, 30, 594–602. (In Chinese) [Google Scholar]
  38. Feng, Y.X.; Li, G.D. Interaction between urbanization and eco-environment in Tibetan Plateau. Acta Geogr. Sin. 2021, 31, 298–324. (In Chinese) [Google Scholar] [CrossRef]
  39. Yuan, C.Q. Harmony and Symbiosis; Social Sciences Academic Press: Beijing, China, 2008. (In Chinese) [Google Scholar]
  40. Liang, L.W.; Wang, Z.B.; Fang, C.L. Spatiotemporal differentiation and coordinated development pattern of urbanization and the ecological environment of the Beijing-Tianjin-Hebei urban agglomeration. Acta Ecol. Sin. 2019, 39, 1212–1225. (In Chinese) [Google Scholar]
  41. Deng, J.L. Introduction to gray system theory. J. Grey Syst. 1989, 1, 1–24. [Google Scholar]
  42. Zhang, L.; Gao, S.H.; Wei, B.G.; Li, Y.H.; Li, H.R.; Wang, L.; Ye, B.X. Effects of urbanization on rural drinking water quality in Beijing, China. Sustainability 2017, 9, 461. [Google Scholar] [CrossRef]
  43. Luo, S.H.; Ma, W.C.; Wang, X.R.; Yong, Y.; Yu, Q. A case study on indicator system of urban environmental protection and ecological construction. Acta Ecol. Sin. 2003, 1, 45–55. (In Chinese) [Google Scholar]
  44. Gu, C.L.; Ye, X.Y.; Cao, Q.W.; Guan, W.H.; Peng, C.; Wu, Y.T.; Zhai, W. System dynamics modelling of urbanization under energy constraints in China. Sci. Rep. 2020, 10, 9956. [Google Scholar] [CrossRef]
  45. Hearne, J.W. Sensitivity analysis of parameter combinations. Appl. Math. Model. 1985, 9, 106–108. [Google Scholar] [CrossRef]
  46. Grossman, G.M.; Kreuger, A.B. Economic growth and the environment. Quart. J. Econ. 1994, 110, 353–378. [Google Scholar] [CrossRef]
  47. Stern, D.I.; Common, M.S.; Barbier, E.S. Economic growth and environment degradation: The environmental Kuznets curve and sustainable development. World Dev. 1996, 24, 1151–1160. [Google Scholar] [CrossRef]
  48. Liu, Y.B.; Li, R.D.; Song, X.F. Grey associative analysis of regional urbanization and eco- environment coupling in China. Acta Geogr. Sin. 2005, 60, 237–247. (In Chinese) [Google Scholar]
  49. Sun, T.; Sun, R.H.; Chen, L.D. Identification of key factors and mutual effects of urbanization and Ecoenvironment in the Beijing-Tianjin-Hebei urban agglomeration. Acta Ecol. Sin. 2018, 38, 4145–4154. (In Chinese) [Google Scholar]
  50. Feng, Y.X.; He, S.W.; Li, G.D. Interaction between urbanization and the eco-environment in the Pan-Third Pole region. Sci. Total Environ. 2021, 789, 148011. [Google Scholar] [CrossRef]
  51. Gu, C.L.; Guan, W.H.; Liu, H.L. Chinese urbanization 2050: SD modeling and process simulation. Sci. China (Earth Sci.) 2017, 60, 1067–1082. [Google Scholar] [CrossRef]
  52. Wang, S.J.; Fang, C.L.; Wang, Y. Spatiotemporal variations of energy-related CO2 emissions in China and its influencing factors: An empirical analysis based on provincial panel data. Renew. Sustain. Energy Rev. 2016, 55, 505–515. [Google Scholar] [CrossRef]
  53. Wang, S.J.; Fang, C.L.; Wang, Y.; Huang, Y.B.; Ma, H.T. Quantifying the relationship between urban development intensity and carbon dioxide emissions using a panel data analysis. Ecol. Indic. 2015, 49, 121–131. [Google Scholar] [CrossRef]
  54. Zhao, Y.B.; Wang, S.J. The Relationship between Urbanization, Economic Growth and Energy Consumption in China: An Econometric Perspective Analysis. Sustainability 2015, 7, 5609–5627. [Google Scholar] [CrossRef]
Figure 1. The study area.
Sustainability 16 03365 g001
Figure 2. Technical flow chart of the study.
Sustainability 16 03365 g002
Figure 3. System causal relationship diagram.
Sustainability 16 03365 g003
Figure 4. Structural flow chart of the SD model.
Sustainability 16 03365 g004
Figure 5. Comparative analysis of the simulation results of the variables under the four scenarios.
Sustainability 16 03365 g005
Figure 6. CD and CDD of urbanization and eco-environment in the four scenarios.
Sustainability 16 03365 g006
Figure 7. Symbiosis between urbanization and eco-environment in the four scenarios.
Sustainability 16 03365 g007
Figure 8. Correlation degree of influencing factors on the interaction between urbanization and eco-environment (U1, …, U10, respectively, represent urban built-up area per capita, per capita disposable income, urbanization rate, GDP per capita, proportion of fiscal revenue in GDP, total retail sales of consumer goods, number of beds in healthcare facilities per 10,000 persons, total fixed asset investment of the whole society, the proportion of the second and third industries in GDP, and natural population growth rate. E1, …, E13, respectively, represent total grain production per capita, industrial wastewater discharge per capita, forest coverage rate, total available water resources per capita, comprehensive utilization rate of industrial solid waste, sulfur dioxide discharge per capita, green space area per capita, harmless treatment rate of domestic garbage, urban domestic sewage treatment rate, cultivated land area per capita, green coverage rate in built-up areas, impervious surface, and industrial waste generation per capita).
Sustainability 16 03365 g008
Table 1. Part variables and equations of the model.
VariableUnitEquation Expression
GDPCNY 1 BillionINTEG (GDP growth, 22,424.5)
Output value of primary industryCNY 1 BillionINTEG (Primary industry GDP growth, 2255.61)
Output value of secondary industryCNY 1 BillionGDP-Primary industry GDP-Tertiary industry GDP
Output value of tertiary industryCNY 1 BillionEXP(0.493 + 0.475 × LN(tertiary industry practitioners) + 0.558013 × LN(Fixed assets investment intertiary industry))
Employed persons10,000 personsTotal population × the proportion of employed personnel
Tertiary industry practitioners10,000 personsEmployment ratio in the tertiary industry × practitioner
Proportion of fiscal revenue in GDP%Fiscal revenue/GDP × 100
GDP per capitaYuan/personsGDP/total population × 10,000
Per capita disposable incomeYuan/persons−66.0393 + 0.708021 × GDP per capita
Total population10,000 personsINTEG (Population growth-population decrease, 7447)
Urban population10,000 personsurbanization rate × total population/100
Urbanization rate%WITHLOOKUP (Time, ([(2000, 0)–(2035, 80)], (2019, 58.7753), (2030, 70), (2035, 74)))
Table 2. Classification criteria for the symbiosis mode.
Symbiosis Mode δ x y δ y x δ x y · δ y x Interpretation
Parasitic Symbiosis+<0Urbanization promotes eco-environment; eco-environment suppresses urbanization.
+<0Urbanization suppresses eco-environment; eco-environment promotes urbanization.
Partial Symbiosis0+0Urbanization promotes eco-environment; the impact of eco-environment on urbanization is offset.
+00Eco-environment promotes urbanization; the impact of urbanization on eco-environment is offset.
Asymmetric Mutualism+ > δ x y >0Urbanization has a stronger promoting effect on the eco-environment.
> δ y x +>0Eco-environment has a stronger promoting effect on urbanization.
Symmetric Mutualism+ = δ x y >0Urbanization and eco-environment promote each other in the same degree.
Note: + indicates positive value and − indicates negative value.
Table 3. Correlation degrees between urbanization and eco-environment.
Correlation DegreeGradeExplanation
0 < γ i j 0.35 Weak correlationIndicates a significant deviation between the urbanization level and the eco-environment factors or the eco-environment level and the urbanization factors, with a weak correlation effect.
0.35 < γ i j 0.65 Medium correlationIndicates a certain deviation between the urbanization level and the eco-environment factors or eco-environment level and the urbanization factors, with a medium correlation effect.
0.65 < γ i j 0.85 strong correlationIndicates a relatively close relationship between the urbanization level and the eco-environment factors or the eco-environment level and the urbanization factors, with a strong correlation effect.
0.85 < γ i j 1 extremely strong correlationIndicates an extremely close relationship between the urbanization level and the eco-environment factors or the eco-environment level and the urbanization factors, with an extremely strong correlation effect.
Table 4. Error rate of model simulation results.
VariableMean Error RateVariableMean Error Rate
Total population−0.219Output value of primary industry0.006
GDP0.001Output value of secondary industry−0.034
GDP per capita0.226Output value of tertiary industry0.138
Fiscal expenditure−0.005Environmental protection expenditure−0.003
Energy consumption0.838Carbon dioxide emissions0.761
Waste water emission−1.781Urban built-up area−0.394
Total grain output0.178Green coverage area in built-up areas−0.048
Table 5. Control variable settings for different scenarios.
ValueCurrent DevelopmentUrbanization PriorityEco-Environment PriorityFriendly Development
Control Variable
GDP growth rate20306%7%6%6.5%
20356%7.5%5.5%6%
Employment ratio in tertiary industry44%45.5%44.5%45%
Urbanization rate203070%70%70%70%
203572%74%71%73%
Birth rate12.34‰13‰12‰12.5‰
Proportion of environmental protection expenditure in GDP20302%2%3%2.5%
20352.5%2.5%3.5%3%
Change rate of surface water abstraction20302.4%3.1%2.3%2.6%
20352.8%4.5%2.6%4%
Table 6. Quantitative relationship between urbanization and eco-environment comprehensive evaluation levels based on different scenarios.
ScenarioRegression ModelAdjusted R2
Current developmentx = 0.457 − 4.794y + 15.205y2 − 11.156y30.989
y = 0.145 + 1.762x − 3.584x2 + 3.014x30.992
Urbanization priorityx = 0.166 − 1.661y + 5.140y2 − 1.532y30.998
y = 0.156 + 1.514x − 2.159x2 + 1.264x30.993
Eco-environment priorityx = 0.143 − 1.439y + 4.796y2 − 2.779y30.996
y = 0.141 + 2.161x − 3.878x2 + 3.303x30.996
Friendly developmentx = 0.213 − 2.197y + 7.098y2 − 4.158y30.995
y = 0.151 + 1.726x − 2.777x2 + 1.986x30.992
Note: x indicates the urbanization comprehensive evaluation level and y indicates the eco-environment comprehensive evaluation level.
Disclaimer/Publisher’s Note: The statements, opinions and data contained in all publications are solely those of the individual author(s) and contributor(s) and not of MDPI and/or the editor(s). MDPI and/or the editor(s) disclaim responsibility for any injury to people or property resulting from any ideas, methods, instructions or products referred to in the content.

