Abstract
Under the premise of jointly promoting global ecological and environmental governance, as an important promoter of economic globalization and the main communicator of low-carbon technology, how does FDI contribute to EUE? In addition, technology can affect ecological inequality exchange by affecting production methods and other aspects, so what role does the path of technological progress play in it? These questions are the focus of this paper. Ecological unequal exchange is calculated using the MRIO model, and this study further examines the influence of FDI on this exchange in the manufacturing sector via technological progress using the systematic GMM model. The study discovered the following: (1) The full sample study reveals that FDI inflows can significantly reduce the EUE of the manufacturing industry, but FDI exacerbates the EUE in the manufacturing industry by further worsening it through the pathway of technological progress (2) Further research finds that the effect of FDI on the EUE in the manufacturing sector through technological progress path will be different due to the source of FDI vary, the causes of ecological unequal exchange, the time period, and the development of a technological progress path.
1. Introduction
In light of the major issues facing global governance and the path forward for bettering it, the report to the 20th National Congress of the CPC emphasizes that, from the perspective of advancing global peace, development, and fostering a shared future for humanity, we should thoroughly understand the general trend of global governance reform and put forward several proposals on promoting the restructuring and advancement of the global governance system. In recent years, global governance has gradually expanded from traditional fields such as trade, investment, and finance to emerging fields such as climate, public health and digital economy (Yan and Li., 2023 [1]). Climate change stands as the major issues for global governance in the context of humanity, and since there is widespread agreement to take action to combat it, we should take an active role in it. Although climate change is an international ecological issue that human society must deal with, its detrimental effects on various populations are not dispersed randomly. Rather, they are strongly correlated with a region’s natural resource endowment, a nation’s socioeconomic development, and each person’s socioeconomic standing. Generally speaking, the environmental costs associated with a product are lower in advanced economies where technology is cleaner. Conversely, the slower technological development in less developed economies results in higher environmental costs. Ecological unequal exchange (henceforth referred to as EUE), is created during international trade when natural resources from less developed economies are used for the production and consumption of developed economies through specialized production and trade (Howell et al., 2013 [2]; Moran et al., 2013 [3]; Jorgenson, 2016 [4]; Ciplet and Roberts, 2017 [5]; Althouse et al., 2020 [6]). Furthermore, Zheng and Zhang, 2020 [7] observed the examination of the correlation between developed capitalist countries and developing countries has turned to EUE as an internal convergence point. This is due to the fact that EUE is a complementary and further development of world system theory in the field of ecological environment. The manufacturing sector is currently acknowledged as a “large” global carbon emitter. On the one hand, according to data from the World Economic Forum, the sector accounts for 54% of energy consumption and 20% of global carbon emissions (Sun, 2023 [8]). On the other hand, from a Chinese perspective, over 70% of the country’s carbon dioxide emissions originate from industrial production, or generative emissions. The industrial sector, particularly the manufacturing sector, has historically produced significant amounts of carbon emissions, making it the primary target for China’s endeavors to carbon emissions reduction and the means by which the country hopes to meet its “double carbon” goal. Therefore, China’s manufacturing industry’s EUE effect requires significant attention for both theoretical and practical purposes.
Foreign direct investment with transnational corporations acting as the carrier not only produces obvious spillover effects such as technology, management, knowledge, information, and marketing concepts, but also greatly benefits the ecological environment in the context of an open economy (Zhou, H., et al., 2022) [9], where it is a major driver of economic globalization and the primary distributor of low-carbon technologies. In particular, the ecologically unequal exchange between developed and developing economies has also had an important impact. Specifically, Jorgenson, 2010 [10] examined the ways in which the form of economic globalization enables developed economies to exploit less developed economies as suppliers to support their unsustainable resource consumption patterns, and proposed that the vertical movement of FDI and overseas sales prompted developed economies to externalize the environmental cost of consumption, thus leading to EUE. Jorgenson, 2012 [11] pointed out in his study that the introduction of FDI in developing economies would significantly increase greenhouse gas emissions, so he believed that FDI would lead to EUE among economies. The global ecological environment may suffer from unequal exchange as a result of the process of transferring natural resources from underdeveloped economies to more developed ones, including their ecological benefits and economic value via FDI and international trade, according to Frame, 2014 [12]. Jorgenson, 2016 [4] qualitatively analyzed the issue. Vertical export flow contributes to Ecological Unequal Exchange (EUE) between developed and developing economies, while FDI dependence in developing economies results in environmental burden shifting. However, Jorgenson suggests that the environmental load transfer caused by FDI in the service industry has been overlooked in existing studies, indicating that global EUE may not be inevitable.
It can be found that there is an important connection between FDI and EUE, and the influence of FDI on the ecological milieu extends beyond the direct interaction between developed and developing economies. The academic community has extensively studied the ecological effects of FDI, including the scale effect, configuration effect, and technology effect (Sheng and Lv, 2012 [13]; Gong et al., 2018 [14]; Liu and Guo, 2023 [15]). Among them, the technological effect is one of the impacts of FDI on the exchange of ecological inequality. In light of China’s actual situation, in the report of the 20th National Congress of the Communist Party of China, General Secretary Xi Jinping stressed the pressing need to step up the execution of the strategy for development driven by innovation and hasten the accomplishment of high-level scientific and technological self-reliance. This is in line with the reality that there is a large technological gap between China and developed countries due to insufficient basic research in China. In this context, China chooses the path of “technology introduction—digestion—absorption—imitation innovation—independent innovation” as a strategic choice for technological progress (Tang et al., 2014 [16]). Moreover, in accordance with existing investigations, Huang et al., 2018 [17] pointed out that the technological progress path can be delineated into technology introduction, technology imitation and technology innovation, and the path is divided into three specific paths. Keller, 2004 [18] believes that FDI can generate the diffusion of technology effect on host countries, and developing countries with relatively backward technology levels can rely on the advanced technology resources brought by FDI to rapidly improve product quality and rapidly change technology in a short time (Hausman et al., 2007 [19]). It can promote technological innovation (Wang et al., 2010 [20]; Yi et al., 2015 [21]); Some scholars believe that FDI will inhibit technological innovation in host countries (Haskel et al., 2007 [22]; Chen et al., 2018 [23]). It can be seen that scholars’ studies on FDI’s impact on technological innovation are abundant and controversial, and technology introduction and technology imitation are rarely taken into account.
2. Theoretical Mechanism
Technological progress paths are divided into technology introduction, technology imitation and technology innovation. This part will be expanded from these three paths as follows:
2.1. Mechanism of FDI and Technology Introduction Affecting Manufacturing EUE
FDI can impact the manufacturing EUE through the introduction of technology, leading to two effects: improvement and deterioration, specifically:
On the one hand, FDI can enhance manufacturing EUE by facilitating the introduction of advanced technologies. With the gradual establishment of China’s foreign investment supervision system, the quality of technology introduced by FDI has gradually improved compared with the past, and the technology spillover effect has been greatly exerted at this time. In the process of resource sharing within the manufacturing industry, technology will also flow and be applied among various departments and industries, which will optimize the manufacturing environment and improve the manufacturing EUE. Sheng and Lv, 2012 [13]. also showed that the positive technology spillover effect brought by FDI through technology introduction and diffusion would significantly reduce industrial pollution.
On the other hand, FDI will exacerbate manufacturing EUE by introducing new technologies. When the technology introduced by FDI flows within the manufacturing industry, vicious competition will occur. Technology introduction is an opportunity for innovation in the manufacturing industry. To seize market share, the manufacturing industry will “monopolize” the introduced technology, and manufacturing enterprises without technology will consume a lot of resources to bridge the gap between technologies in order not to be eliminated. This vicious competition will intensify manufacturing EUE.
However, in consideration of China’s prevailing conditions, China’s use of foreign technology spillover effect is still not obvious, the purpose of exchanging market for technology has not been fully realized, and the technical quality issue requires strategic long-term planning, causing a disconnect between technology introduction and innovation in China’s manufacturing sector, resulting in insufficient efficiency of the technology spillover effect of the use of foreign capital, and thus resulting in excessive dependence on the core technology of foreign enterprises. Such unreasonable investment attracting structures and policies seriously inhibit the diffusion of FDI environmental protection technologies (Xu and Deng, 2014 [24]), which will further worsen the manufacturing industry’s EUE. Based on this, Hypothesis 1 proposes that FDI will worsen the EUE through technology introduction in the technological progress path.
2.2. Mechanism of FDI and Technology Imitation Affect Manufacturing EUE
Through the process of technology imitation, FDI can significantly affect the manufacturing EUE, leading to two effects: improvement and deterioration, specifically:
To begin with, FDI can elevate manufacturing EUE by leveraging technology imitation. Foreign direct investment is conducive to improving the technological imitation rate, accelerating technological progress, and overcoming technological trade barriers (Shen and Yin, 2009 [25]). Technological imitation can realize technological innovation more directly, and foreign investors have shown high productivity in both production and management technology. The imitation and creation of technology brought by foreign direct investment is the competitive advantage of manufacturing industries. Enterprises in various industries will continuously optimize their industrial structure in the competition, reduce the profit margin, and invest capital in technology research and development. Technological innovation enhances the likelihood of green competition, thereby boosting manufacturing performance.
Next, FDI will exacerbate manufacturing EUE by allowing the imitation of technology. Technology imitation brought by foreign investors only stays at the level of simple imitation, which is inefficient for the technology application in the manufacturing industry and cannot improve the efficiency of technological innovation. Technology has a unique adaptability, if the technology cannot be localized, then the blind imitation of technology will only waste a lot of resources, but the deterioration of the manufacturing environment.
In consideration of China’s prevailing conditions, when FDI increases, the opportunity for technological imitation also increases. In the process of imitation and competition in the manufacturing industry one after another, the defects of technological imitation gradually appear. First, imitation will inhibit independent innovation and can only be passively studied on the original technology. Second, there are many restrictions, such as the blockade of technical information or the restriction of intellectual property rights, and it is difficult to carry out technical imitation, which cannot better serve the manufacturing EUE. Therefore, Hypothesis 2 proposes that FDI will worsen the EUE through technological imitation in the path of technological progress.
2.3. Mechanism of FDI and Technology Innovation Affecting Manufacturing EUE
The effect of FDI on manufacturing EUE is realized through technological innovation, leading to two effects: improvement and deterioration, specifically:
Initially, FDI will ultimately enhance manufacturing EUE by harnessing the power of technology innovation. The technology brought by FDI may come from developed countries or developing countries, both of which will drive technological innovation in China, and the technology of developed countries is mostly clean, through the introduction of clean technology, it is anticipated that China’s manufacturing industry can significantly reduce its environmental pollution.
Therefore, FDI will negatively influence the manufacturing EUE through technology innovation. In recent years, trade friction has been continuously disputing, and the trade barriers suffered by China’s technological innovation have increased. Due to the consideration of narrowing the technology gap, the technological advancement brought about by foreign direct investment is quite limited, and the manufacturing industry does not meet the needs of the green transformation in China, which therefore hinders the improvement of the industry’s environmental condition. In consideration of China’s prevailing conditions, although the technical level of China’s manufacturing industry has been significantly improved, there is still a significant gap with developed countries, especially in high-end equipment, core parts, advanced materials, cutting-edge instruments, industrial software and other equipment are heavily dependent on imports, and have to face the situation of being “stuck” in the background of anti-globalization, and technological innovation is difficult. Manufacturing EUE cannot be improved. Therefore, Hypothesis 3 proposes that FDI will worsen the EUE through technological innovation in the technological progress path.
3. Model Design and Data Description
This section offers a concise portrayal of the experimental findings, analysis, and the resultant implications.
3.1. Model Design
To investigate the effect of FDI on the interactive development of manufacturing EUE through the path of technological progress, this paper conducted empirical tests according to the theoretical review part. The measurement model is set as follows:
The influence of FDI on manufacturing EUE is represented in Formula (1) through technology introduction. The effect of FDI on manufacturing EUE is represented in Formula (2) through technology imitation. The effect of FDI on manufacturing EUE is represented in Formula (3) through technology innovation.
Among them, represents the ecological inequality exchange situation of manufacturing, embodies the flow of FDI in the industry i during the t period, TI represents technology introduction, II represents technology imitation, RD represents technology innovation, and represents the interplay between FDI and technology introduction. represents the interaction between FDI and technology imitation. represents the interaction between FDI and technology innovation.
Xit denotes a set of control variables, mainly including factors that may affect China’s industry level, namely output size (SCALE), per capita capital stock (KL), the structure of industry ownership (OS), energy structure (ES), and trade openness (TR). δ is the estimated coefficient, and ϵit represents the random disturbance term.
3.2. Industry Categorization and Data Depiction
3.2.1. Industry Categorization
To align the WIOD input-output table with the manufacturing sector, a regrouping and matching process was performed based on the NECI and CICS standards. The data from WIOD was rearranged into 12 sectors, as listed in Table 1, which also showcases the corresponding matching outcomes.

Table 1.
Breakdown of departmental consolidation.
3.2.2. Data Depiction
Taking into account the accessibility and dependability of data, the research in this paper is conducted using the WIOD dataset, which covers the period from 2000 to 2014.
(1) Measure of EUE. Based on the measurement methods proposed by Peng et al., 2015 [26], Cai, 2018 [27], Feng and Liu, 2019 [28], the level of EUE within the industry was calculated by dividing the production-side emissions by the consumption-side emissions. Therefore, the production-side emission and consumption-side emission should be calculated first.
The basic relationship of m different countries is as follows:
In this formula, taking China as an example, China’s total output vector is denoted by , which is a superposition of n xi’s. xi is an output vector representing a particular country i. is a matrix of production coefficients in China. is China’s final demand vector, which again superimposed by n yi’s, yi signifies the ultimate demand from individual countries.
China’s (Country i) production-side emissions can be conceptualized using the MRIO model as follows:
is the vector of carbon emission levels in region i. The matrix only considers the row vector corresponding to country 1’s emission intensity, while all other elements are set to 0. is the Leontief inverse matrix of the MRIO model.
is the total emission of the national i production side. In this paper, the production side emission is divided into “domestic demand emission” and “external demand emission”. Hence, the production-side emissions can be conceptually represented as follows:
In contrast to the production side, the consumption side emissions refer to the carbon emissions resulting from the final demand of country i in the rest of the world, encompasses “domestic emissions” and “foreign emissions”. This can be expressed as:
represents the total emissions on the consumption side of country i. Drawing from the previously derived Equations (6) and (7), to calculate the total emissions of the manufacturing sector, one must integrate the emissions produced from both production and consumption perspectives. Furthermore, using the ratio of the emissions from the production and consumption perspective of various economic sectors can produce a reliable indicator for accurately quantifying EUE. This indicator can be expressed as:
EUE in production can be evaluated by comparing emissions produced in response to external demand to those generated in response to domestic demand. In a similar manner, EUE in consumption can be calculated by comparing emissions from foreign sources to those produced domestically.
National Bureau of Statistics reports have revealed that China’s manufacturing value added as a percentage of the global market increased from about 28.34% in 2020 to around 30% by 2023. China has been the world’s largest manufacturing country for 14 years in a row. As the manufacturing power strategy continues to be thoroughly implemented, China’s manufacturing industry is expanding rapidly in scale and has become a substantial contributor to carbon emissions. Therefore, China’s manufacturing sector serves as the “main force” in reducing carbon emissions. This paper employs the EUE of carbon dioxide as a representative variable, which effectively mirrors the carbon emissions of the manufacturing industry in China during economic activities, encompassing both production and consumption facets, which provides a factual basis for the implementation of carbon reduction tasks in China and offers a sound policy orientation for promoting the green transformation of manufacturing industry in China. Co2 emissions data are from WIOD’s environmental account.
(2) FDI flow. In this paper, the approach recommended by Gong et al., 2019 [29]. is used as a reference, and data is served to measure the flow of foreign direct investment (FDI) in subdivided industries by taking the FDI and multiplying it by the fraction representing the share of exports in the industrial sales output value. Price data is deflated to accurately reflect the annual situation.
(3) Technical effect index. The technology import index (TI) takes technology import funds from manufacturing industries (Zhao and Cao, 2023 [30]); Technology imitation index (II) Access to technological transformation funds for manufacturing industries (Li, 2011 [31]); The Technology Innovation Index (RD) takes funding for the creation of new products of each manufacturing industry (Zhang et al., 2013 [32]). The funds for the development of new products in 2001 are missing and replaced with the funds for new products of each industry separately.
(4) Control variables. The per capita capital stock (KL) of the manufacturing industry is expressed by using the average annual balance of the net fixed assets of the manufacturing industry (Cai et al., 2023 [33]). Data from China Industrial Economic Statistical Yearbook. The manufacturing industry’s output scale (SCALE) is represented by the manufacturing added value per capita. The industrial ownership structure (OS) is determined by the percentage of state-owned holding enterprises’ manufacturing sales value that contributes to the total manufacturing sales value. Energy structure (ES), is measured as the fraction of industrial coal usage in relation to the total industrial energy consumption. The total value of imports and exports is divided by the sales value of the manufacturing industry to calculate trade openness (TR) (Zhang and Yang, 2017 [34]). The data comes from the COMTRADE database. Since both import and export data are measured in US dollars, while manufacturing sales data are reported in yuan, the RMB exchange rate is averaged annually to standardize the accounting units. The sample size of 180 is based on the 15-year time interval from 2000 to 2014 and the 12 industries matched in Table 1.
Table 2 lists the descriptive statistics:
Table 2.
Descriptive statistics N:180.
4. Analysis and Results
4.1. Full Sample Analysis
Based on the endogeneity problems that may occur in the empirical process, this paper uses the system GMM to assess the model and a regression comparison is carried out between the model with control variables added and the model without control variables added, as shown in the table. Columns (1)–(3) represent regression results without control variables, and the regression results with control variables are presented in columns (4)–(6). The discoveries are elaborated in Table 3.
Table 3.
Baseline regression.
First of all, EUE with a one-stage lag significantly promoted the increase of EUE and was significant at least 1% level of significance, industrial EUE represents a sustained, lifelong process of continuous improvement.
Secondly, the utilization efficiency of industry can be significantly decreased through FDI. According to studies, the utilization efficiency of industry, or EUE, decreases by 1.459–2.990% for every 1% increase in FDI. This discovery implies that FDI plays a key role in reducing EUE within the manufacturing industry, in other words, China’s manufacturing industry’s EUE has improved with the help of FDI.
Thirdly, considering the technological progress path, technology introduction, technology imitation and technology innovation all have inhibitory effects on manufacturing EUE, that is, technology introduction, technology imitation and technology innovation will improve manufacturing EUE. The reasons are as follows: First of all, technology introduction helps to reduce R&D costs and risks of enterprises (Zhang et al., 2022 [35]), so many technology introduction projects in the manufacturing industry can save raw materials, reduce the energy consumption of enterprises, and further improve the ecological environment of the manufacturing industry. Secondly, technological imitation is the foundation of technological innovation, and technological imitation is more likely to promote innovation efficiency and achieve environmental improvement faster. Finally, “innovation” is the key to getting out of the tracking and imitation stage and improving national strength (Zhang, 2019 [36]), and the application of new technologies will significantly accelerate the transition of the manufacturing industry towards sustainability, thereby enhancing the ecological balance of this sector. To sum up, technology introduction, technology imitation and technology innovation will improve the EUE of manufacturing.
Then, considering the path of technological progress in FDI, it can be observed that the interaction terms of FDI, technology introduction, technology imitation and technology innovation have a positive influence on reducing the EUE in the manufacturing industry, and All of the factors pass the significance test, indicating that FDI worsens the ecological unequal exchange of manufacturing industry through the path of technological progress. The reasons are as follows: First, in recent years, with the frequent occurrence of trade barriers, foreign investors have more strict control over core technologies, and the introduction of core technologies is more difficult, thus technology imitation and technological innovation cannot be fully carried out, the manufacturing industry is not enough to achieve green transformation development, and environmental pollution cannot be improved. Second, China’s market potential is large, with cheap labor, foreign investors in order to obtain our resources, low-technology, high-pollution manufacturing projects in China, rather than the transmission of real technology, which is contrary to the real purpose of foreign investment in China, to manufacturing environment is unfavorable. Hypotheses 1, 2, and 3 are valid.
Finally, when considering control variables, ① The increase of capital stock (KL) significantly improves the EUE of the manufacturing industry. Specifically, a 1% increase in lnKLit leads to a 0.309~0.483% increase in EUEit. The reason is that according to Rebzynski’s theorem, the increase in per capita capital stock means the increase of capital-intensive industries. As a result, the degree of environmental pollution deepens, discharge of industrial wastewater, SO2, and smoke and dust emissions from industries has risen, and the capital stock is positively correlated with the environmental pollution index (Liu and Guo. [15]). ② Output scale will increase the EUE. The majority of manufacturing industry’s highly polluting firms usually produce in the way of high input, high energy consumption and high emissions. Increasing the output scale will lead to an uptick in total carbon emissions. (Wang and Fan, 2024 [37]), which further worsens the ecological unequal exchange of manufacturing industry. ③ Industry ownership structure (OS) will significantly improve manufacturing EUE, lnOSit increased by 1 percentage point, EUEit increased by 0.316~1.223 percentage points, this trend arises due to the increased presence of state-owned capital in industries with higher ownership structures, a surge in manufacturing industry social production pressure can impede technological innovation. Zhou and Lin [38] proposed that with the increase of non-state-owned capital, the social burden of enterprises can be reduced to a certain extent, enabling enterprises to devote more resources to motivating employees and technological innovation, which will stimulate the innovative vitality of businesses and significantly elevate the regional innovation efficiency. ④ Energy structure (ES) will reduce the EUE, and the improvement of energy structure has two meanings: First, with regards to the structure of energy production, traditional energy production declines, and high-quality coal production capacity continues to be released; Second, in terms of energy consumption structure, the utilization of renewable energy sources is on the rise. Therefore, the improvement of energy structure will reduce the use of coal in the manufacturing industry, reduce the carbon emissions of the manufacturing sector, and then improve the EUE. ⑤ The level of trade openness (TR) will reduce the EUE, the improvement of TR will increase the entry of FDI, and FDI can drive the transformation and upgrading of the manufacturing industry through its technological spillover effect, attain eco-friendly advancement, and then improve the ecological inequality exchange of the manufacturing industry.
4.2. Heterogeneity Test
This paper further scrutinizes whether FDI has diverse impacts on EUE for different types of FDI sources and different kinds of EUE objects by examining the FDI sources, production side and consumption side of EUE, 2000–2007 and 2008–2014, TI, II and RD levels, respectively. FDI’s impact on EUE within manufacturing through technological progress is systematically analyzed.
4.2.1. The Estimation Results Are Divided into Vertical FDI and Horizontal FDI
In light of the varying nature of FDI sources and the motivations of investors, the United Nations Conference on Trade and Development (UNCTAD) in their 1998 World Investment Report distinguished between vertical (export-oriented) and horizontal (market-oriented) forms of FDI. Using the method outlined by Wei et al., this paper categorizes FDI from Asian countries as vertical FDI and designates it with the symbol vFDI. Horizontal FDI, designated as hFDI, pertains specifically to investment from European and American nations within this classification. The findings are expounded upon in Table 4.
Table 4.
Regression results by FDI.
Table 4 shows that the impact of FDI on the EUE of manufacturing and the technological progress path of FDI on the EUE of manufacturing are significantly different contingent upon the FDI source. The specific performance is as follows:
First, from the perspective of vertical FDI, that is, vertical foreign direct investment from Asia, both vertical FDI and technological progress improve the ecological unequal exchange of the manufacturing industry. Compared with European and American countries, it can conserve production expenses and resources, whilst simultaneously exhibiting a positive influence on the ecological environment of the manufacturing industry.
However, the positive interaction between vertical foreign direct investment and technological progress path is attributed to the following reasons: For example, foreign investment from developed countries in East Asia focuses more on labor-intensive manufacturing industries that can reduce production costs for investment, and the technology content is generally low (Zhang, 2010 [39]), which hinders the ability of China’s manufacturing firms to imitate and innovate. The spillover effect of clean production technology brought by vertical foreign direct investment is very small, so it is not obvious to improve the environmental quality in manufacturing industry of China.
Second, considering horizontal FDI, that is, horizontal foreign direct investment from Europe and the United States, the reason is that Europe and the United States are mostly developed countries, which are more inclined to transfer high-polluting factories and gain access to China’s market and cheap labor force than to share technology, so foreign direct investment and technological progress cannot improve the ecological environment of manufacturing.
However, the negative interaction between horizontal foreign direct investment and technological progress path is attributed to the reasons that nations in Europe and the US typically opt to establish R&D as well as sales centers within China, implementing standardized environmental regulations to attain economies of scale in cross-border management (Kogut, 1985 [40]; Hansen, 1999 [41]), competitive advantage or better response to the stricter environmental management requirements of developing countries in the future (Xian and Zhang, 2001 [42]). Therefore, European and American countries have strong environmental awareness and adopt environmental management systems representing advanced environmental management technologies, so the spillover effect of clean technology is better played. It significantly contributes to driving technological innovation of manufacturing industry in China, facilitating the manufacturing industry’s transition towards eco-friendliness, and then improving the manufacturing environment.
4.2.2. The Estimation Results of the Production-Side EUE and the Consumption-Side EUE
This paper explores the causes of EUE by considering the heterogeneity of the production and consumption sides. It takes an in-depth look at EUE from the dual perspectives of both the production and consumption sides. The production side EUE is determined by taking the external demand emissions and dividing them by the domestic demand emissions, while the consumption side EUE is determined by taking the overseas emissions and dividing them by the domestic emissions. Table 5 provides a detailed regression analysis result.
Table 5.
Sub-EUE regression results.
According to Table 5, the causes of EUE vary, and significant disparities exist in the effect of FDI on the EUE and the technological progress path of FDI on the EUE of manufacturing. The specific manifestations are as follows:
First, both foreign direct investment and technological progress worsen the EUE on the production side, since the inflow of foreign capital improves China’s economic level and further stimulates internal and external demand, which leads to growing demand for resources due to supply and negatively impacts the environment. The reason why the path of technological progress worsens the unequal exchange of manufacturing ecology is that the production process of high-tech products is not necessarily clean and green, but may also be high energy consumption and emissions (Qi and Zhang, 2017 [43]). Therefore, the technological progress path fails to effectively improve the ecology of the manufacturing industry.
There is a negative correlation between FDI and technological progress path is negative, that is, FDI improves the EUE on the production side through technological progress path. As FDI quality improves, its technology level becomes more sophisticated, thereby amplifying its potential to generate technological spillover. Technology introduction, technology imitation and technology innovation from foreign direct investment can be directly applied on the production side to further improve production efficiency and promote the green development of the manufacturing industry.
Second, both foreign direct investment and technological progress improve the EUE on the consumption side of manufacturing, since FDI can foster the upgrading of household consumption structure (Liu et al., 2023 [44]). The upgrading of the consumption structure means that residents’ environmental awareness is improved, the consumption rate of clean products is increased, and enterprises adjust according to the consumption structure. Adopting technological progress and capital accumulation to adapt to the change in consumption structure and advocating for the intensification of research and development into innovative, environmentally-friendly products to replace polluting products will reduce the negative effect of consumption on the ecological environment.
There exists a positive correlation between FDI and the path of technological advancement, that is, FDI worsens the EUE on the consumption side through technological progress path. The reason is that the technology brought by foreign direct investment will have a competitive effect. A lot of resources are consumed, and the domestic and foreign R&D methods are as follows: first, R&D investment will be carried out within the industry, and second, technology research and development will be carried out by building factories abroad through cooperation with foreign-funded enterprises. Therefore, the domestic and foreign manufacturing environment will be damaged, exacerbating the ecological imbalance of the consumption side of the manufacturing industry.
4.2.3. Divide Time Segments
With a view to delve into the heterogeneous impact of FDI on the EUE through technological progress path in different development stages. This study provides an in-depth analysis of the influence of FDI’s technological progress path on the EUE across different development stages by grouping the year 2008 as the boundary. Table 6 provides a detailed regression analysis result.
Table 6.
Heterogeneity at different stages of development.
According to Table 6, variances exist in the effect of FDI on the EUE and the technological progress path of FDI on the EUE with different time periods. The specific performance is as follows:
First, before 2008, both FDI and technological progress improved the EUE. This is due to the fact that China became a member of the WTO in 2001, the degree of trade openness has been improved, and WTO members have gradually removed traditional trade barriers such as quantitative restrictions and tariffs on Chinese exports. At this time, foreign direct investment has a very direct promotion role to our country’s economic development, especially the manufacturing industry in the initial stages of development, and the path for technological progress is limited by foreign countries, and has a very strong guiding significance for our country’s manufacturing technology progress, so it will improve the ecological inequality exchange of the manufacturing industry.
However, FDI positively interacts with the technological progress path, that is, FDI worsens the EUE on the consumption side through the technological progress path. The reason is that the betterment of trade promotes the economic growth of China’s manufacturing industry, and the manufacturing industry is in the early stage of development, and the supervision measures for the introduction of foreign capital in China are not yet perfect. The technological progress path brought by FDI is uneven, which leads to an ineffective screening of technologies brought by FDI, and the inflow of highly energy-consuming and pollution-intensive technologies into the manufacturing industry, which intensifies the ecological unequal exchange of manufacturing industry.
Secondly, after 2008, both foreign direct investment and technological progress path have worsened the EUE of the manufacturing industry. This is due to a number of factors. On the one hand, since the financial crisis, the global economy has been sluggish, the scale of FDI has been reduced, and the operating costs of enterprises have increased. In order to reduce operating costs, manufacturing enterprises will reduce environmental protection investment to maintain operations. On the other hand, trade protectionism is spreading rapidly around the world. At this time, to develop their economy, countries set restrictions on import and export, and transfer technology enterprises on the surface, but heavy polluting enterprises in essence, to other countries through foreign direct investment to realize their sustainable development. Therefore, it will have detrimental effects on the manufacturing environment of our country.
The interaction term between foreign direct investment and the technological progress path is negative. Specifically, FDI has the potential to enhance the EUE on the production side through the technological progress path. The reason is that based on the 2004 edition, the Foreign Investment Industry Guidance Catalog (Revised in December 2007) further expands the open fields, especially encouraging the development of energy efficiency and environmental preservation industries. This is consistent with the policy measures to restrict the production and export of “two high and one capital” products (that is, high energy costs, elevated pollution rates, and resource depletion). At the same time, it is necessary to actively promote balanced trade and coordinated development among regions and no longer include the item “limited to the central and western regions” in the catalog of industries that encourage foreign investment. At this time, the path of technological progress brought by foreign direct investment can be closely connected with China’s energy conservation and environmental protection industry and can improve the manufacturing environment.
4.2.4. Heterogeneity in the Choice of Technological Progress Path
Considering the fact that the heterogeneity of technological progress path selection, this study divides the 12 manufacturing industries over the years into those with high degrees of technology introduction (TI) (Industries with high degree of technology introduction: H4, H7, H8, H10, H11, H12), and those with low degrees of technology introduction (TI) (Industries with low degree of technology introduction: H1, H2, H3, H5, H6, H9), those with high degrees of technology imitation (II) (Industries with high degree of technology imitation: H1, H4, H7, H8, H10, H11), those with low degrees of technology imitation (II) (Industries with low degree of technology imitation: H2, H3, H5, H6, H9, H12), those with high degrees of technology innovation (RD) (Industries with high degree of technology innovation: H4, H7, H8, H10, H11, H12); and those with low degrees of technology innovation (RD) (Industries with low degree of technology innovation: H1, H2, H3, H5, H6, H9). Table 7 provides a detailed regression analysis result.
Table 7.
The regression results of technology path selection.
From Table 7, according to the development of the technological progress path, there exist notable disparities in the effect of FDI on the EUE and the impact of the technological progress path of FDI on manufacturing industry’s EUE. The specific performance is as follows:
First, the EUE will be enhanced through FDI of manufacturing industries with a high degree of technology introduction, low degree of technology introduction, high degree of technology imitation and low degree of technology imitation. The reason is that technology innovation involves a series of stages, with technology introduction and imitation as its basic foundation and technology R&D needs capital support. In addition, the inflow of FDI will promote the international exchange of technology and management methods, have the effect of catalyzing economic expansion within the host country and promote the industrial structure adjustment and upgrading effect and technology transfer and diffusion effect of the manufacturing industry in the stage of technology introduction and imitation, to improve the ecological unequal exchange between industries.
The interaction term of foreign direct investment with technology import and technology imitation is positive, that is to say, foreign direct investment will exchange through the manufacturing ecology inequality worsened by technology import and technology imitation. The reason is that the manufacturing industry with a high degree of technology introduction and technology imitation has a higher demand for technological innovation, so it has more investment in technology R&D. As R&D investment intensifies, the allocation of R&D funds will be biased toward production technology, resulting in the unreasonable allocation of funds for pollution control technology (Zhao and Chu, 2020 [45]), and the pollution of the manufacturing industry will be aggravated. However, the manufacturing industry with a low degree of technology introduction and technology imitation has a small demand for technological innovation and relies more on traditional production methods, so it has a greater= degree of environmental pollution.
Second, FDI will worsen the EUE manufacturing industries with the both (high and low) levels of technological innovation. The reason is that the manufacturing industry with a high degree of technological innovation is at the “leading” of the industry and will draw a substantial amount of foreign capital. In the absence of effective quality control measures for foreign capital, the large influx of foreign capital will bring about balance of payments risks and wrong resource allocation, thus deteriorating the manufacturing industry’s production environment. From the perspective of the manufacturing industry with low technological innovation, the influx of foreign capital may not be conducive to the technological innovation of the manufacturing industry. Jiang and Xia, 2005 [46] analyzed the competition created by FDI negatively impacts the growth of domestic companies’ innovation capabilities. Therefore, the manufacturing industry with low technological innovation does not have a competitive advantage. In order to make profits, it will use its original production mode more vigorously, hoping to make up for its technical defects by increasing the production speed, so it will further deteriorate the manufacturing environment.
The interaction term between foreign direct investment and technological innovation is negative, that is, foreign direct investment improves the EUE on the production side of manufacturing industries with high and low degrees of technological innovation via the technological progress path. The reasons are as follows: on the one hand, industries with a high degree of technological innovation are generally high-tech industries, and foreign direct investment will upgrade high-tech industries through technological innovation, make them cleaner and greener, and further improve the ecological inequality exchange of manufacturing industries. On the other hand, technological innovation brought by foreign direct investment will cause a demonstration effect among manufacturing industries. Manufacturing industries with low technological innovation will form connections with local enterprises related to the upstream and downstream. Through technology demonstration, cooperation, exchange and learning for cooperative enterprises, innovation efficiency can be further improved, which is also beneficial to their environment.
4.3. Robustness Tests
4.3.1. Replacing Core Variables
To ascertain the veracity and reliability of the aforementioned research findings, the robustness test was conducted based on the original hypothesis and the original model, and the foreign direct investment flow was further selected to replace the per capita foreign direct investment flow, and the original model was brought back for testing. It can be found from Table 8 that although the magnitude and statistical significance of the regression coefficient have experienced minor alterations, the conclusions are consistent with the previous ones.
Table 8.
Robustness test of replacement variables.
4.3.2. Reduce the Sample Size
In order to confirm the validity and credibility of the aforementioned research findings, this section excludes the manufacturing of food, beverage and tobacco products and machinery and equipment (general and special equipment), which are two manufacturing industries with low FDI input, from the 12 manufacturing industries, and reduces the sample to 10 industries, so as to investigate whether the effect of FDI on the EUE through the path of technological progress is robust. The results presented in Table 9, show that the regression coefficients of FDI are all negatively significant, and the interplay terms between FDI and technological progress path all demonstrate positive attributes. The above results are consistent with the conclusions in this research paper.
Table 9.
Robustness test of reduced sample size.
5. Conclusions and Discussion
5.1. Conclusions
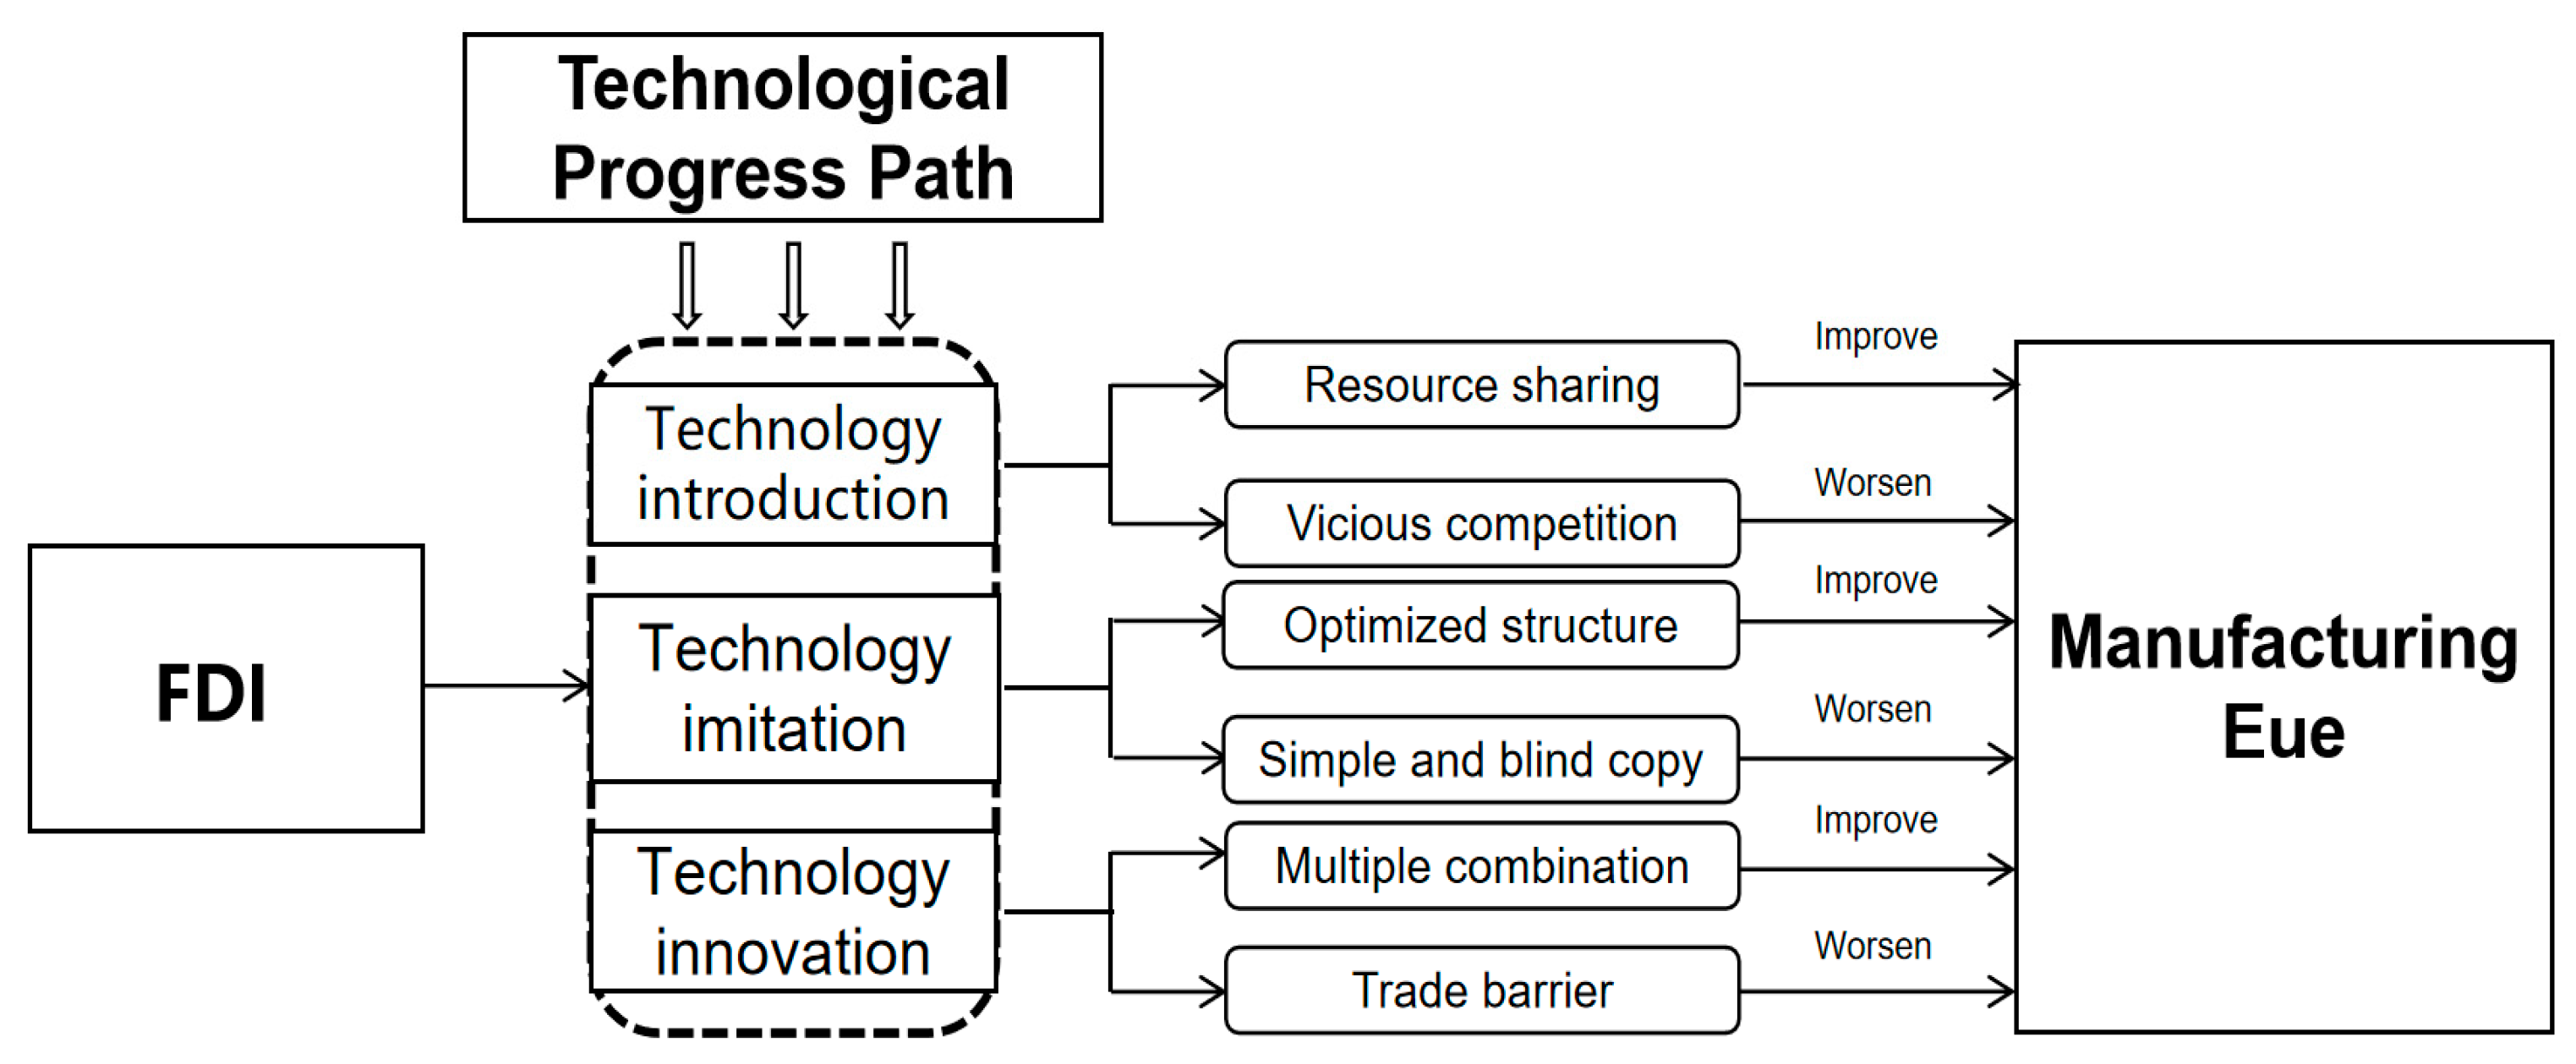
This paper concentrates on the assessment of the environmental effects faced by the manufacturing industry in international trade, and adds the perspective of technological progress, so as to discuss the mechanism of action on environmental benefits. Thisdetailed mechanism is depicted in Figure 1. The panel data from 2000 to 2014 of China’s manufacturing industry was used for the study, which evaluated FDI’s influence on manufacturing EUE via the path of technological progress. This paper scrutinized the impact of FDI on pEUE and cEUE, as well as its influence on hFDI and vFDI on manufacturing EUE through heterogeneity analysis. The empirical outcomes are outlined below: ① The research of the whole sample shows that FDI inflow has a significantly reduced effect on manufacturing EUE, but FDI worsens EUE in the manufacturing industry through the technological progress path. ② In terms of FDI’s origin, both vFDI and technological progress path improve manufacturing EUE, but vFDI worsens manufacturing EUE through technological progress path. Both hFDI and the technological progress path worsen the ecological unequal exchange of manufacturing, but hFDI improves the EUE of manufacturing through the technological progress path. ③ From the perspective of the causes of EUE, both FDI and technological progress path worsen manufacturing pEUE, but FDI improves manufacturing pEUE through technological progress path. Both FDI and technological progress path improve manufacturing cEUE, but FDI worsens manufacturing cEUE through technological progress path. ④ From the perspective of time period, before 2008, FDI and technological progress path both improved the EUE of manufacturing industry, but FDI worsened the EUE of manufacturing industry through technological progress path. After 2008, both FDI and technological progress path worsen the EUE of manufacturing industry, but FDI enhances the EUE of manufacturing industry through the technological progress path. ⑤ Considering the different degrees of technological progress path development, through the path of technological progress, FDI will have an aggravating effect on the manufacturing industries with a high degree of technology import and a high degree of technology imitation. In addition, FDI will worsen the EUE of manufacturing industries with high and low levels of technological innovation, but FDI improves the EUE of manufacturing industries with high and low levels of technological innovation through the path of technological progress. In this regard, this paper proposes the following policy recommendations.
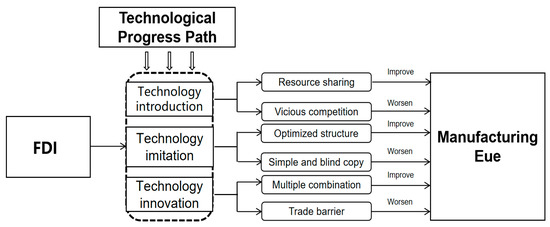
Figure 1.
The influence mechanism: FDI on EUE of the manufacturing industry in China through the technological progress path.
First, from the national level, it is a top priority that researchers grasp the relationship between FDI and the path of technological progress. Some of the introduced technologies are relatively backward or even obsolete technologies in developed countries. Although such technologies may be relatively advanced under China’s technical reference system, they often have the characteristics of high energy consumption and high emissions. At this time, technology imitation often occupies a lot of resources, slows down the pace of China’s technological progress, and leads to low efficiency of technological innovation. Resources are wasted and the environment is destroyed.
Second, from the perspective of manufacturing industry, for different manufacturing industries, it is necessary to screen the applicability of technologies brought by different foreign direct investment. The technology base of different manufacturing industries is inconsistent with that of other Asian countries or European and American countries, and sometimes there is a large gap, so there will be certain difficulties in technology integration, poor compatibility, and the manufacturing industry’s emission reduction will not be more significantly played out.
Third, from the perspective of the general public, while attaching importance to the EUE from the production perspective, we should also consider the EUE from the consumption side. Since the emission reduction policies of most countries are based on the producer responsibility system, they do not pay enough attention to the consumption-side EUE, which leads to the increase of carbon emissions induced by the consumption side of the manufacturing industry. Prioritizing the stimulation of the masses’ primary responsibility is paramount, enhancing the awareness of saving of the whole people, building the consensus of the whole society, and forming a good pattern of all of those participating in carbon reduction.
5.2. Discussion
Previous studies have argued that the more developed countries can relocate the environmental responsibility and impact to the less developed regions or nations, so that the less developed countries face biodiversity loss and other environmental damage (Jorgenson, et al., 2011 [47]). According to the analysis results of this paper, there are unequal carbon emissions between advanced nations and evolving nations, indicating that there is indeed an unequal ecological exchange relationship between developed countries and developing countries. The novelty of this paper lies in the following areas compared with existing studies. First, starting from FDI, it connects environmental pollution with ecological inequality exchange to supplement the research on ecological inequality exchange. Second, starting from the aspect of technological progress path, the technological progress path is decomposed into three paths. By studying the role of the three paths in the effect mechanism of FDI on manufacturing EUE, we not only get familiar with the respective importance of the three paths, but also provide valuable research backing for the modernization and improvement, sustainable and green development of manufacturing industry in China. Third, the landing point was set at EUE, this paper not only studies the impact of different FDI technological progress paths on EUE, but also studies the impact of FDI technological progress paths on different EUE, and comprehensively and systematically analyzes the specific reasons for improving or worsening EUE, and these studies will play pivotal parts in the healthy development of the manufacturing industry and the adjustment of manufacturing FDI development structure.
5.3. Research Limitations
The limitation of this paper lies in the problem of data availability. The WIOD database is updated every five years, so the data used in this paper is the most comprehensive at present. Time intervals and data acquisition may lead to some time delay in this paper.
5.4. Suggestions for Further Research
First and foremost, further research could consider expanding the role of technological progress paths between capital and industry firms. Then, further studies can examine the development of ecological unequal exchange in foreign trade in different periods.
Author Contributions
Conceptualization, M.G. and W.Z.; Methodology, M.G.; Validation, M.G. and W.Z.; Formal analysis, M.G.; Investigation, M.G. and W.Z.; Resources, M.G.; Data curation, W.Z.; Writing—original draft preparation, M.G. and W.Z.; Writing—review and editing, M.G. and W.Z.; Visualization, M.G.; Supervision, M.G.; Project administration, M.G.; Funding acquisition, M.G. All authors have read and agreed to the published version of the manuscript.
Funding
This research was funded by the National Natural Science Foundation (72104189).
Institutional Review Board Statement
Not applicable.
Informed Consent Statement
Not applicable.
Data Availability Statement
The data presented in this study are available on request from the corresponding author.
Conflicts of Interest
The authors declare no conflicts of interest.
References
- Yan, Y.; Li, X. The Evolution and Influencing Factors of Investment Carbon Transfer of Multinational Enterprises: Based on Social Network Analysis. Int. Econ. Trade Explor. 2023, 39, 83–98. [Google Scholar] [CrossRef]
- Howell, F.M.; Porter, J.R.; Wynveen, B.J. “Unpacking” the Domestic Ecological Footprint of the United States. Sociol. Spectr. 2013, 33, 197–218. [Google Scholar] [CrossRef]
- Moran, D.D.; Lenzen, M.; Kanemoto, K.; Geschke, A. Does ecologically unequal exchange occur? Ecol. Econ. 2013, 89, 177–186. [Google Scholar] [CrossRef]
- Jorgenson, A.K. The sociology of ecologically unequal exchange, foreign investment dependence and environmental load displacement: Summary of the literature and implications for sustainability. J. Political Ecol. 2016, 23, 334–349. [Google Scholar] [CrossRef]
- Ciplet, D.; Roberts, J.T. Splintering South:Ecologically Unequal Exchange Theory in a Fragmented Global Climate. J. World-Syst. Res. 2017, 23, 372–398. [Google Scholar] [CrossRef]
- Althouse, J.; Guarini, G.; Porcile, J.G. Ecological macroeconomics in the open economy: Sustainability, unequal exchange and policy coordination in a center-periphery model. Ecol. Econ. 2020, 172, 106628. [Google Scholar] [CrossRef]
- Zheng, J.; Zhang, Z. The Political Economic Turn of the Theory of Western Ecological Imperialism and Its New Development. Econ. Rev. J. 2020, 36, 12–20. [Google Scholar] [CrossRef]
- Sun, X. Anchoring “Advanced Manufacturing” and Consolidating the Foundation of a “Strong City”. Qingdao Dly. 2023. [Google Scholar] [CrossRef]
- Zhou, H.; Xu, G. Research on the impact of green finance on China’s regional ecological development based on system GMM model. Resour. Policy 2022, 75, 102454. [Google Scholar] [CrossRef]
- Jorgenson, A.K. World-economic integration, supply depots, and environmental degradation: A study of ecologically unequal exchange, foreign investment dependence, and deforestation in less developed countries. Crit. Sociol. 2010, 36, 453–477. [Google Scholar] [CrossRef]
- Jorgenson, A.K. The sociology of ecologically unequal exchange and carbon dioxide emissions, 1960–2005. Soc. Sci. Res. 2012, 41, 242–252. [Google Scholar] [CrossRef] [PubMed]
- Frame, M. Foreign Investment in African Resources: The Ecological Aspect to Imperialism and Unequal Exchange; University of Denver: Denver, CO, USA, 2014. [Google Scholar]
- Sheng, B.; Lv, Y. The impact of foreign direct investment on China’s environment: An empirical study from industrial sector panel data. China Soc. Sci. 2012, 33, 54–75+205–206. [Google Scholar]
- Gong, M.; Liu, H. Study on the environmental effects of two-way FDI in China’s industrial sector. China Popul. Resour. Environ. 2018, 28, 128–138. [Google Scholar]
- Liu, Q.; Guo, T. Research on the Environmental Impact of FDI under the “Dual Carbon” Background—Empirical Analysis Based on China’s Yangtze River Economic Belt. Dongyue Forum 2023, 44, 33–43+191. [Google Scholar]
- Tang, W.; Fu, Y.; Wang, Z. Technology Innovation, Technology Introduction and Transformation of Economic Growth Pattern. Econ. Res 2014, 49, 31–43. [Google Scholar]
- Huang, L.; Liu, D.; Xie, H. Research on the Harmonious Development of Outward Foreign Direct Investment and Inward Foreign Direct Investment. China Ind. Econ. 2018, 35, 80–97. [Google Scholar] [CrossRef]
- Keller, W. International technology diffusion. J. Econ. Lit. 2004, 42, 752–782. [Google Scholar] [CrossRef]
- Hausmann, R.; Hwang, J.; Rodrik, D. What you export matters. J. Econ. Growth 2007, 12, 1–25. [Google Scholar] [CrossRef]
- Wang, R.; Yan, B.; Deng, W. The Impact of FDI on the Independent Innovation Capability of Chinese Indigenous Industries—From the Perspective of Industrial Linkages. China Ind. Econ. 2010, 27, 16–25. [Google Scholar] [CrossRef]
- Yi, C.; Li, S.; Zhang, J. Institutional Environment, Absorptive Capacity and Reverse Technological Spillovers of OFDI in Emerging Economies: A Threshold Test Based on Interprovincial Panel Data in China. Econ. Res. J. 2015, 41, 4–19. [Google Scholar] [CrossRef]
- Haskel, J.E.; Pereira, S.C.; Slaughter, M.J. Does inward foreign direct investment boost the productivity of domestic firms? Rev. Econ. Stat. 2007, 89, 482–496. [Google Scholar] [CrossRef]
- Chen, W.; Wei, N.; Hou, J.; Feng, Z. Empirical Study on the “Threshold Effect” in the Relationship between FDI and Regional Innovation Capability. Soft Sci. 2018, 32, 30–33+38. [Google Scholar] [CrossRef]
- Xu, H.; Deng, Y. Empirical Study on Foreign Direct Investment and Resource-Environmental Performance. J. Quant. Tech. Econ. 2014, 31, 3–21+41. [Google Scholar] [CrossRef]
- Shen, P.; Yin, X. Technological Progress and Removing of Technical Barriers to Trade: A Theoretical Analysis Based on Imitation. Contemp. Financ. Econ. 2009, 30, 96–101. [Google Scholar]
- Peng, S.; Zhang, W.; Sun, C. Research on carbon emission measurement and influencing factors of production side and consumption side in China. Econ. Res. 2015, 50, 168–182. [Google Scholar]
- Cai, H. Estimation and Influencing Factors of China’s Regional Carbon Emissions—Based on Production-side and Consumption-side Accounting Methods; Beijing University of Technology: Beijing, China, 2018. [Google Scholar] [CrossRef]
- Feng, Z.; Liu, F. Ecological Unequal Exchange, Value Transfer and Environmental Problems in Developing Economies. J. World Econ. 2019, 42, 3–28. [Google Scholar] [CrossRef]
- Gong, M.; Liu, H.; Jiang, X. How two-way FDI in China’s industrial sector affects total factor emission reduction efficiency. Ind. Econ. Res. 2019, 18, 114–126. [Google Scholar] [CrossRef]
- Zhao, T.; Cao, S. The Influence of the Belt and Road Initiative on the Innovation Efficiency of Chinese Enterprises. Intertrade 2023, 42, 61–71. [Google Scholar] [CrossRef]
- Li, Z. The Effect of the International Trade Benefit of Technology Imitation Transformation and Innovation. J. Quant. Technol. Econ. 2011, 28, 18–33. [Google Scholar] [CrossRef]
- Zhang, S.; Zhang, C.; Meng, Q. Comprehensive Evaluation of Regional Technological Innovation Capability in China Based on Principal Component Analysis. Econ. Her. 2013, 90–91. [Google Scholar]
- Cai, L.; Guo, Z.; Zhang, J. Research on Green Total Factor Productivity of Coal Industry in China. J. China Univ. Min. Technol. 2023, 25, 161–180. [Google Scholar] [CrossRef]
- Zhang, J.; Yan, H. Market Demand and the Inflow of FDI in China’s Industries. J. Ind. Technol. Econ. 2017, 36, 23–33. [Google Scholar]
- Zhang, S.; Jin, R.; Liu, A. Can Tax Incentives for Technology Introduction Promote Independent Innovation of Enterprises? J. Financ. Econ. 2022, 48, 124–138. [Google Scholar] [CrossRef]
- Zhang, B. Chinese Technology: From Invention to Imitation, and Further to Innovation. Bull. Chin. Acad. Sci. 2019, 34, 22–31. [Google Scholar] [CrossRef]
- Wang, S.; Fan, W. Financial Accessibility and Carbon Emissions: Macro and Micro Evidence from Financial Geographical Structure. J. Quant. Tech. Econ. 2024, 41, 67–89. [Google Scholar] [CrossRef]
- Zhou, G.; Lin, Y. Digital Economy, Institutional Environment, and Regional Innovation Efficiency. Mod. Econ. Res. 2023, 42, 1–16. [Google Scholar] [CrossRef]
- Zhang, J. Post-crisis New Opportunities and Perspectives for Japanese Investment to China. Contemp. Econ. Jpn. 2010, 29, 38–44. [Google Scholar]
- Kogut, B. Designing Global Stratrgies: Profiting from Operational Flexibility. Sloan Manag. Rev. 1985, 27, 27–38. [Google Scholar]
- Hansen, M.W. Cross Border Environmental Management in Transnational Corporations: An Analytical Framework; Copenhagen Business School: Copenhagen, Denmark, 1999; ISBN 9781137277190. [Google Scholar]
- Xian, G.; Zhang, C. Environmental Management of European TNCs: Practices & the Impact in China. Nankai Bus. Rev. 2001, 10, 50–55. [Google Scholar]
- Qi, S.; Zhang, Z. Economic Growth and Trade Embodied Carbon Emission: A Perspective from Production-based and Consumption-based Emission. J. Environ. Econ. 2017, 2, 1–17+35. [Google Scholar] [CrossRef]
- Liu, G.; Zhong, J.; Xin, T. Impact of the Digital Economy on Upgrading Consumer Consumption—Analysis Based on Spatial Econometric Model. J. Commer. Econ. 2023, 42, 50–53. [Google Scholar]
- Zhao, H.; Chu, W. Influence of Industrial Agglomeration and R & D Investment on Environmental Pollution. J. Beijing Univ. Posts Telecommun. 2020, 22, 79–89. [Google Scholar] [CrossRef]
- Jiang, D.; Xin, L. The Empirical Study of the Function of FDI on Innovation in China’s High-Tech Industries. J. World Econ. 2005, 28, 5–12+82. [Google Scholar]
- Jorgenson, A.K.; Dick, C.; Shandra, J.M. World economy, world society, and environmental harms in less-developed countries. Sociol. Inq. 2011, 81, 53–87. [Google Scholar] [CrossRef]
Disclaimer/Publisher’s Note: The statements, opinions and data contained in all publications are solely those of the individual author(s) and contributor(s) and not of MDPI and/or the editor(s). MDPI and/or the editor(s) disclaim responsibility for any injury to people or property resulting from any ideas, methods, instructions or products referred to in the content. |
© 2024 by the authors. Licensee MDPI, Basel, Switzerland. This article is an open access article distributed under the terms and conditions of the Creative Commons Attribution (CC BY) license (https://creativecommons.org/licenses/by/4.0/).