1. Introduction
With the acceleration of urbanization, cities are continuously expanding and undergoing significant transformations, leading to changes in people’s lifestyles. Commercial blocks are typically the component of urban space with the greatest vitality. They have diversified functional commercial forms and superior geographical locations, so they can attract a large crowd of pedestrians, thereby promoting the development of a city’s consumer economy. However, commercial blocks are affected by some external factors, such as aged urban infrastructure, urban traffic congestion and emerging commercial complexes in recent years. Moreover, it becomes more and more difficult for those commercial blocks in old towns to meet the diversified life needs of urban residents. Both the spatial quality and vitality of commercial blocks show a downward trend. As a consequence of the above factors, the development of commercial blocks is trapped in a vicious circle [
1].
With the rapid progress in digital technology and data intelligence, research on the spatial vitality of commercial street areas can benefit from the analysis of multi-source data such as population demographics, transportation patterns, climate conditions and consumer behaviors. By delving into the spatial characteristics, pedestrian dynamics, commercial potential and other aspects of commercial street areas, a more systematic and comprehensive assessment of their spatial vitality can be achieved. This, in turn, can provide a scientific basis for future urban planning and management decisions regarding commercial street areas [
2].
Early studies on the spatial vitality of commercial blocks have primarily relied on on-site surveys and subjective analyses. These studies often involved pedestrian counts at specific intersections over a defined period to assess street space vitality. However, this traditional research approach had its limitations, being time-consuming and prone to data biases influenced by human factors. With the rise of urban renewal concepts emphasizing a “people-oriented” approach and “inventory renewal”, there is an urgent need to incorporate modern research methods into the examination of commercial block spatial vitality [
3]. Many scholars have explored the utilization of mobile phone signaling data, location-based services (LBSs), heat maps and other resources to analyze urban spatial vitality. This shift has changed the research focus from a purely qualitative perspective to a combined qualitative and quantitative approach. This evolution in research methodology has transitioned from analyzing single-source data to the application of multi-source data when studying urban street area vitality [
4].
In order to construct the spatial vitality evaluation system of commercial blocks, this article takes Huaihe Road Commercial Block of Hefei city as an empirical research object and collects spatial data of the commercial block from multiple sources. Based on field surveys and the use of different tools, such as the ArcGIS10.8 platform, space syntax Depthmap modeling and street view semantic analysis, we selected the heat map data in different periods of time as the external characteristic elements and road network configuration, functional commercial form, spatial quality and other established environments as the internal constituent elements of spatial vitality for commercial blocks and then presented different influencing factor indicators, such as integration, functional mixture and green view index (GVI). Then, we conducted a quantitative analysis on the spatial vitality of Huaihe Road Commercial Block and its influencing factors and studied the correlation of its spatial vitality with the influencing factors, hoping to provide a scientific basis for the revitalization of commercial blocks situated in old towns.
2. Research Scopes and Definitions
2.1. Overview of the Research Object
Current research on the correlation between the established environment and behavior of commercial space always prefers those fully developed commercial districts with a stable spatial vitality to eliminate the randomness and instability caused by the difference in data sampling time. Therefore, the selection of research objects follows these principles: a research object must be typical in terms of geographical location, scale and year of completion in its city; there is an active population with stable mobility to facilitate the acquisition of external data characterizing spatial vitality; the research area has been fully developed, and all functional commercial forms tend to be stable in the area. Based on the above principles, field surveys and comments of relevant experts, Huaihe Road Commercial Block, a typical modern commercial block of Hefei city, was selected as the research object of this article.
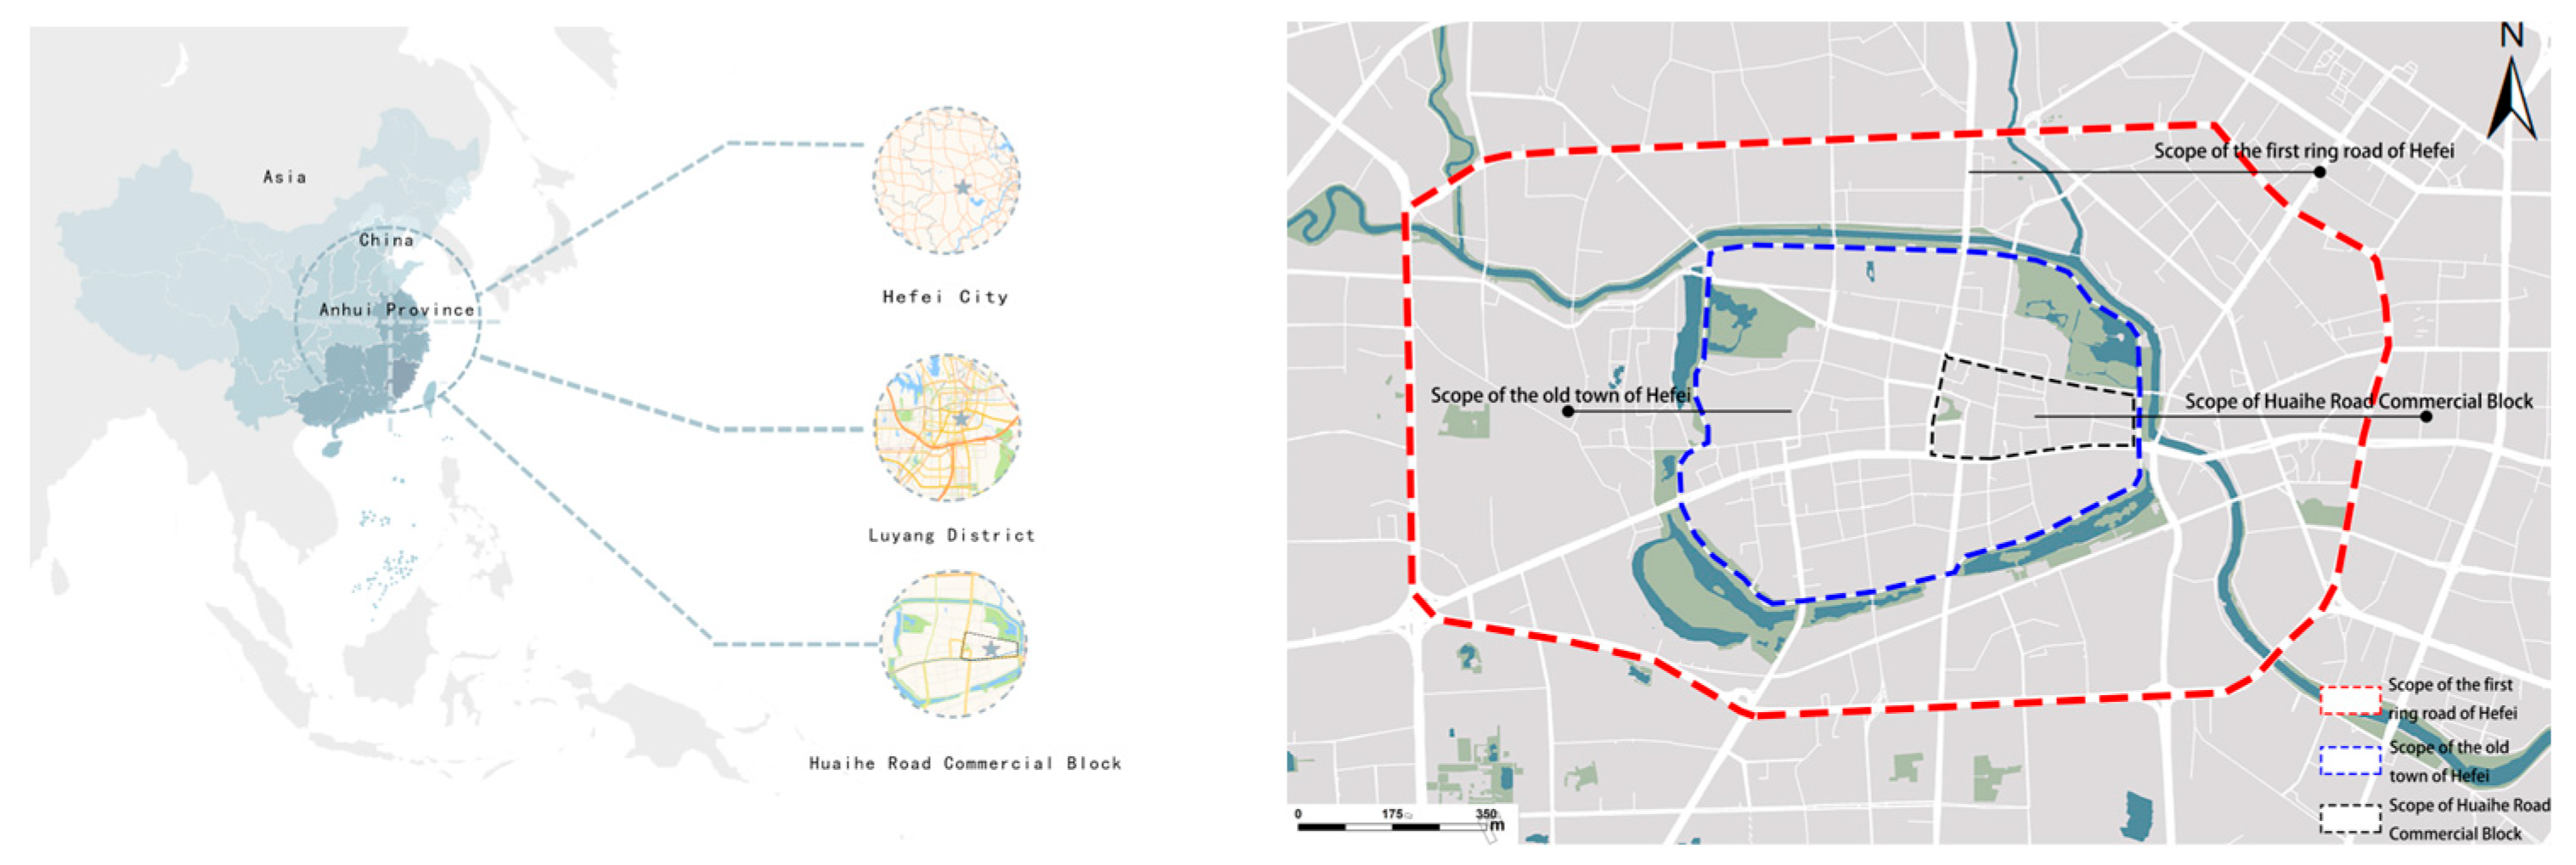
As shown in
Figure 1, Huaihe Road Commercial Block is located in the east of the old town of Hefei city, covering a total area of 59.63 hm
2. As the core area of Huaihe Road Commercial Block, Huaihe Commercial Pedestrian Street is 960 m long and 22 m wide. It extends to East Huancheng Road in the east and to Suzhou Road in the west. Huaihe Commercial Pedestrian Street is characterized by modern architectural styles. Traditional architectural styles of Jianghuai Region have been integrated into its detail design. Its various spatial layouts and numerous cultural tourism sites are always attracting local residents and tourists from other places [
5]. Known as a typical commercial block in an old town, Huaihe Road Commercial Block has stable pedestrian flow. However, there is a difference in the vitality of pedestrians in a certain node space of commercial blocks. For this reason, this article further studies and analyzes the factors influencing the spatial vitality of Huaihe Road Commercial Block.
2.2. Definitions
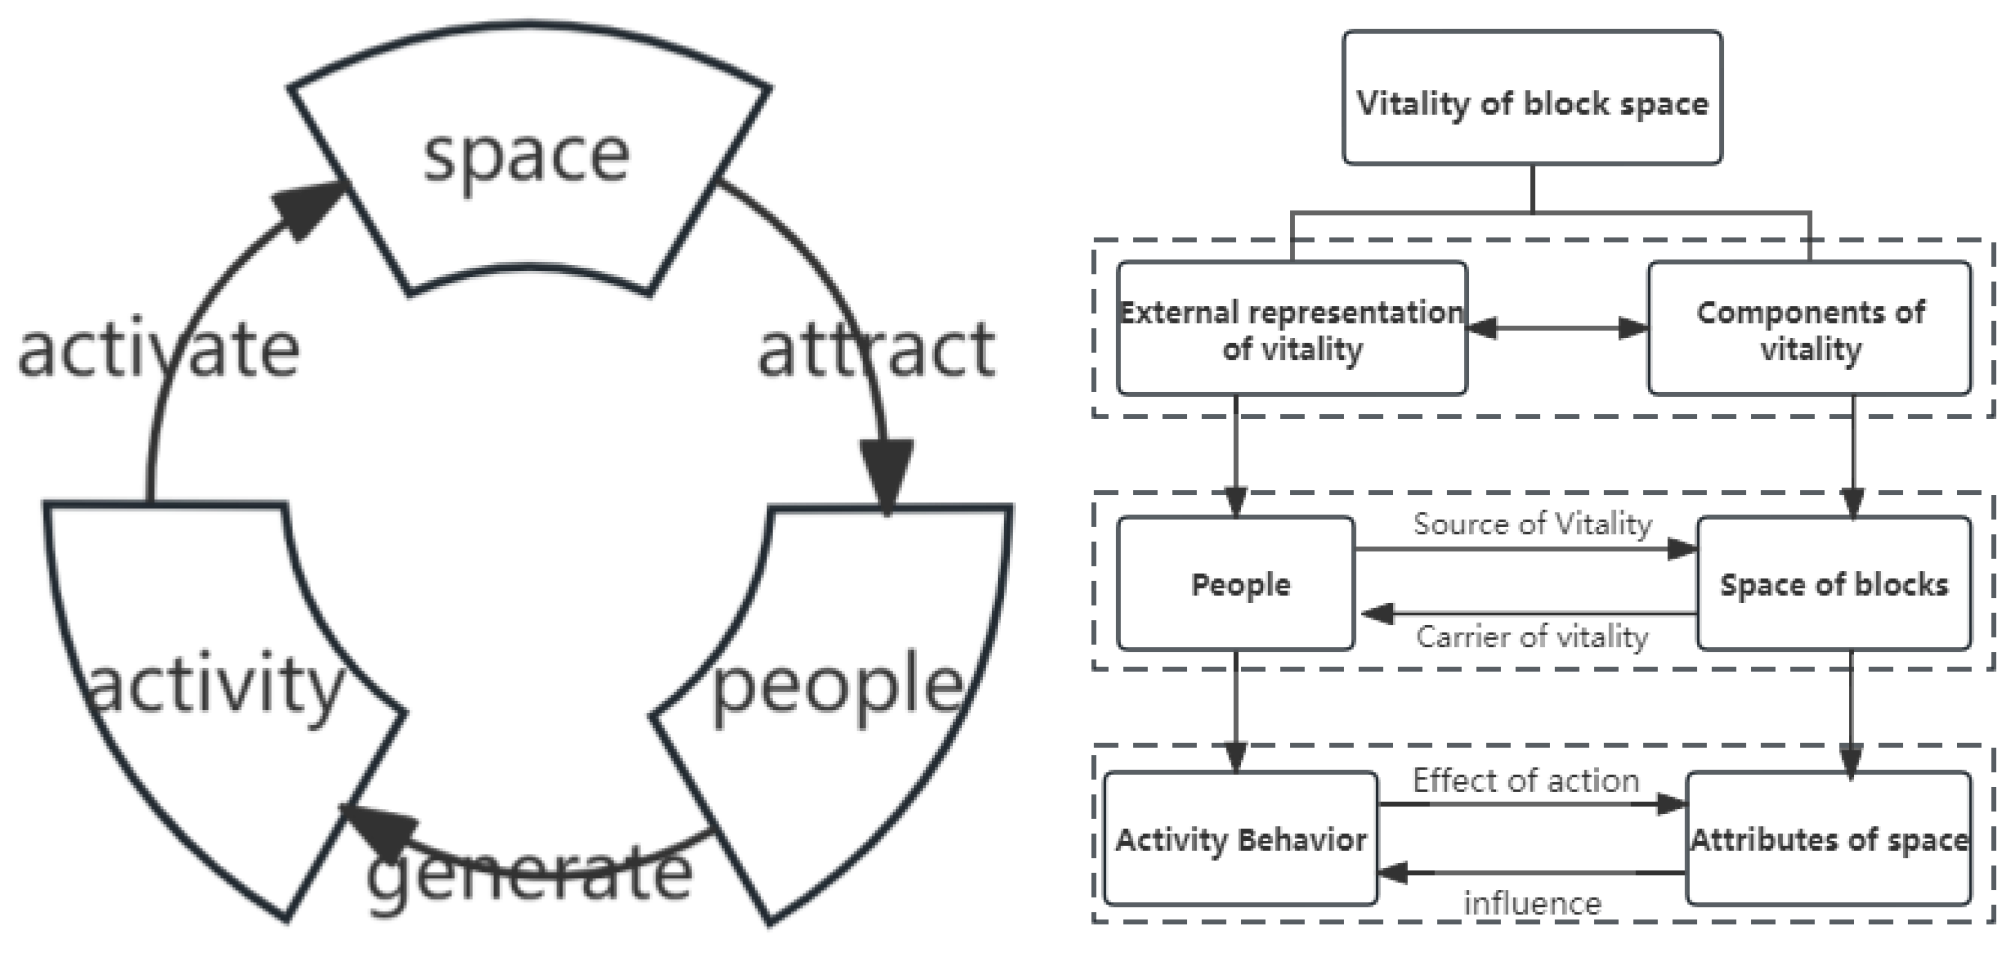
The term “vitality” originates from biology, referring to the energetic state of liveliness in organisms. With the evolution of disciplines, this concept has been introduced into the field of urban planning. In urban planning, “vitality” is combined with the spatial characteristics of commercial blocks to study the spatial form within districts. Commercial block spaces themselves do not possess vitality; rather, vitality in district spaces arises from the behavioral activities of people within those spaces. Research on district space vitality is conducted through two evaluation dimensions: external representation of spatial vitality and internal constitutive elements. The external representation of spatial vitality primarily focuses on the characteristics of human activities within commercial blocks, while the internal constitutive elements of spatial vitality stem from the commercial block itself. By studying these two evaluation dimensions as shown in
Figure 2, the mechanisms for creating vitality in commercial block spaces can be further explored [
6].
3. Data Source and Research Methods
3.1. Data Source
The research data principally consist of the external characteristic elements and the internal characteristic elements of the spatial vitality of commercial blocks. The external characteristic elements are expressed using the collected heat map data while the internal characteristic elements use road network data, block functional commercial form data (Point of Interest) and street view image data as the basic data for research and analysis [
7].
(1) Heat map data
This study utilizes heat map data to study the space vitality of commercial blocks due to their advantage of having less data bias compared to mobile phone signaling and LBS data [
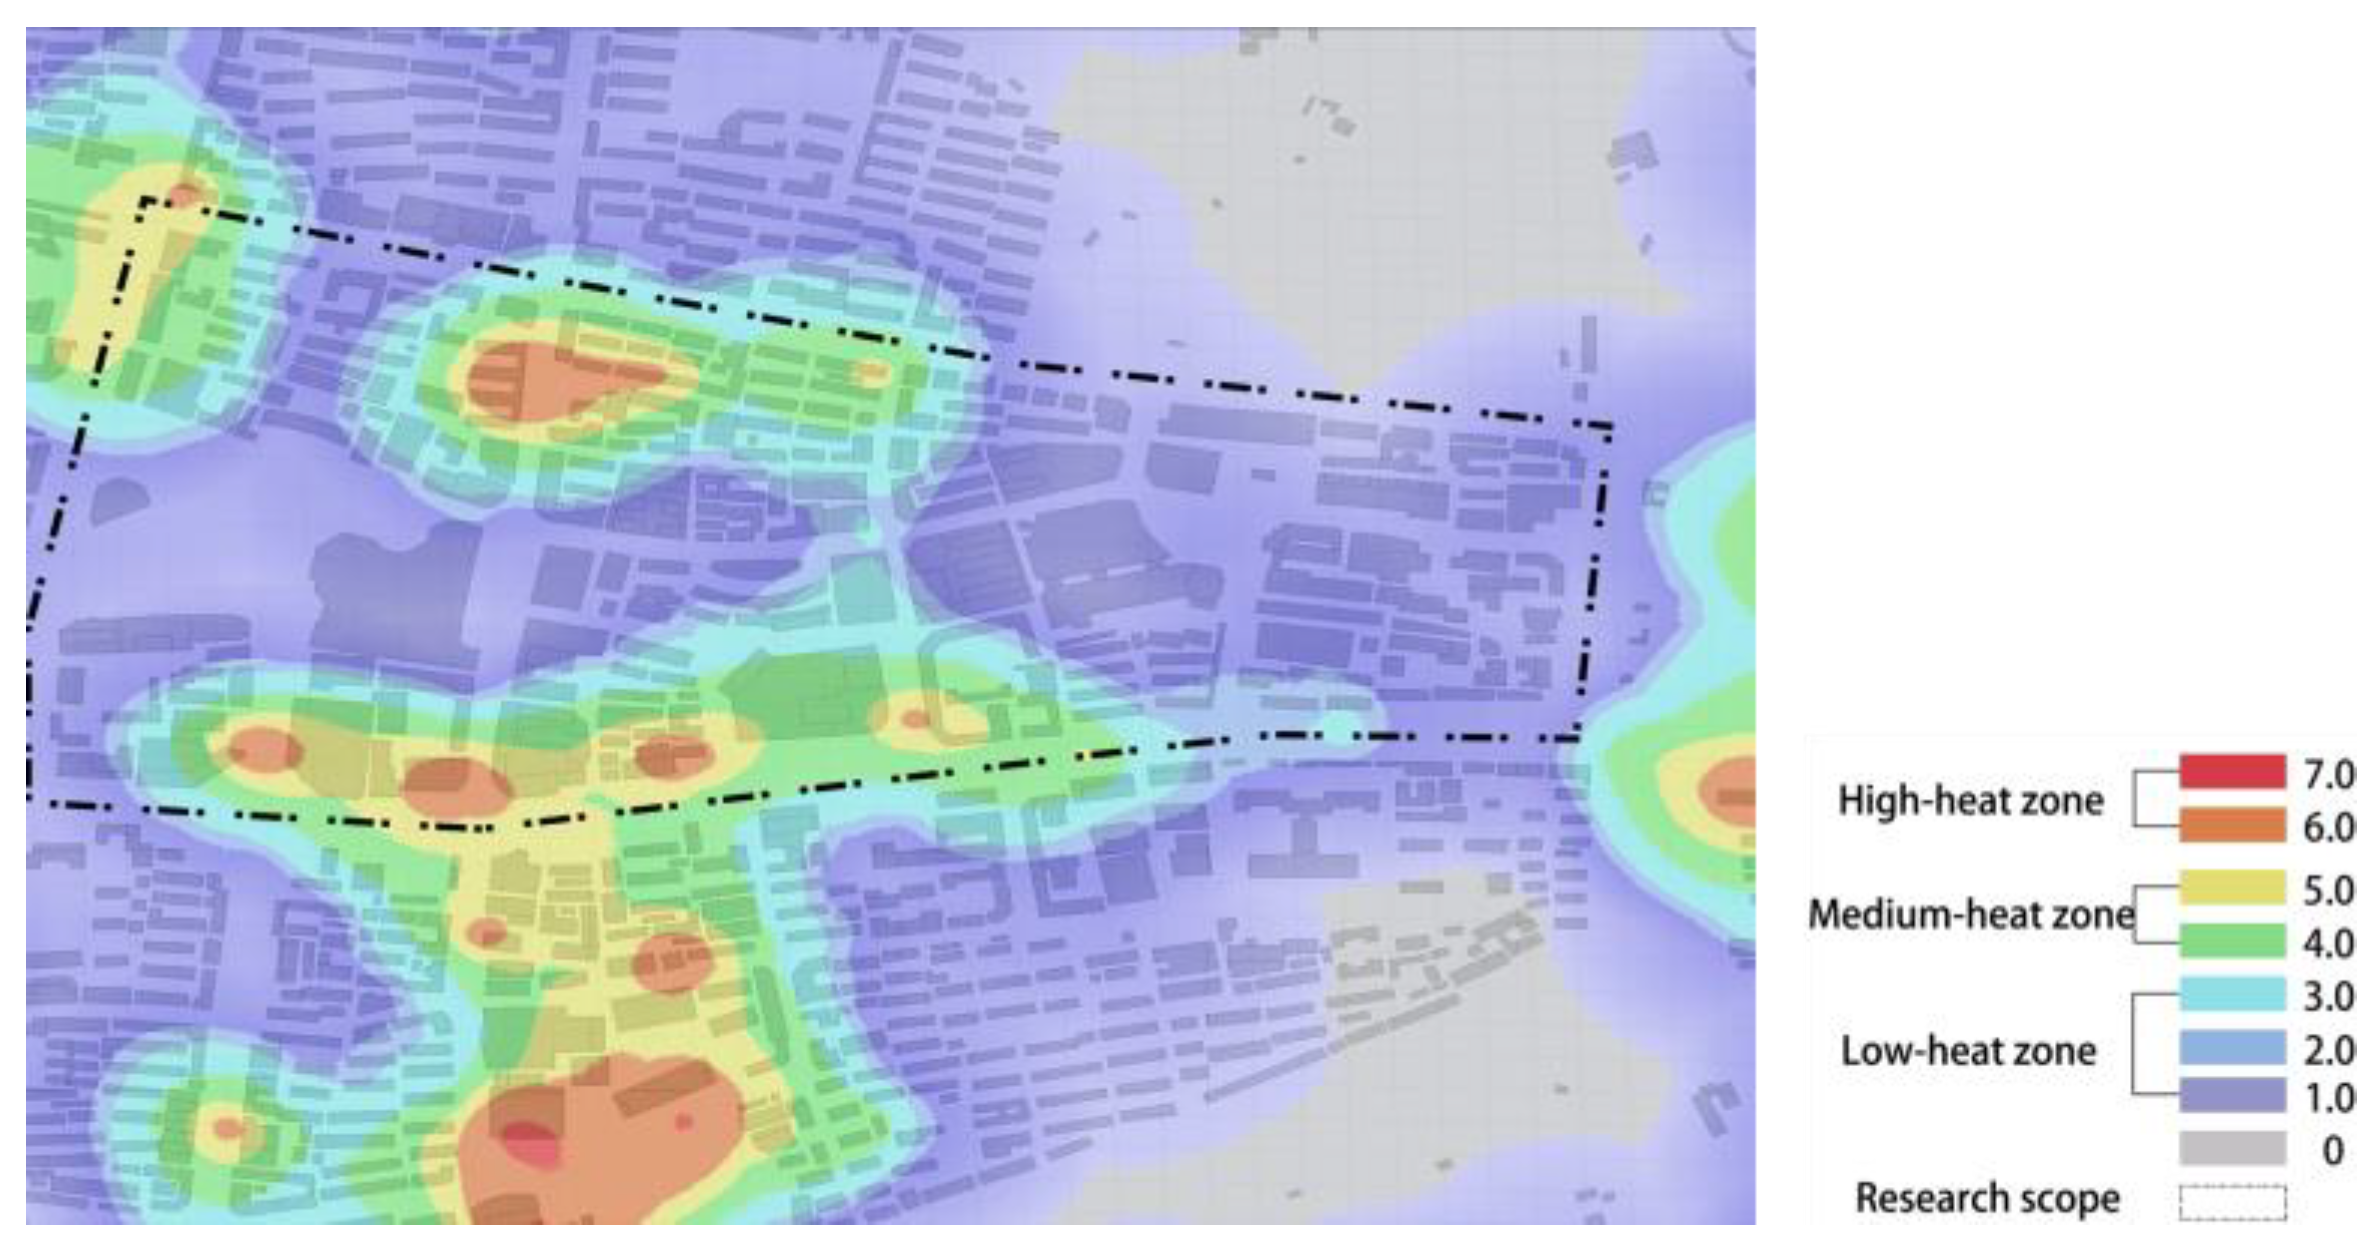
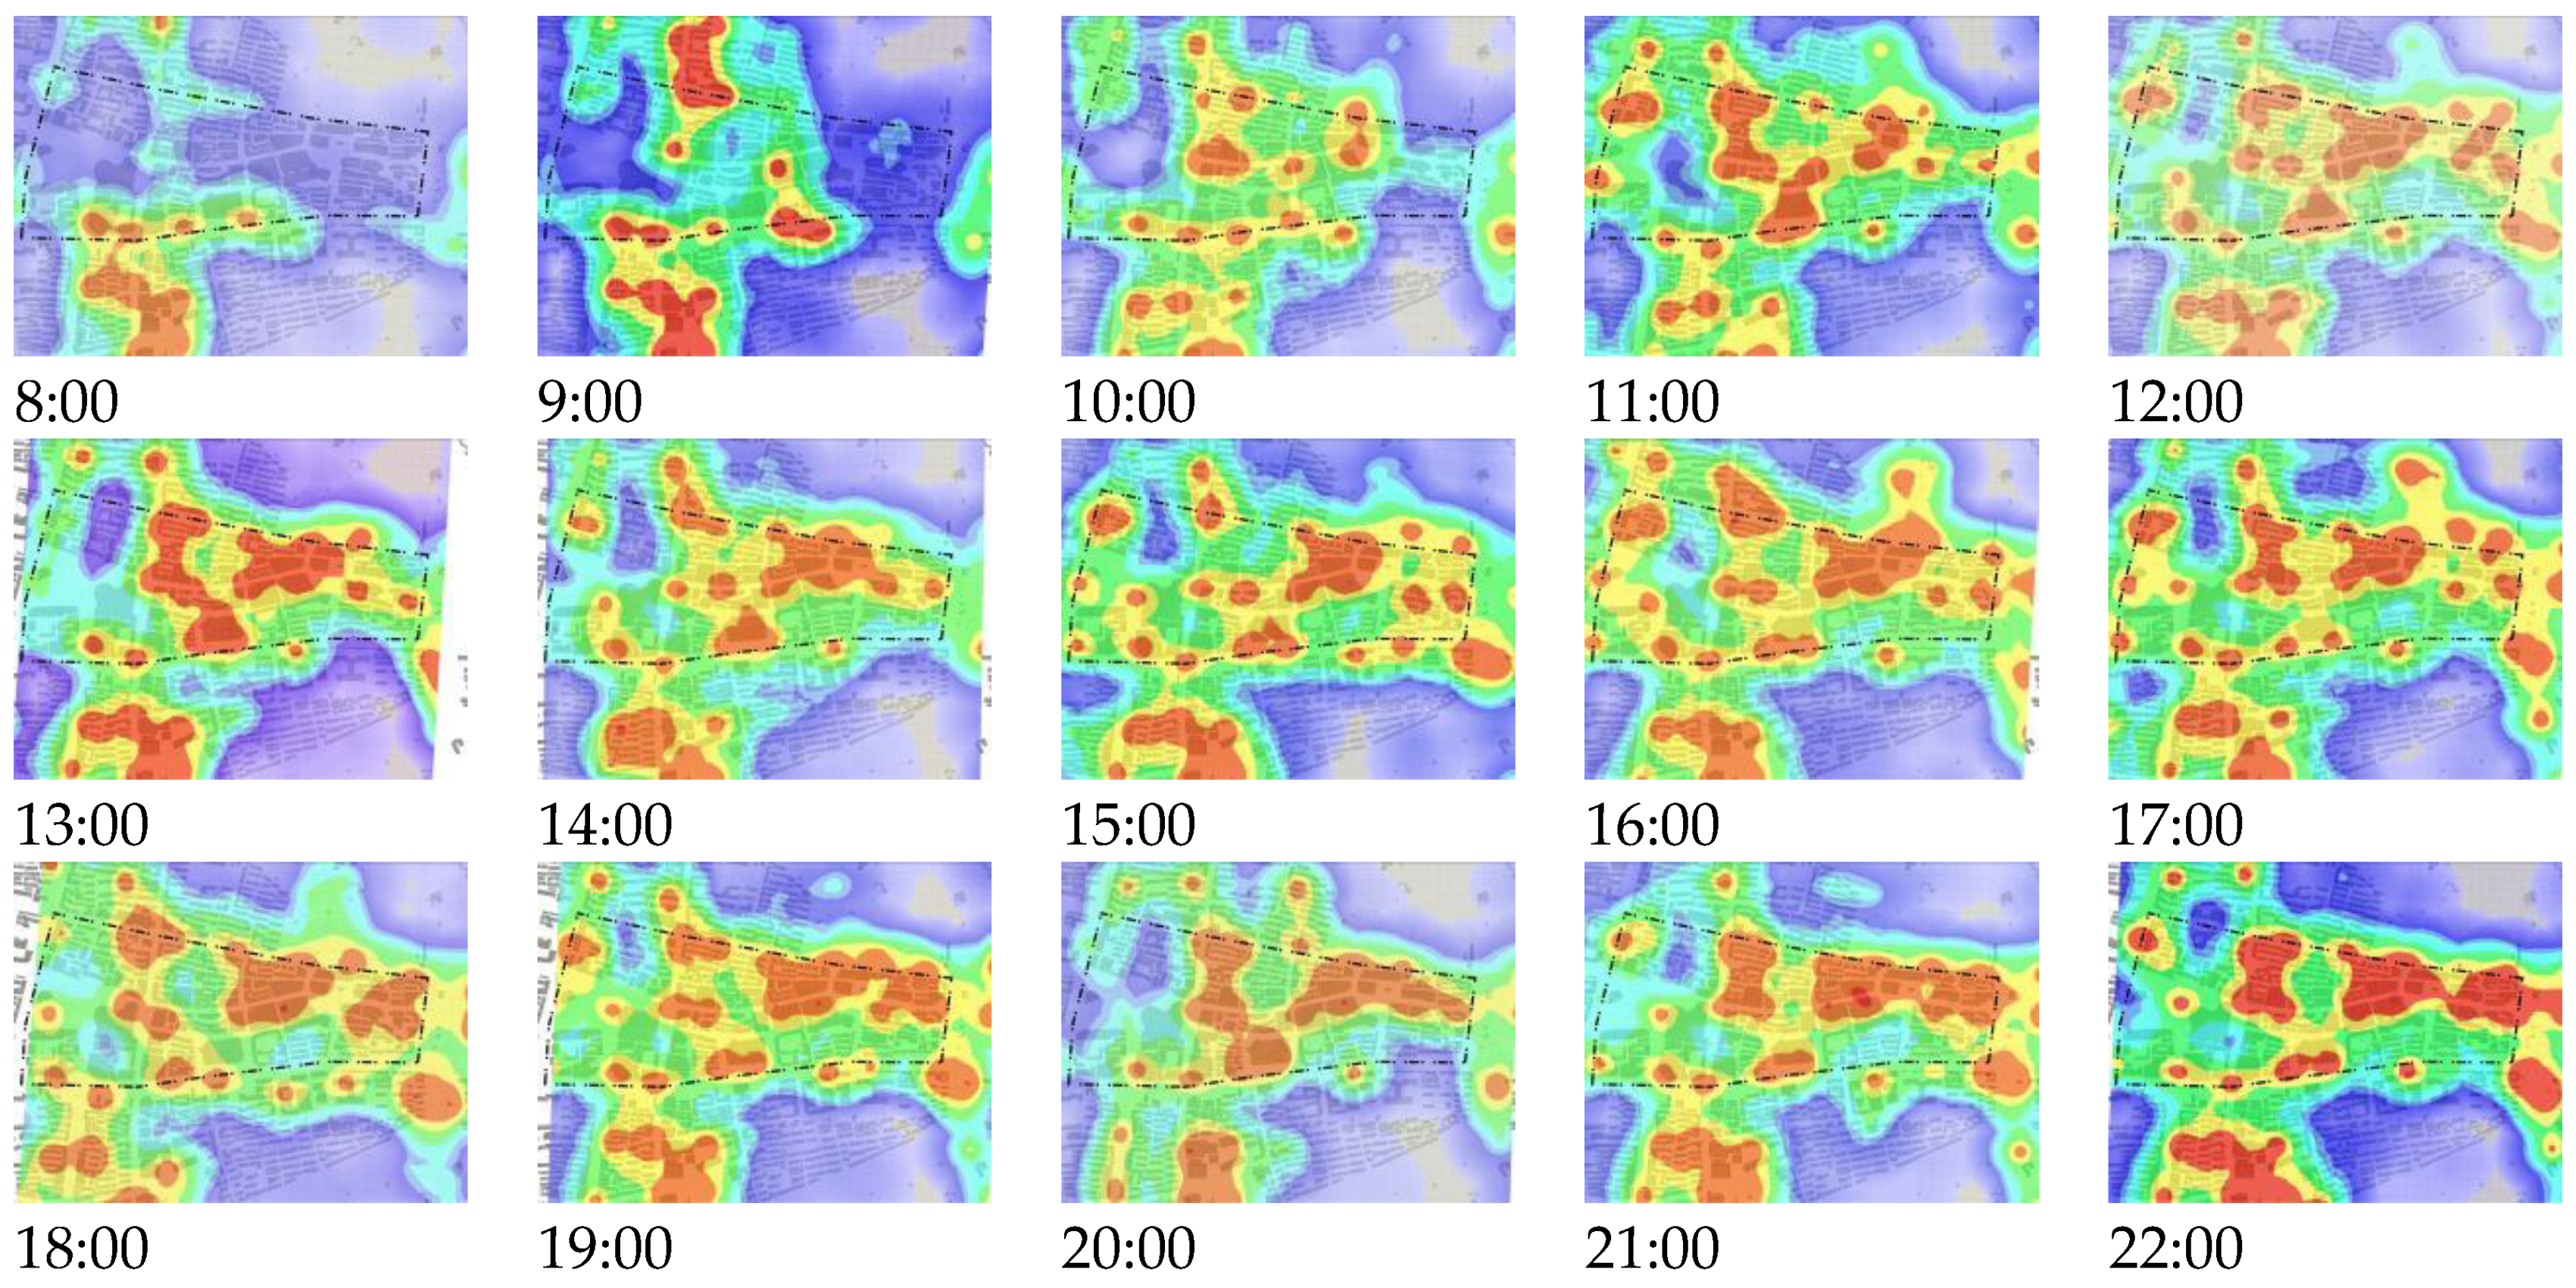
8]. Heat map data, obtained through the application programming interface (API) of Baidu Maps, is generated based on the location data of mobile users. It reflects the distribution characteristics of pedestrian aggregation and dispersion in the form of heat distribution. After importing these data into ArcGIS for geospatial matching processing, the distribution of commercial block space vitality is visually expressed, obtaining relative weight values (i.e., heat values) for the aggregation of pedestrian flows at different locations. This study focuses on Huaihe Road Commercial Block in Hefei, collecting real-time updated heat map data at one-hour intervals from 8:00 to 22:00 on 26 October 2023 (Thursday) and 28 October 2023 (Saturday). A total of 30 heat map data images were obtained. By using the heat map data as an external representation of vitality in Huaihe Road Commercial Block, different levels of heat colors in the heat map are assigned values, as shown in
Figure 3. Eight colors in the heat map (gray, purple, blue, cyan, green, yellow, orange and red) are assigned color levels ranging from zero to seven. Red and orange represent high heat areas, yellow and green indicate moderate heat areas, while cyan, blue, purple and gray signify low heat areas. Through color level assignment, information on the relative weight changes in population flow at different time intervals was obtained.
(2) Road network data
The road network data for Huaihe Road Commercial Block were obtained through WeServer (map software) and Open Street Map (OSM) (an open-source map platform) [
9]. After comparing and adjusting street network data from different sources and comparing them with satellite imagery data, operations such as overlap removal, repairing of dead-end roads and topological checks were performed to obtain relatively accurate and complete road network data for Huaihe Road Commercial Block.
(3) Street view image data
Street view image data can be obtained through the Baidu API, but there is a delay in obtaining street view image data, which may not accurately reflect the actual street environment. To ensure the authenticity and timeliness of street view image data, this study adopted on-site shooting. Main collection points were set up on the streets of Huaihe Road Commercial Block at space intervals of approximately 50 m. A total of 90 sampling points were set up, with four angles (0°, 90°, 180° and 270°) selected horizontally at each sampling point for capturing street view images. This method effectively ensures the validity and reliability of the data.
The collected street view images were uniformly processed through denoising, resizing, cropping and other operations. Local feature description, deep learning networks and other feature extraction methods were used to extract representative features from the pre-processed images. A trained classifier was then used for semantic classification and object detection of street view images to obtain the proportion of environmental elements required for the evaluation of street space quality-related indicators such as sky, greenery coverage, building interfaces and vehicles [
10].
(4) City POI data
In this article, the POI data of Huaihe Road Commercial Block were obtained by connecting to the API platform, and then the obtained POI data were processed. As the first step, we cleaned the data points with duplicate information and excluded the POI data beyond the scope of Huaihe Road Commercial Block. Then, we divided the POI data according to the commercial form categories and assigned them to 15 categories, including catering services, scenic spots, public facilities, companies and enterprises, shopping services, transportation facility services, finance and insurance services, science, technology and culture services, business residence, life services, indoor facilities, sports and leisure services, medical and health-care services, government agencies and social groups, accommodation services and so on [
11].
3.2. Research Methods
The research methodology in this study primarily utilizes numerical computation, kernel density analysis, natural breaks method and correlation analysis. The spatial syntax software Depthmap+ Beta 1.0 2012 and street view image semantic recognition software were used for quantitative analysis of road network data and street view image data in the studied commercial block. This analysis generated indicators such as integration, selection, green view rate and enclosure degree for each street. The relevant indicator data of road network morphology, district functional formats and street space quality were input into ArcGIS for kernel density spatial analysis. The spatial distribution density of various street space indicator data sets was calculated, allowing for an understanding of the spatial distribution patterns and hotspots of indicator data through kernel density analysis [
12].
3.3. Formulation of the Spatial Vitality Indicator System
Formulation of the spatial vitality evaluation indicator system for commercial blocks is identified as the premise and key to carrying out research on the external characteristic elements and internal characteristic elements of spatial vitality. The multi-source data research method can be applied to a wide range of fields. Therefore, this article refers to the literature of relevant fields and effectively screens the spatial vitality evaluation indicators by taking into account the actual research requirements and data accessibility of road network elements, spatial quality elements and other aspects of the commercial block [
13]. In order to establish a scientific and targeted evaluation research system, an influencing factor evaluation indicator system was formed consisting of eight indicators on the basis of road network configuration, functional commercial form and street space quality. These eight indicators include integration, selection, functional mixture, functional density, green view index and so on. See
Table 1 for details.
(1) Road network configuration of the commercial block
Integration refers to the convenience of movement from any road in the commercial block to another road and reflects the potential of street space to attract accessible traffic. Selection refers to the sum of the shortest topological paths of any road to any other street in the system and reflects the probability of any road in the commercial block selected for traffic [
14].
Here,
is the integration results of node
;
is the weight of node
within the research radius
;
is the shortest topological distance from the node
to the node
;
is the selection results of the node;
is the shortest topological path between the node
and the node
through the node
within the search radius
[
15]. In this article, the research model search radius is 500 m.
(2) Functional commercial forms of the commercial block
Functional density refers to the distribution of POI in the space of the commercial block, and the spatial kernel density is calculated to reflect the degree of target element aggregation in the spatial grid.
Functional mixture refers to the diversity of different types of commercial form POI in the block unit space, and the research takes 25 m × 25 m fish net as the unit space.
Here,
is the distance attenuation threshold;
is the number of element points with the distance from the location
being less than or equal to
;
is the spatial weight function;
is the kernel density calculation function at the spatial location
.
is the proportion of
commercial forms;
is the functional mixture of variable
in the block space fish net [
16].
(3) Street space quality
Green view index refers to the proportion of vegetation and other elements in the space within the field of view. Vegetation can improve the street micro-climate environment. An appropriate green view index in the street space can increase people’s intimacy with the environment. However, if the green view index is too high, it will block the commercial building facade, obstructing the line of sight and affecting the spatial cognition. Enclosure refers to the proportion of public space enclosed by buildings, walls and other structures in the entire line of sight of pedestrians. A good street space enclosure will bring people a certain sense of safety and meet the safety needs of pedestrians. Sky view factor (SVF) is a measure of the proportion of the sky area in the street visible to all people’s line of sight, as well as the visible scope of the sky. The degree of motorization refers to the area ratio of motor vehicles and urban roads in the street space. It mainly measures the efficiency of urban streets carrying traffic flow and reflects the walking environment of urban residents [
17].
Here, is the sum of the pixels occupied by the trees and vegetation in the street view image ; is the sum of all pixels in the street view image ; is the green view index of the street view image . is the sum of the pixels occupied by the building obstructions in the street view image ; is the sum of all pixels in the street view image ; is the enclosure of the street view image . is the sum of the pixels occupied by the sky in the street view image ; is the sum of all pixels in the street view image ; is the SVF of the street view image . is the sum of the pixels occupied by motor vehicles and urban roads in the street view image ; is the sum of all pixels in the street view image ; is the degree of motorization in the street view image .
4. Distribution Characteristics of the Elements Relating to Spatial Vitality
The data analysis in this article was performed on the basis of the Arcgis data processing platform, and some of the data are divided into six levels for visual expression by the natural breaks method.
4.1. Spatial Vitality Distribution Characteristics
After importing the obtained heat maps into the Arcgis platform for georeferencing, the color pixel size of different heat grade areas in the heat maps of Huaihe Road Commercial Block was read through the histogram function of Adobe Photoshop cc 2015.5 software [
18]. By comparing the number of pixels, the area size and the change trend of the areas at different heat grades were evaluated by objective measurement, and the relative heat value of each street space in Huaihe Road Commercial Block was obtained accordingly. The spatial vitality distribution characteristics of Huaihe Road Commercial Block were measured by observing the temporal and spatial distribution law of the relative heat values of different streets during working days and rest days of the commercial block. See
Figure 4 and
Figure 5 for details [
19].
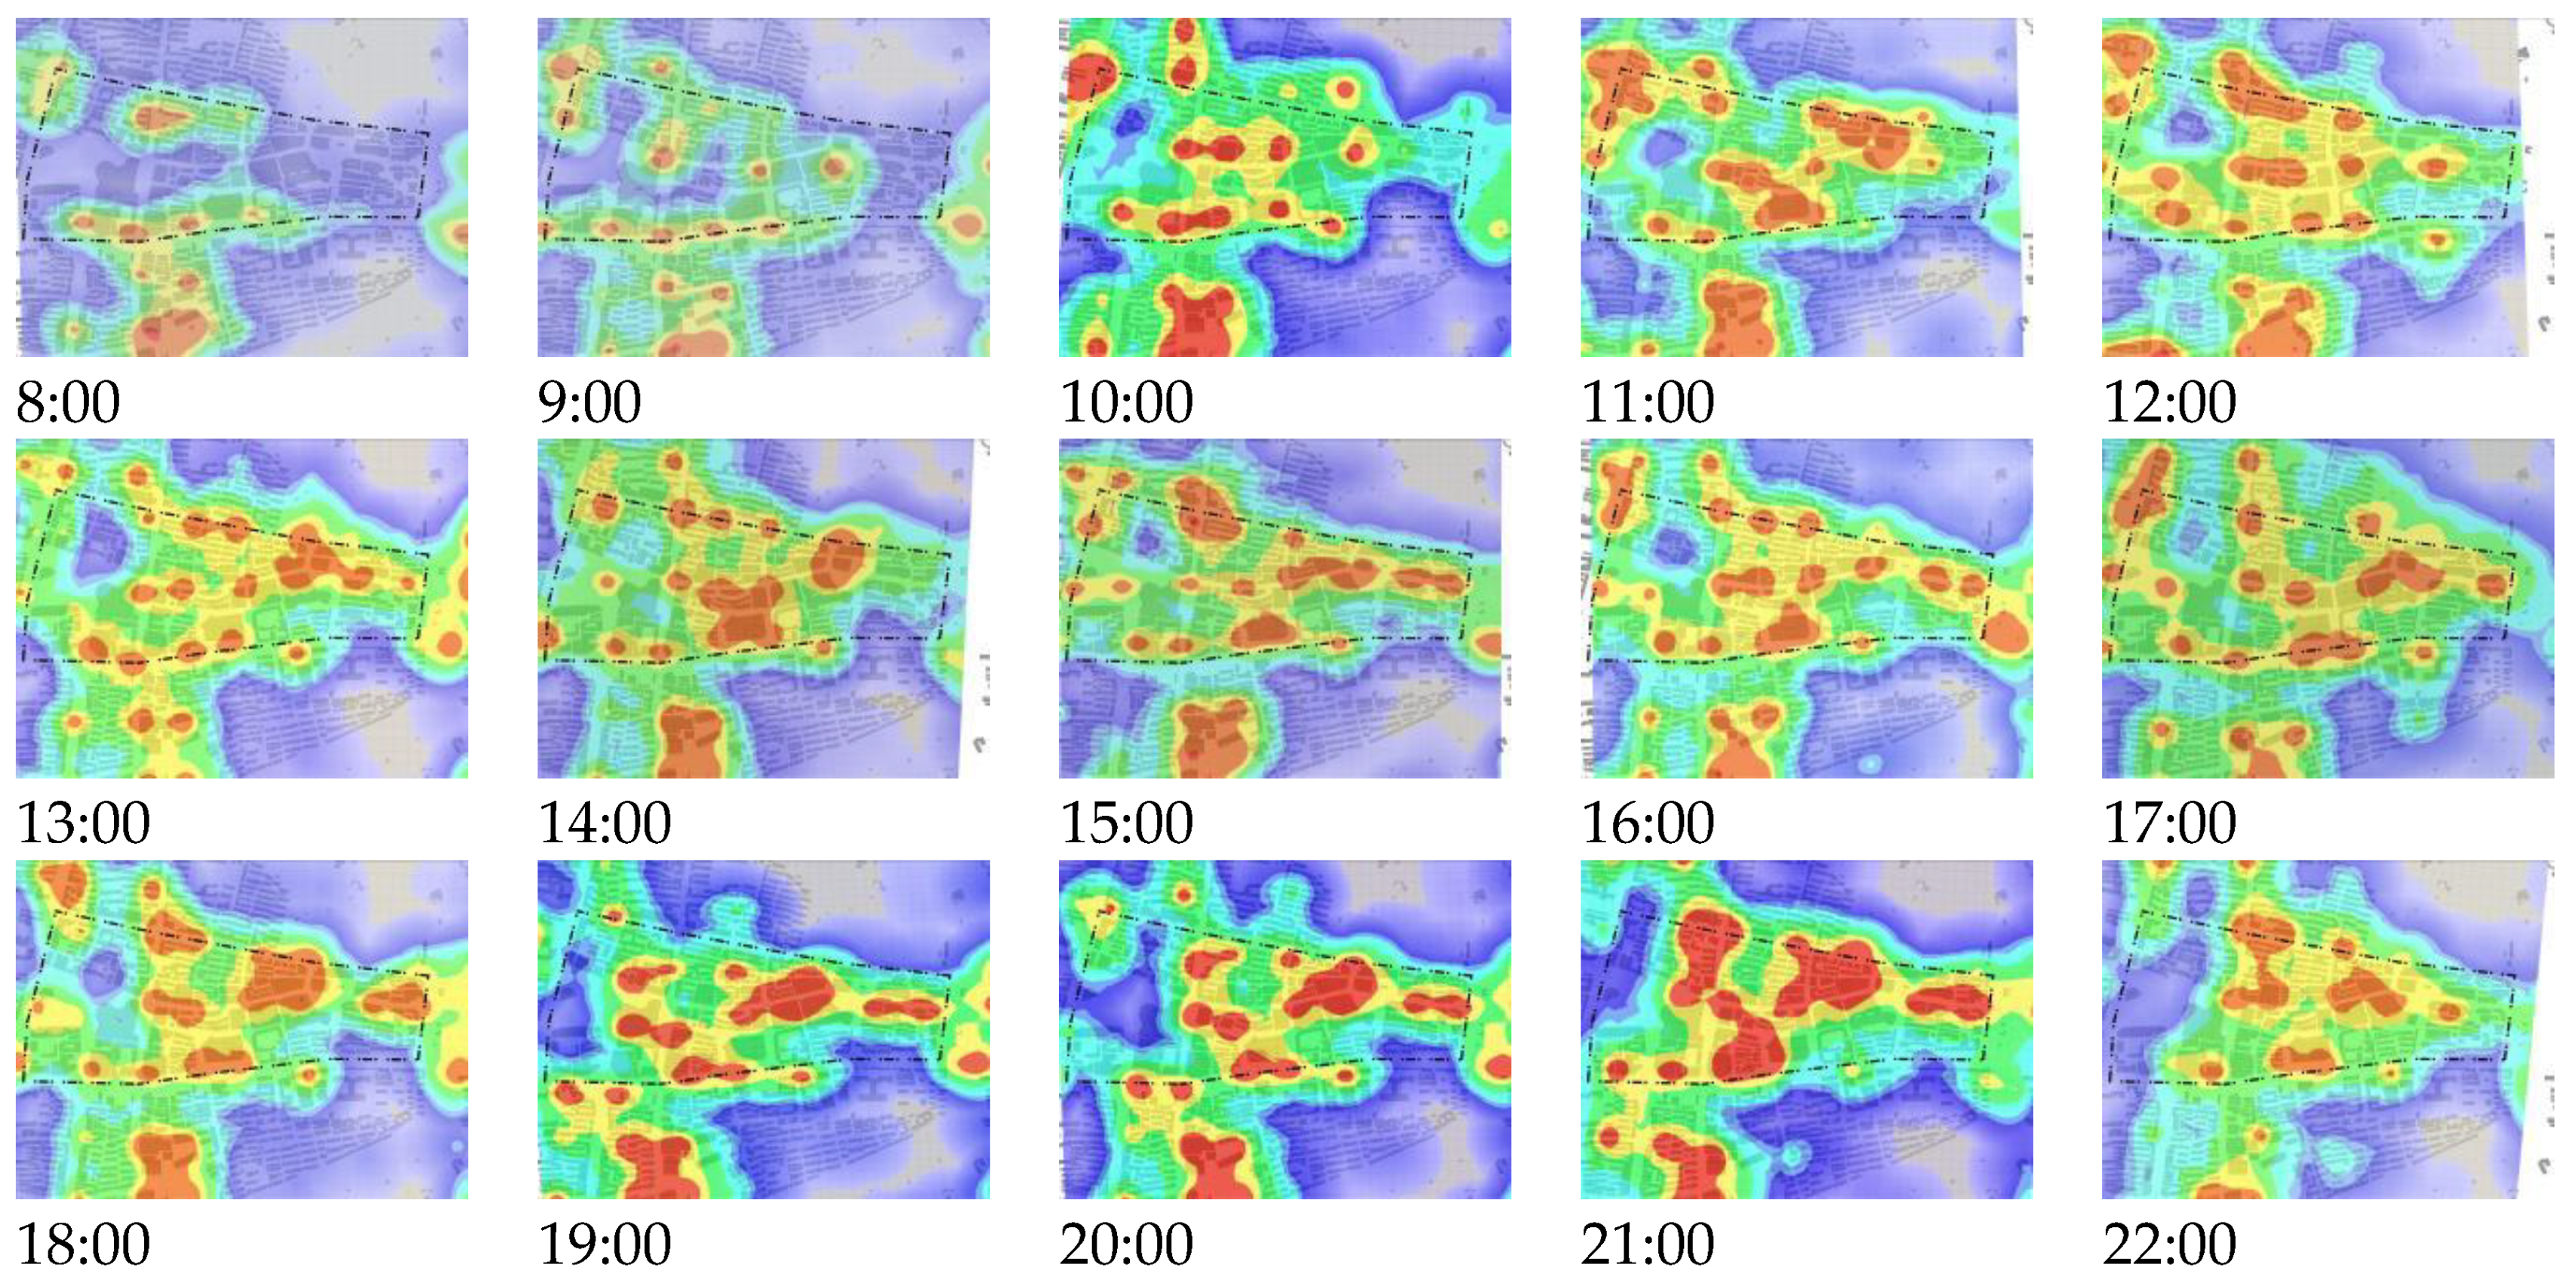
As reflected by the temporal distribution, the peak flow of pedestrians during working days mainly occurs in the period from 12:00 to 15:00, while the peak flow of pedestrians during rest days mainly occurs in the period from 11:00 to 13:00 and 19:00 to 22:00. The overall vitality during working days is lower than that during rest days. It was observed that the spatial vitality of the commercial block shows a significant change trend in the following three time periods, including morning (8:00–12:00), afternoon (13:00–17:00) and evening (18:00–22:00). The spatial vitality during working days begins to change significantly from 8:00 to 10:00. In this period, the crowd in the commercial block gradually gathers, reaches the early peak at about 10:00, decreases, reaches the afternoon peak at 14:00, begins to decrease and then the evening peak occurs after 17:00 and continues to 22:00. During this period, the average crowd gathering fluctuates slightly and gradually goes down after reaching the peak at 21:00, and finally the city begins to enter the state of night rest. During the period from 9:00 to 12:00 on each rest day, the overall spatial vitality shows an upward trend and quickly goes down to a low point around 11:00 and reaches a small peak at 12:00. The spatial vitality of the commercial trend shows an overall stable trend in the period from 13:00 to 17:00. In the period from 18:00 to 22:00, the spatial vitality of the commercial block increases and then begins to go down after reaching the peak at 20:00 and 21:00 but continues for a longer period of time compared with night vitality of the commercial block during working days.
From the perspective of spatial distribution, the overall coverage of Huaihe Road Commercial Block has higher spatial vitality, but the overall distribution of spatial vitality is uneven, and the relative vitality values are quite different. The peak pedestrian aggregation is mainly located in the area around Huaihe Road Pedestrian Street and brings the positive radiation of vitality to the surrounding areas, with Intime Center Commercial Complex and Parkson Shopping Center Plaza as two spatial nodes. According to the comparison of heat maps representing working days and rest days, the area with higher spatial vitality during rest days is larger, the overall changes in spatial vitality in Huaihe Road Commercial Block during working days and rest days are quite similar, and the aggregation behavior of pedestrians changes with time, showing a specific rule. Affected by work factors during working days, pedestrians usually move to some specific locations, including primary schools, office buildings and residences. However, during rest days, pedestrians move to more locations, and there are more sites for the aggregation of pedestrians.
4.2. Spatial Distribution Characteristics of Influencing Factors
Starting with the internal constituent elements of spatial vitality and the spatial environmental factors of Huaihe Road Commercial Block, such as road network configuration, functional commercial form and street space quality, this article performs quantification and visualization to all related indicators using the numerical calculation method and natural breaks method in ArcGIS, thus analyzing the spatial distribution characteristics of Huaihe Road Commercial Block.
4.2.1. Road Network Configuration Elements of This Commercial Block
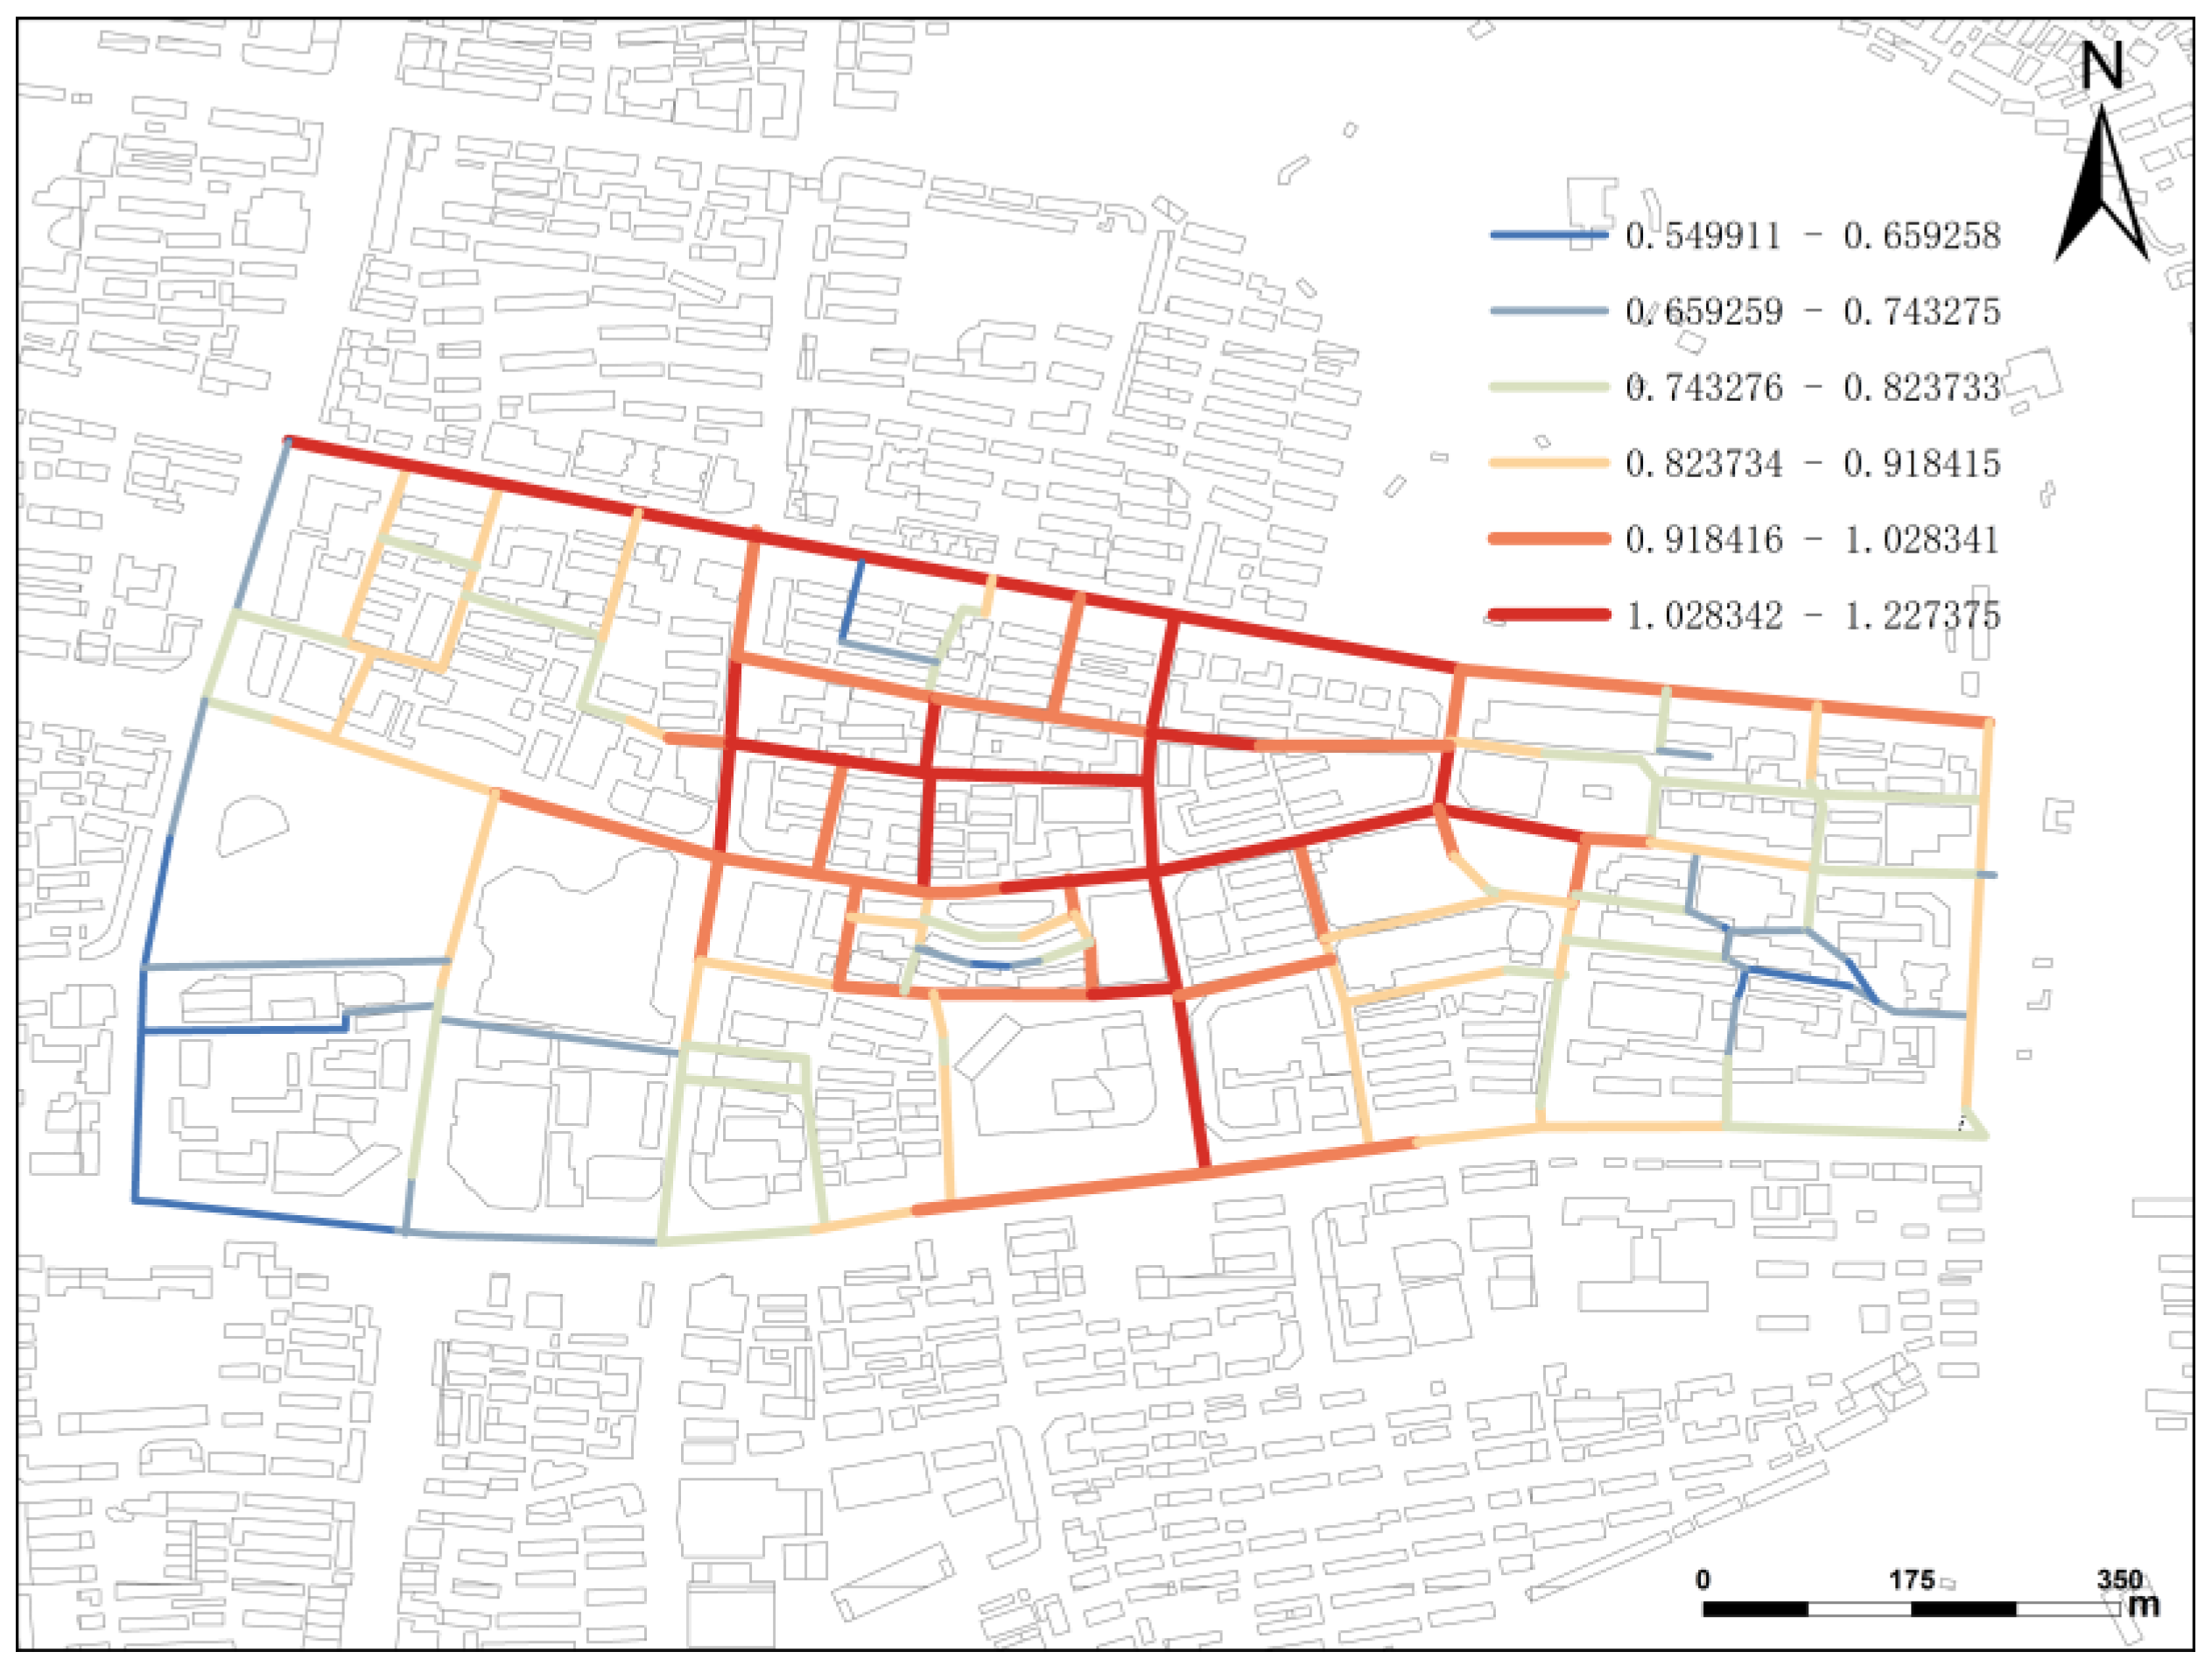
(1) Integration
After importing the building outline and road network data of Huaihe Road Commercial Block into the calculation and analysis module of Depthmap+ Beta 1.0 2012 software, we obtained the integration results of Huaihe Road Commercial Block, as shown in
Table 2. By importing the data into the ArcGIS platform for visual presentation, as shown in
Figure 6, we found that the road sections with higher integration show a dual-core situation in Huaihe Road Commercial Block, and the high-integration areas are mainly located in the trunk road of Huaihe Road Pedestrian Street, Shouchun Road, the north section of Suzhou Road, Beiyoufang Lane, Cuozaoshan Lane and other streets. The medium-integration areas include East Huancheng Road, Huizhou Avenue, the south section of Suzhou Road, Jiushiqiao Street, Tuanjie Lane, Yaba Lane and other streets. The low-integration areas are distributed from the south of Huaihe Road Pedestrian Street to the south of Middle Changjiang Road. This layout makes the high-accessibility streets within Huaihe Road Commercial Block extend to the whole area, and residents there can easily reach any location of the space by walking in the commercial block.
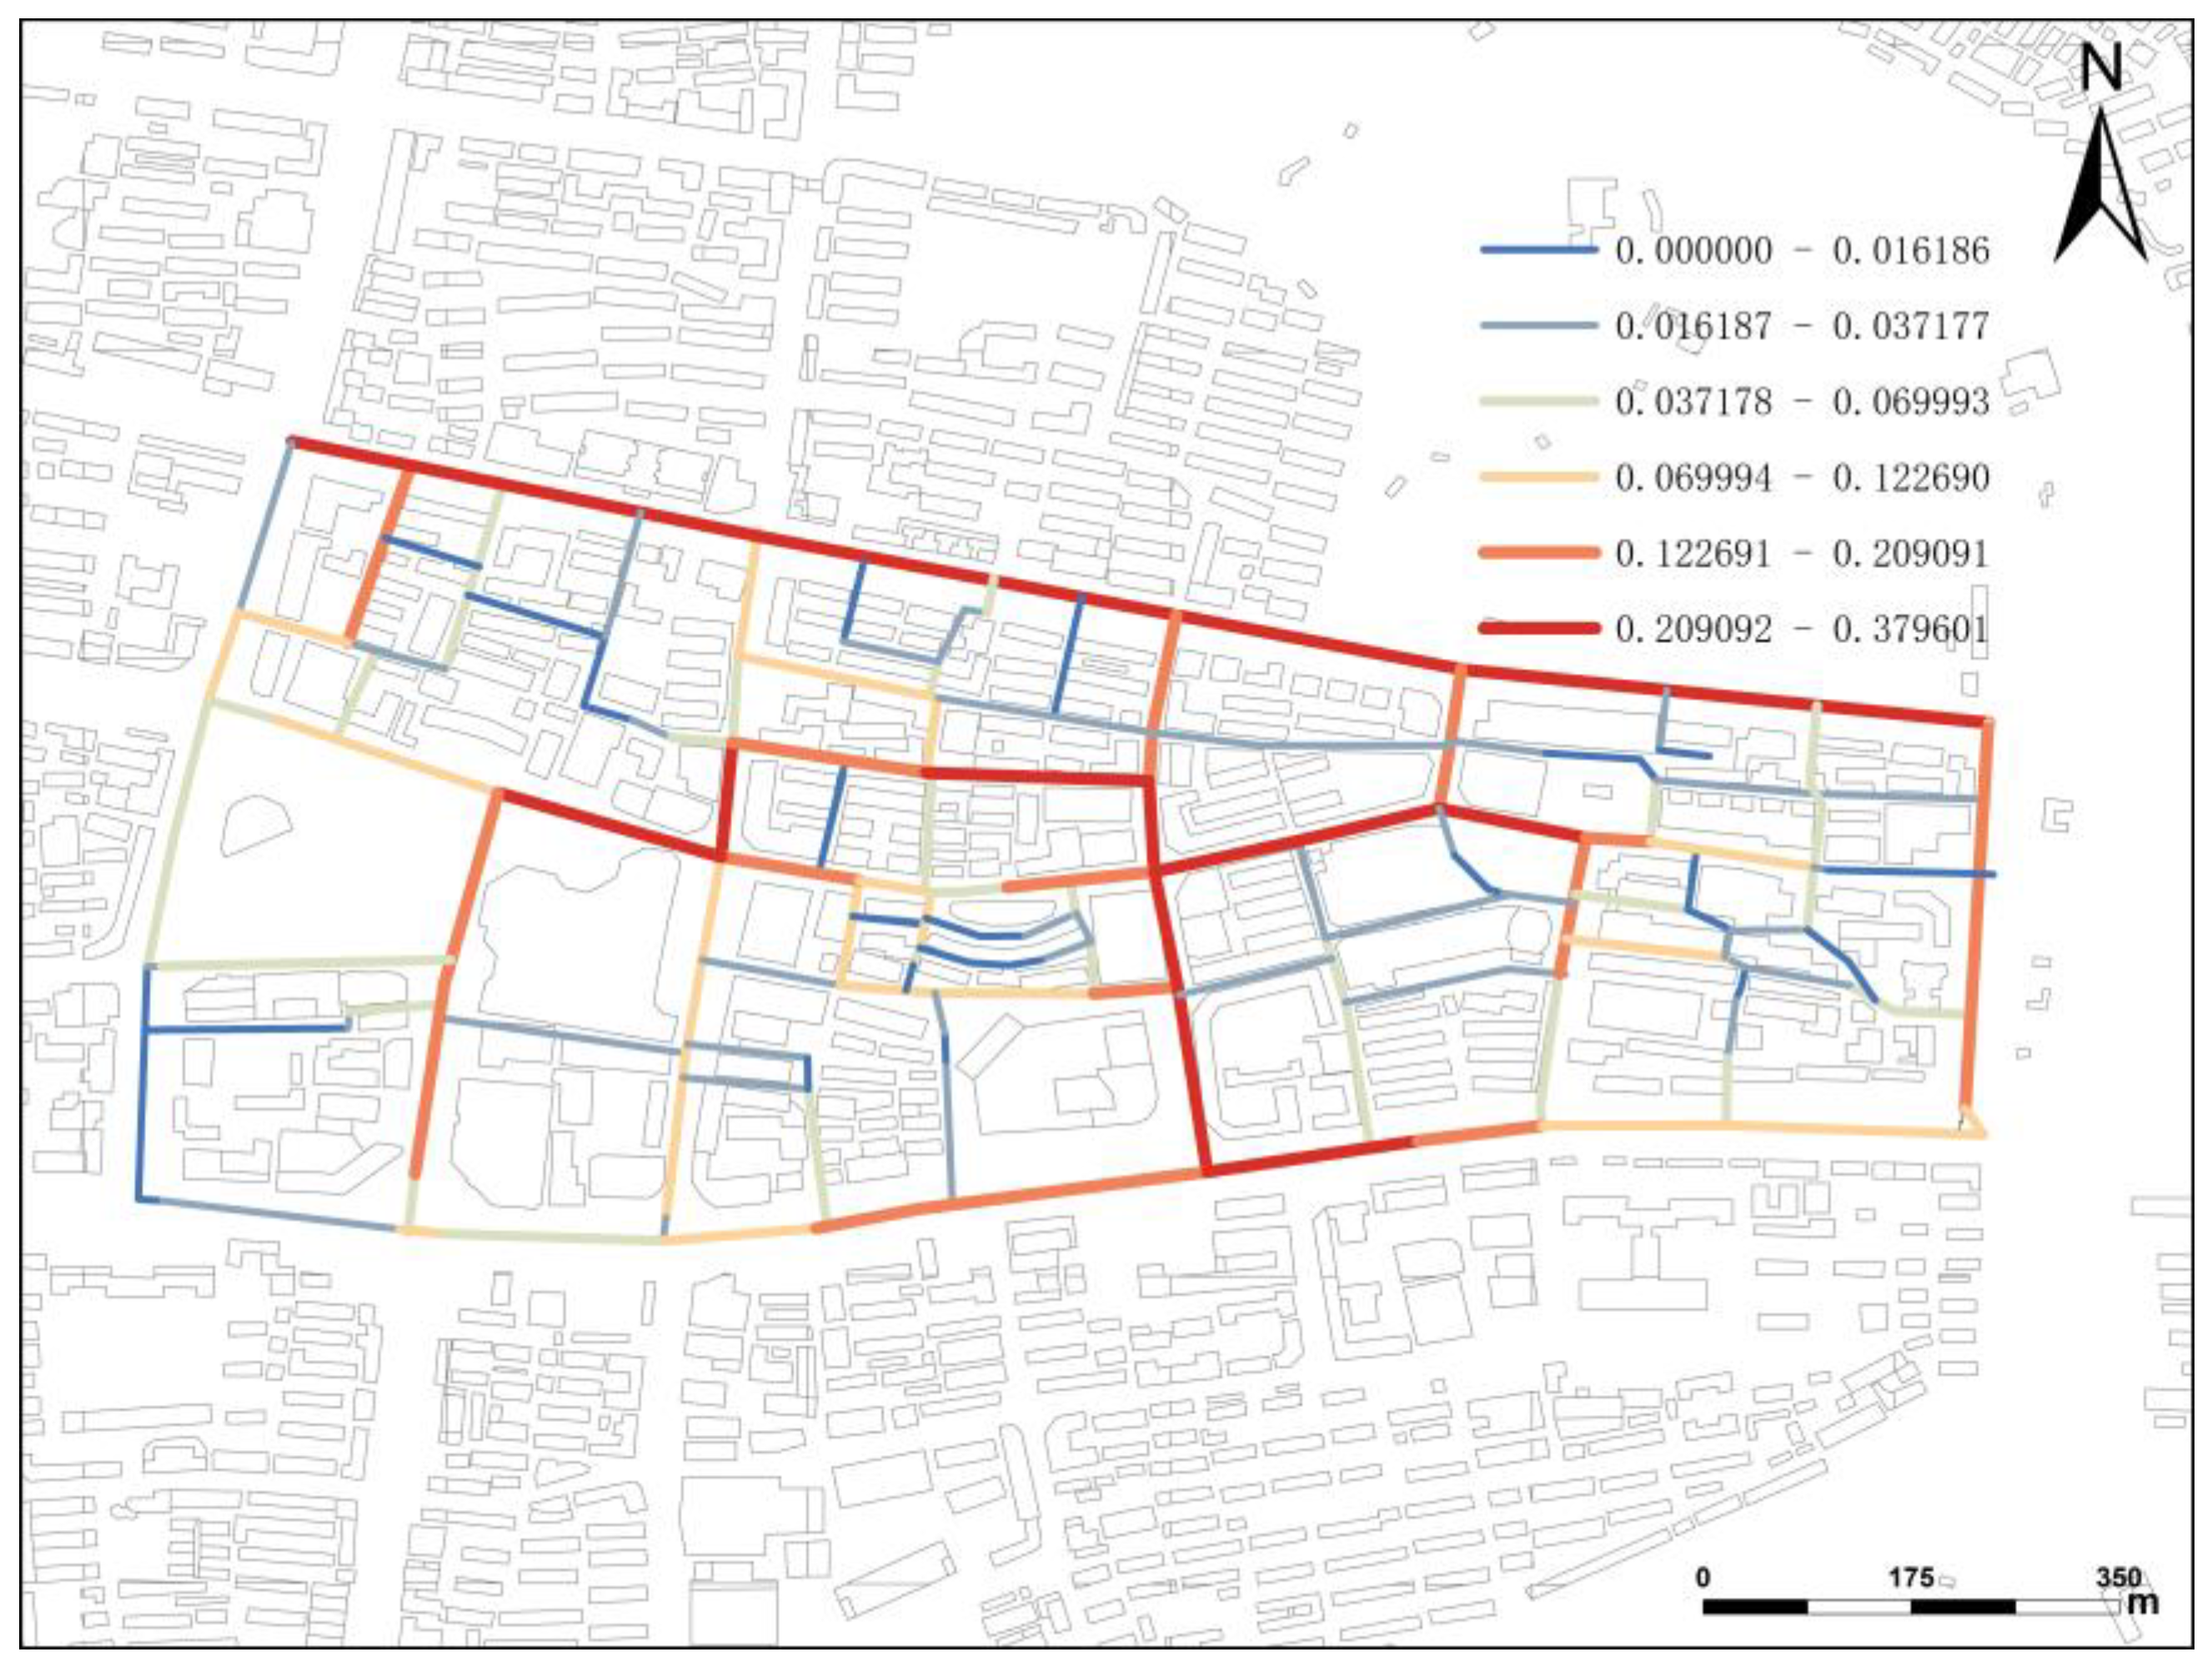
(2) Selection
The selection calculation results of Huaihe Road Commercial Block are shown in
Table 3, and the visual diagram is shown in
Figure 7, featuring concentrated surface distribution. The areas with high selection are mainly distributed from the north of Huaihe Road Pedestrian Street to Shouchun Road, starting from the north section of Suzhou Road and ending at Xiaoyaojin Road. The continuous streets with high selection in Huaihe Road Commercial Block mainly include Huaihe Road Pedestrian Street, the north section of Suzhou Road, the middle section of Middle Changjiang Road and Huaihe Road. According to the overall analysis of the road network configuration elements of Huaihe Road Commercial Block, there is an overlap between the streets with high selection and the streets with high integration, and the trunk roads with high integration and selection play a significant role in promoting the spatial vitality of the streets around the commercial block. This kind of street with good traffic potential is an important factor in achieving the spatial vitality of the commercial block. Therefore, it is convenient for residents to reach their destination across the commercial block for spontaneous and necessary activities.
4.2.2. Functional Commercial Form Elements of This Commercial Block
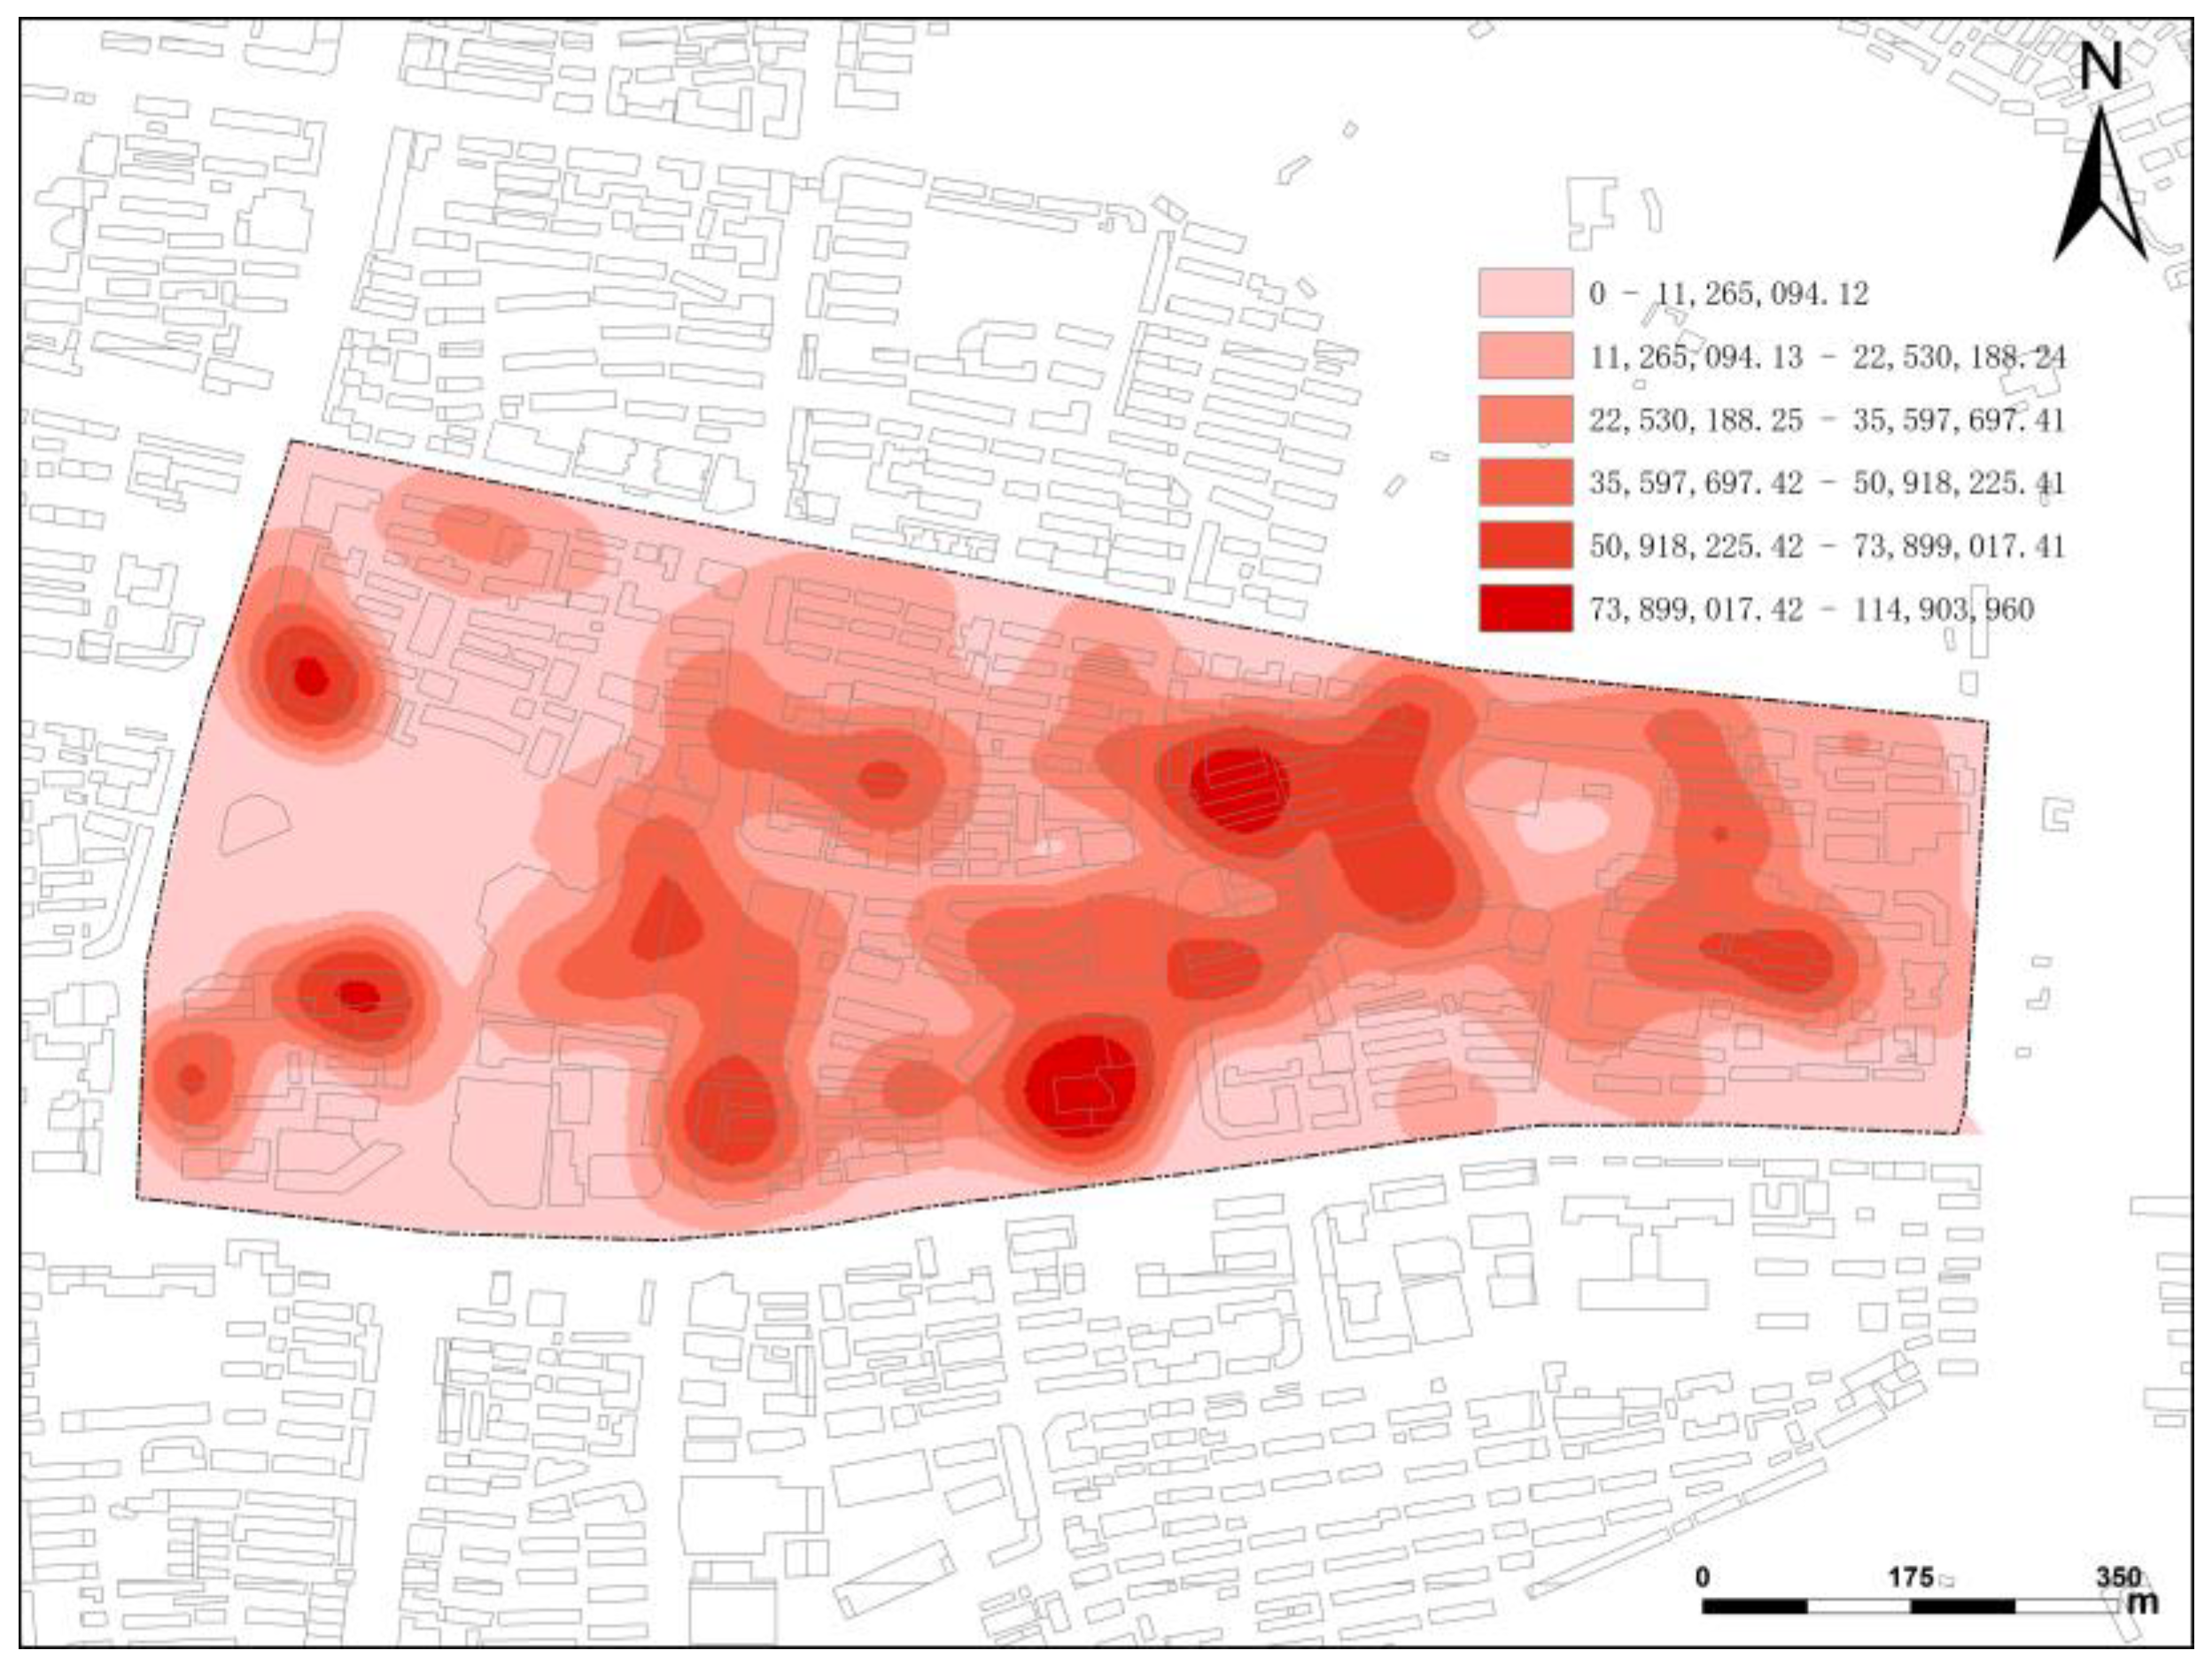
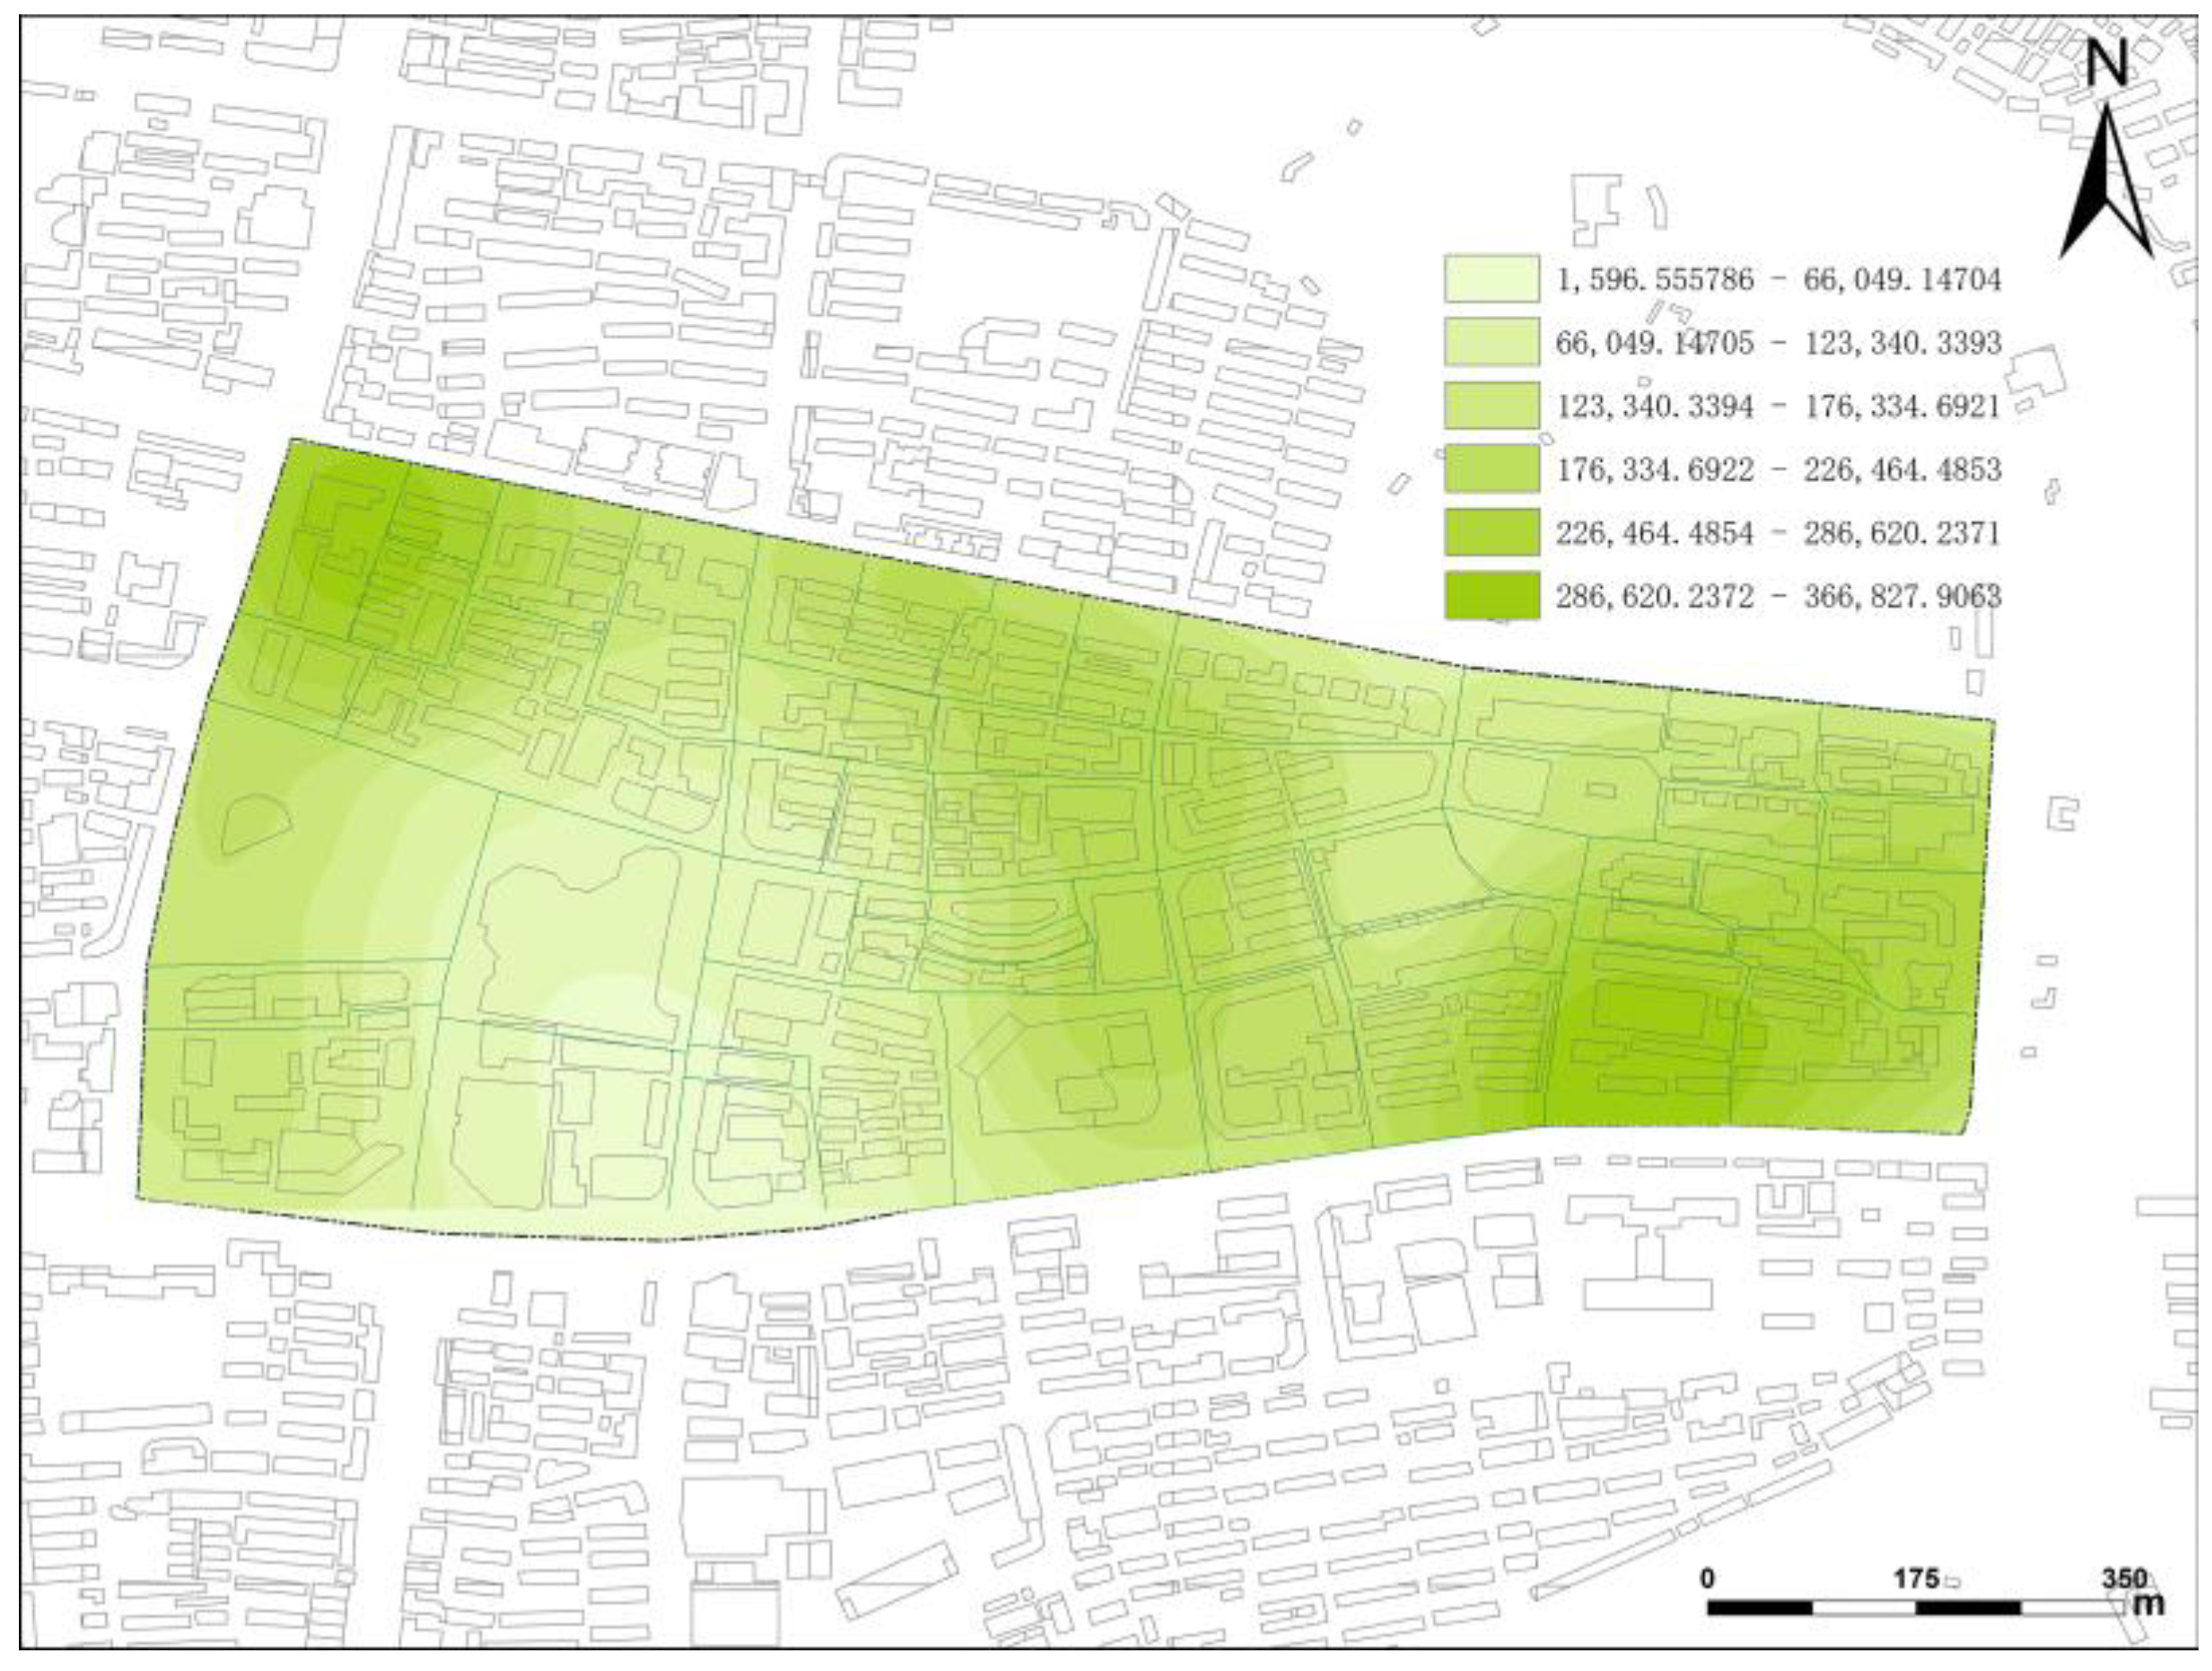
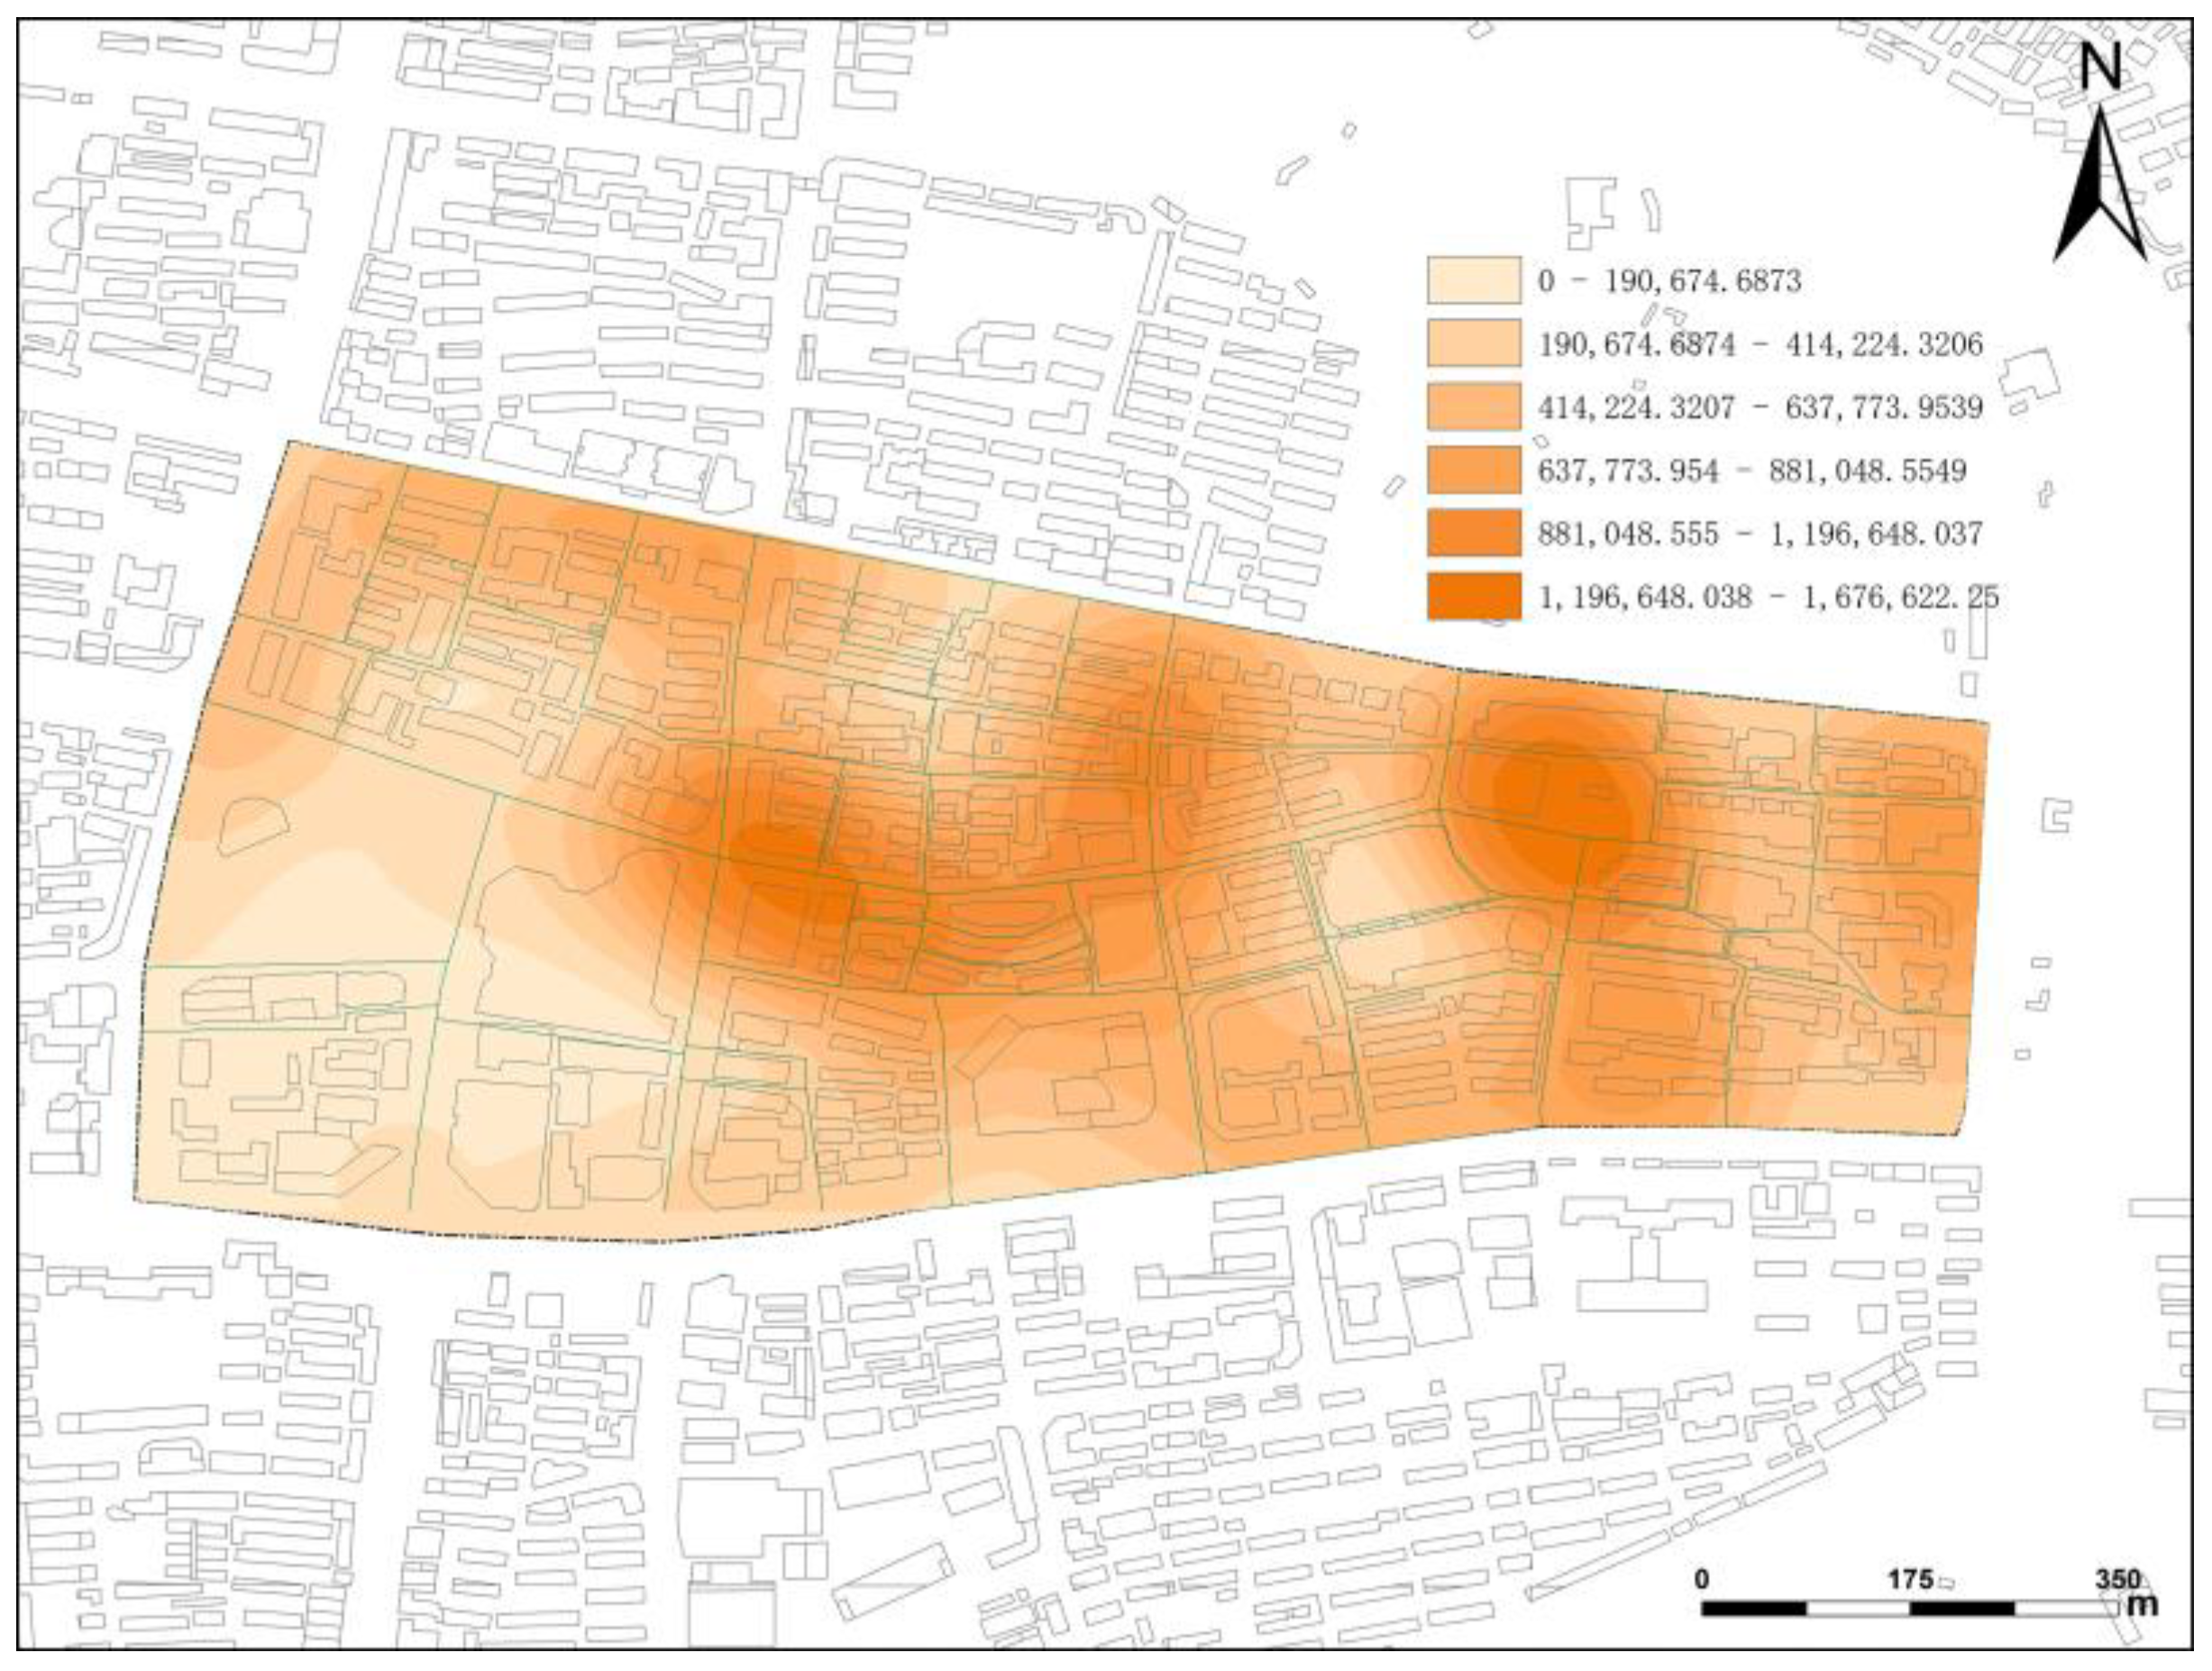
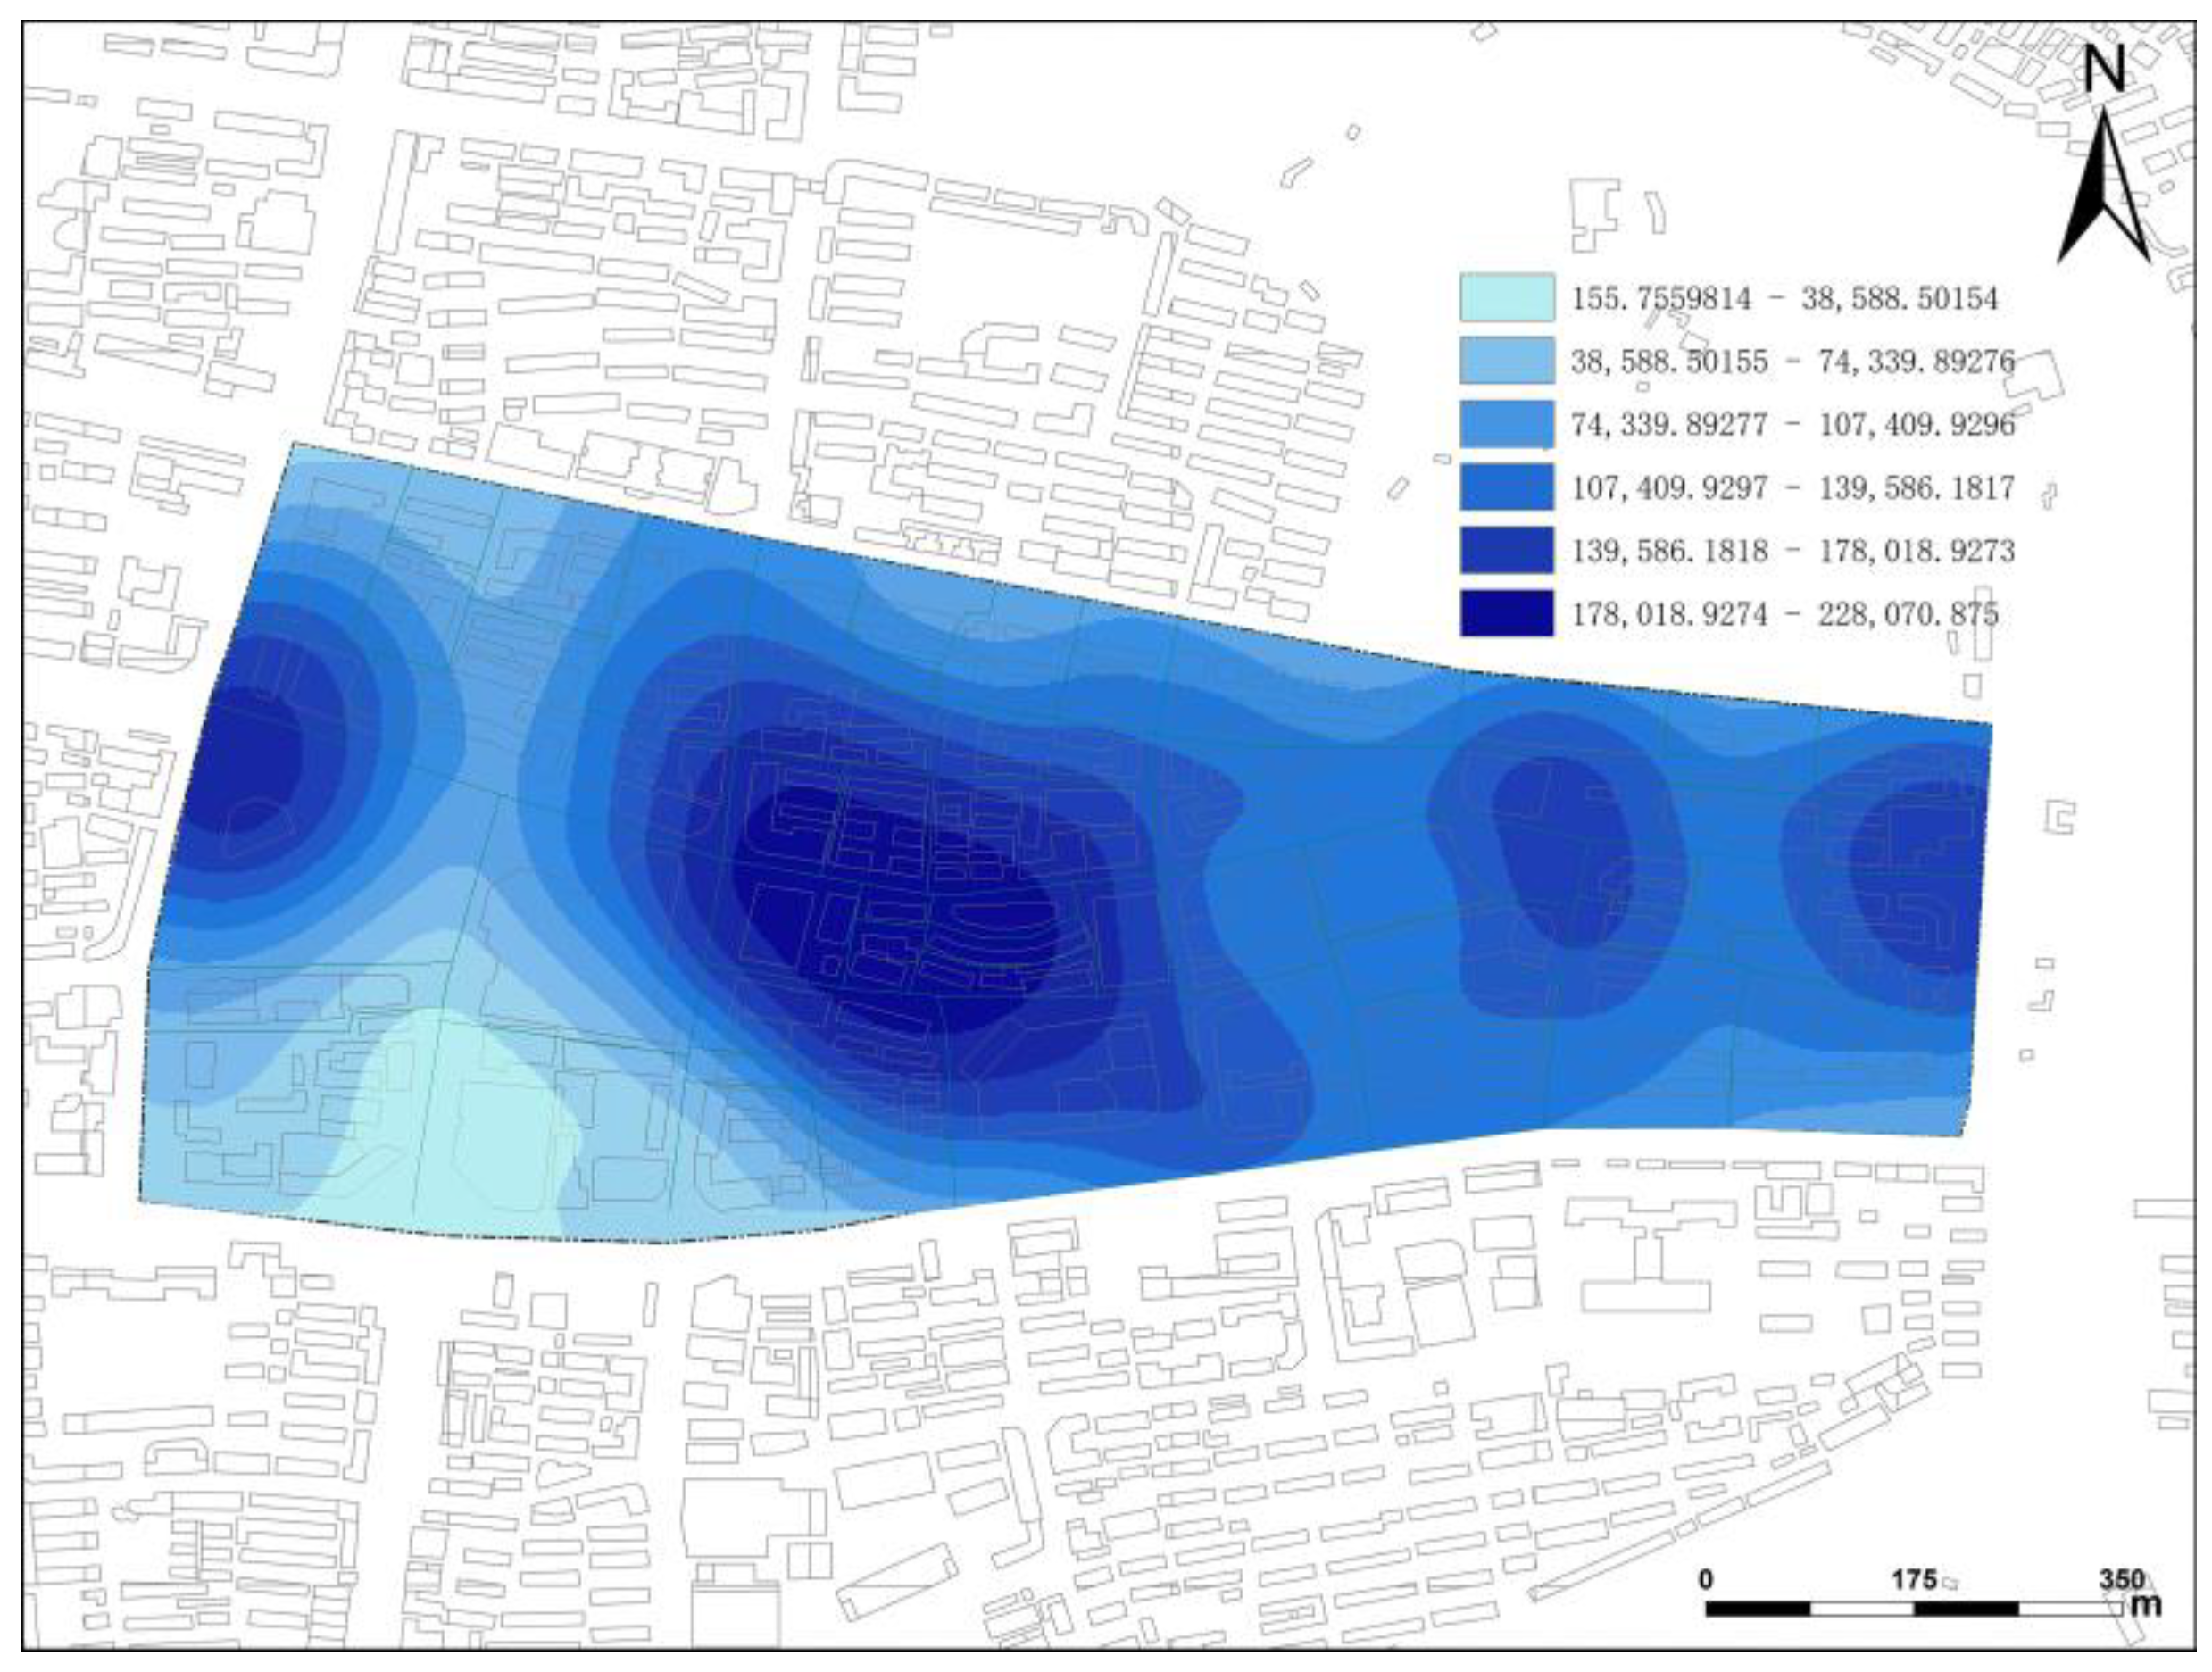
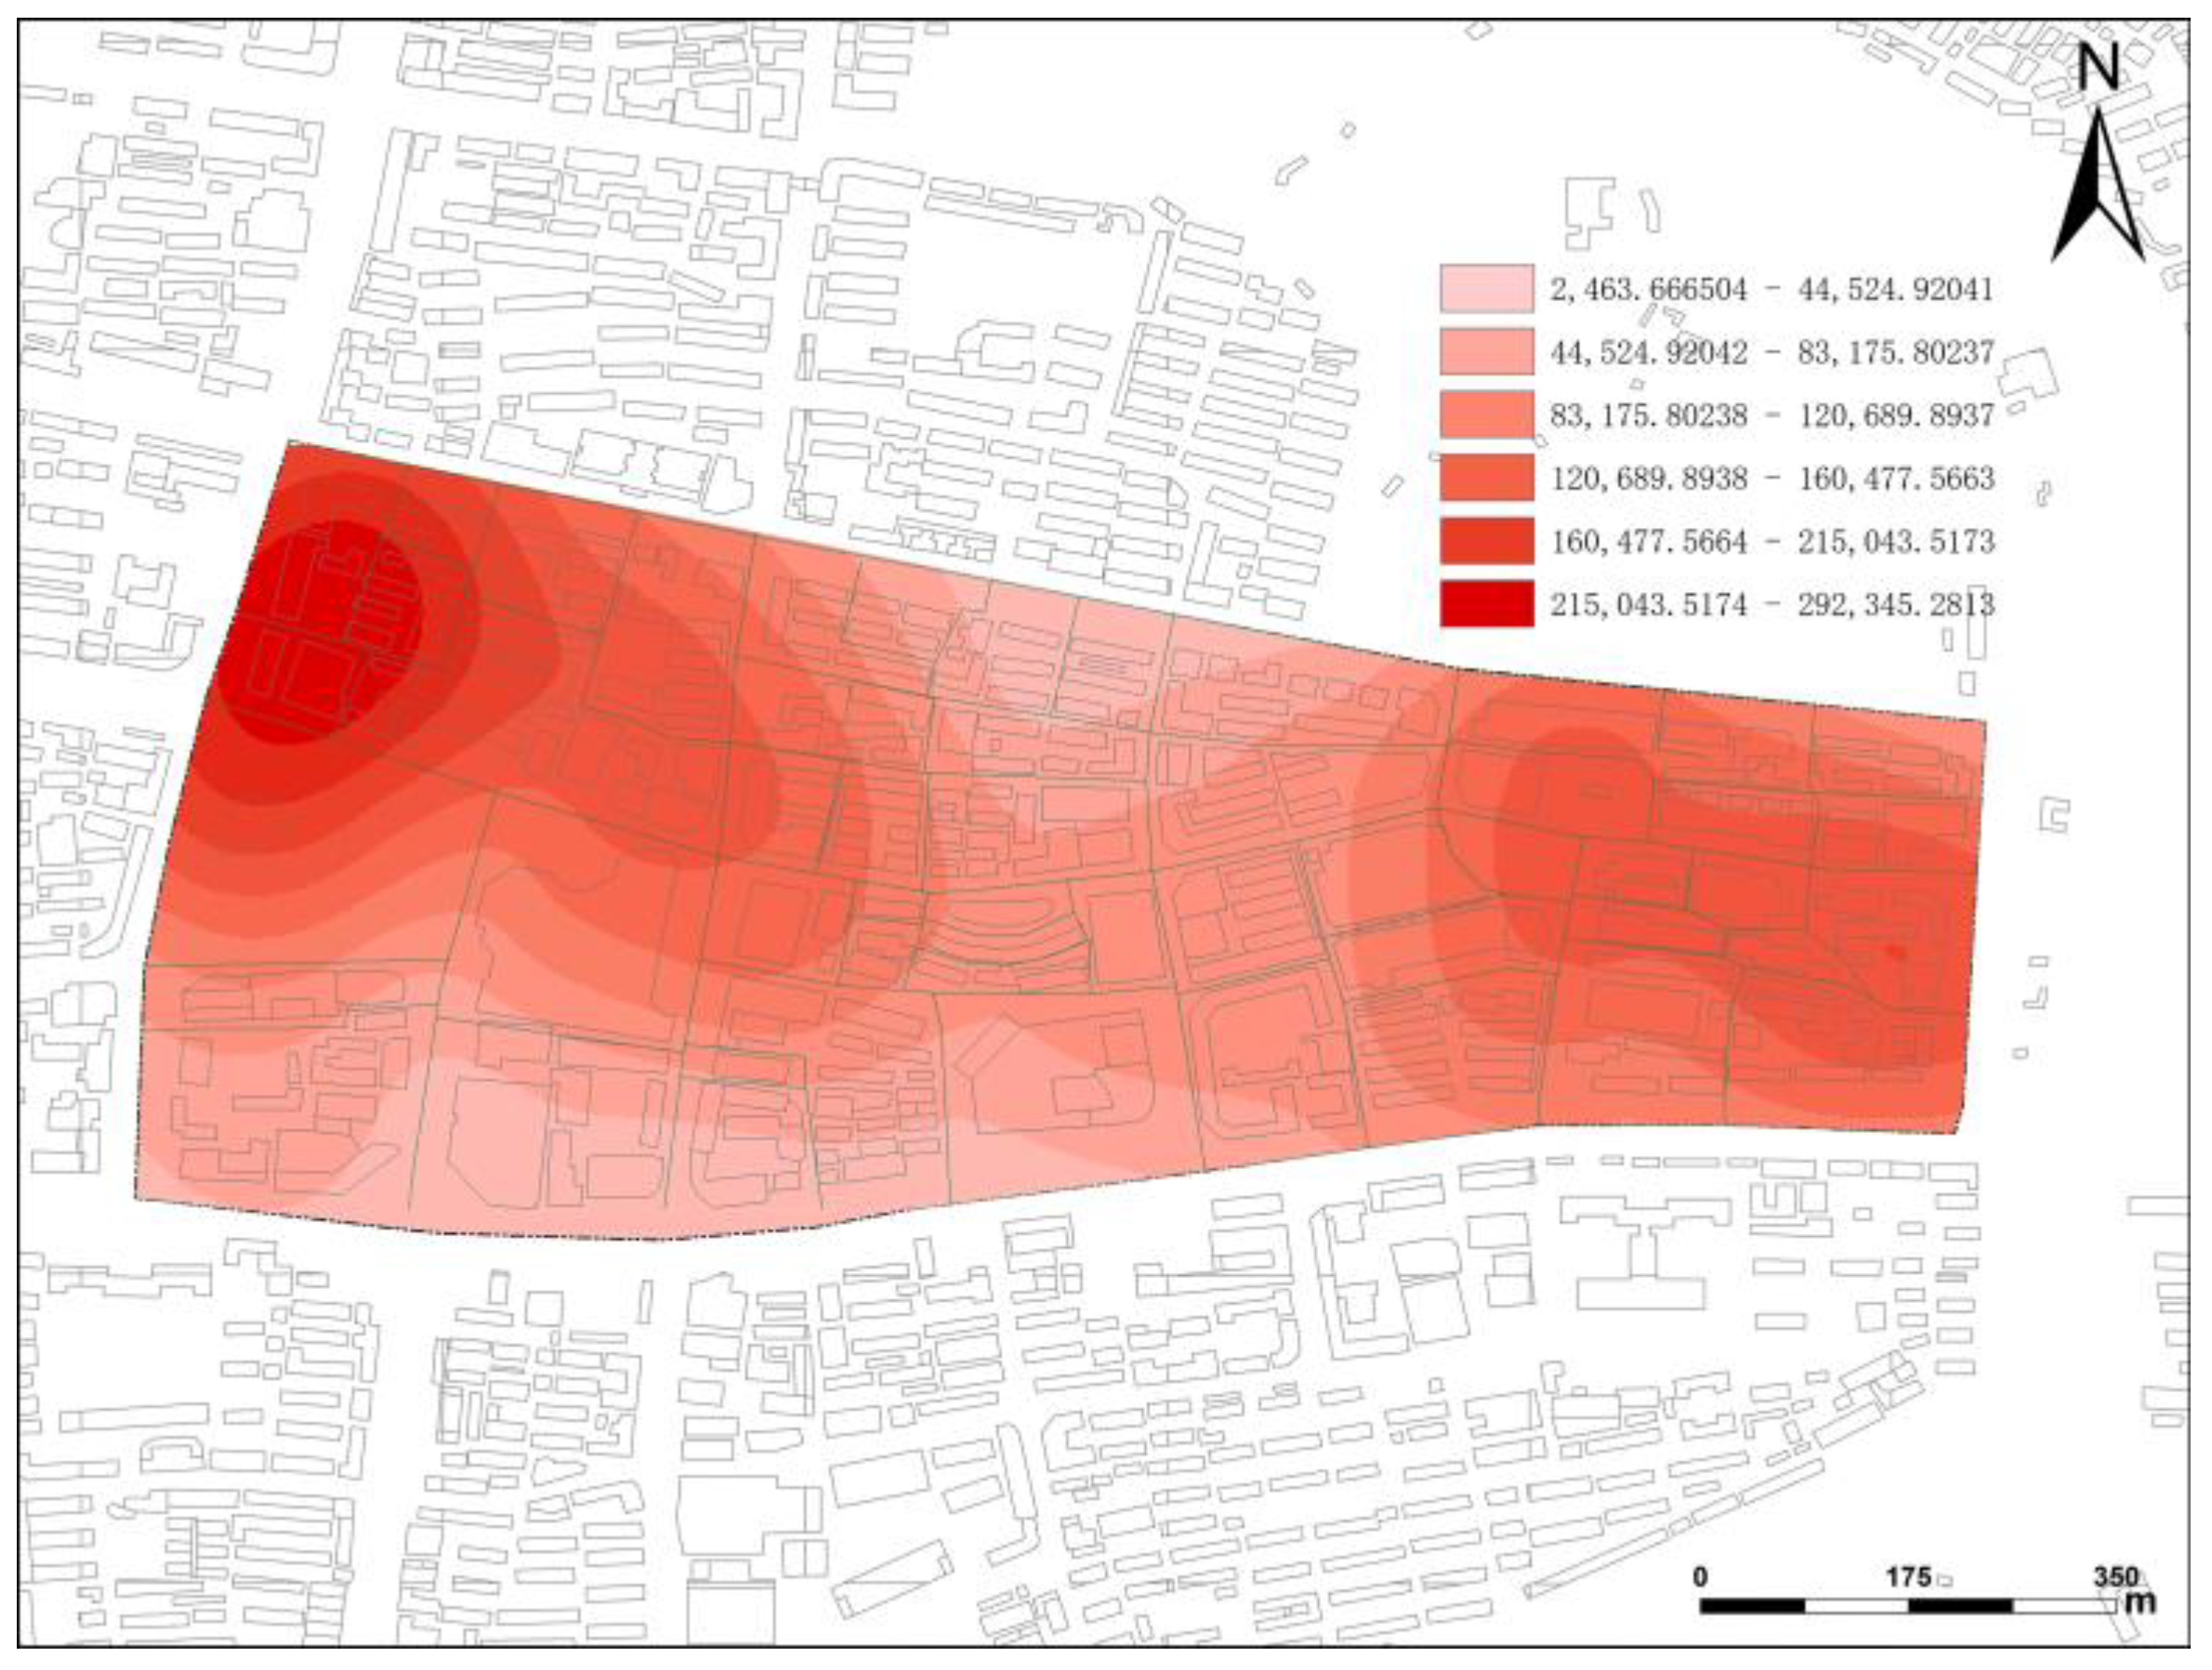
(1) Functional density
The POI data of Huaihe Road Commercial Block were imported into the ArcGIS platform to calculate the spatial kernel density, and the functional density of the commercial block was visualized as shown in
Figure 8. The functional density is more balanced in the commercial block and shows a higher functional density in Intime Center, Parkson Shopping Center, Huaihe Road Pedestrian Street and the north–south street space. In terms of quantity, the top four categories collected within the scope of the research in the commercial block are shopping services, catering services, public life services and leisure services, accounting for 28.22%, 23.13%, 13.95% and 7.09% of all commercial forms in the commercial block, respectively. The POI locations of shopping services and catering services present the spatial characteristics of high coverage and high density. They are mostly located around commercial complexes such as Intime Center, Gulou Famous Products Center, Department Store, Parkson Shopping Center and Haiya World and are evenly distributed in Huaihe Road Commercial Block (
Table 4).
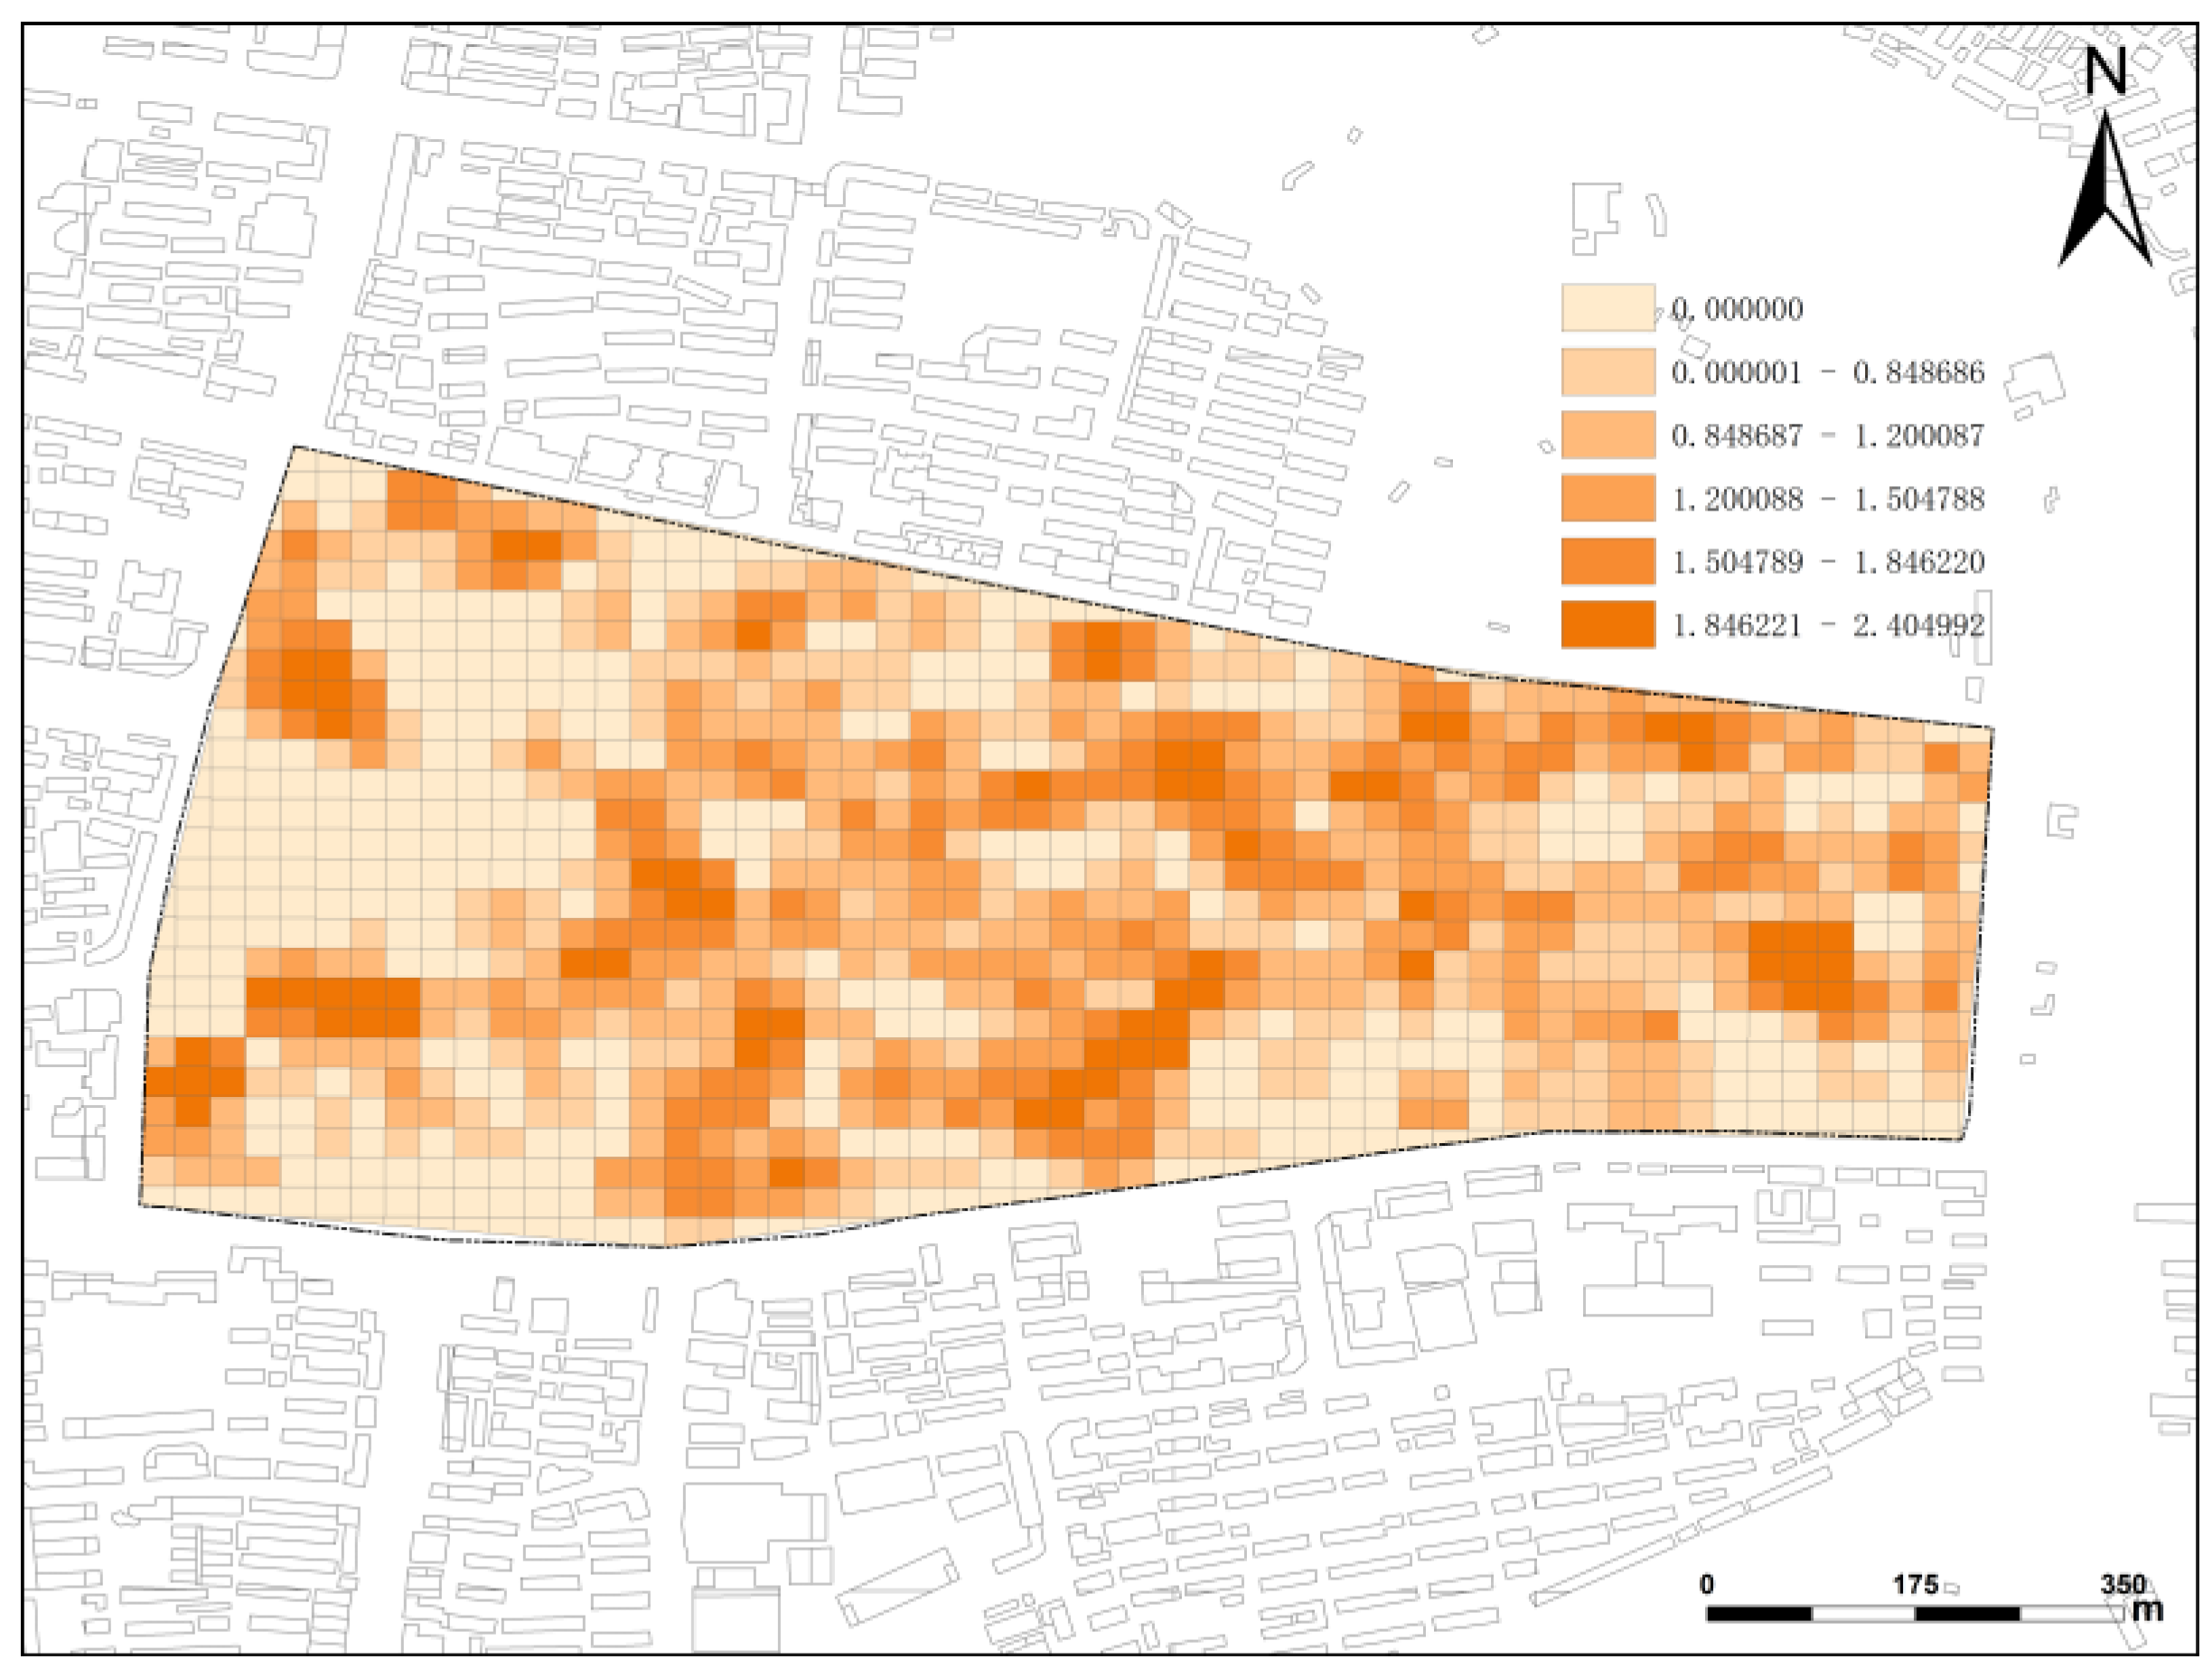
(2) Functional mixture
We selected Huaihe Road Commercial Block as the research scope, divided it into a 25 m × 25 m square fish net unit space, calculated the mixture of functional commercial forms in each unit space of Huaihe Road Commercial Block and finally visualized the functional mixture calculation results of this commercial block. See
Figure 9 for details. The functional commercial form diversity of Huaihe Road Commercial Block is relatively uniform, and the aggregation of areas with very high mixture was avoided accordingly. The functional diversity is mostly distributed at different locations of Huaihe Road Commercial Block, while the areas with low functional mixture are mainly located in residential areas and urban parks and green space. Xiaoyao Shiba Lane and other lane spaces in Huaihe Road Commercial Block are areas with high functional diversity (
Table 5). There are many commercial forms with small-scale shops in the lane space, showing a higher functional mixture. The characteristics of this situation are closely correlated with the scale and structure of shops. These highly mixed areas are spatially dispersed, which can attract the gathering activities of pedestrians in the commercial block from the level of functional diversity and provide a balanced attraction for the development of the commercial block.
4.2.3. Street Space Quality Elements
(1) Green view index
The analysis results of the green view index of Huaihe Road Commercial Block are shown in
Table 6, and the visual diagram is shown in
Figure 10. The spatial distribution of high green view index values is uneven, showing the layout of high values outside but low values inside. Streets with a green view index below 10% occupy a relatively large proportion, while streets with a green view index within the range of 10% to 40% are more evenly distributed. However, there are fewer streets with a green view index in the range of 40% to 80%. Among the above streets, the urban trunk roads along Huaihe Road Commercial Block, such as the streets around the intersection of Middle Changjiang Road, East Huancheng Road, Shouchun Road and Fuyang Road, have a higher greening rate with a maximum of 73.16%, showing a higher greening level. Furthermore, effective vegetation planting conditions are distributed along these streets. However, the areas around Huaihe Road Pedestrian Street and the intersection of Huaihe Road and Suzhou Road have a green view index lower than 10%.
(2) Enclosure
The enclosure analysis results of Huaihe Road Commercial Block are shown in
Table 7, and the visual diagram of the enclosure of the commercial block is shown in
Figure 11. According to these results, the enclosure shows a more balanced spatial distribution as a whole, and the street space enclosure is mostly within the range of 20% to 50%. The enclosure distribution trend is further verified by the statistics of normal distribution, which confirms that Huaihe Road Commercial Block shows a relatively balanced spatial distribution in terms of street enclosure and is free of obvious aggregation or uneven distribution. Most of the areas with a high enclosure are densely distributed on Huaihe Road Pedestrian Street and its associated secondary streets and lanes, such as Shouchun Branch Lane, the east section of Cuozaoshan Lane, and the middle section and east section of Beiyoufang Lane. They show an enclosure in the range of 70% to 90%. Feiqiqiao Lane, Lizhi Lane, Tuanjie Lane and Fenglin Lane also show a high enclosure in the range of 50% to 70%. For these small-scale street environments, an appropriate enclosure can further promote community activity and interaction between people, thereby creating a more prosperous and vivid urban atmosphere.
(3) Sky view factor (SVF)
The sky view factor (SVF) analysis results of Huaihe Road Commercial Block are shown in
Table 8, and the visual diagram is shown in
Figure 12. The SVF shows the multi-core spatial distribution as a whole. The street SVF in Huaihe Road Commercial Block shows an overall downward trend. Streets with SVF of less than 2% are more common, but streets with SVF of 2% to 10% take the largest proportion. The areas with high SVF are located in the middle section of Fuyang Road, the front and middle sections of Huaihe Road Pedestrian Street and East Huancheng Road with the highest SVF of 41.05%. The north section of Fuyang Road and the east section of Middle Changjiang Road have a higher greening rate, and rich urban green space can be found on both sides of these streets. These factors have a certain effect on the street SVF at these two locations, leading to a lower street SVF.
(4) Degree of motorization
The analysis results relating to the degree of motorization of Huaihe Road Commercial Block are shown in
Table 9, and the visual diagram is shown in
Figure 13. According to these results, there is an overall spatial distribution of high degrees outside and low degrees inside. Roads with a degree of motorization around 10% account for the majority. There are only a small number of roads with high and low degrees of motorization. The sections of the commercial block with a higher degree of motorization are mostly distributed in the urban trunk roads, while the streets with a lower degree of motorization are scattered in each area. As typical spatial characteristics, these streets have a smaller spatial scale. The streets with the highest degree of motorization are located at the intersection of Fuyang Road and Shouchun Road, East Huancheng Road, Huaihe Road, Suzhou Road and other places. For these streets, the degree of motorization can reach up to 44.89%. The streets with a high degree of motorization are mainly distributed on the trunk roads of the city. We also noticed that some small-scale streets have a relatively high degree of motorization. In the process of field surveys, we found that these streets are usually packed with cars and electric bicycles. As a result, the traffic easily exceeds the capacity of these streets during rush hours.
5. Analysis of Correlation between Spatial Vitality and Influencing Factors
5.1. Correlation Analysis
In order to make the research more scientific, the street space in Huaihe Road Commercial Block was taken as the basic unit, 17 sections of representative urban roads at different grades in this area were selected and some longer streets were divided. After processing the street space, a total of 27 street samples were obtained. The heat map data collected on the working day of 26 October and the rest day of 28 October were overlaid and subjected to averaging. The heat map data were then mapped to each street, as detailed in
Table 10.
Before the correlation analysis, data normalization was carried out, because the indicator factor data of the internal constituent elements of street space vitality have different magnitudes, and the linear function normalization method is used to normalize the indicator data of the constituent elements, so as to better analyze the correlation between spatial vitality and the constituent elements [
20]. Moreover, the raw data associated with the internal constituent elements of spatial vitality were converted into the numerical range of [0, 1] through the linear function normalization method and proportional scaling. Then, it was calculated using Equation (9):
where
is the result of normalization;
is the raw data set of different dimensions;
is the maximum value in the raw data set;
is the minimum value in the raw data set [
21].
Correlation analysis refers to the analysis of correlation between two different variables and consists of correlation degree and correlation coefficient [
22]. In the research, the correlation between external characteristic elements and internal constituent elements of street vitality was reflected using the Pearson correlation coefficient. The equation used for calculating Pearson correlation coefficient is as follows:
where
is the correlation coefficient of samples to describe the linear correlation degree between two variables. Larger
indicates a stronger correlation between variables. If the value of
is positive, the two variables are positively correlated, which means that the value of one variable increases with the value of the other. If the value of
is negative, the two variables are negatively correlated. If the value of
is zero, the two variables are not linearly correlated. Typically, when
, the correlation coefficient indicates a weak correlation. When
, it indicates a low correlation. When
, it indicates a medium correlation. When
, it indicates a high correlation. If
, it represents a significant correlation. If
is 1, it represents a complete correlation [
23].
5.2. Correlation Analysis
According to the correlation analysis results of street space vitality in
Table 11 and
Table 12, the eight specific spatial vitality evaluation indicators selected by this article show different degrees of correlation with the spatial vitality of the commercial block. Integration, selection, functional density, functional mixture, street sky view factor and street enclosure have a positive correlation with the spatial vitality of Huaihe Road Commercial Block. These indicators are identified as enhancing factors. However, street green view index and degree of motorization show a negative correlation with the spatial vitality of Huaihe Road Commercial Block and are thus defined as inhibiting factors.
These influencing factor indicators share some common features with street spatial vitality in the positive/negative value and actual value of correlations. As one of the indicators, integration has correlation coefficients of 0.585 and 0.532 during working days and rest days, respectively, which causes the most significant effect on the street spatial vitality. The improvement of the urban road network relationship has a positive impact on the spatial vitality of the commercial block. Other indicators, such as functional density, functional mixture and street enclosure, have a moderate effect on the street spatial vitality. They show a moderate correlation since their correlation coefficients are in the range of . In addition, selection and street sky view factor have a weak effect on the street spatial vitality with the correlation coefficients in the range of , indicating a low correlation. For street green view index and degree of motorization, the correlation coefficients to street spatial vitality are in the range of , representing a medium correlation.
According to the comparison and analysis of street spatial vitality correlation results during working days and rest days, the correlation coefficients of integration, functional density, functional mixture, street green view index, street enclosure and other related indicators during working days are larger than those during rest days. However, the correlation coefficients of selection, sky view factor, degree of motorization and other related factors during rest days are larger than those during working days, demonstrating a closer correlation between the activity of pedestrians and these indicators.
It can be seen that strong traffic accessibility, dense and diverse commercial forms and various street facades are sensitive factors for the promotion and maintenance of Huaihe Road Commercial Block, while a broad line of sight and easy access have a greater positive effect on commercial space than environmental greening, and the degree of motorization should be maintained at a reasonable level. Furthermore, it is necessary to optimize and adjust the car spatial scale and the layout of street greening and to reduce the effect on the street spatial vitality to an appropriate level. All above studies and analyses represent a preliminary exploration into the spatial vitality evaluation system of modern commercial blocks. In this process, we have verified that spatial vitality is the result of the interactions among multiple influencing factors. An aggregation of different factors, such as planning and design, commercial layout and publicity and operation, is indispensable for the establishment of a commercial block full of vitality.
6. Conclusions
This study investigated the factors influencing the spatial vitality of Huaihe Road Commercial Block and developed an evaluation system for its spatial vitality. Utilizing the spatial syntax software Depthmap, street view semantic recognition technology and ArcGIS, this study delved into the factors impacting the spatial vitality of the commercial street area on Huaihe Road in Hefei city. Various specific indicators such as integration, selection, functional density, functional mixture, street green view index, street openness, street enclosure and street motorization degree were measured and calculated using multiple data sources. The calculated results were then analyzed through feature analysis and multi-factor correlation analysis.
The findings revealed that the spatial vitality of Huaihe Road Commercial Block is higher on weekends compared to weekdays, with human activities concentrated around the Huaihe Road pedestrian street, the Yintai commercial complex and the Parkson Shopping Center square. Integration, selection, functional density, functional mixture, street openness and street enclosure were positively correlated with the street spatial vitality of Huaihe Road Commercial Block, while street green view index and motorization degree showed a negative correlation. Integration exhibited the most significant association with spatial vitality, followed by street enclosure, street green view index, motorization degree, functional density and functional mixture. Selectivity and street openness had a smaller impact on street spatial vitality.
Moreover, this study aimed to offer new insights for urban planning and design in commercial street areas. The rejuvenation of old commercial street areas in China is imperative. Designers should create appealing commercial street environments by optimizing street layouts, enhancing commercial facilities and designing public spaces meticulously to stimulate the development of commercial functions and improve consumer experiences.
Lastly, the spatial vitality-related indicator system developed in this study is specifically applicable to Huaihe Road Commercial Block and may have limitations when applied to urban street areas at varying developmental stages. Future research on the spatial vitality of different commercial street areas should refine constituent elements, introduce additional evaluation indicators and establish a more comprehensive evaluation system. Various analytical methods should be employed to analyze the mechanisms of influencing factors, thereby enhancing the effectiveness and reliability of research results.
Author Contributions
Conceptualization, Q.Z.; Writing—original draft, Y.Z. All authors have read and agreed to the published version of the manuscript.
Funding
This research was supported by the Anhui Province Housing Urban and Rural Construction Science and Technology Plan Project (2022-RK009) and the Anhui Province Higher Education Scientific Research Key Project (2022AH050254).
Institutional Review Board Statement
Not applicable.
Informed Consent Statement
Not applicable.
Data Availability Statement
The data used to support the findings of this study are included within this article.
Acknowledgments
The authors are grateful to the team members of the Research Center for Urban.
Conflicts of Interest
The authors declare no conflicts of interest.
References
- He, Z.; He, J.; Chen, X. Design strategy of old city commercial block based on field theory: Old city renewal and Lingnan commercial block design in Shilong Town, Dongguan. Huazhong Archit. 2014, 32, 110–114. [Google Scholar]
- Xiao, J.; Xuan, W.; Kong, Z.; Zhao, L.; Yao, Y. Research on correlation mechanism of commercial space vitality based on multi-source data. Ind. Build. 2023, 53, 59–65. [Google Scholar]
- Long, Y.; Ye, Y. Human-scale urban form: Measurement, effect evaluation and planning design response. South Archit. 2016, 5, 41–47. [Google Scholar]
- Long, Y.; Zhou, Y. Quantitative evaluation of street vitality and analysis of influencing factors: A case study of Chengdu. New Archit. 2016, 1, 52–57. [Google Scholar]
- Zhou, Q.; Zheng, Y. Research on the spatial layout optimization strategy of Huaihe Road Commercial Block in Hefei city based on space syntax theory#13. Front. Comput. Neurosci. 2023, 16, 1084279. [Google Scholar] [PubMed]
- Elshater, A. Food consumption in the everyday life of liveable cities: Design implications for conviviality. J. Urban. Int. Res. Placemaking Urban Sustain. 2020, 13, 68–96. [Google Scholar] [CrossRef]
- Wu, G.; Niu, X. Research on the influence of functional diversity of established environments on street vitality: A case study of West Nanjing Road in Shanghai. South Archit. 2019, 2, 81–86. [Google Scholar]
- Wu, Z.; Ye, Z. Research on urban spatial structure based on Baidu heat map: A case study on the central city of Shanghai. City Plan. Rev. 2016, 40, 33–40. [Google Scholar]
- Wang, F.; Gao, X.; Xu, Z. Identification and classification of urban commercial districts and their spatial distribution pattern based on block scale: A case study of Beijing. Geogr. Res. 2015, 34, 1125–1134. [Google Scholar]
- Yu, Y.; Zhang, X.; Zeng, W. Human-scale Quality on Streets:A Large-scale and Efficient Analytical Approach Based on Street View Images and New Urban Analytical Tools. Urban Plan. Int. 2019, 34, 18–27. [Google Scholar]
- Chi, J.; Jiao, L.; Dong, T.; Gu, Y.; Ma, Y. Quantitative Identification and Visualization of Urban Functional Area Based on POI Data. J. Geomat. 2016, 41, 68–73. [Google Scholar]
- Chen, W.; Liu, L.; Liang, Y. Hotspot identification and format agglomeration characteristics analysis of Guangzhou retail business center based on POI data. Geogr. Res. 2016, 35, 703–716. [Google Scholar]
- Ye, M.; Li, Z.; Zeng, R.; Zeng, J. Research on the correlation of pedestrian action characteristics and spatial elements in cultural commercial blocks: A case study of “Hefei · Goldland 1912”. Archit. J. 2013, 9 (Suppl. S1), 85–89. [Google Scholar]
- Hillier, B. Space is the Machine: A Configurational Theory of Architecture; Cambridge University Press: London, UK, 1996. [Google Scholar]
- Hillier, B.; Qiang, S. The Now and Future of Space Syntax. Archit. J. 2014, 08, 60–65. [Google Scholar]
- Ye, Y.; Zhuang, Y. A Hypothesis of Urban Morphogenesis and Urban Vitality in Newly Built-up Areas: Analyses Based on Street Accessibility, Building Density and Functional Mixture. Urban Plan. Int. 2017, 32, 43–49. [Google Scholar] [CrossRef]
- Hu, A.; Dai, W.; Guo, Z.; Niu, S.; Yan, Z.; Li, X. Large-scale measures of spatial visual quality of urban living streets. J. Huaqiao Univ. (Nat. Sci. Ed.) 2021, 42, 483–493. [Google Scholar]
- Wang, B.; Zhen, F.; Zhang, H. The Dynamic Changes of Urban Space-time Activity and Activity Zoning Based on Check-in Data in Sina Web. Sci. Geogr. Sin. 2015, 35, 151–160. [Google Scholar]
- Sheng, Q.; Yang, Z.; Lu, A.; Chang, L. The application of network open data in the analysis of urban commercial vitality space syntax. New Archit. 2018, 3, 9–14. [Google Scholar]
- Sun, G.; Zhou, X.; Zhou, W.; Li, C.; Chen, J. Local-overall joint evaluation of commercial street quality using multi-source data. Remote Sens. Inf. 2021, 36, 135–143. [Google Scholar]
- Fan, L.; Zhang, D.Y.; Huang, T.; Zhang, X.; Zhang, R.M. Research on the influencing factors of urban street public space quality and vitality under the background of big data: A case study of Zhanlan Road Subdistrict in Beijing. Huazhong Archit. 2022, 40, 57–62. [Google Scholar]
- Liu, J.B.; Zhang, X.; Cao, J.; Chen, L. Mean First-Passage Time and Robustness of Complex Cellular Mobile Communication Network. IEEE Trans. Netw. Sci. Eng. 2024, 1–12. [Google Scholar] [CrossRef]
- Liu, J.B.; Zheng, Y.Q.; Lee, C.C. Statistical analysis of the regional air quality index of Yangtze River Delta based on complex network theory. Appl. Energy 2024, 357, 122529. [Google Scholar] [CrossRef]
Figure 1.
Location and research scope of Huaihe Road Commercial Block.
Figure 1.
Location and research scope of Huaihe Road Commercial Block.
Figure 2.
Schematic diagram of spatial vitality relationship and evaluation dimension of commercial block.
Figure 2.
Schematic diagram of spatial vitality relationship and evaluation dimension of commercial block.
Figure 3.
Heat map assignments.
Figure 3.
Heat map assignments.
Figure 4.
Spatial vitality distribution characteristics of the commercial block during working days.
Figure 4.
Spatial vitality distribution characteristics of the commercial block during working days.
Figure 5.
Spatial vitality distribution characteristics of the commercial block during rest days.
Figure 5.
Spatial vitality distribution characteristics of the commercial block during rest days.
Figure 6.
Visual diagram of integrations of Huaihe Road Commercial Block.
Figure 6.
Visual diagram of integrations of Huaihe Road Commercial Block.
Figure 7.
Visual diagram of selections of Huaihe Road Commercial Block.
Figure 7.
Visual diagram of selections of Huaihe Road Commercial Block.
Figure 8.
Visual diagram of the functional density of Huaihe Road Commercial Block.
Figure 8.
Visual diagram of the functional density of Huaihe Road Commercial Block.
Figure 9.
Visual diagram of the functional mixture of Huaihe Road Commercial Block.
Figure 9.
Visual diagram of the functional mixture of Huaihe Road Commercial Block.
Figure 10.
Visual diagram of the green view index of Huaihe Road Commercial Block.
Figure 10.
Visual diagram of the green view index of Huaihe Road Commercial Block.
Figure 11.
Visual diagram of the enclosure of Huaihe Road Commercial Block.
Figure 11.
Visual diagram of the enclosure of Huaihe Road Commercial Block.
Figure 12.
Visual diagram of SVF of Huaihe Road Commercial Block.
Figure 12.
Visual diagram of SVF of Huaihe Road Commercial Block.
Figure 13.
Visual diagram of the degree of motorization of Huaihe Road Commercial Block.
Figure 13.
Visual diagram of the degree of motorization of Huaihe Road Commercial Block.
Table 1.
Indicator list of external characteristic elements and internal constituent elements for the spatial vitality of this commercial block.
Table 1.
Indicator list of external characteristic elements and internal constituent elements for the spatial vitality of this commercial block.
| Elements Relating to the Spatial Vitality of This Commercial Block | Evaluation Elements | Evaluation Indicators | Indicator Descriptions |
|---|
| External characteristic elements of the spatial vitality of this commercial block | Heat maps of the commercial block | Spatial activity | Spatial pedestrian gathering |
| Internal constituent elements of the spatial vitality of this commercial block | Road network configuration of this commercial block | Integration | Connection of the space with the surrounding areas |
| Selection | Traffic potential of the space in the entire area |
| Functional commercial form of this commercial block | Functional density | Shop density in the space |
| Functional mixture | Richness of types of commercial forms in the space |
| Street space quality | Green view index | Visual greening in the space |
| Enclosure | Proportion of the enclosure consisting of visual buildings, walls and other structures in the space |
| Sky view factor (SVF) | Ratio of visual sky in the space |
| Degree of motorization | Ratio of visual motor vehicles and urban roads in the space to the street space |
Table 2.
Integrations of Huaihe Road Commercial Block.
Table 2.
Integrations of Huaihe Road Commercial Block.
| Indicator Name | Value |
|---|
| Mean value | 0.849288 |
| Maximum value | 1.227375 |
| Minimum value | 0.549911 |
| Standard deviation | 0.142957 |
Table 3.
Selections of Huaihe Road Commercial Block.
Table 3.
Selections of Huaihe Road Commercial Block.
| Indicator Name | Value |
|---|
| Mean value | 0.071523 |
| Maximum value | 0.379601 |
| Minimum value | 0 |
| Standard deviation | 0.080159 |
Table 4.
Proportions of main commercial forms in Huaihe Road Commercial Block.
Table 4.
Proportions of main commercial forms in Huaihe Road Commercial Block.
| Name of Commercial Form | Value |
|---|
| Shopping services | 28.22% |
| Catering services | 23.13% |
| Public life services | 13.95% |
| Leisure services | 7.09% |
Table 5.
Functional mixture of Huaihe Road Commercial Block.
Table 5.
Functional mixture of Huaihe Road Commercial Block.
| Indicator Name | Value |
|---|
| Mean value | 0.774029 |
| Maximum value | 2.404992 |
| Minimum value | 0 |
| Standard deviation | 0.680125 |
Table 6.
Green view index of Huaihe Road Commercial Block.
Table 6.
Green view index of Huaihe Road Commercial Block.
| Indicator Name | Value |
|---|
| Mean value | 0.171249 |
| Maximum value | 0.731558 |
| Minimum value | 0 |
| Standard deviation | 0.164185 |
Table 7.
Enclosures of Huaihe Road Commercial Block.
Table 7.
Enclosures of Huaihe Road Commercial Block.
| Indicator Name | Value |
|---|
| Mean value | 0.460856 |
| Maximum value | 0.89514 |
| Minimum value | 0.015732 |
| Standard deviation | 0.226163 |
Table 8.
SVF of Huaihe Road Commercial Block.
Table 8.
SVF of Huaihe Road Commercial Block.
| Indicator Name | Value |
|---|
| Mean value | 0.103492 |
| Maximum value | 0.410498 |
| Minimum value | 0 |
| Standard deviation | 0.093956 |
Table 9.
Degrees of motorization of Huaihe Road Commercial Block.
Table 9.
Degrees of motorization of Huaihe Road Commercial Block.
| Indicator Name | Value |
|---|
| Mean value | 0.128743 |
| Maximum value | 0.448879 |
| Minimum value | 0 |
| Standard deviation | 0.117774 |
Table 10.
Classification of streets around Huaihe Road Commercial Block.
Table 10.
Classification of streets around Huaihe Road Commercial Block.
| Street Name | Street Length (M) | Mean Heat Value on Working Days | Mean Heat Value on Rest Days |
|---|
| Section ① of Middle Changjiang Road (East Huancheng Road–Jiushiqiao Street) | 300 | 2.38 | 3.42 |
| Section ② of Middle Changjiang Road (Jiushiqiao Street–North Hanshan Road) | 249 | 4.00 | 3.83 |
| Section ③ of Middle Changjiang Road (North Hanshan Road–Suzhou Road) | 380 | 5.26 | 5.35 |
| Section ④ of Middle Changjiang Road (Suzhou Road–Fuyang Road) | 383 | 4.07 | 4.25 |
| Section ① of Fuyang Road (Middle Changjiang Road–Huaihe Road) | 405 | 3.38 | 3.51 |
| Section ② of Fuyang Road (Huaihe Road–Shouchun Road) | 220 | 4.45 | 4.49 |
| Section ① of Shouchun Road (Fuyang Road–Suzhou Road) | 350 | 4.01 | 3.55 |
| Section ② of Shouchun Road (Suzhou Road–North Hanshan Road) | 302 | 4.66 | 4.93 |
| Section ③ of Shouchun Road (North Hanshan Road–Xiaoyaojin Road) | 227 | 4.51 | 5.21 |
| Section ④ of Shouchun Road (Xiaoyaojin Road–East Huancheng Road) | 366 | 3.66 | 4.63 |
| Section ① of East Huancheng Road (Shouchun Road–Huaihe Road Pedestrian Street) | 139 | 3.68 | 4.34 |
| Section ② of East Huancheng Road (Huaihe Road Pedestrian Street–Middle Changjiang Road) | 177 | 3.48 | 4.21 |
| Section ① of Suzhou Road (Shouchun Road–Huaihe Road) | 248 | 5.09 | 4.88 |
| Section ② of Suzhou Road (Huaihe Road–Middle Changjiang Road) | 306 | 4.45 | 4.13 |
| Section ① of North Hanshan Road (Shouchun Road–Huaihe Road Pedestrian Street) | 209 | 5.03 | 4.89 |
| Section ② of North Hanshan Road (Huaihe Road Pedestrian Street–Middle Changjiang Road) | 234 | 4.85 | 4.62 |
| Section ① of Huaihe Road Pedestrian Street (Suzhou Road–North Hanshan Road) | 320 | 5.07 | 5.00 |
| Section ② of Huaihe Road Pedestrian (North Hanshan Road–Parkson Shopping Plaza) | 312 | 5.17 | 5.51 |
| Section ③ of Huaihe Road Pedestrian Street (Parkson Shopping Plaza–East Huancheng Road) | 284 | 4.60 | 4.92 |
| Anqing Road | 215 | 3.41 | 3.59 |
| Jiushiqiao Street | 167 | 3.22 | 3.47 |
| Xiaoyaojin Road | 105 | 5.00 | 5.47 |
| Cuozaoshan Lane | 290 | 4.43 | 4.47 |
| Beiyoufang Lane | 512 | 4.73 | 4.86 |
| Lizhi Lane | 380 | 4.58 | 4.67 |
| Zhongcaishi Lane | 335 | 4.67 | 4.62 |
| Qinlao Lane | 286 | 3.55 | 4.21 |
Table 11.
Correlation analysis of street spatial vitality during working days.
Table 11.
Correlation analysis of street spatial vitality during working days.
| Influencing Factor Indicator | Pearson Correlation (r) | Significance (P) | Correlation |
|---|
| Integration | 0.585 ** | 0.001 | High correlation |
| Selection | 0.245 | 0.200 | Low correlation |
| Functional density | 0.398 ** | 0.032 | Medium correlation |
| Functional mixture | 0.368 ** | 0.050 | Medium correlation |
| Street green view index | −0.455 ** | 0.013 | Medium correlation |
| Street SVF | 0.119 | 0.537 | Low correlation |
| Street enclosure | 0.474 ** | 0.009 | Medium correlation |
| Street degree of motorization | −0.337 | 0.073 | Medium correlation |
Table 12.
Correlation analysis of street spatial vitality during rest days.
Table 12.
Correlation analysis of street spatial vitality during rest days.
| Influencing Factor Indicator | Pearson Correlation (r) | Significance (P) | Correlation |
|---|
| Integration | 0.532 ** | 0.003 | High correlation |
| Selection | 0.298 | 0.116 | Low correlation |
| Functional density | 0.324 | 0.087 | Medium correlation |
| Functional mixture | 0.322 | 0.088 | Medium correlation |
| Street green view index | −0.422 ** | 0.023 | Medium correlation |
| Street SVF | 0.121 | 0.533 | Low correlation |
| Street enclosure | 0.418 * | 0.024 | Medium correlation |
| Street degree of motorization | −0.367 * | 0.050 | Medium correlation |
| Disclaimer/Publisher’s Note: The statements, opinions and data contained in all publications are solely those of the individual author(s) and contributor(s) and not of MDPI and/or the editor(s). MDPI and/or the editor(s) disclaim responsibility for any injury to people or property resulting from any ideas, methods, instructions or products referred to in the content. |
© 2024 by the authors. Licensee MDPI, Basel, Switzerland. This article is an open access article distributed under the terms and conditions of the Creative Commons Attribution (CC BY) license (https://creativecommons.org/licenses/by/4.0/).


