Article

Systematic Characterization of Cow Manure Biochar and Its Effect on Salicornia herbacea L. Growth

1
Institute of Carbon Technology, Jeonju University, Jeonju 55069, Republic of Korea
2
Department of AgroAI, Jeonju University, Jeonju 55069, Republic of Korea
3
Graduate School of Carbon Convergence Engineering, Jeonju University, Jeonju 55069, Republic of Korea
*
Authors to whom correspondence should be addressed.
Sustainability 2024, 16(8), 3396; https://doi.org/10.3390/su16083396
Submission received: 18 December 2023 / Revised: 1 April 2024 / Accepted: 16 April 2024 / Published: 18 April 2024

Abstract

:
This study investigated the potential of biochar as a sustainable material for waste utilization and carbon sequestration in soil. Biochar was prepared from cow manure (CM) and applied to the soil. Biochar was processed by subjecting CM to various temperature ranges (400 [CMB400], 550 [CMB550], and 700 °C [CMB700]) under nitrogen gas (allowed to flow to restrict oxygen), with residence time set to 3 h. The characteristics of the biochar produced at each temperature were analyzed. The experiment was conducted for approximately 15 weeks with the laboratory temperature maintained between 24 and 26 °C. The growth rate of plants was obtained by measuring their length weekly, starting 4 weeks after crop establishment. CMB550 exhibited the highest specific surface area (117.57 m2 g−1) and well-distributed pore size; therefore, it was mixed with the soil at a specific ratio and put in pots for the planting of Salicornia herbacea L. (glasswort) in the laboratory. The results demonstrated that adding biochar to soil increased plant growth and that the biochar could store organic carbon. In addition, an investigation of heavy metals demonstrated that samples with biochar had lower heavy metal concentrations in glasswort than those without because of the potential of biochar to adsorb heavy metals. By interacting with heavy metal ions in soil solution, the reactive sites and functional groups on the surface of biochar immobilize them and lessen their potentially detrimental effects on plant growth. Overall, biochar has the potential to be a valuable resource for waste management and environmental improvement.

1. Introduction

Due to increased global warming, Korea aims for a carbon-free state by 2050, in line with Article 15 of the Framework Act on Carbon Neutrality. Korea aims for a 40% reduction in greenhouse gas emissions by 2030 compared with 2018 and to achieve net-zero domestic greenhouse gas emissions by 2050 [1]. Therefore, there is a need to reduce greenhouse gas emissions by 55.1–84.6 million tons through CO2 capture, utilization, and storage [2]. CO2 capture is essential because this compound has unique properties and accounts for 55% of greenhouse gases causing the greenhouse effect. The United States of America National Oceanic and Atmospheric Administration has identified CO2 as a significant contributor to global warming [3]. Korea’s targets and strategies underscore a commitment to combating climate change by addressing CO2 emissions and embracing innovative approaches in capturing, utilizing, and storing this greenhouse gas.
Therefore, biochar can be used to drive the carbon cycle in the negative direction. Biochar is a solid material produced through the pyrolysis of various biomass, including wood, food waste, sludge, and livestock manure, under anaerobic conditions [4]. Biochar is a material made up mostly of carbon because it is manufactured at high temperatures and has a long residence time. The most representative feature of biochar is that it is a porous material; biochar can capture CO2 owing to its porosity [5,6,7,8,9]. According to Lehmann [6], ordinary photosynthetic plants have a carbon recovery rate of 0%, whereas that of biochar is 25% [10]. Biochar is composed mostly of carbon. Therefore, biochar in the soil stores adequate carbon but can be used more effectively to capture CO2 [6,10]. Additionally, biochar is resistant to degradation by microorganisms and does not easily decompose [11]. For example, after burying biochar, approximately 20% of the fixed carbon remains after mineralization, allowing CO2 to be semi-permanently or permanently preserved [12]. Generally, soils suitable for plant growth, such as loam or topsoil, contain approximately 15 g/kg of organic carbon. However, soil biochar application significantly increases the organic carbon content [13,14,15], positively affecting soil microbial growth and enhancing carbon storage [8,15]. Thus, the organic carbon content is an important indicator to consider in soil applications of biochar.
Due to these various advantages of biochar and the recent worsening of global warming, interest in applying biochar to soil is increasing [16,17]. Therefore, biochar is being effectively used as a soil conditioner in Korea due to its beneficial effects [16]. Biochar releases nutrients slowly over time, improving soil fertility and enhancing plant nutrition. Moreover, biochar produced from animal manure, such as cow manure (CM), can replace traditional fertilizers because it is rich in nutrients [15]. The porous structure of biochar allows the physical retention of water, which can be advantageous in regions with limited water availability, providing a water reservoir for uptake by plants [4]. Biochar improves soil fertility and enhances plant nutrition by slowly releasing nutrients over time. Previous studies have highlighted the potential of biochar to adsorb and purify heavy metals in soils because of its porous structure [14,18,19,20]. Biochar adsorbs heavy metals, purifies the soil, and promotes plant growth [13,18]. Studies have been conducted on the effects of biochar on plant growth [21,22,23,24,25], including its effectiveness at reducing soil Mn and Zn levels [16].
In mixed agricultural systems, the majority of livestock-related goods come from animals fed on local resources including grassland, crop wastes, and shrubs and trees that make good feedstock. Crop leftovers and fodder make up the majority of the feed for these animals, while the dung and urine of the farm animals—cows, bullocks, and milk buffaloes—enrich the soil [26]. Manure is an essential component for both maintaining and enhancing soil fertility. Manure has numerous vital minerals such as calcium, magnesium, sulfur, zinc, boron, copper, and magnesium in addition to the three main plant nutrients of nitrogen, phosphorus, and potassium (NPK) [27]. In addition, applying cow manure and vermicompost raises the organic matter content of the soil, which enhances cation exchange capacity, water infiltration, and water retention capacity. If this cow manure is not adequately handled, it causes problems for the environment. However, with the right recovery system in place, the organic matter resulting from cow dung might be turned into a valuable resource [28]. It is common knowledge that garbage disposal contributes to environmental cleaning and that handling solid waste could have positive social effects.
Salicornia herbacea L. (glasswort) is a good model plant for studying the effects of biochar application in the soil. Glasswort is an annual plant belonging to the goat plant family and is commonly known as ‘Hamcho’ or ‘slender glasswort’ owing to its round leaves, stems, and nodes [29]. Glasswort is a halophyte and lives in colonies near salterns and tidal flats on Jeju Island (on the south coast) and the west coast of Korea. It requires high moisture. Glasswort is suitable for efforts to develop more salt-tolerant crops, increase its agricultural importance, and provide a biofilter for mariculture effluents [29,30]. Moreover, glasswort is used in the food and medical industries. Its biomass, seed, oil, and ethanol yields have also been presented to highlight its profitability as a sustainable crop [29]. In addition, ecological applications in aquaculture and phytoremediation have been discussed, and applications in food, pharmacy, ecology, chemical, and cosmetic sectors have also been presented [30]. Furthermore, it can be grown where freshwater resources are scarce [30].
This study focuses on producing biochar derived from cow manure, an agricultural by-product. Biochar generally uses wood with a high lignin content as biomass. Therefore, studies exploring the utilization of livestock manure for biochar production are still limited [31]. This study aims to address this gap by specifically characterizing livestock manure before its conversion into biochar. Next, this study analyzes the use of biochar produced from cow dung and its effect on the storage capacity of organic matter in the soil matrix and then incorporates biochar produced from cow dung into the soil. Additionally, we seek to understand the impact on the growth parameters of Salicornia plants and to investigate the impact of the application of biochar derived from livestock manure on the concentration levels of heavy metals present in Salicornia plants. By characterizing livestock manure before its conversion into biochar and evaluating these different parameters, this study aims to provide valuable insights into the potential applications and impacts of biochar specifically extracted from livestock manure. This study explores the impact on organic matter storage, plant growth, and heavy metal levels within sustainable agricultural practices.

2. Materials and Methods

2.1. Materials

The cow manure (CM) used in the present study was sourced from a livestock farm in Jeollabuk-do, South Korea, and stored at −20 °C to maintain its integrity. Pretreatment was performed by drying the samples. Commercial soil was purchased from Nongkyung Company, Jincheon, Chungcheongbuk-do, Republic of Korea. The soil composition was as follows: coco peat (55–60%), peat moss (15–20%), perlite (5–10%), vermiculite (5–10%), zeolite G (5–10%), and zeolite P (5–10%). The glasswort seeds were purchased from a horticultural farm in Jeollabuk-do, South Korea, and used for cultivation and subsequent experimentation.

2.2. Biochar Preparation

During the drying process, the CM was oven-dried at 105 °C (VS-9500H, VISION SCIENTIFIC, Daejeon-Si, Republic of Korea) for 24 h. Next, the dried CM was transferred to an electric furnace (OTF-1200X-S, MTI Korea, Seoul, Republic of Korea) and carbonized in a nitrogen gas atmosphere to produce biochar. A schematic diagram of the pyrolysis reactor is presented in Supplementary Figure S1. Nitrogen gas was injected at 10 cc min−1. The cow manure biochar (CMB) was carbonized at 400, 550, and 700 °C for 3 h and designated CMB400, CMB550, and CMB700, respectively.

2.3. Preparation of Soil Enriched with Biochar

Plant growth experiments were conducted to determine the effects of biochar application on soil properties. The soil was hand-mixed with commercial soil and biochar at 3, 5, 7, and 10%. A visual representation of the pots utilized and the soil amalgamation employed in this study is depicted in Figure S2a. In addition, the commercial soil used in these experiments is shown in Figure S2b. The samples used at this time were classified and named as pots (soil) and plants. In the case of soil, the units corresponding to wt.% were added and named control (CMB0%), CMB3%, CMB5%, CMB7%, and CMB10%, and for plants, the number corresponding to the biochar wt.% of the pot was written after the plant. (For example, the glasswort plant grown in soil with 3% CMB was named plant3). Therefore, the plant samples were designated plant0 (control), plant3, plant5, plant7, and plant10, respectively. In this study, the biochar used for soil amendment was derived from a carbonization process at 550 °C due to its high specific surface area and well-distributed pore size compared to other samples.

2.4. Plant Growth Experiment

The experimental pots were positioned within a laboratory environment where the temperature was consistently maintained within the range of 24 to 26 °C. Each pot was submerged in 2 cm of water, and regular monitoring ensured that the water level was sustained by periodic additions. The plants received a daily watering regimen of 10 mm of water. Additionally, a watering schedule was implemented involving two-day intervals over a four-week duration. When the plants displayed chlorosis symptoms, i.e., a yellowing of leaves due to potential nutrient deficiencies, saline water or saltwater was introduced to address these symptoms.

2.5. Characterization

Thermogravimetric analysis (TGA, SDT-650, Ta Instruments, New Castle, DE, USA) was performed to determine the optimal manufacturing temperature for the biochar. First, about 10 mg of the sample was placed in a pan made of alumina on the device, and the crucible was closed to block out external air. Then, it underwent a controlled temperature increase ranging from 30 to 800 °C under a nitrogen gas atmosphere. The biochar yield was calculated according to the Japanese Industrial Standards (JBAS0002-001 (2019)). An elemental analyzer (Flash Smart, Thermo Fisher Scientific, Waltham, MA, USA) was used to analyze the carbon, hydrogen, nitrogen, sulfur, and heavy metal content in both the biomass and biochar, whereas the oxygen content was analyzed using a different elemental analysis device (Flash 2000, Thermo Fisher Scientific, USA). The presence or absence of functional groups and aromatics was confirmed using Fourier transform infrared spectroscopy (FT-IR, FT-IR Spectrum Two, Perkin Elmer, Waltham, MA, USA). For analysis, the biochar was ground in a bowl and made into powder form. Afterward, it was placed on the sample table using a medicine spoon and brought into proper contact with the sample to prevent the laser from escaping. FT-IR analysis was used to measure values from 400~4000 cm−1. The morphology of the prepared biochar was observed using a scanning electron microscope (SEM, CX-200TA, COXEM, Daejeon, Republic of Korea). In this experiment, carbon tape was initially mounted on a sample table made of stainless steel. After attaching copper tape to it, biochar was applied. Then, the sample table with the sample attached was inserted into the sample holder and properly secured. Finally, the samples were placed in the specimen chamber for SEM analysis. The specific surface area was analyzed using the Brunauer–Emmett–Teller (BET) method (BELSORP-maxII, MicrotracBEL Corp., Osaka, Japan). The investigated samples were pretreated at 100 °C for 24 h. To measure BET, biochar was ground in a mortar and processed into powder form, and approximately 0.1 g was sampled. The analysis was conducted in a nitrogen gas atmosphere, and the adsorption temperature was 77 K.
When biochar was incorporated into the soil, total organic carbon (TOC) content changes were measured using an electrical conductivity meter (EC meter, ORION VERSASTAR PRO, Thermo Fisher Scientific, Waltham, MA, USA). Organic matter (OM) analysis (CN928, LECO Analytical Instruments, Saint Joseph, MI, USA) was conducted to assess the impact of biochar on soil organic matter composition. Additionally, zinc levels were measured (MARS XPRESS 230/60, CEM, Elk River, MN, USA; OPtima 8300, Perkin Elmer, Waltham, MA, USA) to assess the presence of heavy metals in the soil. pH measurements were performed to determine the influence of the biochar composition on the alkalinity of the soil. The basicity of the biochar was measured using a pH meter (pH meter, pH8100, ETI, Worthing, West Sussex, UK). A soil sample with a mass of 1 g was mixed with 30 mL of distilled water by using a magnetic stirrer at room temperature for 30 min. Then, the pH meter was calibrated and washed with distilled water. Finally, the moisture was removed from the pH meter with a highly absorbent wafer, and the pH of the investigated samples was measured.

2.6. Statistical Analysis

Statistical analysis was performed using OriginPro software (version 2023). Statistical differences were tested by a one-way ANOVA, followed by a post hoc Tukey test. Means were compared using the Tukey test, and the significance level was 0.05. The homogeneity of variance was tested with Levene’s test (absolute deviation). The normality of the distribution was tested with the Shapiro–Wilk normality test. When either a normal distribution or equal variance was absent, a Kruskal–Wallis one-way ANOVA non-parametric test was performed. Data are presented as the mean ± standard deviation (SD) of all experiments.

3. Results and Discussion

3.1. Thermal Properties, Yield, and Elemental Analysis of Biochar

To determine the thermal characterization of the cattle manure used in this study and to determine the appropriate manufacturing temperature, TGA was performed using a TGA apparatus over a temperature range of 30–800 °C. Figure S3 presents the TGA curve of the CM.
The range of 250–350 °C is noteworthy. Weight loss occurred at around 350 °C and, in a subgroup, at around 250 °C due to reduced hemicellulose and cellulose [32]. The remaining mass was due to the influence of hemicellulose and lignin. These components can be easily found in lignocellulosic biomass, and lignin has high thermal stability and is hardly reduced even at 900 °C, affecting the biochar yield and aromaticity.
Based on the TGA results of CM, the biomass samples were subjected to low, medium, and high temperatures pf 400, 550, and 700 °C, respectively, to investigate the effect of temperature on biochar yield. The CM biomass sample was oven-dried at 105 °C for 24 h. The mass of the biomass sample (M) was measured before and after (m) carbonization. The yields were calculated by substituting the measured values into the following equation:
Yield biochar = (m/M) × 100
The biochar yields at 400 °C were 50.38 and 47.44% after carbonization, averaging 48.91 ± 2.08%. The percentages of biochar produced at 550 °C were 44.88 and 45.25%, averaging 45.07 ± 0.26%, which was approximately 4% lower than the amount produced at 400 °C. Biochar prepared at 700 °C had the lowest yields of 39.08 and 37.54%, averaging 38.31 ± 1.09%. Elemental analysis results revealed that the biochar’s carbon content increased with increasing temperature (Table S1) but was lower than that of the biomass due to the loss of CO2 and CO during carbonization. CO2 and CO can escape from biomass during heating at high temperatures, reducing the carbon content. Consequently, the biochar’s carbon content should be lower than that of the original biomass. Table S2 summarizes the heavy metal analysis results, which indicate that As, Cd, Mo, and Pb were not detected, whereas Cu, Ni, and Zn were detected. Zn was the most abundant among the heavy metals, and its content increased as the temperature increased during biochar production. The biochar produced at 700 °C exhibited a significantly higher Zn content (exceeding 1000 ppm) than those produced at the other temperatures. Copper exhibited a similar trend, with the most substantial increase in copper content observed between 550 and 700 °C. The nickel content exhibited irregular patterns, with the highest concentration (44.545 ppm) recorded at 550 °C.

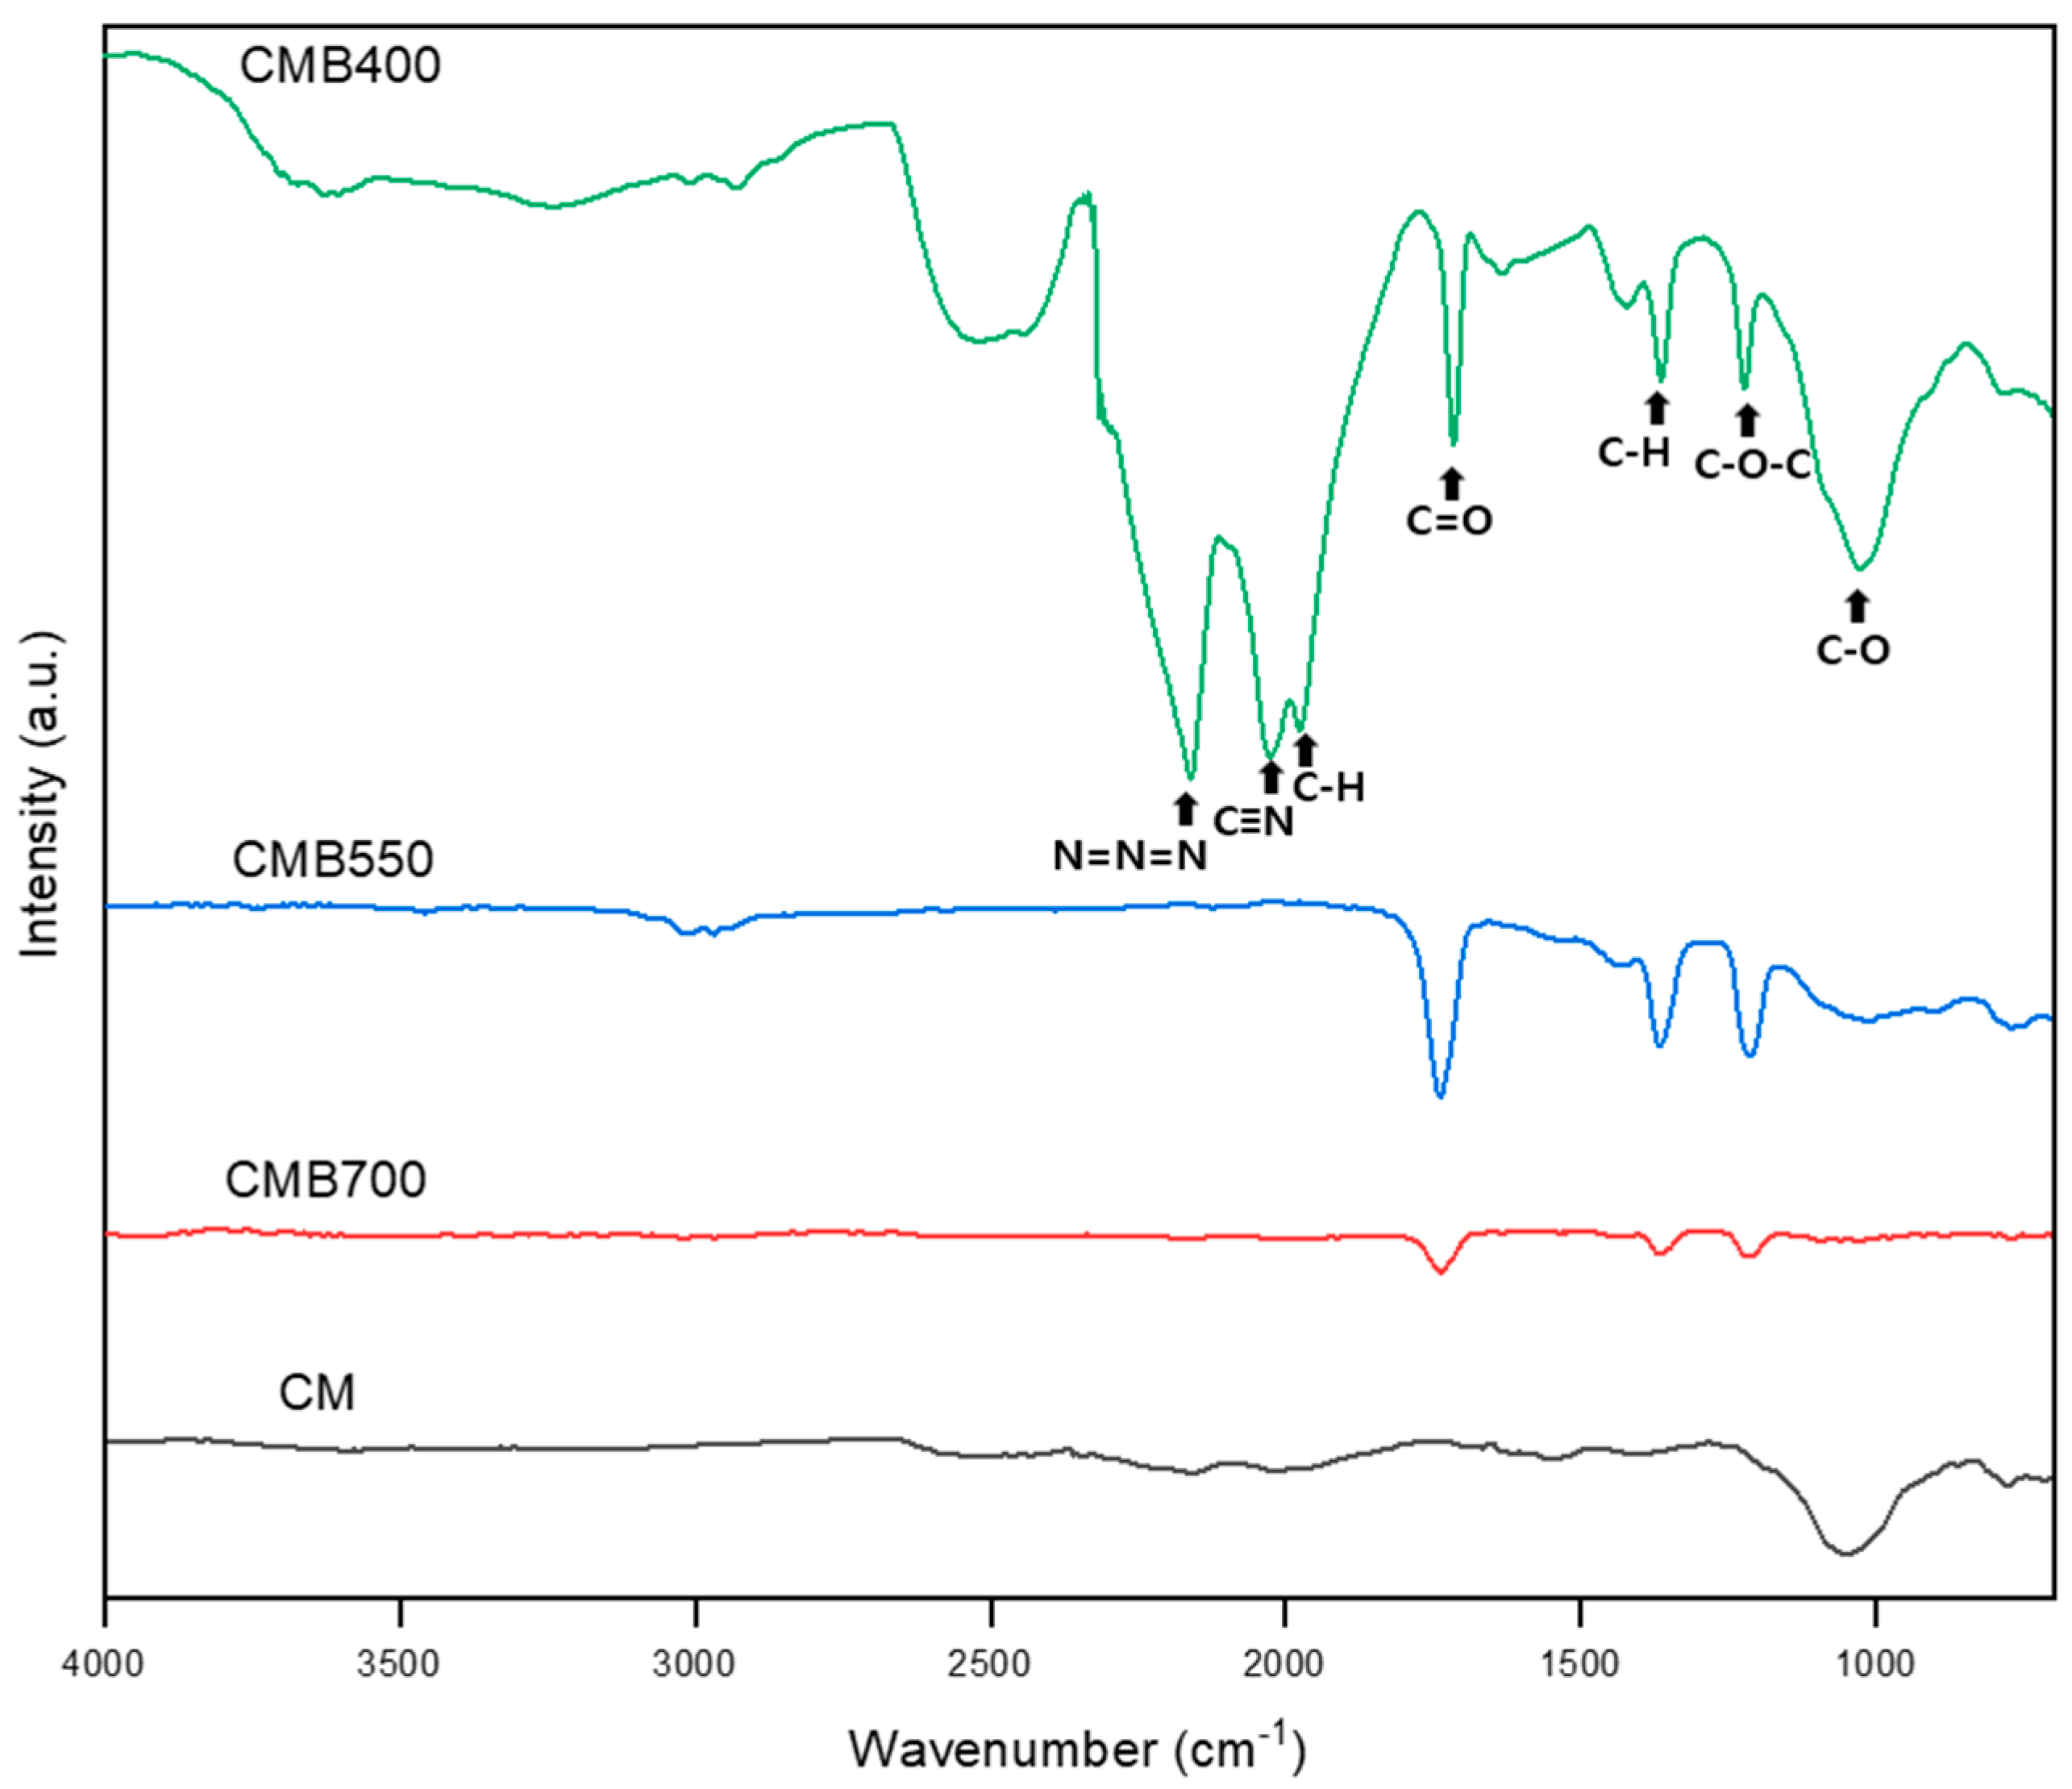
3.2. Investigation of Functional Groups in Biochar

The biochar’s FT-IR results from this study are shown in Figure 1 and summarized in Table S3. The results indicate the presence of various functional groups in the samples. CM showed the fewest functional groups, but the most functional groups were observed at 400 °C (CMB400), which is consistent with other research papers showing that the quantity of functional groups decreases as biochar is manufactured at higher temperatures [11]. It is assumed that the quantity of functional groups in CMB400 increased due to the formation of additional aromatic groups due to thermal decomposition during CMB production of CM. The N–H stretching peak observed at approximately 3600 cm−1 indicated the presence of N–H bonds in the analyzed samples [33]. Hydroxyl functional groups were detected in two regions: 3570–3000 and 1440–1400 cm−1, corresponding to the stretching vibrations of the hydroxyl groups present in the samples [32,34]. At approximately 2000 cm−1, the analysis revealed that the predominant bonds were between carbon and other elements. The most common bonds were C–H and C–O. However, no N bonds were observed in the analysis at 1000–700 cm−1. This observation reveals a gradual reduction in the number of functional groups with increasing temperature, a trend consistent with prior research [11]. Moreover, the analysis revealed that CMB700 exhibited a diminished count of functional groups containing oxygen (O) and hydrogen (H) compared to CMB400 and CMB550.

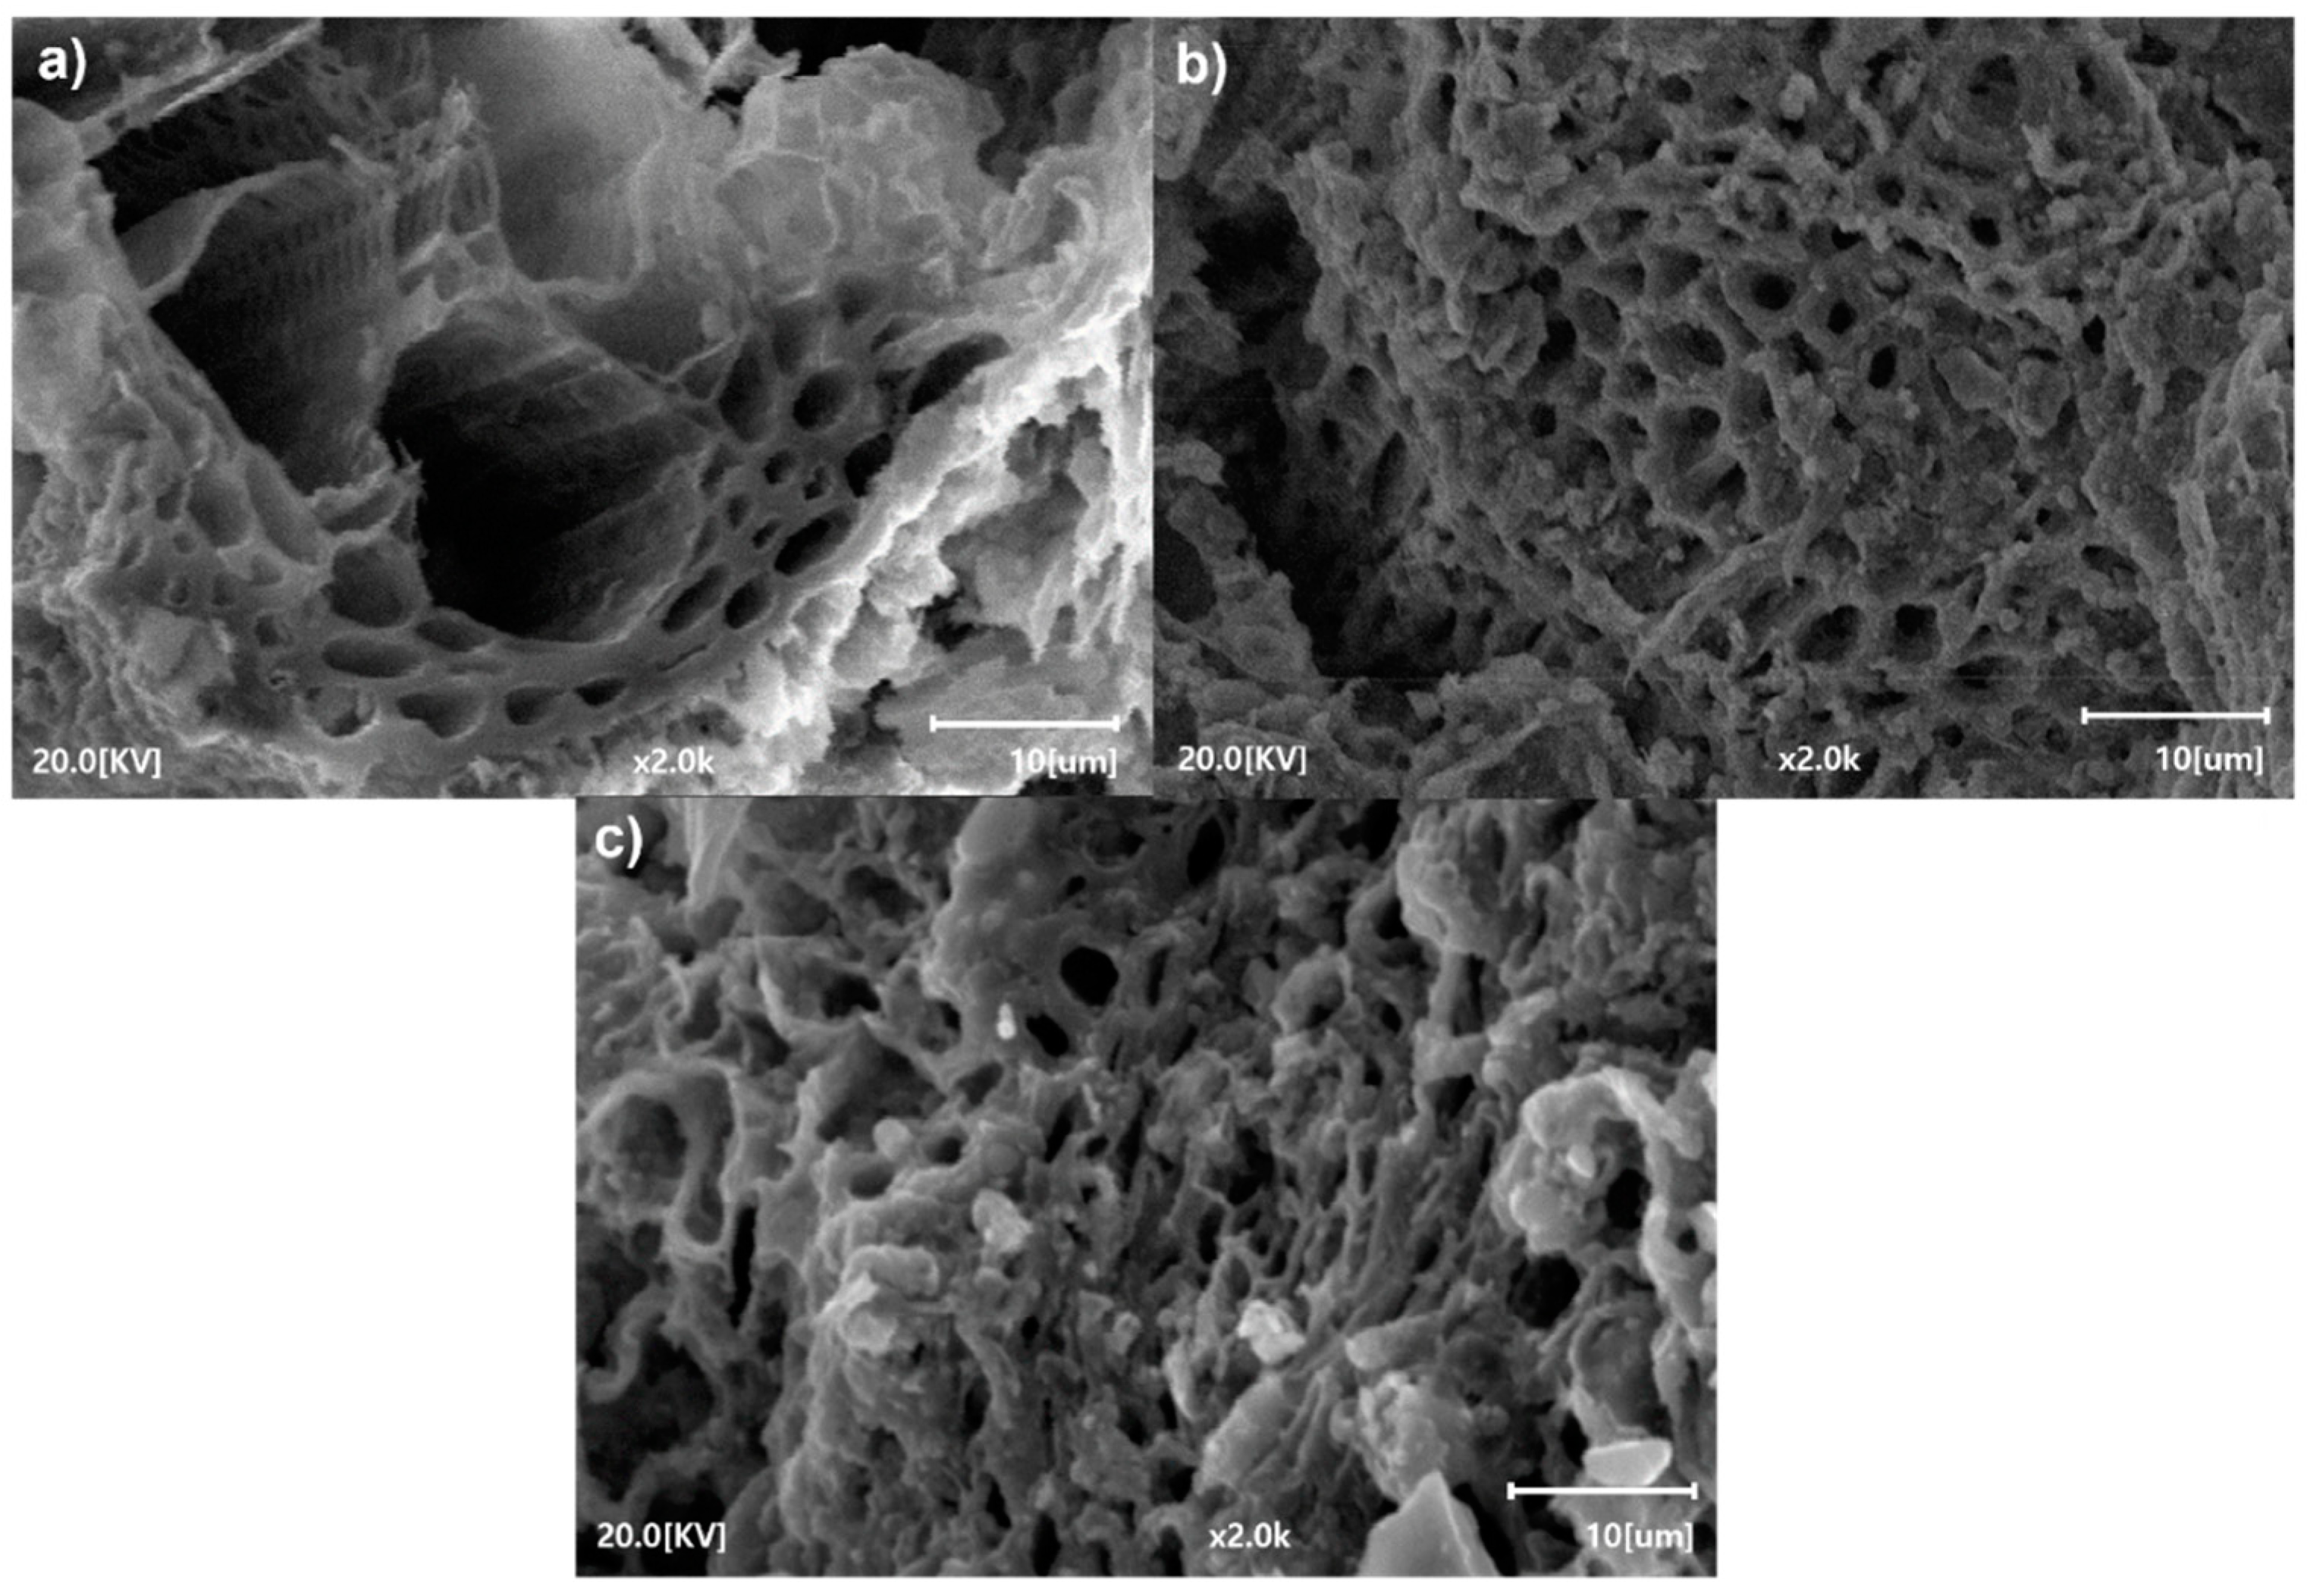
3.3. Morphological Features of Biochar

Morphological investigation of the biochar surface was performed using SEM and the results are presented in Figure 2. Biochar porosity has a significant impact on heavy metal adsorption from soil as well as water and CO2. This is because biochar captures CO2 through its pores. Therefore, taking into account the average biochar pore size, which is influenced by temperature during CMB production, the amount of biochar used may vary. The changes in the pores of biochar according to temperature were confirmed using SEM, and it could be seen that the pore characteristics changed depending on the temperature during biochar production. In the case of CMB400, due to the low temperature, the morphology of amorphous carbon was easily observed in the biochars produced at different temperatures (CMB550, CMB700), and the pore walls were thick (Figure 2a). CMB550 had smaller pore sizes than CMB400, and most of them were observed as meso-sized pores. The pore walls were thinnest in CMB700 (Figure 2c). Most of the pores that developed in CMB700 were nano-sized. Through this, we were able to confirm that the pore size and pore wall thickness become smaller and thinner depending on the biochar manufacturing temperature.

3.4. Textural Properties of Biochar

The specific surface area and pore size of the biochar samples were analyzed using BET/BJH measurements, and the results are listed in Table 1. High temperatures during biochar production promote pore development, increasing specific surface area. However, the specific surface area of CMB700 was lower than that of CMB550 because the decomposition or melting of organic matter at extremely high temperatures resulted in the pores inside the biochar collapsing or closing [35]. It was confirmed that the pore size gradually decreased in inverse proportion to temperature. The BET value of biochar was 45.901 m2 g−1 in CMB400, 117.57 m2 g−1 in CMB550, and 101.02 m2 g−1 in CMB700. We were also able to confirm the size of the pores, and the smallest pore size was observed in CMB550; it is believed that the nano-sized pores in CMB700 closed due to too high a temperature, increasing the average pore size (Figure S4). CMB400 was observed to have the largest average pore size [15.36 nm (mesopores)], which was consistent with the finding that CMB400 had the largest pores analyzed by SEM images. CMB700 was confirmed to have developed nano-sized pores of 4.075 nm. CMB550 showed the smallest average pore size, which was observed to be less than 1.686 nm.

3.5. pH Analysis of Biochar

Biochar is an alkaline material. Plants have optimal growth conditions under neutral pH conditions. Therefore, we determined whether biochar pH significantly affected the soil pH [36]. Additionally, pH directly affects biochar’s adsorption capacity, which increases between pH 4 and 8 and decreases above pH 9 [37,38]. The present study used garden soil to investigate the pH effect considering the amount of biochar applied in the soil, rather than focusing on the neutralization of acidic soils. The basicity of the biochar was assessed using a pH meter (Global Lab Supply, Doha, Qatar). The results revealed that CMB400 had the lowest pH value (8.71), followed by CMB550 (9.65) and CMB700 (9.69).

3.6. Analysis of Soil Enriched with Biochar

Soil analysis was conducted to investigate carbon storage through biochar. Table S4 shows soil analysis results 15 weeks after storage of these biochars. The content of organic carbon was found to increase as the content of CMB increased, suggesting that a significant portion of the carbon in the soil consisted of stable carbon that was not easily mineralized into organic carbon. This suggests that biochar application promotes long-term soil carbon storage. The pot containing 3 wt.% biochar (CMB3%) generally had lower carbon content than the control pot (Control), which can be attributed to the decomposition of organic carbon by microorganisms that utilize the available organic matter as an energy source [39]. Soil pH appeared to be more influenced by biochar content than cation exchange capacity (CEC). Furthermore, soil Zn content increased with increasing biochar content, owing to a high Zn concentration in biochar and through adsorption. The pot containing 5 wt.% biochar (CMB5%) exhibited an overall increase in various parameters compared to the standard. The total carbon (TC) content in plant4 increased by approximately 29% compared with that of the standard, suggesting that the higher organic matter content of CMB5% prevents organic carbon’s decomposition, thereby facilitating its storage. The Zn content in the soil increased twofold compared with that of the standard. However, the CEC of CMB5% was lower than that of the standard value, consistent with the results obtained in CMB3%. Furthermore, the pH of plant5 slightly increased. Among the different biochar ratios tested, the pot containing 7 wt.% biochar (CMB7%) exhibited the highest pH and CEC values. Although the biochar content in CMB7% was lower than that in the pot containing 10 wt.% biochar (CMB10%), its high CEC contributed to a higher pH of 7.78. Contrary to CMB5%, CMB7% did not significantly increase organic carbon content. The Zn content of plant7 increased by approximately 12% compared with that of plant5.

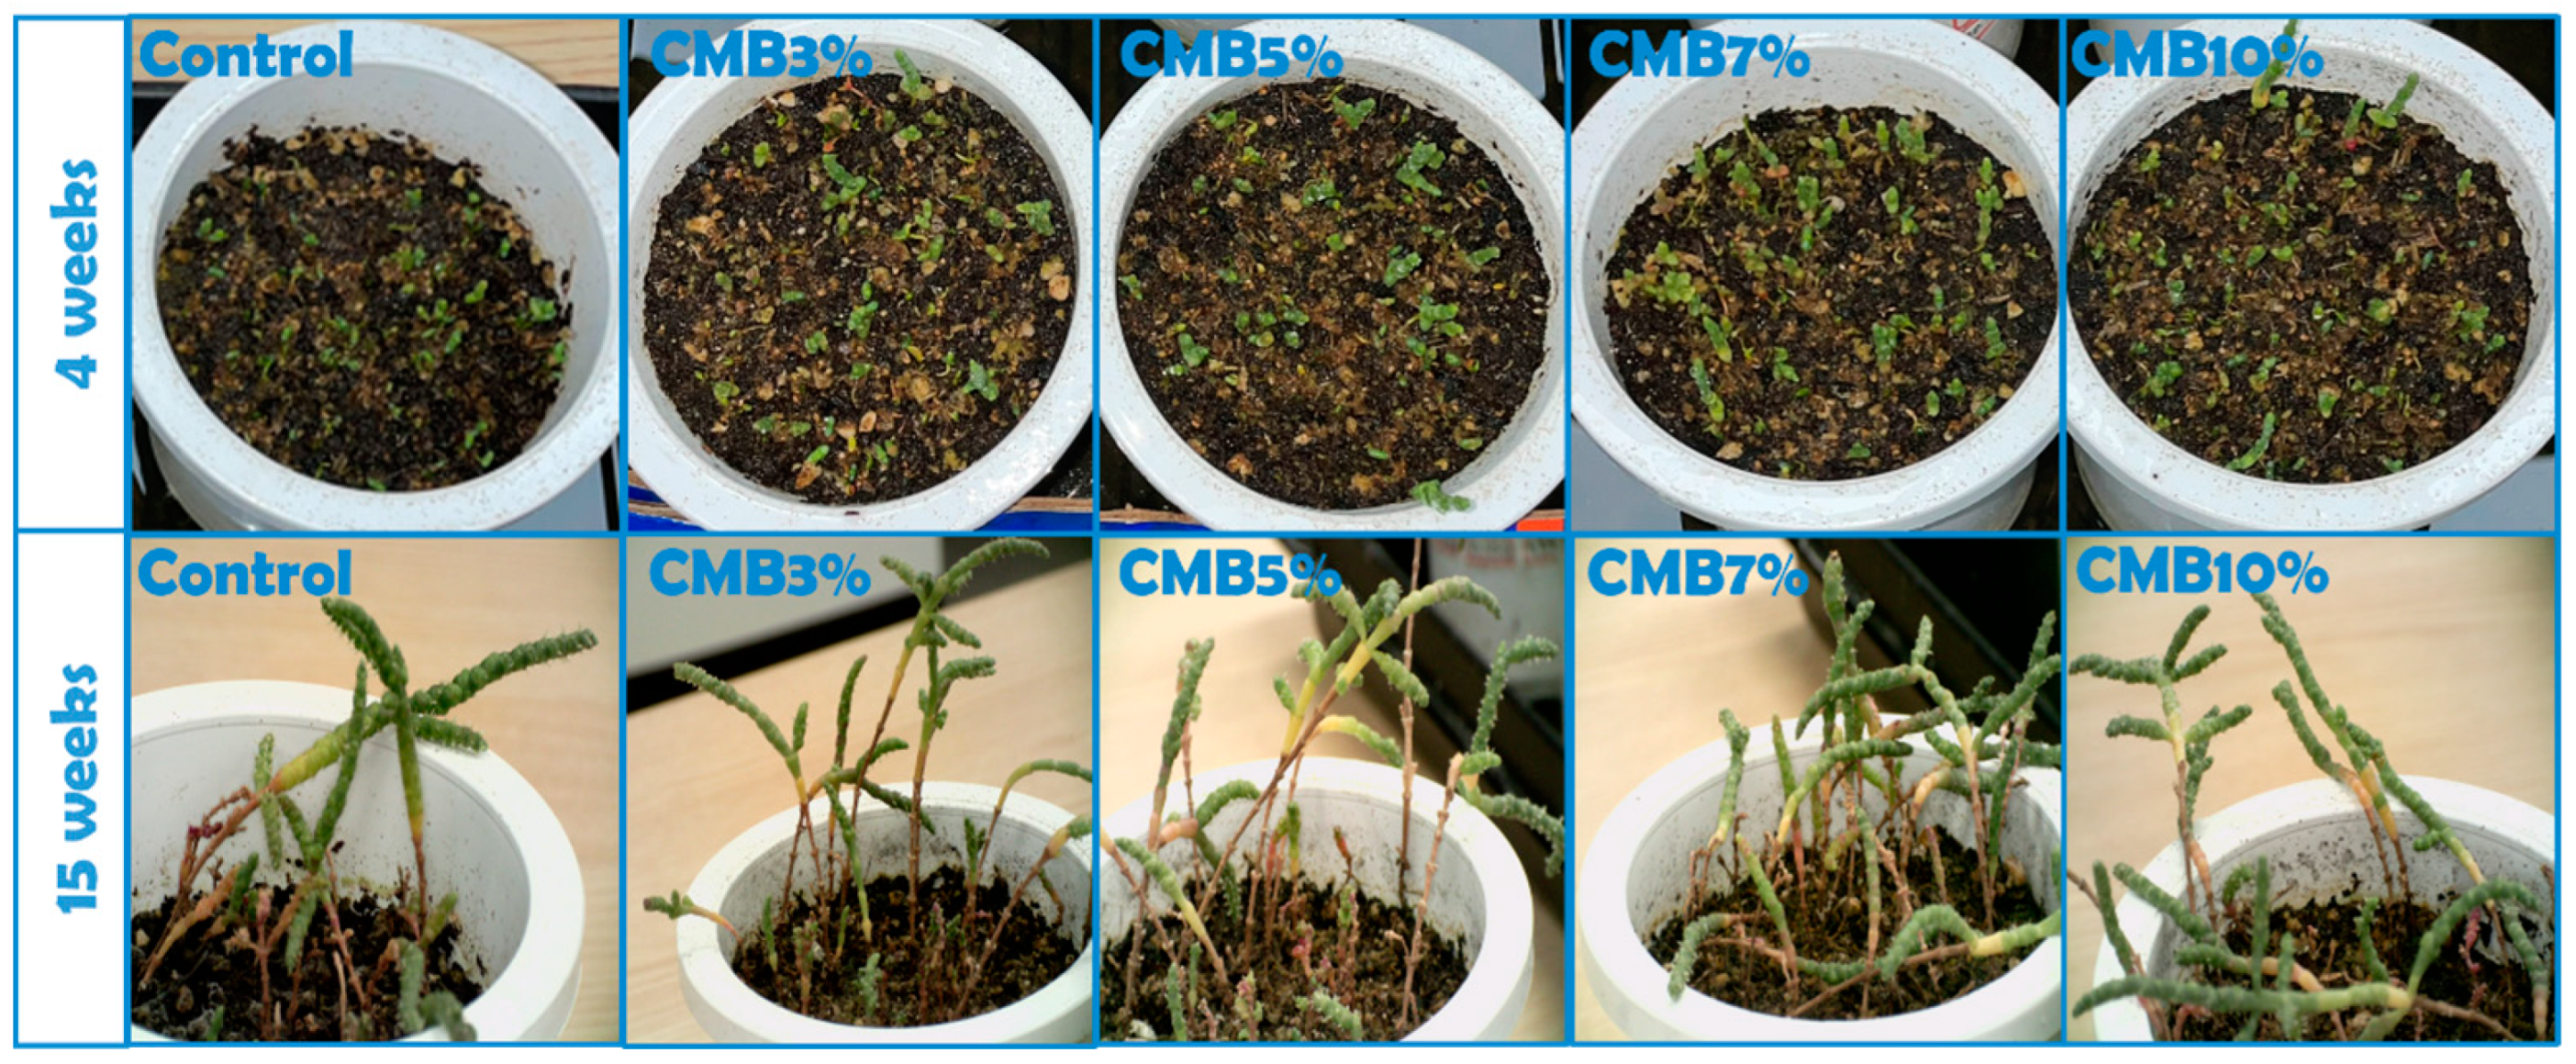
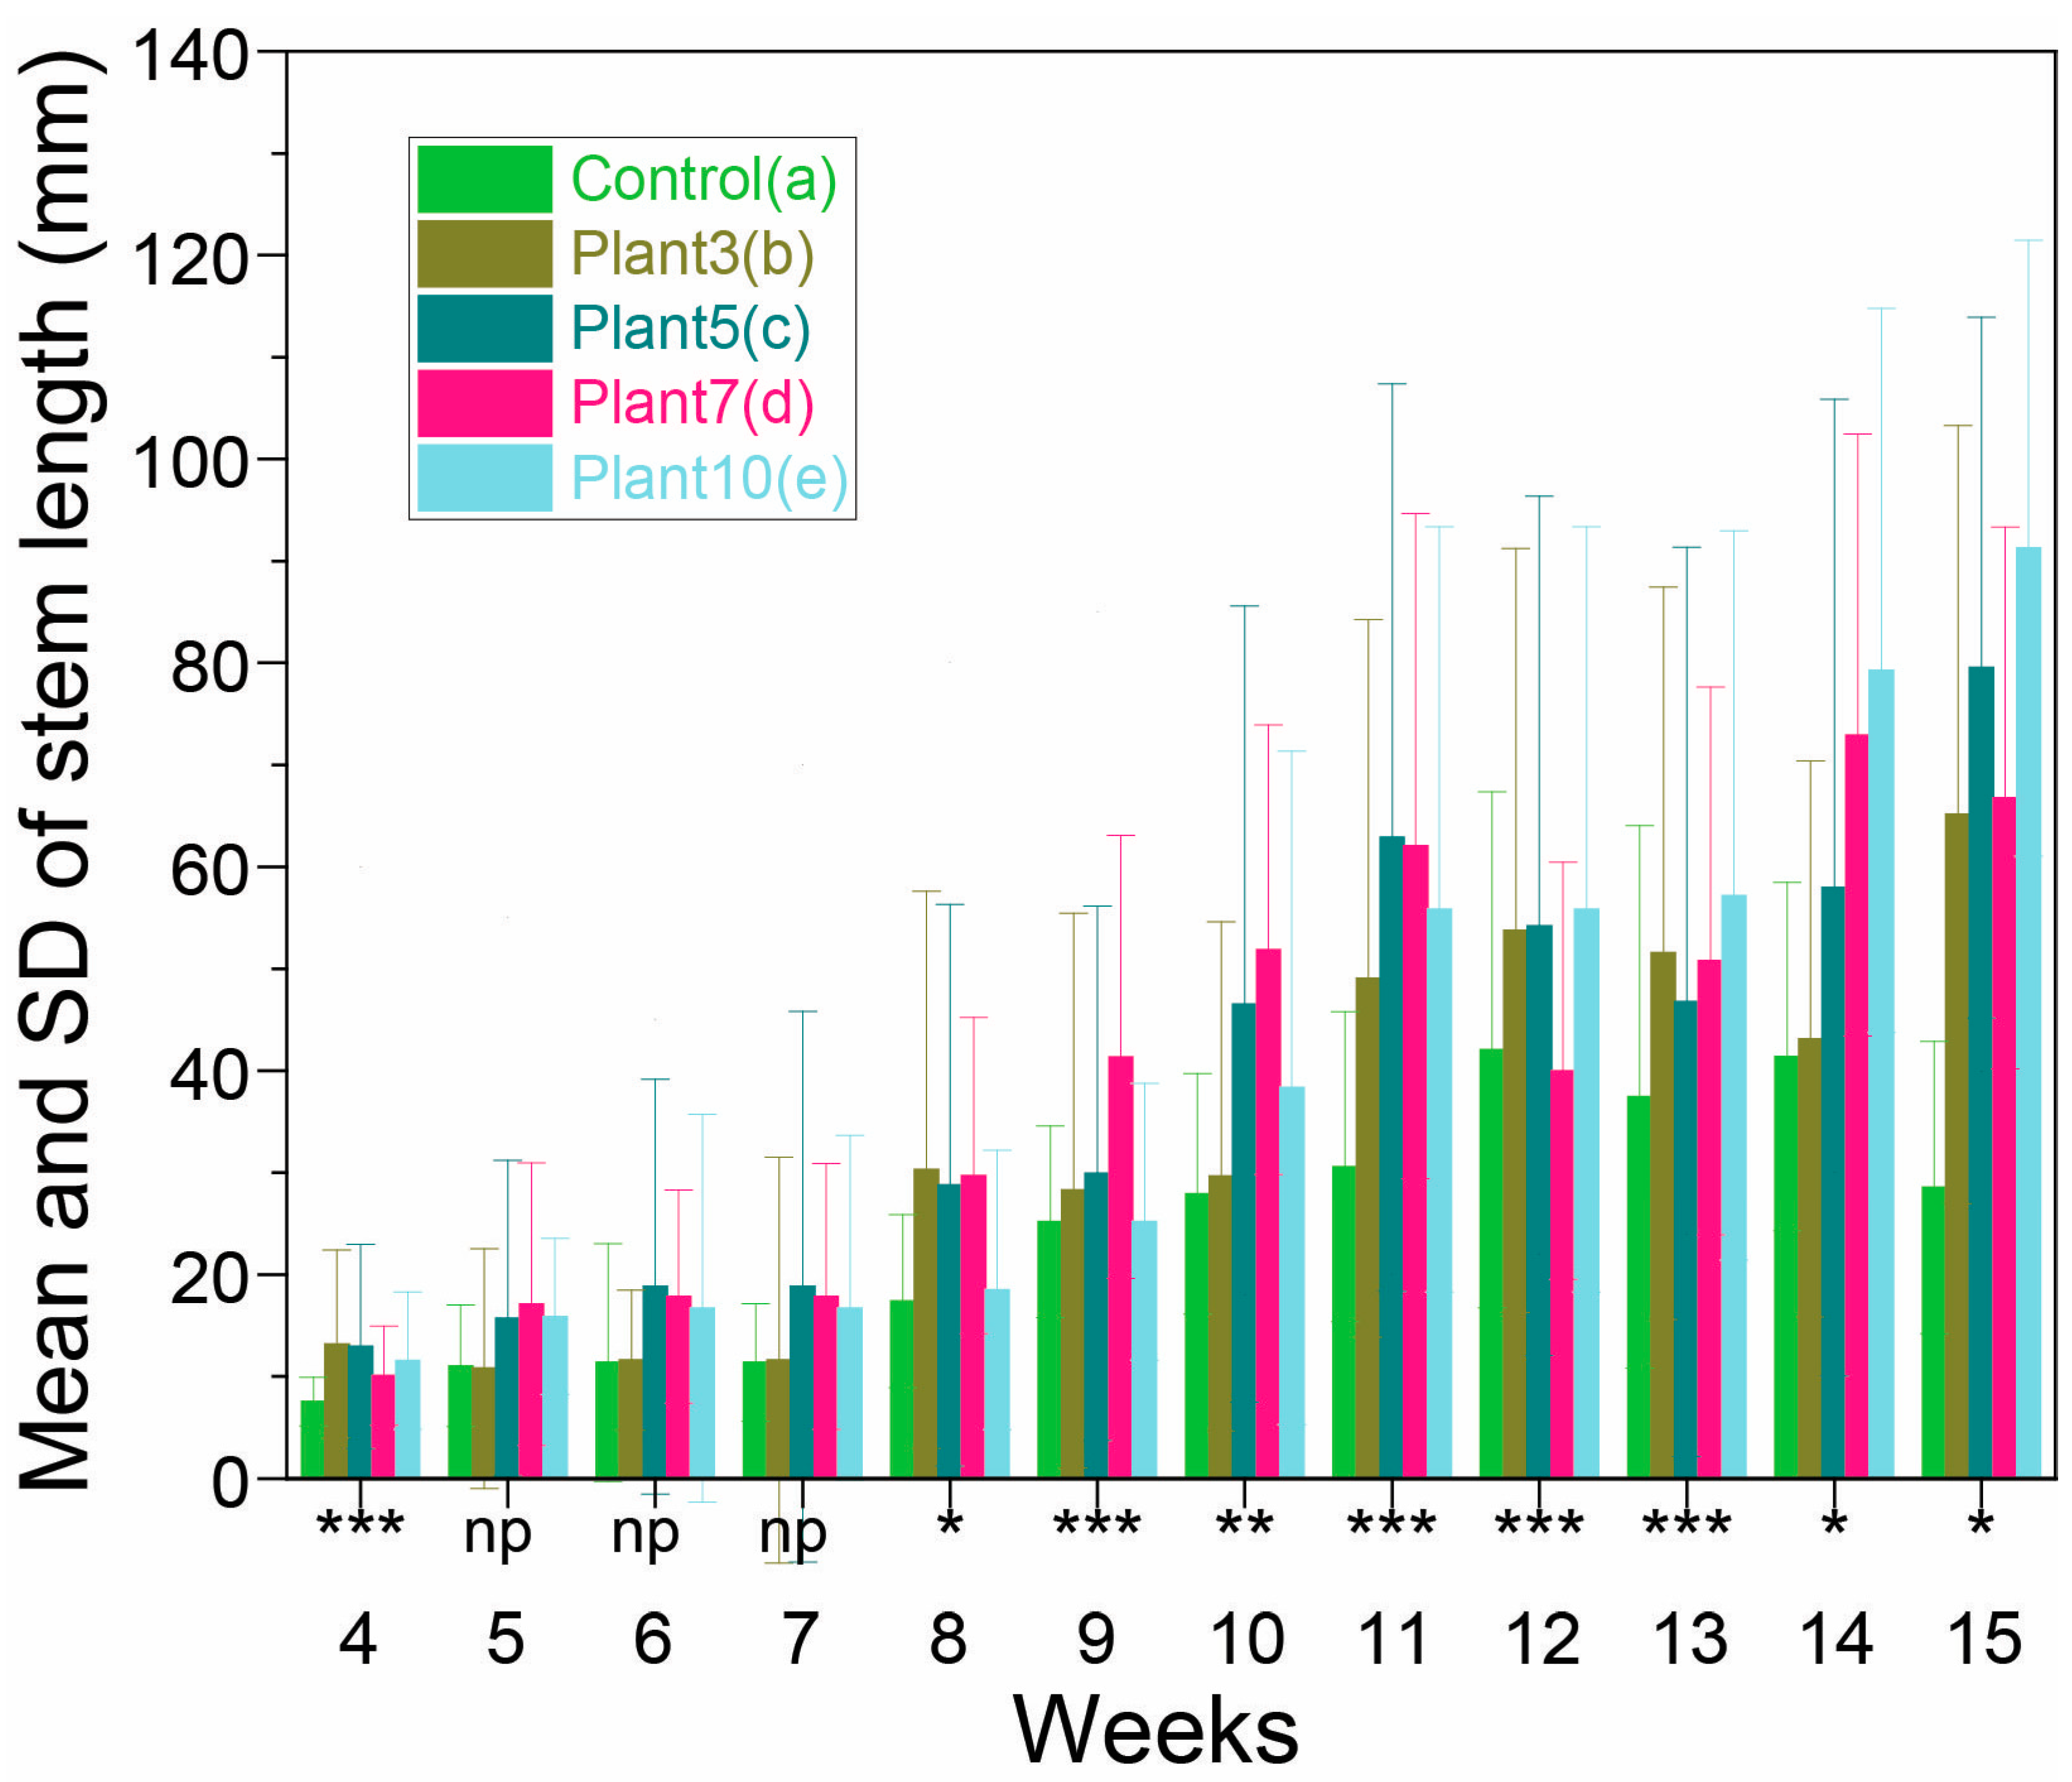
3.7. Glasswort Growth

Salicornia plants were grown for 15 weeks (Figure 3), and length was measured weekly. However, due to a lack of growth during the first three weeks, measurements were started in the fourth week. The results are shown in Figure S5, and the average values in Table 2 represent the lengths of all glasswort plants. Statistical analysis was performed using one-way analysis of variance (ANOVA) in the OriginPro program. As late-growing shoots reached a large enough size to be measurable, the number of samples increased until week 11, and the number of glasswort plants decreased from week 12 onwards. We analyzed data from weeks 4 to 15, and, except for weeks 11 to 13, the results were statistically significant (Table 2). The plant length in weeks 12 and 13 had relatively low values compared to week 11, which is due to a decrease (through death) in the number of plants (individuals). To stimulate glasswort growth, salt water was added when the plants showed symptoms of chlorosis. Saltwater was prepared by dissolving about 10 g of salt per liter of water. The same concentration of salt water was prepared for immersing glasswort plants, and the concentration was adjusted considering the treatment to investigate the effect of biochar application on plant growth. As shown in Figure 4, the length of the glasswort plants was increased when biochar was added compared to the control group throughout the growth period of the glasswort plants from the 4th to the 15th week. Between the 5th and 11th weeks, the plant lengths of plant3, plant5, and plant7 were larger than that of plant10. Between the 12th and 15th weeks, the length of plant 10 was greater than those of plant3, plant5, and plant7. As a result of ANOVA, the average difference in Salicornia length was significant compared to the control group at weeks 4, 7, and 15. In weeks 12 and 13, the length of the plants became shorter compared to week 11, but in the case of plant10, the length did not become shorter. Between the 14th and 15th weeks, it can be seen that the growth speed of the plant10 glasswort increased. In weeks 11 to 13, one-way analysis of variance showed that at the 0.05 level, the population variances were not significantly different. The control group showed a logistic or Richard curve, and when biochar was added, growth appeared to follow a Gompertz curve, but this can only be determined by performing additional comparable experiments. In this study, overall average plant growth increased with increasing biochar content. This means that the nutrients in biochar derived from cow dung increase plant growth.
In statistics, conducting a normality test is feasible with sample sizes under 30. However, it is important to note that smaller samples may compromise the test’s dependability, prompting the consideration of nonparametric alternatives. Particularly diminutive samples, those with fewer than 10 observations, may not provide a solid basis for normality testing, necessitating the use of different statistical techniques. Hence, one can indeed undertake a normality test with fewer than 30 samples, but it is crucial to approach the results with a degree of caution. In our specific study, the count of glasswort specimens per pot exceeded 30 until week 8, then dipped to approximately 25 from weeks 9 to 12 and dwindled to about 20 from weeks 13 to 15. We chose a nonparametric sample because it did not follow normality and the sample size was reduced. Our findings suggest a trend of increasing glasswort lengths up to week 11. Modeling the growth trajectory with logistic or Richard curves revealed a halt in growth and subsequent plant demise after week 11, which accounts for the reduced sample count. Moreover, the growth progression led to greater variability in lengths across samples, thus expanding the standard deviation. It is imperative to exercise interpretative prudence when comparing data across the pre- and post-12-week thresholds. Despite the smaller sample sizes, our normality assessments persisted, and we ascertained adherence to a Gompertz curve from weeks 12 to 15. Our future endeavors include advancing research on growth models pertinent to glasswort progression.

3.8. Analysis of Glasswort Heavy Metal Content

Heavy metals are substances that have fatal adverse effects on the body; therefore, they are essential elements to analyze in plant growth experiments. The results of the effects of heavy metals on plant growth in this study are shown in Table S5. The overall results of this study showed that samples with biochar had lower heavy metal content in glasswort than those without due to biochar’s ability to adsorb heavy metals. The functional groups and reactive sites on the biochar surface interact with heavy metal ions in soil solution, immobilizing them and reducing their potentially harmful effects on plant growth. Although no specific correlation between biochar content and heavy metal adsorption by glasswort was observed in this study, the overall decrease in heavy metal content in samples with biochar suggests that biochar reduces heavy metal concentrations. Additional studies are needed to explore the dynamics and mechanisms associated with biochar, heavy metals, and plant growth interactions. However, the complex dynamics and mechanisms governing the interactions between biochar and heavy metals and their collective effects on plant growth require further investigation. These findings highlight the essential need for more comprehensive research to uncover the complexities associated with these interactions. A deeper understanding of these dynamics will pave the way to uncover the exact mechanisms by which biochar influences heavy metal concentrations and ultimately plant growth. This will enable the development of more targeted and informed environmental strategies.

3.9. Comparative Studies

Jabborova et al. reported a study on ginger growth with biochar application, showing that ginger germination, ginger height, leaf length, and number of leaves were improved compared to the control group. The results of this study revealed that biochar improved the growth of ginger roots and stems. In addition, they suggested that soil nutrient supply can be improved by increasing the activity of soil enzymes [40]. Biochar application improved lettuce (Lactuca sativa L.) growth in lead-contaminated calcareous soils. In that study, biochar was confirmed to help absorb heavy metals due to its porosity [41]. Root and tuber crops such as potatoes, ginger, onions, and carrots are important food sources, and research has been conducted by several researchers to increase harvest rates by applying biochar. Additionally, after applying biochar to root crops, yields improved in all studies due to the many benefits of biochar [42]. In the present study, the use of biochar resulted in significant growth of glasswort. Additionally, our investigation into the impact of salinity on Salicornia growth (ranging from 0 to 1000 mM) revealed distinct responses depending on salinity levels. Notably, this finding aligns with a previous study that demonstrated approximately threefold variation in glasswort length based on salinity [43]. Hameed et al. [44] reported that halophytes have the potential to be used as a sustainable source of food, fuel, feed, fiber, essential oil, and medicine. These hardy plants thrive in high-salinity and drought conditions, accumulate salts and toxic metals, and require minimal maintenance during growth. Furthermore, they serve as a ‘neutral’ feedstock for biofuels, aiding in mitigating the negative effects of global climate change. Therefore, cultivating halophytes using biochar derived from cow manure can contribute to global warming mitigation. Garza-Torres [45] aimed to illustrate a sustainable scenario by examining the phenology and water requirements of Salicornia—a promising plant resource for salt-tolerant crop cultivation in coastal and saline regions. Additionally, Fitzner [46] reported that Salicornia’s potential as a biofilter for coastal aquaculture wastewater makes it a valuable biomass for dual-purpose water and energy utilization in aquaculture farms. They concluded with recommendations to prevent or minimize future water resource pollution. Implementing sustainable practices is essential for safeguarding seawater ecosystems. In summary, this synthesis underscores the potential of halophytes as a valuable resource for addressing water pollution and advancing climate resilience [47,48]. The process of removing salt from reclaimed land is commonly referred to as desalination. These process aims to remove salt from seawater or salty land and make the land suitable for agriculture. The Korean government is trying various methods, such as soil improvement, drainage improvement, and continuous water management, to quickly desalinate reclaimed land created by blocking seawater, such as Saemangeum in Korea. In particular, reclaimed land requires a long-term desalination plan, which must be implemented carefully because it will affect the local ecosystem and environment. Accordingly, the results of this study, i.e., improving the soil by adding biochar and using the plants grown in it for food, will become basic research that can be promoted as an important strategy in the future desalination proposal for land such as Saemangeum.

4. Conclusions

Biochar has great potential for capturing CO2 and sequestering carbon in the soil, making it an environmentally friendly option. Its ability to capture CO2 and sequester carbon in the soil underscores its eco-friendly potential. Nevertheless, given the diverse array of biomass sources available for biochar production, a comprehensive understanding of the distinct characteristics of each biomass type becomes imperative. In this study, CM was deliberately chosen for biochar production. The outcomes revealed that biochar generated from CM at a temperature of 550 °C exhibited the most extensive specific surface area, showcasing promising prospects for its application. The successful integration of CMB550 into the soil showcased its capacity to stimulate plant growth while facilitating the storage of organic carbon.
Additionally, the application of CMB550 proved adept at adsorbing heavy metals, positively influencing plant health. Despite these promising findings, further investigation into biochar remains essential to comprehend the nuances in its characteristics based on various biomass sources. This nuanced understanding is pivotal for selectively enhancing chemical reactions and optimizing biochar utilization, unlocking its full potential and maximizing benefits across diverse applications. Such advancements not only support sustainable waste management practices but also play a pivotal role in environmental remediation efforts. Continued research endeavors in biochar promise to unveil its multifaceted potential, enabling us to harness its capabilities effectively. By refining its properties and utilization methods, we can leverage biochar as a cornerstone in sustainable practices, contributing significantly to environmental conservation and fostering a greener future.

Supplementary Materials

The following supporting information can be downloaded at: https://www.mdpi.com/article/10.3390/su16083396/s1, Figure S1: Schematic diagram of the pyrolysis reactor, Figure S2: Diagram of the pots and soil used in this study, Figure S3: TGA curves of CM, Figure S4: Pore size analysis of CMBs. Figure S5: The stem-length results of the glasswort plants at 4 to 15 weeks. Table S1: Elemental analysis of samples (CM, CMB400, CMB550, CMB700), Table S2: Heavy metal analysis of samples (CM, CMB400, CMB550, CMB700), Table S3: The functional groups of samples (CM, CMB400, CMB550, CMB700), Table S4: Analysis of properties of biochar-treated soil, Table S5: Heavy metal analysis of Salicornia herbacea L. Refs. [49,50,51,52] are cited in Supplementary Materials.

Author Contributions

Conceptualization, H.S. and D.C.; methodology, I.-R.C., H.S., D.C. and Y.S.K.; validation, Y.S.K., M.A.H., L.K.K. and H.G.K.; formal analysis, H.G.K., D.C., M.A.H., S.-S.K., L.K.K. and H.G.K.; investigation, H.S., I.-R.C., M.A.H., S.-S.K., L.K.K. and H.G.K.; resources, I.-R.C. and Y.S.K.; writing—original draft preparation, H.S.; writing—review and editing, M.A.H. and Y.S.K.; visualization, H.S.; supervision, Y.S.K. All authors have read and agreed to the published version of the manuscript.

Funding

This work was supported by the National Research Foundation of Korea (NRF) grant funded by the Korean government (MSIT) (No. 2016R1A6A1A03012069 and No. 2020R1A2C1102174), as well as a Korea Institute for Advancement of Technology (KIAT) grant funded by the Korean government (MOTIE) (P0017002, HRD Program for Industrial Innovation). This work was supported by the Carbon Convergence Innovation Human Resources Project Group Advanced Graduate Education Project for Carbon Composites.

Institutional Review Board Statement

Not applicable.

Informed Consent Statement

Not applicable.

Data Availability Statement

Data are contained within the article and Supplementary Materials.

Conflicts of Interest

The authors declare no conflicts of interest.

References

  1. Kim, H.; McJeon, H.; Jung, D.; Lee, H.; Bergero, C.; Eom, J. Integrated Assessment Modeling of Korea’s 2050 Carbon Neutrality Technology Pathways. Energy Clim. Chang. 2022, 3, 100075. [Google Scholar] [CrossRef]
  2. Jun, S.; Song, Y.; Wang, Y.; Weijermars, R. Formation uplift analysis during geological CO2 storage using the Gaussian pressure transient method: Krechba (Algeria) validation and South Korean case studies. GeoEner. Sci. Eng. 2023, 221, 211404. [Google Scholar] [CrossRef]
  3. United States of America National Oceanic and Atmospheric Administration. Available online: https://www.noaa.gov/ (accessed on 5 April 2023).
  4. Lehmann, J.; Joseph, S. Biochar for Environmental Management: Science, Technology and Implementation, 2nd ed.; Routledge: London, UK, 2015; pp. 1–9. [Google Scholar]
  5. Lehmann, J.; Gaunt, J.; Rondon, M. Bio-char Sequestration in Terrestrial Ecosystems—A Review. Mitig. Adapt. Strateg. Glob. Chang. 2006, 11, 403–427. [Google Scholar] [CrossRef]
  6. Lehmann, J. A handful of carbon. Nature 2007, 447, 143–144. [Google Scholar] [CrossRef]
  7. Major, J.; Lehmann, J.; Rondon, M.; Goodale, C. Fate of soil-applied black carbon: Downward migration, leaching, and soil respiration. Glob. Chang. Biol. 2010, 16, 1366–1379. [Google Scholar] [CrossRef]
  8. Wu, M.; Han, X.; Zhong, T.; Yuan, M.; Wu, W. Soil organic carbon content affects the stability of biochar in paddy soil. Agric. Ecosyst. Environ. 2016, 23, 59–66. [Google Scholar] [CrossRef]
  9. Steiner, C.; Teixeira, W.; Lehmann, J.; Nehls, T.; de Macedo, J.; Blum, W.; Zech, W. Long-term effects of manure, charcoal and mineral fertilization on crop production and fertility on a highly weathered Central Amazonian upland soil. Plant Soil 2007, 291, 275–290. [Google Scholar] [CrossRef]
  10. Barrow, C.J. Biochar: Potential for countering land degradation and for improving agriculture. Appl. Geogr. 2012, 34, 21–28. [Google Scholar] [CrossRef]
  11. Weber, K.; Quicker, P. Properties of biochar. Fuel 2018, 217, 240–261. [Google Scholar] [CrossRef]
  12. Woo, S.H. Biochar for carbon sequestration. Clean Technol. 2013, 19, 201–211. [Google Scholar] [CrossRef]
  13. Oo, A.Z.; Sudo, S.; Akiyama, H.; Win, K.T.; Shibata, A.; Yamamoto, A. Effect of dolomite and biochar addition on N2O and CO2 emissions from acidic tea field soil. PLoS ONE 2018, 13, 0192235. [Google Scholar] [CrossRef] [PubMed]
  14. Beesley, L.; Moreno-Jiménez, E.; Gomez-Eyles, J.; Harris, E.; Robinson, B.; Sizmur, T. A review of biochars’ potential role in the remediation, revegetation, and restoration of contaminated soils. Environ. Pollut. 2011, 159, 3269–3282. [Google Scholar] [CrossRef] [PubMed]
  15. Schulz, H.; Dunst, G.; Glase, B. Positive effects of composted biochar on Plant growth and soil fertility. Agron. Sustain. Dev. 2013, 33, 817–827. [Google Scholar] [CrossRef]
  16. Ahmad, M.; Rajapaksha, A.U.; Lim, J.E.; Zhang, M.; Bolan, N.; Mohan, D.; Vithanage, M.; Lee, S.S.; Ok, Y.S. Biochar as a sorbent for contaminant. Chemosphere 2014, 99, 19–33. [Google Scholar] [CrossRef]
  17. Kim, B.M.; Kang, C.H.; Yang, J.K.; Na, J.K.; Jung, J.A.; Jung, H.J.; Lim, J.H.; Ko, K.M.; Kim, W.H.; Chang, Y.Y. Cu and Cd sorption of the biochar derived from coffee sludge. J. Soil Groundw. Environ. 2012, 17, 47–53. [Google Scholar] [CrossRef]
  18. Cao, X.; Ma, L.; Gao, B.; Harris, W. Dairy-Manure derived biochar effectively sorbs lead and atrazine. Environ. Sci. Technol. 2009, 43, 3285–3291. [Google Scholar] [CrossRef] [PubMed]
  19. Sharma, I.; Rajwar, G.S. Effect of biochar on nutritional status of the soil. Int. J. Adv. Res. 2016, 4, 988–996. [Google Scholar] [CrossRef] [PubMed]
  20. Shi, L.; Li, J.; Palansooriya, K.N.; Chen, Y.; Hou, D. Modeling phytoremediation of heavy metal contaminated soils through machine learning. J. Hazard. Mater. 2023, 441, 129904. [Google Scholar] [CrossRef] [PubMed]
  21. Kiran, Y.K.; Barkat, A.; Cui, X.Q.; Feng, Y.; Pan, F.; Tang, L.; Tang, X. Cow manure and cow manure-derived biochar application as a soil amendment for reducing cadmium availability and accumulation by Brassica chinensis L. in acidic red soil. J. Integr. Agric. 2017, 16, 725–734. [Google Scholar] [CrossRef]
  22. Bi, Y.; Cai, S.; Wang, Y.; Xia, Y.; Zhao, X.; Wang, S.; Xing, G. Assessing the viability of soil successive straw biochar amendment based on a five-year column trial with six different soils: Views from crop production, carbon sequestration, and net ecosystem economic benefits. J. Environ. Manag. 2019, 159, 3269–3282. [Google Scholar] [CrossRef]
  23. Kesavan, P.C.; Swaminathan, M.S. Strategies and models for agricultural sustainability in developing Asian countries. Philos. Trans. R. Soc. B Biol. Sci. 2008, 363, 877–891. [Google Scholar] [CrossRef] [PubMed]
  24. Fulhage, C.D. Reduce Environmental Problems with Proper Land Application of Animal Manure; University of Missouri Extension: Columbia, MO, USA, 2000. [Google Scholar]
  25. Saidan, M.; Abu Drais, A.; Al-Manaseer, E. Solid waste composition analysis and recycling evaluation: Zaatari Syrian Refugees Camp, Jordan. Waste Manag. 2017, 61, 58–66. [Google Scholar] [CrossRef] [PubMed]
  26. Dharmakeerthi, R.S.; Hanley, K.; Whitman, T.; Woolf, D.; Lehmann, J. Organic carbon dynamics in soils with pyrogenic organic matter that received Plant residue additions over seven years. Soil Biol. Biochem. 2015, 88, 268–274. [Google Scholar] [CrossRef]
  27. El-Naggar, A.; El-Naggar, A.H.; Shaheen, S.M.; Sarkar, B.; Chang, S.X.; Tsang, D.C.W.; Rinklebe, J.; Ok, Y.S. Biochar composition-dependent impacts on soil nutrient release, carbon mineralization, and potential environmental risk: A Review. J. Environ. Manag. 2019, 241, 458–467. [Google Scholar] [CrossRef] [PubMed]
  28. Watanabe, A.; Ikeya, K.; Kanazaki, N.; Makabe, S.; Sugiura, Y.; Shibata, A. Five crop seasons’ records of greenhouse gas fluxes from upland fields with repetitive applications of biochar and cattle manure. J. Environ. Manag. 2017, 144, 168–175. [Google Scholar] [CrossRef] [PubMed]
  29. Kudrevatykh, I.Y.; Kalinin, P.I.; Mitenko, G.V.; Alekseev, A.O. The role of plant in the formation of the topsoil chemical composition in different climatic conditions of steppe landscape. Plant Soil 2021, 465, 45–472. [Google Scholar] [CrossRef]
  30. Cárdenas-Pérez, S.; Piernik, A.; Chanona-Pérez, J.; Grigore, M.N.; Perea-Flores, M.J. An overview of the emerging trends of the Salicornia L. genus as a sustainable crop. Environ. Exp. Bot. 2021, 191, 104606. [Google Scholar] [CrossRef]
  31. Lee, S.I.; Kang, S.S.; Choi, E.J.; Gwon, H.S.; Lee, H.S.; Lee, J.M.; Lim, S.S.; Choi, W.J. Soil Carbon Storage in Upland Soils by Biochar Application in East Asia: Review and Data Analysis. Korean J. Environ. Agric. 2021, 40, 219–230. [Google Scholar] [CrossRef]
  32. Yang, H.; Yan, R.; Chen, H.; Lee, D.H.; Zheng, C. Characteristic of hemisellulose, cellulose and lignin pyrolysis. Fuel 2007, 86, 1781–1788. [Google Scholar] [CrossRef]
  33. Xu, Q.; Tang, S.; Wang, J.; Ko, J.H. Pyrolysis kinetics of sewage sludge and its biochar characteristics. Process Saf. Environ. Prot. 2018, 115, 49–56. [Google Scholar] [CrossRef]
  34. Jindo, K.; Mizumoto, H.; Sawada, Y.; Sanchez-Monedero, M.A.; Sonoki, T. Physical and chemical characterization of biochars derived from different agricultural residues. Biogeosciences 2014, 11, 6613–6621. [Google Scholar] [CrossRef]
  35. Zhang, X.; Zhao, B.; Liu, H.; Zhao, Y.; Li, L. Effects of pyrolysis temperature on biochar’s characteristics and speciation and environmental risks of heavy metals in sewage sludge biochars. Environ. Technol. Innov. 2022, 26, 102288. [Google Scholar] [CrossRef]
  36. Olmo, M.; Villar, R.; Salazar, P.; Alburquerque, J.A. Changes in soil nutrient availability explain biochar’s impact on wheat root development. Plant Soil 2016, 399, 333–343. [Google Scholar] [CrossRef]
  37. Chen, M.; He, F.; Hu, D.; Bao, C.; Huang, Q. Broadened operating pH range for adsorption/reduction of aqueous Cr (VI) using biochar from directly treated jute (Corchorus capsularis L.) fibers by H3PO4. Chem. Eng. J. 2020, 381, 122739. [Google Scholar] [CrossRef]
  38. Rasse, D.P.; Weldon, S.; Joner, E.J.; Joseph, S.; Kammann, C.I.; Liu, X.; O’Toole, A.; Pan, G.; Kocatürk-Schumacher, N.P. Enhancing plant N uptake with biochar-based fertilizers: Limitation of sorption and prospects. Plant Soil 2022, 475, 213–236. [Google Scholar] [CrossRef]
  39. Palviainen, M.; Berninger, F.; Bruckman, V.J.; Köster, K.; Assumpção, C.R.M.; Aaltonen, H.; Makita, N.; Mishra, A.; Kulmala, L.; Adamczyk, B.; et al. Effects of biochar on carbon and nitrogen fluxes in boreal forest soil. Plant Soil 2018, 425, 71–85. [Google Scholar] [CrossRef]
  40. Jabborova, D.; Wirth, S.; Halwani, M.; Ibrahim, M.F.M.; Azab, I.H.E.; El-Mogy, M.M.; Elkelish, A. Growth Response of Ginger (Zingiber officinale), Its Physiological Properties and Soil Enzyme Activities after Biochar Application under Greenhouse Conditions. Horticulturae 2021, 7, 250. [Google Scholar] [CrossRef]
  41. Kim, H.-S.; Kim, K.-R.; Kim, H.-J.; Yoon, J.-H.; Yang, J.E.; Ok, Y.S.; Owens, G.; Kim, K.-H. Effect of biochar on heavy metal immobilization and uptake by lettuce (Lactuca sativa L.) in agricultural soil. Environ. Earth Sci. 2015, 74, 1249–1259. [Google Scholar] [CrossRef]
  42. Randima, E.; Anushka, U.R.; Chamila, J.; Chaamila, P.; Meththika, V. Influence of biochar on growth performances, yield of root and tuber crops and controlling plant-parasitic nematodes. Biochar 2023, 5, 68. [Google Scholar]
  43. Cárdenas-Pérez, S.; Rajabi Dehnavi, A.; Leszczyński, K.; Lubińska-Mielińska, S.; Ludwiczak, A.; Piernik, A. Salicornia europaea L. Functional Traits Indicate Its Optimum Growth. Plants 2022, 11, 1051. [Google Scholar] [CrossRef]
  44. Hameed, A.; Hussain, S.; Rasheed, A.; Ahmed, M.Z.; Abbas, S. Exploring the Potentials of Halophytes in Addressing Climate Change-Related Issues: A Synthesis of Their Biological, Environmental, and Socioeconomic Aspects. World 2024, 5, 36–57. [Google Scholar] [CrossRef]
  45. Garza-Torres, R.; Troyo-Diéguez, E.; Nieto-Garibay, A.; Lucero-Vega, G.; Magallón-Barajas, F.J.; García-Galindo, E.; Fimbres-Acedo, Y.; Murillo-Amador, B. Environmental and Management Considerations for Adopting the Halophyte Salicornia bigelovii Torr. as a Sustainable Seawater-Irrigated Crop. Sustainability 2020, 12, 707. [Google Scholar] [CrossRef]
  46. Fitzner, M.; Fricke, A.; Schreiner, M.; Baldermann, S. Utilization of Regional Natural Brines for the Indoor Cultivation of Salicornia europaea. Sustainability 2021, 13, 12105. [Google Scholar] [CrossRef]
  47. Turcios, A.E.; Papenbrock, J. Sustainable Treatment of Aquaculture Effluents—What Can We Learn from the Past for the Future? Sustainability 2014, 6, 836–856. [Google Scholar] [CrossRef]
  48. Puccinelli, M.; Marchioni, I.; Botrini, L.; Carmassi, G.; Pardossi, A.; Pistelli, L. Growing Salicornia europaea L. with Saline Hydroponic or Aquaculture Wastewater. Horticulturae 2024, 10, 196. [Google Scholar] [CrossRef]
  49. Liu, Z.; Niu, W.; Chu, H.; Zhou, T.; Niu, Z. Effect of the Carbonization Temperature on the Properties of Biochar Produced from the Pyrolysis of Crop Residues. BioResources 2018, 2, 3429–3446. [Google Scholar] [CrossRef]
  50. Mohan, D.; Abhishek, K.; Sarwat, A.; Patel, M.; Singh, P.; Pittman, J.C.U. Biochar production and applications in soil fertility and carbon sequestration–a sustainable solution to crop-redue burning in India. RSC Adv. 2017, 8, 508–520. [Google Scholar] [CrossRef]
  51. Stylianou, M.; Christou, A.; Dalias, P.; Polycarpou, P.; Michael, C.; Agapiou, A.; Papanastasiou, P.; Fatta-Kassinos, D. Physiochemical and stucture characterization of biochar derived from the pyrolysis of biosoilds, cattle manure and spent coffee grounds. J. Energy Inst. 2020, 93, 2063–2073. [Google Scholar] [CrossRef]
  52. Huang, M.; Luo, J.; Fang, Z.; Li, H. Biodiesel production catalyzed by highly acidic carbonaceous catalysts synthesized via carbonizing lignin in sub-and soper-critical ethanol. Appl. Catal. B Environ. 2016, 190, 103–114. [Google Scholar] [CrossRef]
Figure 1. FTIR of cow manure (CM) as well as cow manure carbonized at 400 °C (CMB400), 550 °C (CMB550), and 700 °C (CMB700).
Sustainability 16 03396 g001
Figure 2. SEM images of (a) cow manure carbonized at 400 °C (CMB400), (b) 550 °C (CMB550), and (c) 700 °C (CMB700).
Sustainability 16 03396 g002
Figure 3. Effect of biochar application on glasswort grown in pots.
Sustainability 16 03396 g003
Figure 4. Statistical analysis of control, plant3, plant5, plant7, and plant10 from week 4 to week 15. * p < 0.05, ** p < 0.01, *** p < 0.001; np (not meeting probability threshold value): p > 0.05.
Sustainability 16 03396 g004
Table 1. Analysis of biochar surface area and porosity.
SamplesBET (m2 g−1)Average Pore Size (nm)
a CMB40045.90115.36
b CMB550117.571.686
c CMB700101.024.075
a CMB400 = cow manure carbonized at 400 °C, b CMB550 = cow manure carbonized at 550 °C, c CMB700 = cow manure carbonized at 700 °C.
Table 2. Statistical analysis of glasswort: average stem length and standard deviation (SD).
WeekControl aPlant3 bPlant5 cPlant7 dPlant10 ep-Valuemd
47.55 ± 2.37 nd13.20 ± 9.19 nnd12.94 ± 10.02 nnd10.10 ± 4.87 nnd11.56 ± 6.65 nnd**a < b, a < c
511.06 ± 5.96 nnd10.79 ± 11.74 nnd15.70 ± 15.48 nnd17.12 ± 13.87 nnd15.88 ± 7.66 nnd***
611.39 ± 11.66 nnd11.63 ± 6.88 nnd18.83 ± 20.35 nnd17.85 ± 10.45 nnd16.71 ± 18.99 nnd***
710.31 ± 5.75 nnd18.01 ± 19.89 nnd31.86 ± 26.99 nnd23.98 ± 13.03 nnd17.08 ± 16.93 nnd***a < c, a < d
c < b, c < e
817.40 ± 8.50 nd30.30 ± 27.32 nnd28.77 ± 27.54 nnd29.70 ± 15.49 nd18.50 ± 13.70 nnd*
925.17 ± 9.38 nd28.25 ± 27.19 nnd29.95 ± 26.19 nnd41.35 ± 21.71 nd25.18 ± 13.59 nnd*e < d
1027.91 ± 11.79 nd29.65 ± 24.96 nnd46.52 ± 39.05 nnd51.87 ± 22.07 nnd38.32 ± 33.03 nnd***b < d
1130.58 ± 15.18 nd49.07 ± 35.20 nnd62.86 ± 44.51 nnd62.05 ± 32.61 nd55.82 ± 37.52 ndnp
1242.05 ± 25.31 nd53.75 ± 37.46 nnd54.22 ± 42.16 nnd39.98 ± 20.46 nnd52.10 ± 34.88 nndnp
1337.44 ± 26.61 nd51.54 ± 35.92 nnd46.76 ± 44.59 nnd50.78 ± 26.86 nd57.19 ± 35.78 ndnp
1441.39 ± 17.09 nd43.12 ± 27.26 nnd57.97 ± 47.90 nnd72.94 ± 29.53 nnd79.26 ± 35.52 nd*e < b
1528.54 ± 14.33 nd65.12 ± 38.18 nnd79.53 ± 34.38 nd66.75 ± 26.56 nd91.26 ± 30.21 nd***a < b, a < c
a < d, a < e
* p < 0.05, ** p < 0.01, *** p < 0.001; np (not meeting probability threshold value): p > 0.05; md: mean difference; nd: normally distributed population; nnd: non-normally distributed population. a Control, b plant3, c plant5, d plant7, e plant10.
Disclaimer/Publisher’s Note: The statements, opinions and data contained in all publications are solely those of the individual author(s) and contributor(s) and not of MDPI and/or the editor(s). MDPI and/or the editor(s) disclaim responsibility for any injury to people or property resulting from any ideas, methods, instructions or products referred to in the content.

