Article

Vulnerability Assessment of a Highly Populated Megacity to Ambient Thermal Stress

1
Department of Architecture and Planning, Indian Institute of Engineering Science and Technology (IIEST), Shibpur, Howrah 711103, West Bengal, India
2
Manipal School of Architecture and Planning, Manipal Academy of Higher Education, Manipal 576104, Karnataka, India
3
School of Built Environment, Faculty of Arts, Design and Architecture, University of New South Wales (UNSW), Sydney, NSW 2052, Australia
*
Authors to whom correspondence should be addressed.
Sustainability 2024, 16(8), 3395; https://doi.org/10.3390/su16083395
Submission received: 21 February 2024 / Revised: 28 March 2024 / Accepted: 9 April 2024 / Published: 18 April 2024
(This article belongs to the Special Issue Urban Economic Development and Planning: Sustainable Development)

Abstract

:
The urban ambient environment is directly responsible for the health conditions of millions of people. Comfortable living space is a significant aspect that urban policymakers need to address for sustainable planning. There is still a notable lack of studies that link the spatial profile of urban climate with city-specific built-up settings while assessing the vulnerability of the city population. Geospatial approaches can be beneficial in evaluating patterns of thermal discomfort and strategizing its mitigation. This study attempts to provide a thorough remote sensing framework to analyze the summer magnitude of thermal discomfort for a city in a tropical hot and humid climate. Spatial profiles of dry bulb temperature, wet bulb temperature and relative humidity were prepared for this purpose. A simultaneous assessment of various discomfort indices indicated the presence of moderate to strong heat stress to a vast extent within the study area. The central business district (CBD) of the city indicated a ‘danger’ level of heat disorder for outdoor exposure cases. Nearly 0.69 million people were vulnerable to a moderate threat from humid heat stress, and around 0.21 million citizens faced strong heat stress. Combing city morphology in the study showed that mid-rise buildings had the maximum contribution in terms of thermal discomfort. City areas with built-up cover of more than 68%, along with building height between 5.8 m and 9.3 m, created the worst outdoor discomfort situations. Better land management prospects were also investigated through a multicriteria approach using morphological settlement zones, wind direction, pavement watering, building regulations and future landscaping plans. East–west-aligned road segments of a total 38.44 km length were delineated for water spray cooling and greener pavements. This study is likely to provide solutions for enhancing ambient urban health.

1. Introduction

City regions are key factors affecting the local environment, climate, and sustainability over recent years. Urban immigration all over the world has led to drastic urban growth. This continues to occur. Urban sprawl is even more prominent in developing countries [1,2]. In the last decade (2012–2022), developing economies showed a higher rate of urban population increase than developed economies (UNCTAD Handbook of Statistics 2023). Such urban expansion has caused various problems, and they have been studied by researchers worldwide [3,4,5]. Among many other factors, the local climate is remarkably affected by urbanization. Cities alter the albedo characteristics, temperature, and even precipitation patterns at a local scale [6]. A prevalent consequence of urbanization is the intensification of heat in and around cities. This phenomenon is well documented by Urban Heat Island (UHI) studies [7,8,9]. The availability of moderate- to high-resolution satellite imageries has helped in the progression of UHI and associated Land Use Land Cover (LULC) studies of cities over the past couple of decades [10,11,12]. Land Surface Temperature (LST) values are processed from thermal bands of remotely sensed data and used for UHI investigation. The LULC changes are simultaneously evaluated to understand the causal relationship between urbanization and UHI growth [13,14]. Even with the current progression, one major drawback of these studies is the lack of incorporation of ambient conditions to accurately assess the stress of the thermal environment on city dwellers. While satellite-image-based studies directly provide information about the surface conditions, the ambient environment of cities is often not thoroughly investigated.
Air temperature (AT) and relative humidity (RH) are the primary factors that determine ambient comfort or discomfort at the local level. The ambient environment directly influences the health and well-being of a vast city population. Hence, environmental health issues are gaining more importance in urban climate studies [15,16,17]. Humid tropical cities are facing even more critical conditions due to the presence of both high temperature and humidity. A study conducted with 26 years’ data in China determined that uncomfortable days increased by 59% for cities in summer [18]. Another study carried out in the Indian city of Nagpur depicted a sharp rise in the heat index and humidex as the cause of increasing mortality [19]. Over the last four decades, a drastic rise in thermal discomfort has been reported for tropical urban agglomerations [20]. There was also a considerable rise in torrid and very hot days after the COVID-19 lockdown period [21]. An article [22] elaborated the adverse effects of tropical heat stress on coastal ecology. To assess such significant local climate changes, case studies in various city regions have resulted in the formation of thermal discomfort indices. These indices can be global or local in nature. Among these various heat indices, the universal thermal climate index, physiological equivalent temperature, wet bulb globe temperature, wet bulb dry temperature, etc., are widely used [23,24]. The drawback of applying these indices at the city level is the shortfall of using geospatial techniques. Studies mostly assess the thermal discomfort based on the weather conditions of in situ monitoring stations. There is a notable lack of spatial continuity while mapping thermal discomfort at the city level. Also, studies tend to assess discomfort based on only temperature datasets and do not always consider the RH pattern. Mapping the most critical areas in terms of thermal hazard requires a multicriteria-based and hybrid approach.
Another gap in urban climate research is the shortage of quantitative links between urban morphology and thermal discomfort. The unique morphology of each city will affect the thermal comfort levels in a distinct way [25,26]. Every city has its own building morphology guided by the building density, height, open spaces, road network, vegetation intensity, etc. It is necessary to understand how building arrangement affects the ambient environment and eventually leads to health hazards [27,28]. Pedestrian-level wind flow patterns also have a notable role in affecting the thermal profile [29]. The inclusion of wind flow data can substantially improve natural ventilation [30]. Thus, local climate characteristics need to be linked to urban designs empirically for better city planning purposes. Modifications in urban geometry in terms of building distances, height regulations and arrangements can remarkably change the local discomfort scenarios [31]. Smart land management policies call for the incorporation of such city-specific data. Urban morphology is commonly assessed using aerial Light Detection and Ranging (LiDAR) technology, Local Climate Zones (LCZs), big data and OpenStreetMap, etc. [32,33,34]. In this work, the morphological settlement zones (MSZs) delineated by the European Commission were used to understand urban geometry. This information is generated in a hybrid manner by combining various geospatial techniques.
The other aspect of urban climate studies is the need to include population patterns and analyze their vulnerability with respect to the thermal environment. It can be summarized that city regions require more geographic information system (GIS)-based studies that can merge ambient discomfort, incorporating AT and RH patterns with the built-up geometry. Studies require inputs from both local climate profiles and urban design to effectively apply sustainable solutions. In this regard, the current work created a framework that can be used to evaluate the vulnerability of urban health in densely built tropical cities. The present research primarily focused on three objectives. The first aim was to thoroughly assess the various heat indices for the given study area to highlight the extremely critical conditions of a tropical metropolitan or megacity. The second goal was to see how urban geometry is leading to the current thermal discomfort patterns. Lastly, the research prospect was to find better land management options based on the outputs of the first two objectives. For this purpose, a multicriteria approach was adopted, which considered the wind direction, morphological settlement zones, pavement watering scopes, building regulation suggestions and future landscaping plans. Urban greening practices need prioritized and systematic spatial data inputs. In this aspect, the results obtained from the current study are likely to be applicable in city planning for similar monocentric, fast-growing cities.

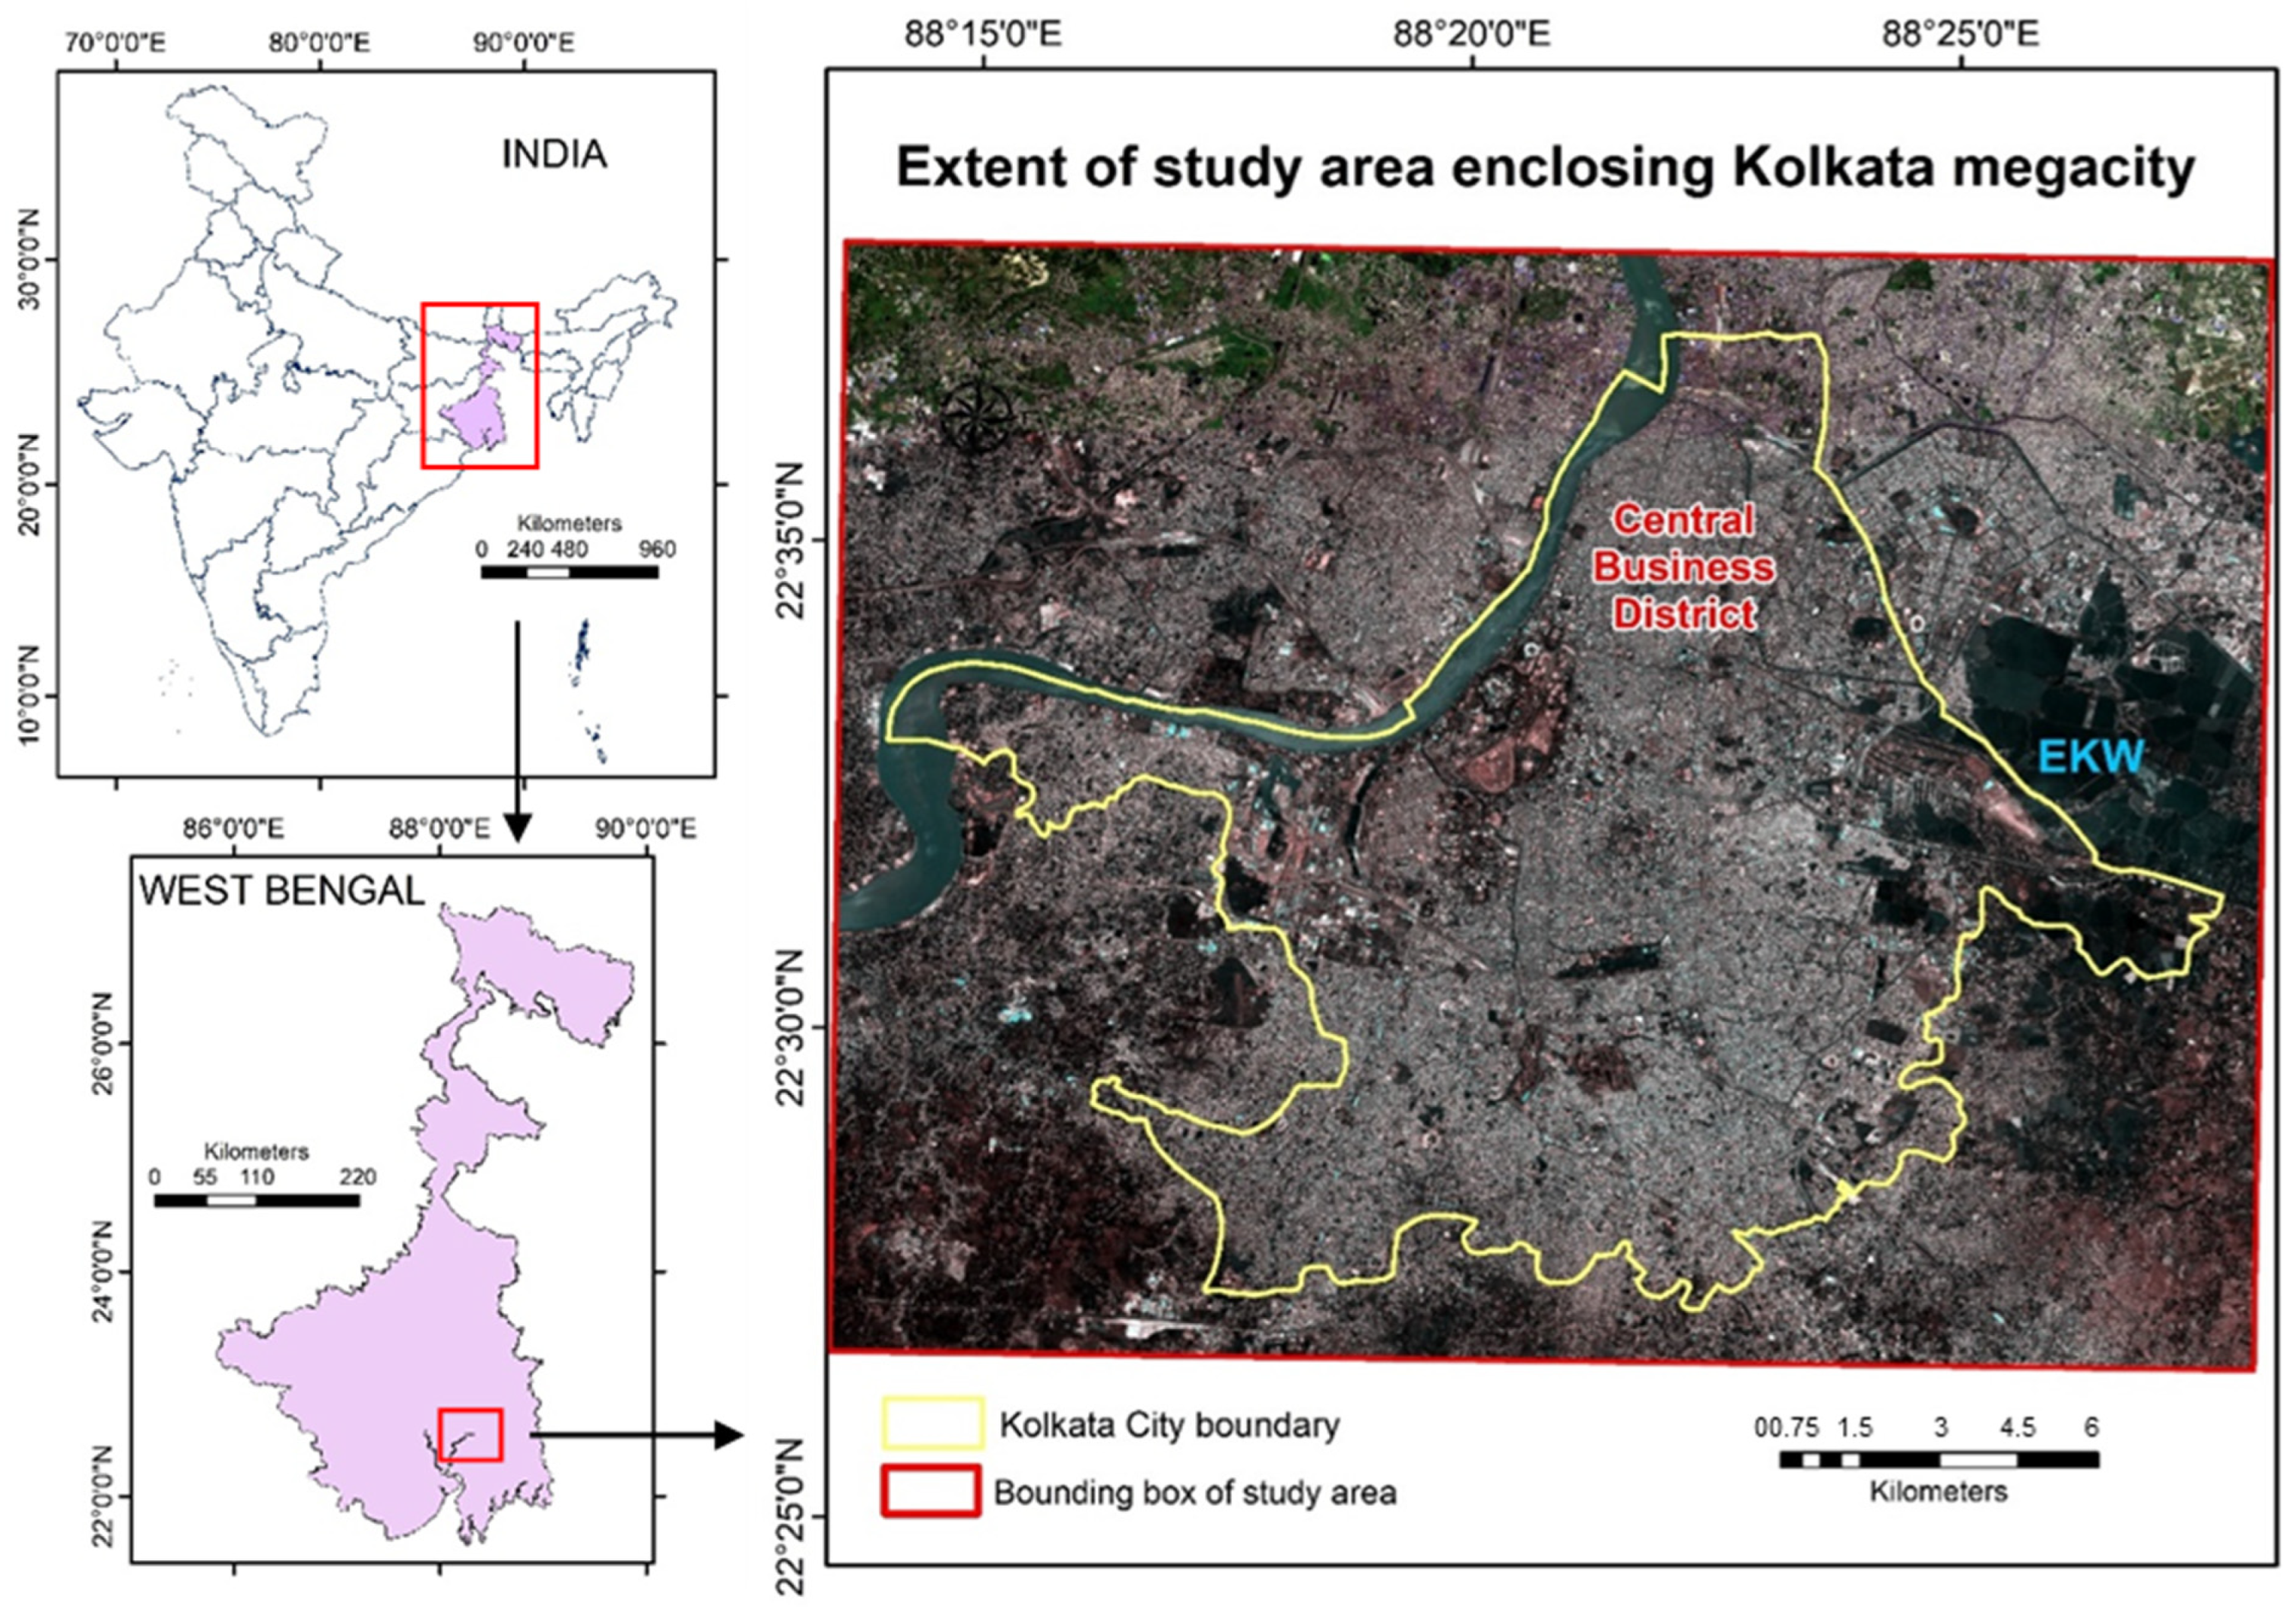
2. Significance of the Study Area

Indian city regions are altering the local environment with rapid urban development. Such changes are expected to affect the massive population of cities adversely. One such region is the Kolkata megacity. Kolkata is the former capital of India and the largest city in Eastern India. Geographically, the region belongs to a tropical wet and dry climate (Aw), as per Koppen’s scheme. Due to its growing commercial and residential sectors, the city has witnessed notable immigration. With the rising population, a further increase in urbanization occurred. Remarkable conversions of vegetation and wetlands into built-up areas have taken place. Ongoing urbanization has resulted in extremely hot and humid summers in Kolkata city in recent decades. Between 1950 and 2018, Kolkata saw the highest annual mean temperature rise (IPCC, 2021). The resultant discomfort level in Kolkata during summer is much worse than in many other tropical cities [35].
It is urgent to evaluate the thermal comfort/discomfort scenario in this megacity and the possible consequences of this on city dwellers. The city has a monocentric built-up pattern, with high-rises mostly being developed on the outskirts [10]. The variation in the arrangement of buildings in terms of density and height provides essential inputs for linking built-up morphology and the ambient environment. The dense mid-rises in the central business district (CBD), dense high-rises in satellite towns, and sparse mid-rises in peri-urban areas are prominent. There are many cities in the tropical region with similar urban structures. Hence, studying the Kolkata megacity can provide a framework for smart urban planning for numerous other cities. Another significant part of the study area lies within the East Kolkata Wetland (EKW). This vast wetland at the eastern border of Kolkata has major environmental importance. The proximity to such a vast wetland may affect temperature and humidity in the vicinity. Hence, a bounding box was created around Kolkata city, which included the EKW. This was considered as the study area, and its extent is shown in Figure 1. The area extended from 22°26′ N to 22°38′ N and from 88°13′ E to 88°28′ E.

3. Dataset Description
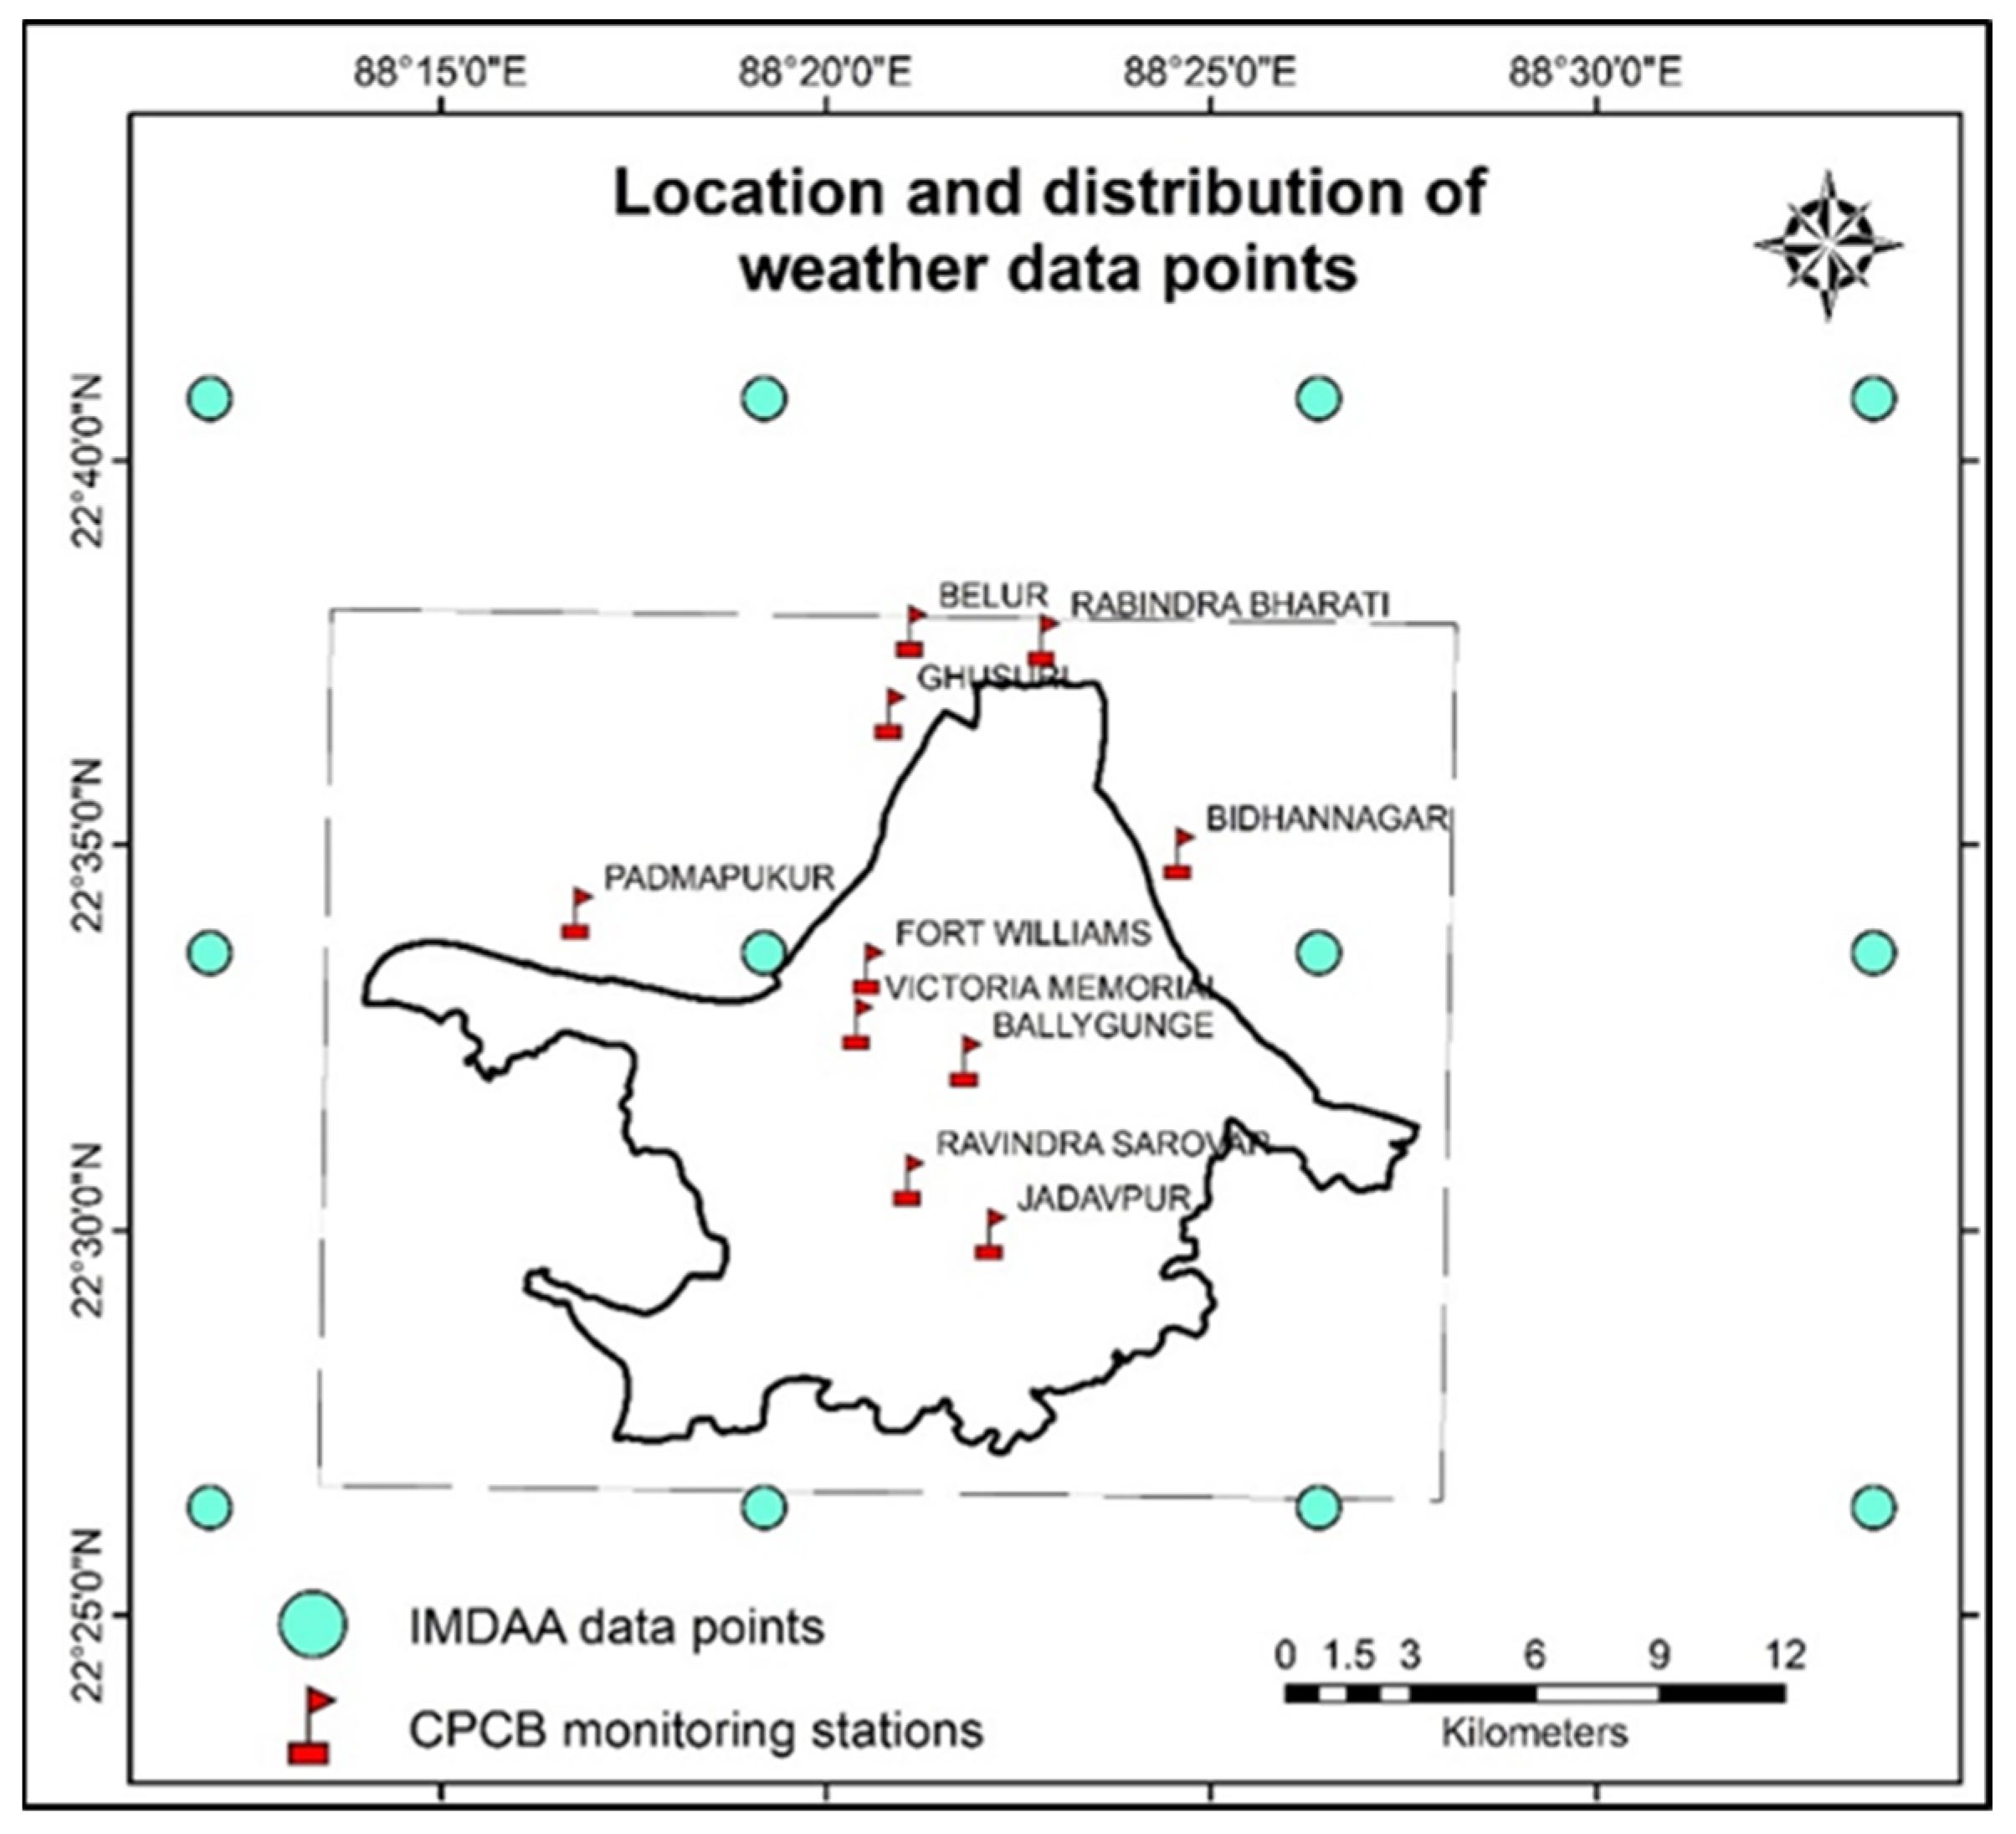
A combination of raster and vector datasets was used to explore the current thermal environment conditions of Kolkata City. The sources and characteristics of these datasets are discussed below.

3.1. Weather Data

AT and RH were the primary datasets used to understand thermal discomfort. This study focused on the extreme summer conditions of a tropical megacity. Hence, the April and May months of 2023 were considered. Hourly data on AT and RH were collected at 2 m height. The 2 m ambient temperature is closely linked to the skin temperature and, hence, is considerably affected by urbanization processes [36]. Due to a lack of granular wind velocity data, this factor was not included in the analysis. Only from a mitigation aspect, the overall wind direction data were included in this study. In the case of AT and RH, two different sources were used to obtain the data. The different point data were then merged to create a layer covering Kolkata city.

3.1.1. Indian Monsoon Data Assimilation and Analysis (IMDAA) Reanalysis Datasets

The IMDAA system provides hourly weather data over the Indian subcontinent with a spatial resolution of 12 km × 12 km. The weather information is generated through a reanalysis model, where data are provided by the United Kingdom Met Office (UKMO), the National Centre for Medium Range Weather Forecasting (NCMRWF), and the India Meteorological Department (IMD). The system uses an intermittent data assimilation cycle. A total of 12 data points were present in and around the study area and were used in the work. The hourly data were used to compute the average AT values in April and May. Further, the maximum AT values of each location were also noted to determine the utmost thermal discomfort. Similarly, the hourly average of RH values was used for the two summer months.

3.1.2. Central Pollution Control Board (CPCB)

A total of 10 CPCB weather monitoring stations were available in the study area extent. Average AT and RH values for the April and May months of 2023 were procured from this source. The point data from both sources were merged (22 data points in total) as a single point file before further applications. The wind direction data in degrees clockwise from due north were also obtained from these stations for summer (May). The location of the IMDAA data points and CPCB monitoring stations is shown in Figure 2.

3.2. Global Human Settlement Layer (GHSL) Datasets
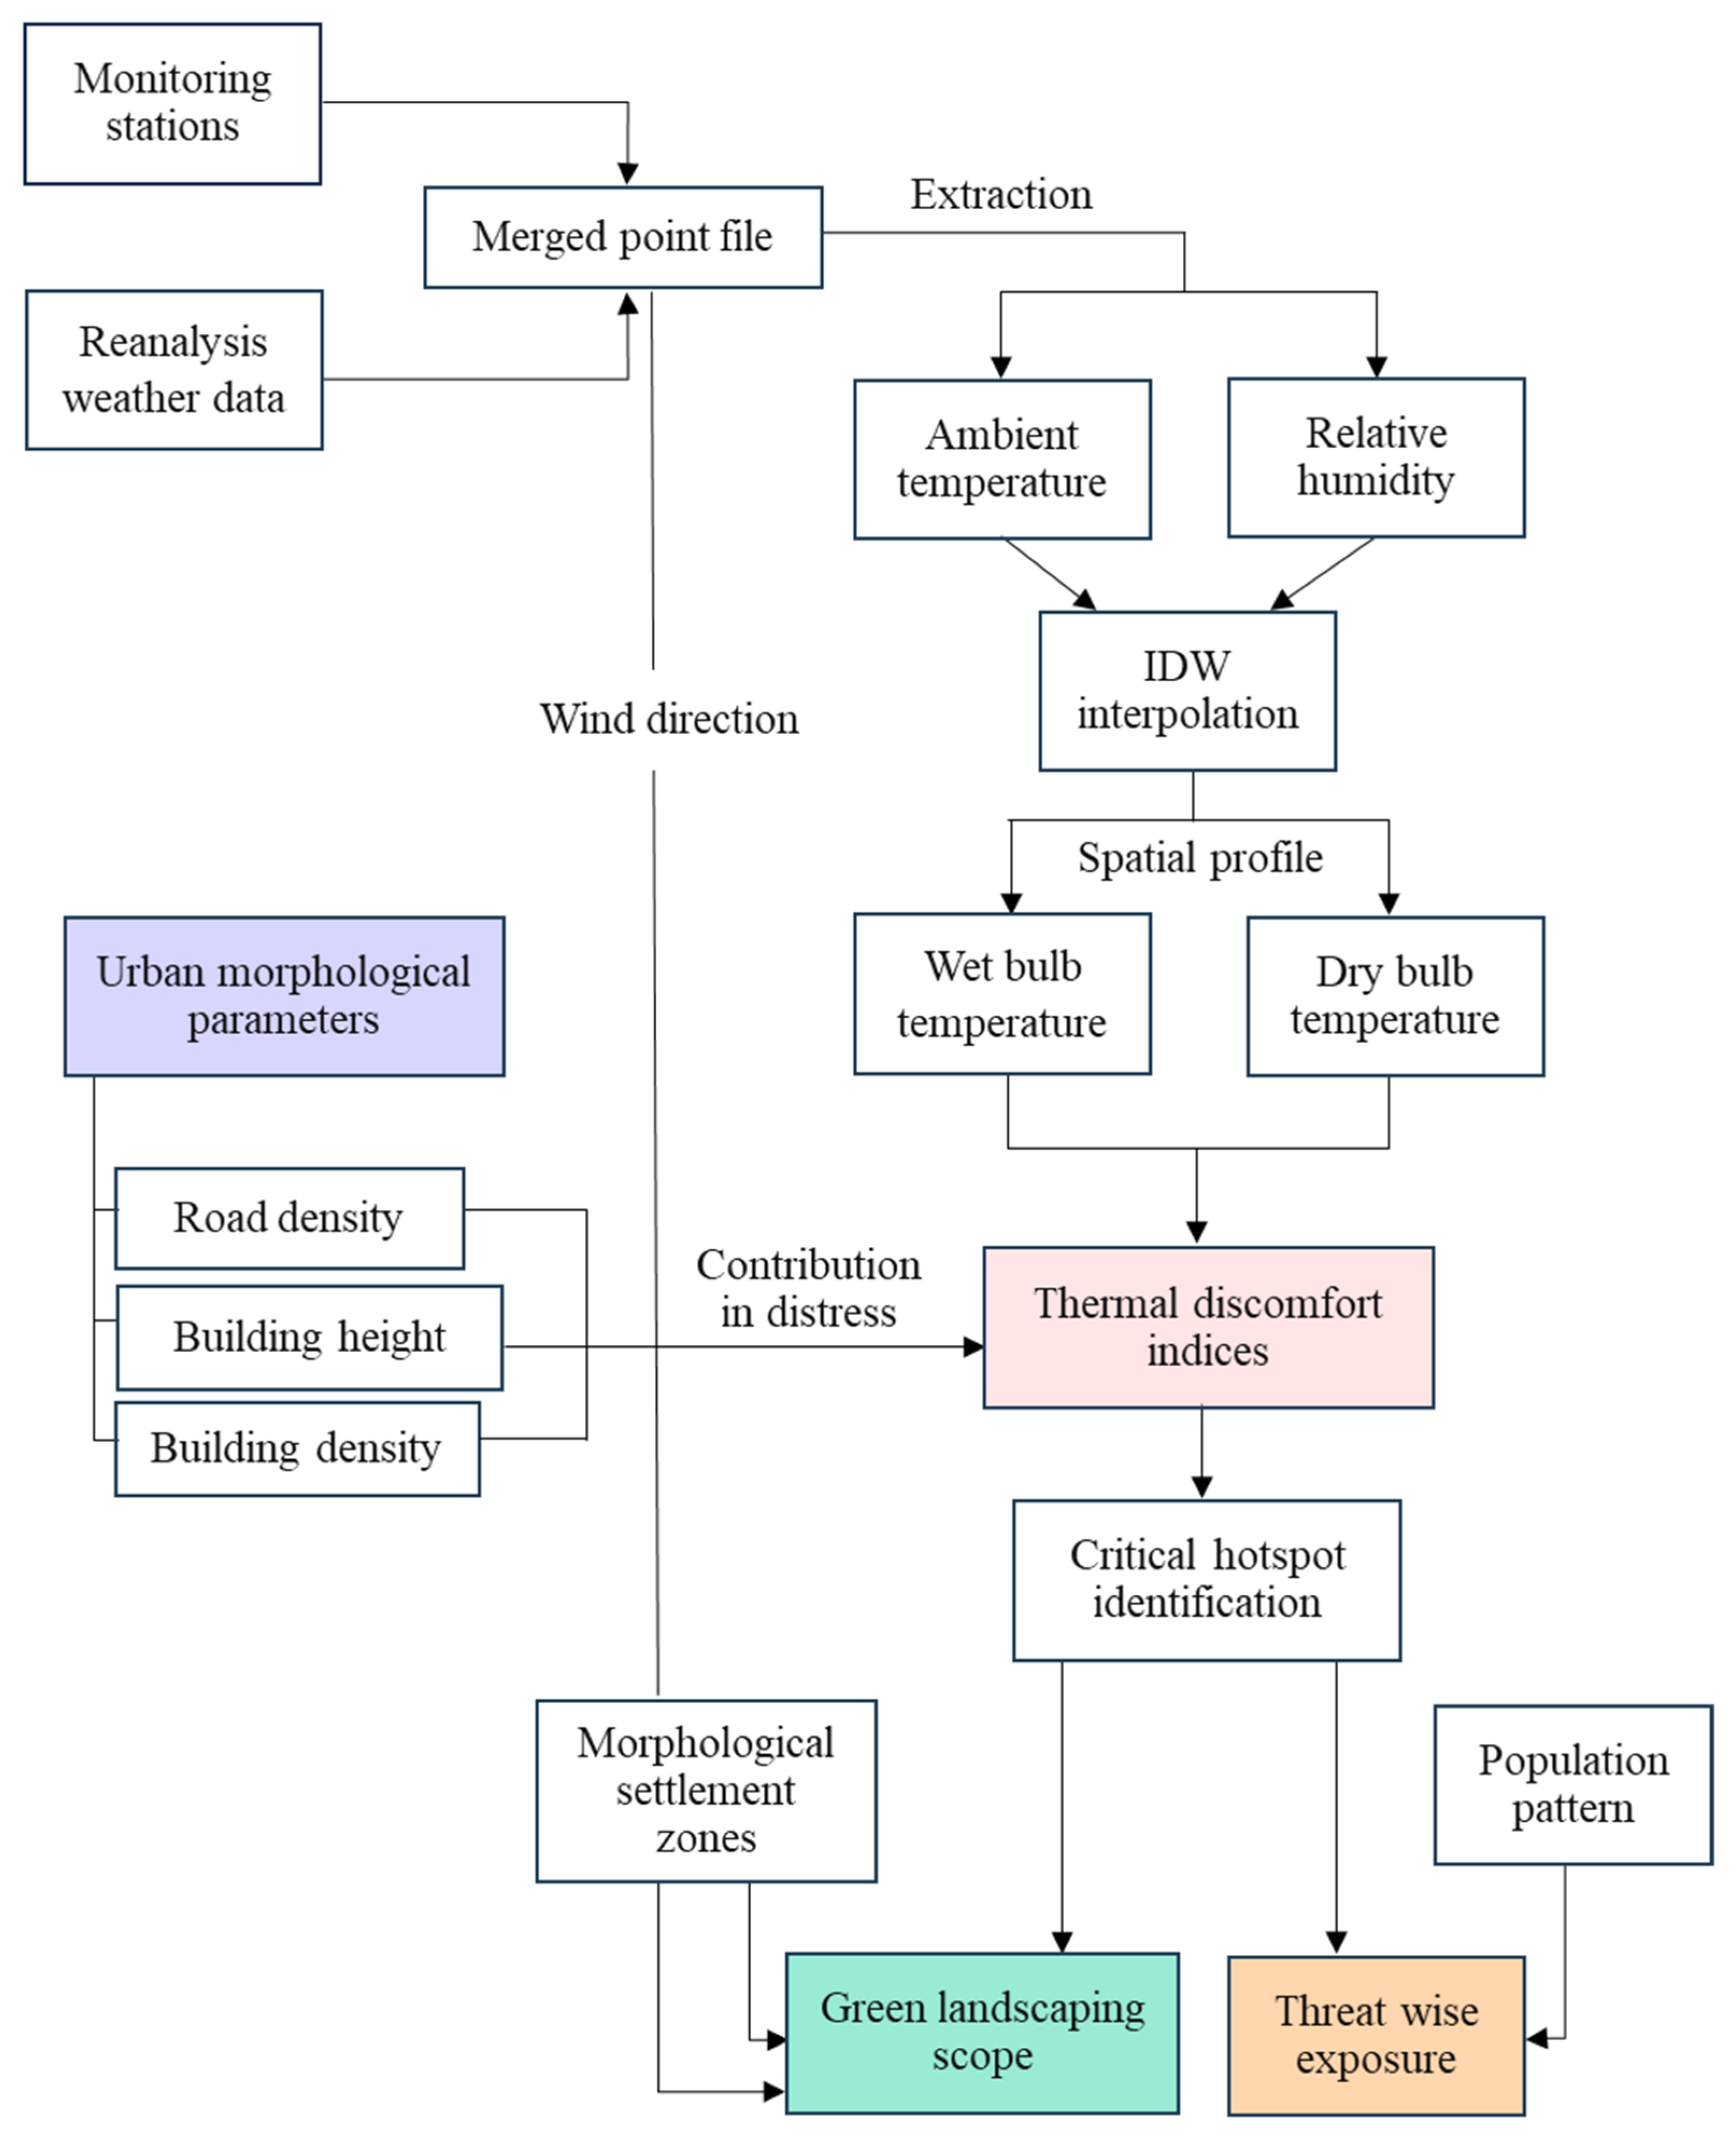
The spatial information of multiple urban characteristics was obtained from the GHSL dataset. Raster images were obtained from this source for 2020 since these were the latest data available. GHSL data are an amalgamation of findings from satellite images, census data and volunteered geographic information. The population density maps were procured from GHSL. These density maps depict people per 100 m × 100 m grid [37]. A number of indicators showing urban built-up characteristics were also obtained from this source. This included building height (m) and built-up surface cover (m2) data that have both residential and non-residential impervious surfaces [38,39]. Additionally, the morphological settlement zones (MSZs) were extracted for the study area from this source [40]. MSZs provided a detailed land use profile, like roads, residential sectors, vegetation, commercial centers, etc., of the city.

4. Methodology

A set of geospatial techniques were utilized to map thermal discomfort in Kolkata. Further, the built-up data were extracted, and the relationship between urban settings and the thermal environment was quantified. A brief overview of the work framework is shown in the following chart along with highlights of the major aspects of this study (Figure 3). The detailed methodology is discussed further.

4.1. Mapping the Ambient Temperature and Relative Humidity

Thermal comfort is closely linked with air temperature [41]. Before computing the thermal discomfort indices, the ambient temperature at 2 m was mapped. The average AT values for the summer season of 2023 (April and May) were obtained by merging both CPCB and IMDAA data points. So, the spatial profile of AT was generated from a total of 22 data points spread in and around Kolkata for better results of interpolation. The AT values at these points were interpolated to 120 m spatial resolution using the Inverse Distance Weighting (IDW) method to generate a continuous surface of AT for the study region [42]. The resolution was kept in accordance with the spatial data collection by Landsat. A similar procedure was used to plot the daily average relative humidity values of summer 2023. The IDW is a deterministic method that assumes the existence of spatial autocorrelation among features. This is, hence, appropriate to predict the unknown values of physical characteristics, like AT or RH.
Based on the AT or the dry bulb temperature (TD) and RH, the wet bulb temperature (TW) was calculated [43]. TW was further used for the computation of thermal comfort indices. The calculation of TW is as follows
TW = TD × arctan {0.151977 × (RH + 8.313659)1/2} + arctan (TD + RH) − arctan (RH − 1.676331) + 0.00391838 × RH3/2 × arctan (0.023101 × RH) − 4.686035

4.2. Thermal Discomfort Indices

Various indices have been developed globally to reflect the thermal comfort and discomfort in given weather conditions. Three such globally relevant indices were computed and mapped in the current work. These indices were selected as they were suitable for application in high AT and varying RH conditions. Also, indices that require physiological data inputs were not considered since such detailed data were not available. The computation procedures of the selected indices are elaborated in the following sections.

4.2.1. Heat Index (HI)

The National Weather Service (NWS) of the United States has provided a heat index since 1990 depending on the air temperature (in °F) and humidity (%). The index is a rectified version of the results obtained through multiple regression analysis [44]. The HI is suited for heat stress evaluation of tropical regions as its application for categorizing high-temperature conditions (27 °C to 43 °C) has been verified. Apart from AT and RH, nine constants are used to compute the HI. The formula for HI is shown below
HI = C1 + (C2 × AT) + (C3 × RH) − (C4 × AT × RH) − (C5 × AT2) − (C6 × RH2) + (C7 × AT2 × RH) + (C8 × AT × RH2) − (C9 × AT2 × RH2)
where, C1 = −42.379; C2 = 2.04901523; C3 = 10.14333127; C4 = 0.22475541; C5 = 0.00683783; C6 = 0.05481717; C7 = 0.00122874; C8 = 0.00085282; C9 = 0.00000199.

4.2.2. Universal Thermal Climate Index (UTCI)

The UTCI is one of the most prominently used outdoor thermal comfort indices. In tropical environments such as the current study region, the UTCI can be used for heat stress assessment. The threshold values for different stress classes of UTCI were previously generated using a model that considers dynamic thermoregulation of the human body [45]. Thus, the index is suitable for universal application and is also valid for both micro- and macro-scale studies [46]. The classes of heat stress, along with their respective ranges of AT values, are shown in the following table (see Table 1). The obtained summer AT pattern in this study was reclassified into different heat stress zones based on the mentioned ranges.

4.2.3. Wet Bulb Dry Temperature (WBDT)

This index was simply based on both TW and TD. In [47], this index was developed to reflect heat stress based on wet bulb and dry bulb temperature values. Over a time period of 18 years, 2069 cases were studied with weather measurements and heat-related illness. They came up with the WBDT index, which enhanced the heat illness risk prediction. The index is suitable for application in areas where the RH range may vary considerably. This index is fitting for categorizing a vast city region where different types of surfaces are present, from CBD to fringe, and the RH pattern keeps changing. WBDT was computed as
WBDT = 0.4 × TW + 0.6 × TD
The threat of the ambient environment can range from low to high based on the increasing values of this index, with elevated and moderate threats in between the two extremes.

4.2.4. Population Exposure at Various Discomfort Zones

The vulnerability of the city population to different levels of hot-humid stress was also evaluated. All three indices were categorized into increasing discomfort classes based on their given thresholds. The population pattern in each zone was extracted and then vectorized to a point file. The total population in each discomfort zone was computed from the attributes of these point files. Simultaneously, the area cover of each discomfort zone was also noted. This will bring attention to the severity of hazardous local environment scenarios along with the quantification of population exposure.

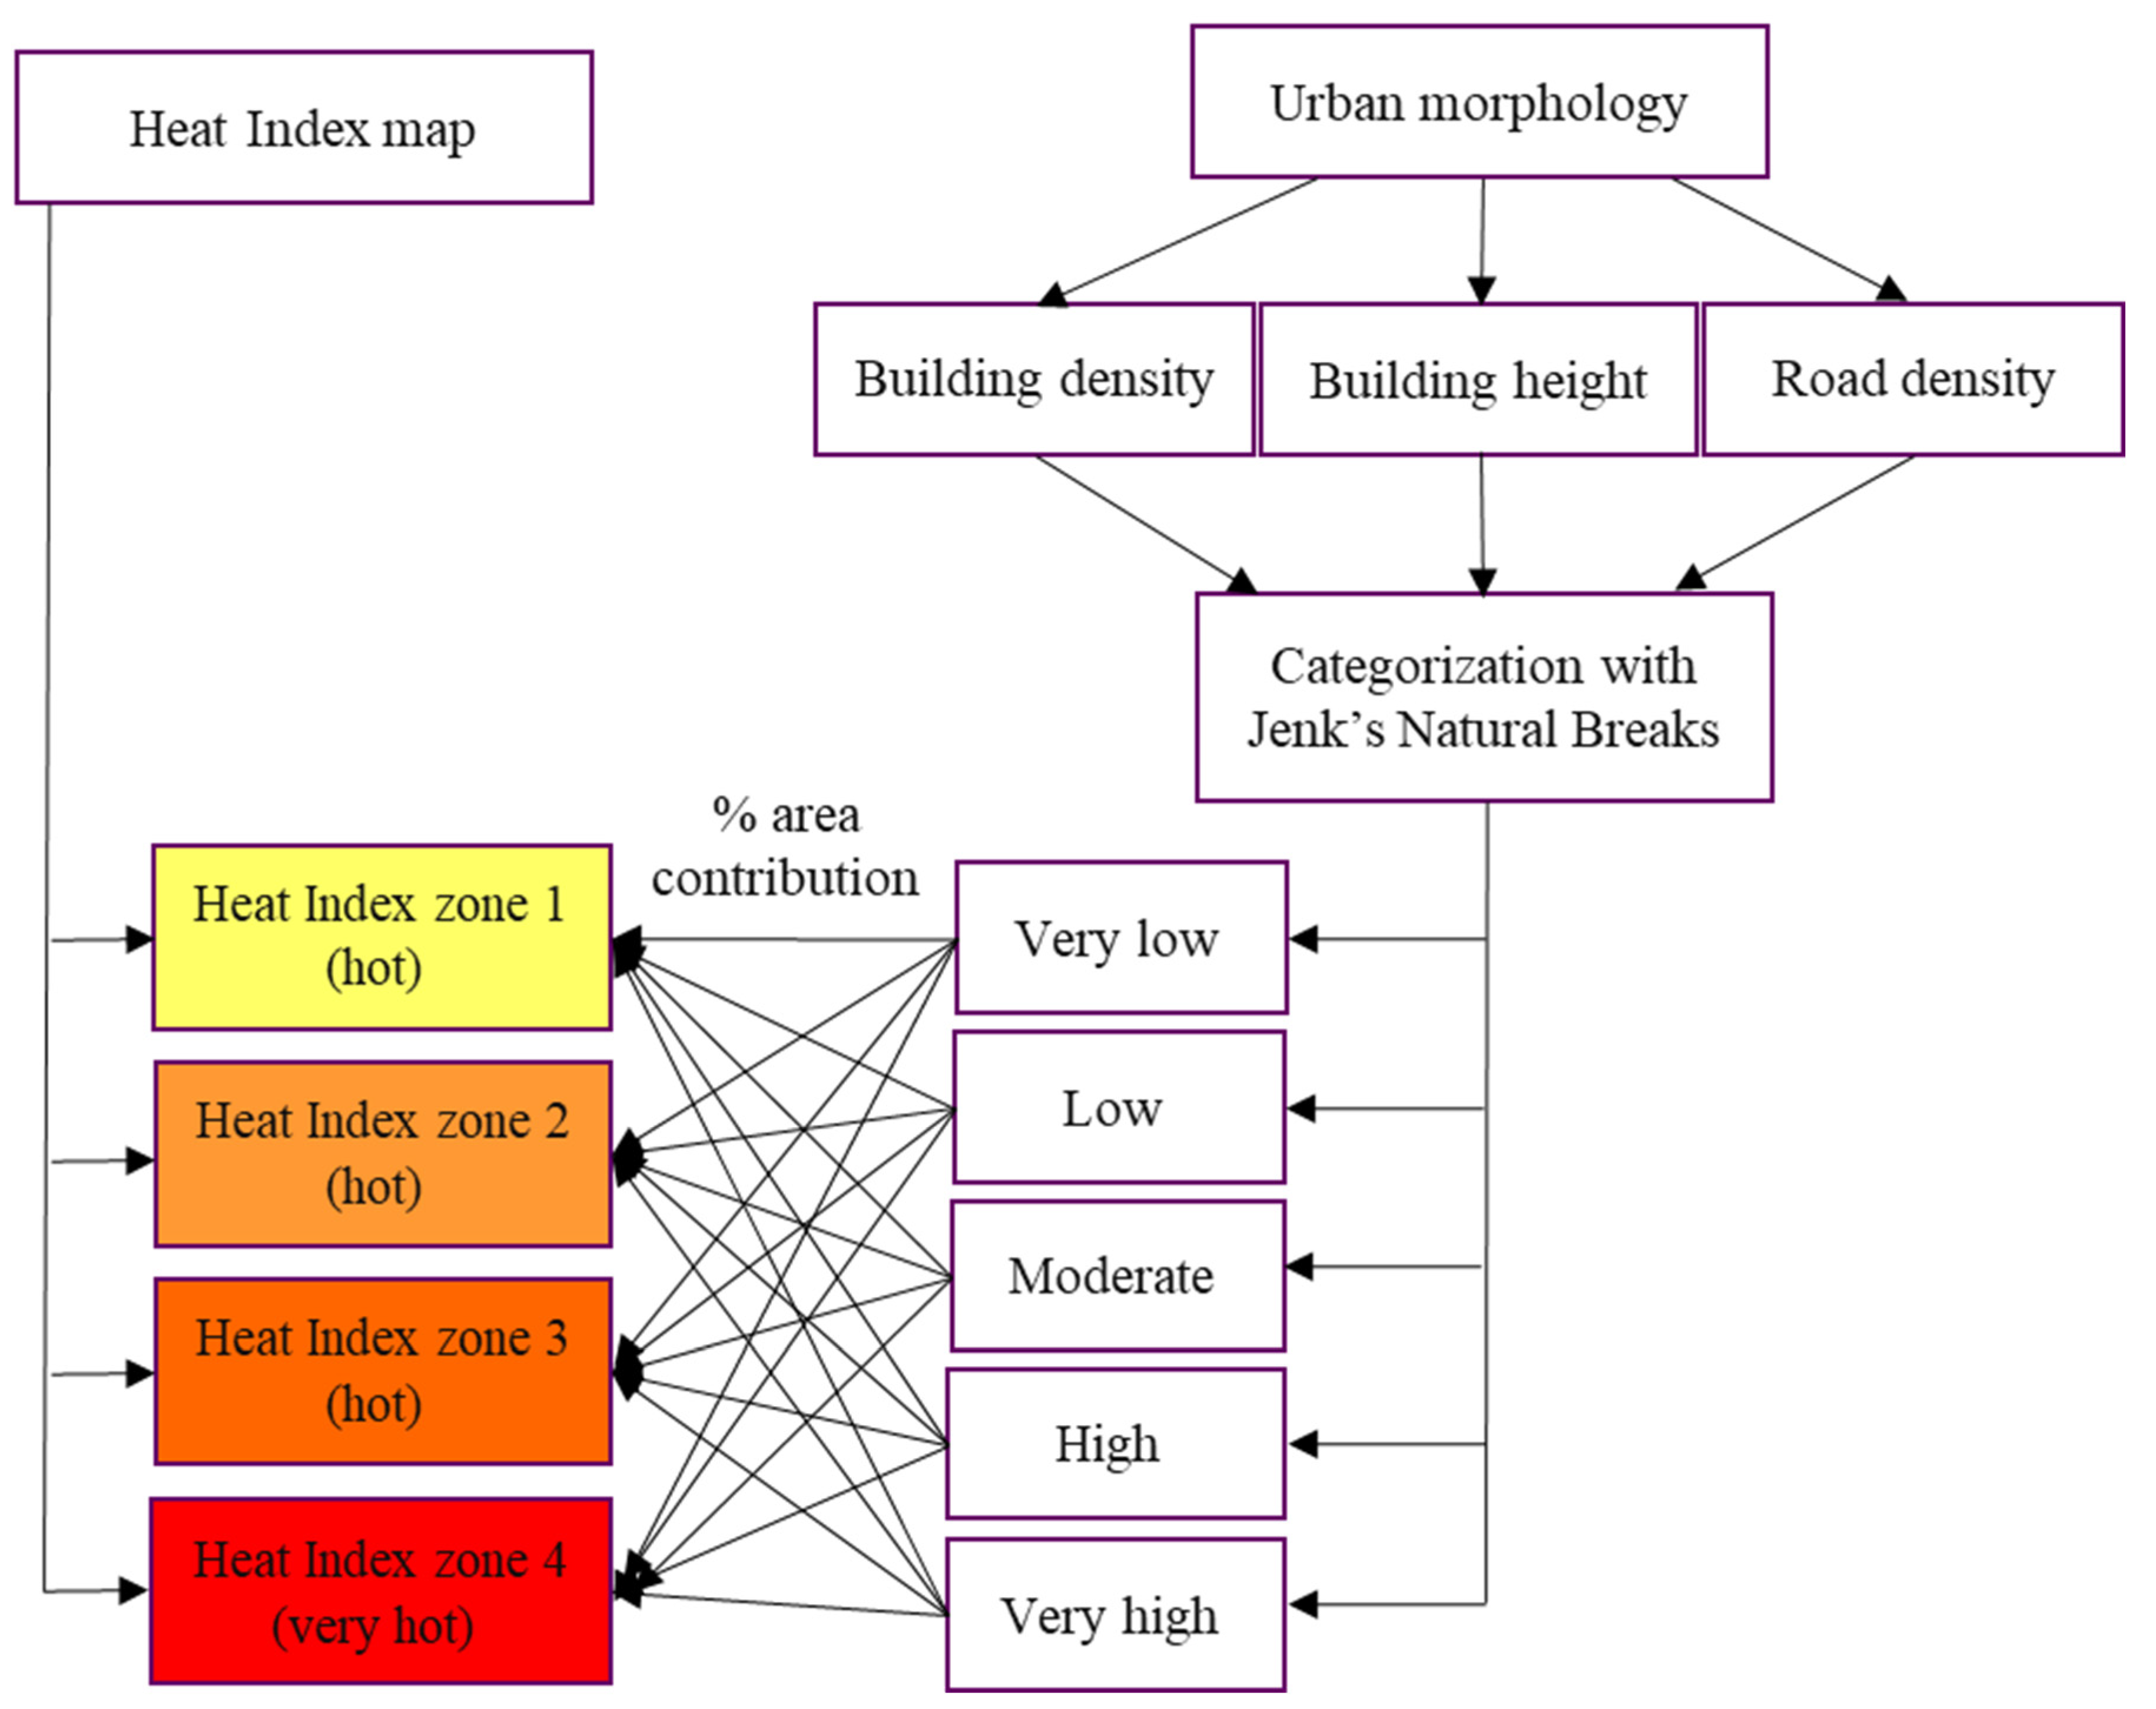
4.3. Contribution of Urban Morphology in Raising Thermal Discomfort

As discussed earlier, urban morphology is a complex system resulting from patterns of buildings, roads, the ratio of urban and open spaces, etc. The horizontal and vertical arrangement of buildings and road density directly influence the surface and immediate ambient temperature by controlling reflection, heat retention, vehicle congestion, etc. [26,27,48]. Hence, regulating their pattern could be crucial in diminishing thermal discomfort. In this regard, three morphological parameters were selected in the current work. These were the building heights, built-up surface cover or building density, and density of the road network. It is necessary to quantify how uniquely these parameters contribute to increasing thermal discomfort.
Building height data for the study area extent were extracted from the raster GHS layer. Similarly, built-up surface cover was extracted. This pattern was converted to a point file, and the building density was computed as the ratio of building surface and total cell area. It was, thus, calculated as the magnitude per unit area
B u i l d i n g   d e n s i t y = v e c t o r i z e d   b u i l t u p   p o i n t s c e l l   a r e a
Road density was calculated in the same manner but using line density per unit area within each cell instead of point density as follows
R o a d   d e n s i t y = v e c t o r i z e d   r o a d   p o l y l i n e c e l l   a r e a
Each of these parameters was then mapped over the study region and divided into five classes: very low, low, moderate, high and very high. Simultaneously, the HI map was divided into four zones of increasing discomfort. Three zones belonged to the “hot” class, and one was in the “very hot” category. The percentage area covered by various urban morphology classes in different heat index zones was then extracted. The computation of the contribution of urban morphology in creating a higher heat index is further explained by the flow diagram in Figure 4. The obtained ranges and values of building height or density can be used as thresholds for future city planning.

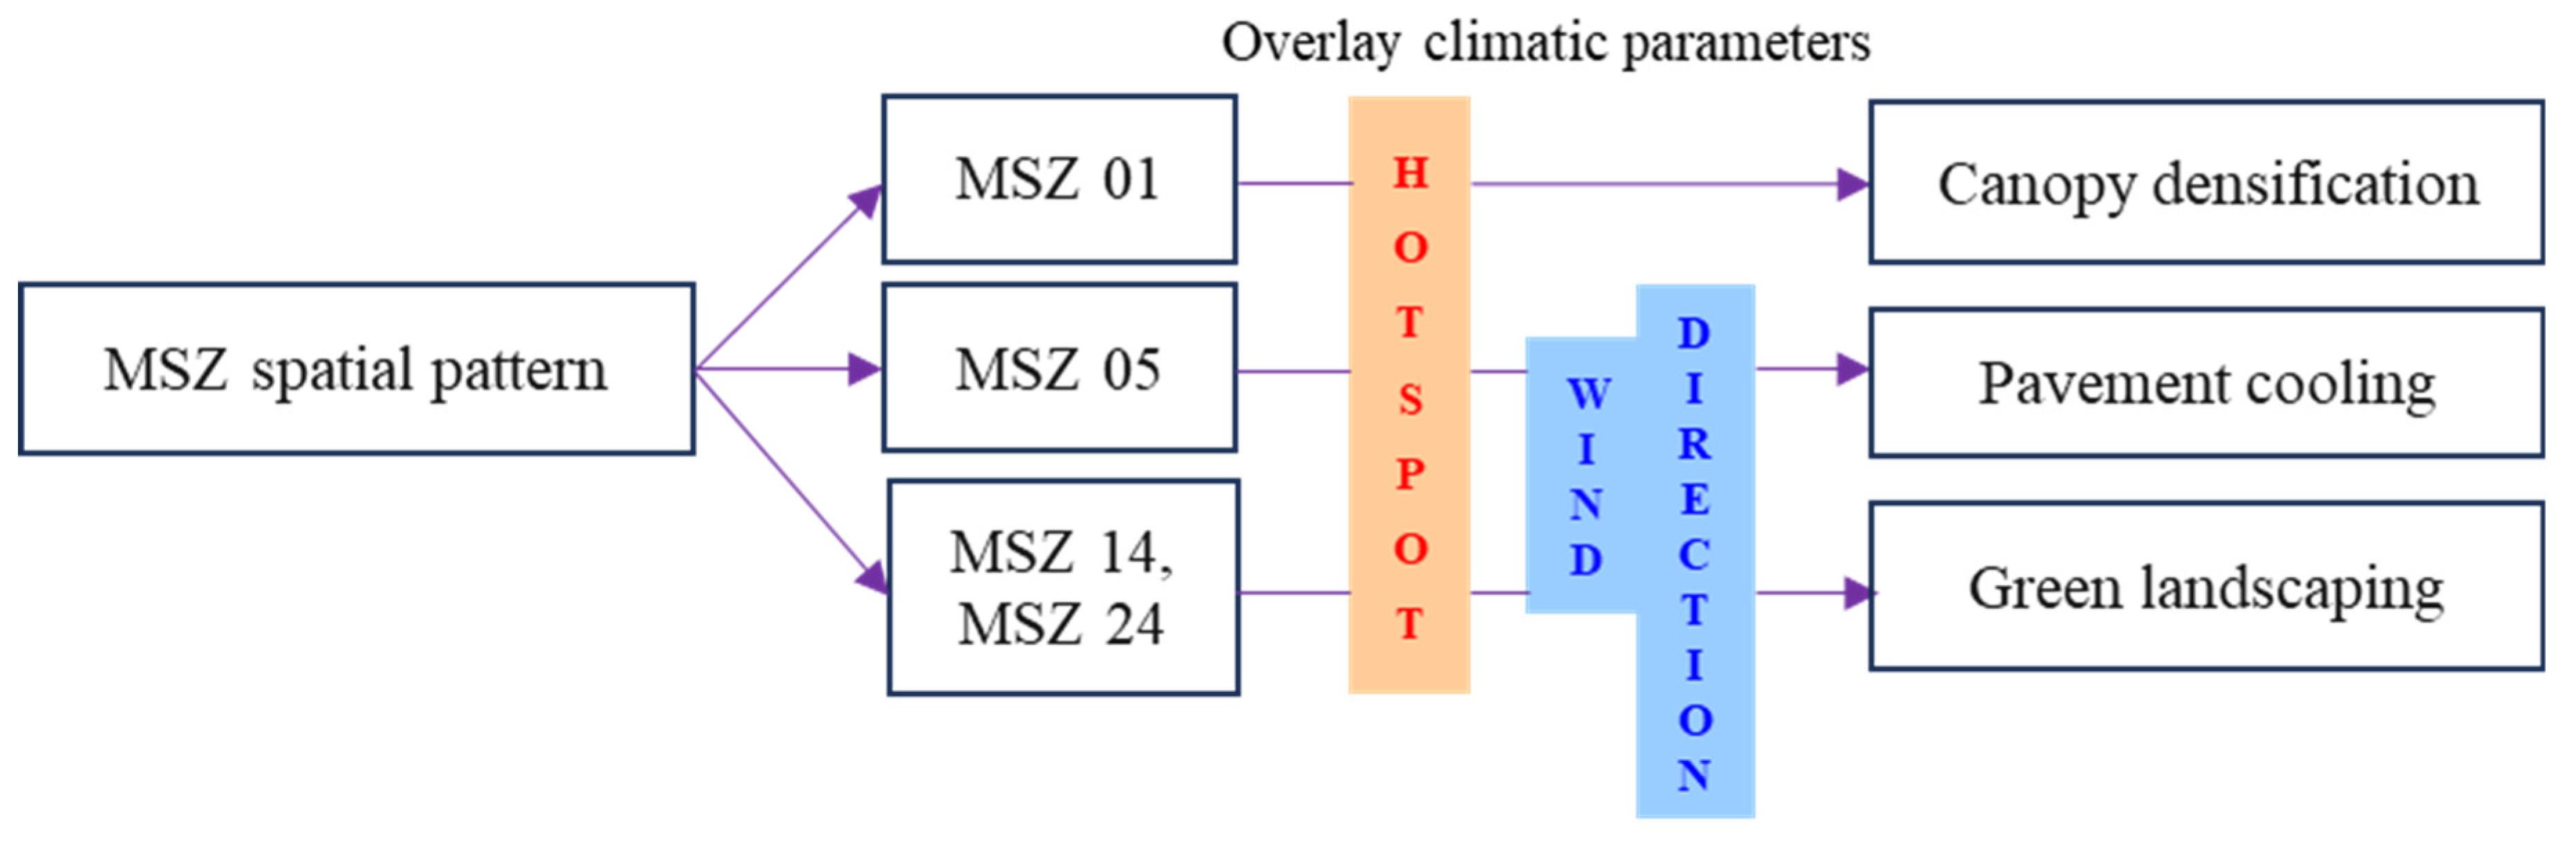
4.4. Spatial Profile of Morphological Settlement Zones

The scope of land management is unique to similar types of cities. These domains of human settlements can be assessed through the MSZ pattern [40]. These zones are created based on the built-up surface fraction function. A layered classification scheme is applied for MSZ creation. The two primary classes are open spaces and built spaces. The built-up space is then divided into compact and sparse categories. The various MSZ classes are listed below in Table 2, along with their characteristics.
Based on the locations of these classes, a detailed green landscaping suggestion was devised while including other local climate parameters, like humid heat indices and wind direction.

4.5. Thermal Discomfort Mitigation Prospects

The eventual goal of this work was to devise discomfort mitigation strategies. This can be performed with a multicriteria approach, including the outputs from previous sections along with wind direction inputs. Broadly, three major methods were considered for this, which will provide suitable land management solutions for Kolkata city. They are briefly outlined in Figure 5. The methods are further elaborated in the following sections.

4.5.1. Canopy Densification in Open Spaces

Research works have frequently highlighted dense planting with large canopies as the most important mitigation tool offering greater thermal performance [49,50]. In a study carried out by [51], a number of professionals performed a rating for urban design solutions, like the presence of water bodies, shading-based cooling, building geometry, vegetation, wind pattern, surface albedo, etc. Vegetation was the highest-rated solution, with a score of 4.83 out of 5. Hence, the first priority was applied to the scope of the plantation and densification of vegetation cover. For this, the MSZ map was overlayed on the discomfort hotspot zone. The open spaces with low vegetation cover and land availability were demarcated (MSZ 01), which also laid within high-thermal-stress zones. These locations should be urgently considered for an increase in dense plantation.

4.5.2. Pavement Cooling with Wind Direction Input

Another major strategy to enhance thermal comfort includes the use of local wind flow patterns. Pavement watering at major roads located in the upwind direction of the discomfort hotspot can drastically improve the cooling effect in summer [52]. It amplifies evaporation-related heat loss. An article [53] quantified that pavement watering may reduce the tropical ambient temperature (>30 °C) by 4 °C in the afternoon and by nearly 2 °C in the morning. This can potentially alter extreme-heat-stress areas into moderate-stress zones. To apply pavement watering in a sustainable way, the overall wind direction of Kolkata city for a summer day was generated. Thus, watering can be limited to roads that will provide maximum cooling. Roads lying perpendicularly to the direction of wind flow and at the upwind side of the hotspot will be suitable for this. These roads were identified, and their length was delineated to assess the need for water to be used during extreme summer heat.

4.5.3. Building Regulations and Future Zoning Plans

The outputs of building morphology contributing to thermal distress (Section 4.3) were used to provide regulations with building height and density values. Such guidelines will prevent the sprawl of extreme thermal discomfort in the suburbs with ongoing urbanization. As for the densely built city CBD, MSZ was used to locate mid-rise commercial and residential sectors. These sectors are ideal for green roofs and vertical gardening since they are not completely affected by shadows from other urban structures. Also, these buildings have a moderately high influence on the ambient temperature pattern close to the ground, compared to very high buildings with a lower cooling impact [54]. Again, the wind direction condition was used, and it was overlayed with MSZ 14 and MSZ 24. The commercial and residential mid-rise built-up regions at the upwind side of the discomfort hotspot were identified as green landscaping sites.

5. Results

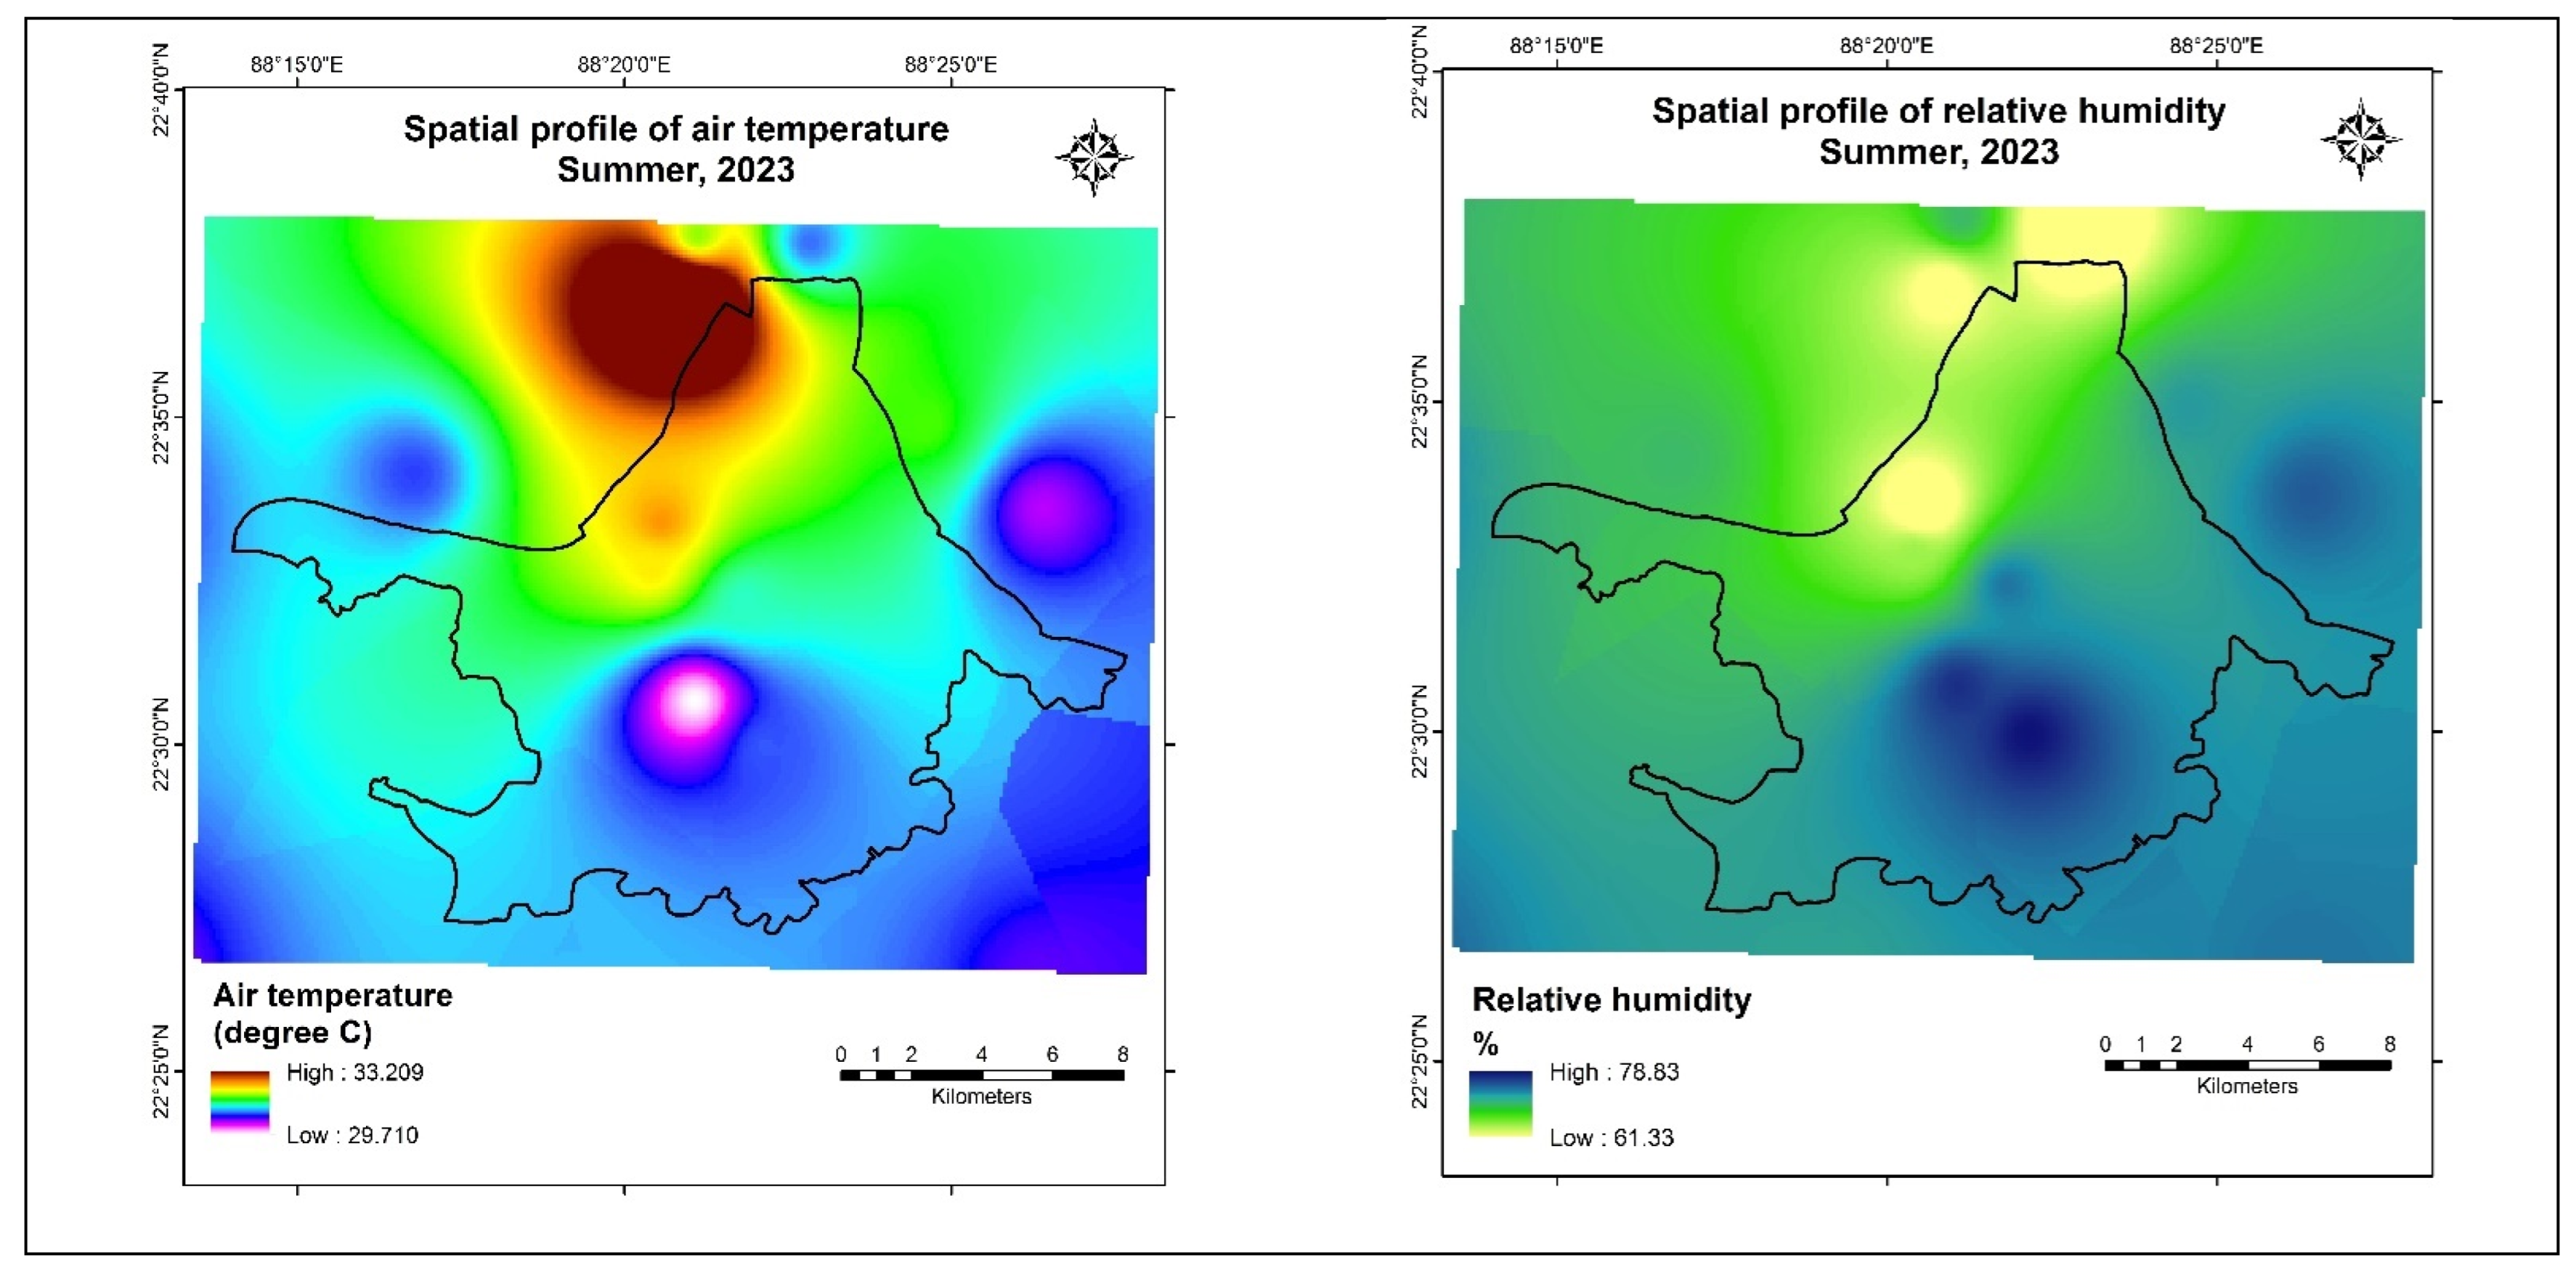
5.1. Spatial Profile of AT and RH

The pattern of air temperature and relative humidity in summer over the Kolkata city region is shown in Figure 6. The AT depicted an intensity of up to 3.499 °C in summer months. The major air-temperature-based hotspot was located in north Kolkata. In all other directions (south, east and west), AT gradually dropped. Two distinct points reflected the existence of cold spots. These were located in the eastern and southern sections. Both these locations had considerably large lakes or waterbodies, which was verified by the field survey. In terms of RH, the average humidity range in summer was very high (nearly 70%). The spatial patterns of AT and RH were contrasting in and around Kolkata city. The RH values gradually increased towards the south and were comparatively lower over the densely built north Kolkata.

5.2. Spatial Profile of Thermal Discomfort

Combining the two parameters of AT and RH, multiple thermal comfort/discomfort indices were computed and mapped. All of them reflected a concerning situation in this megacity region. The derived patterns of HI and WBDT are shown in Figure 7. The critical hotspot for all indices lies in the northern part of Kolkata city. In the case of HI, central Kolkata depicted thermal stress conditions more than the other indices. Four distinct hotspots can be observed that were not present for only the AT pattern. The critical zones for this study were clustered in the northern and central parts of Kolkata and were demarcated to be the most vital city pockets with urgent needs for green landscaping.
HI was further used for the remaining analysis for its sensitivity to minute changes. Additionally, the number of people living in each zone was also computed from the population density pattern. These numbers simply highlighted the acute threat of a large population to heat-induced health risks. The results indicated that at least 10 million people are at constant risk of moderate to high heat stress and associated illness during summer. The details of these discomfort zones and their percent cover are listed below in Table 3.

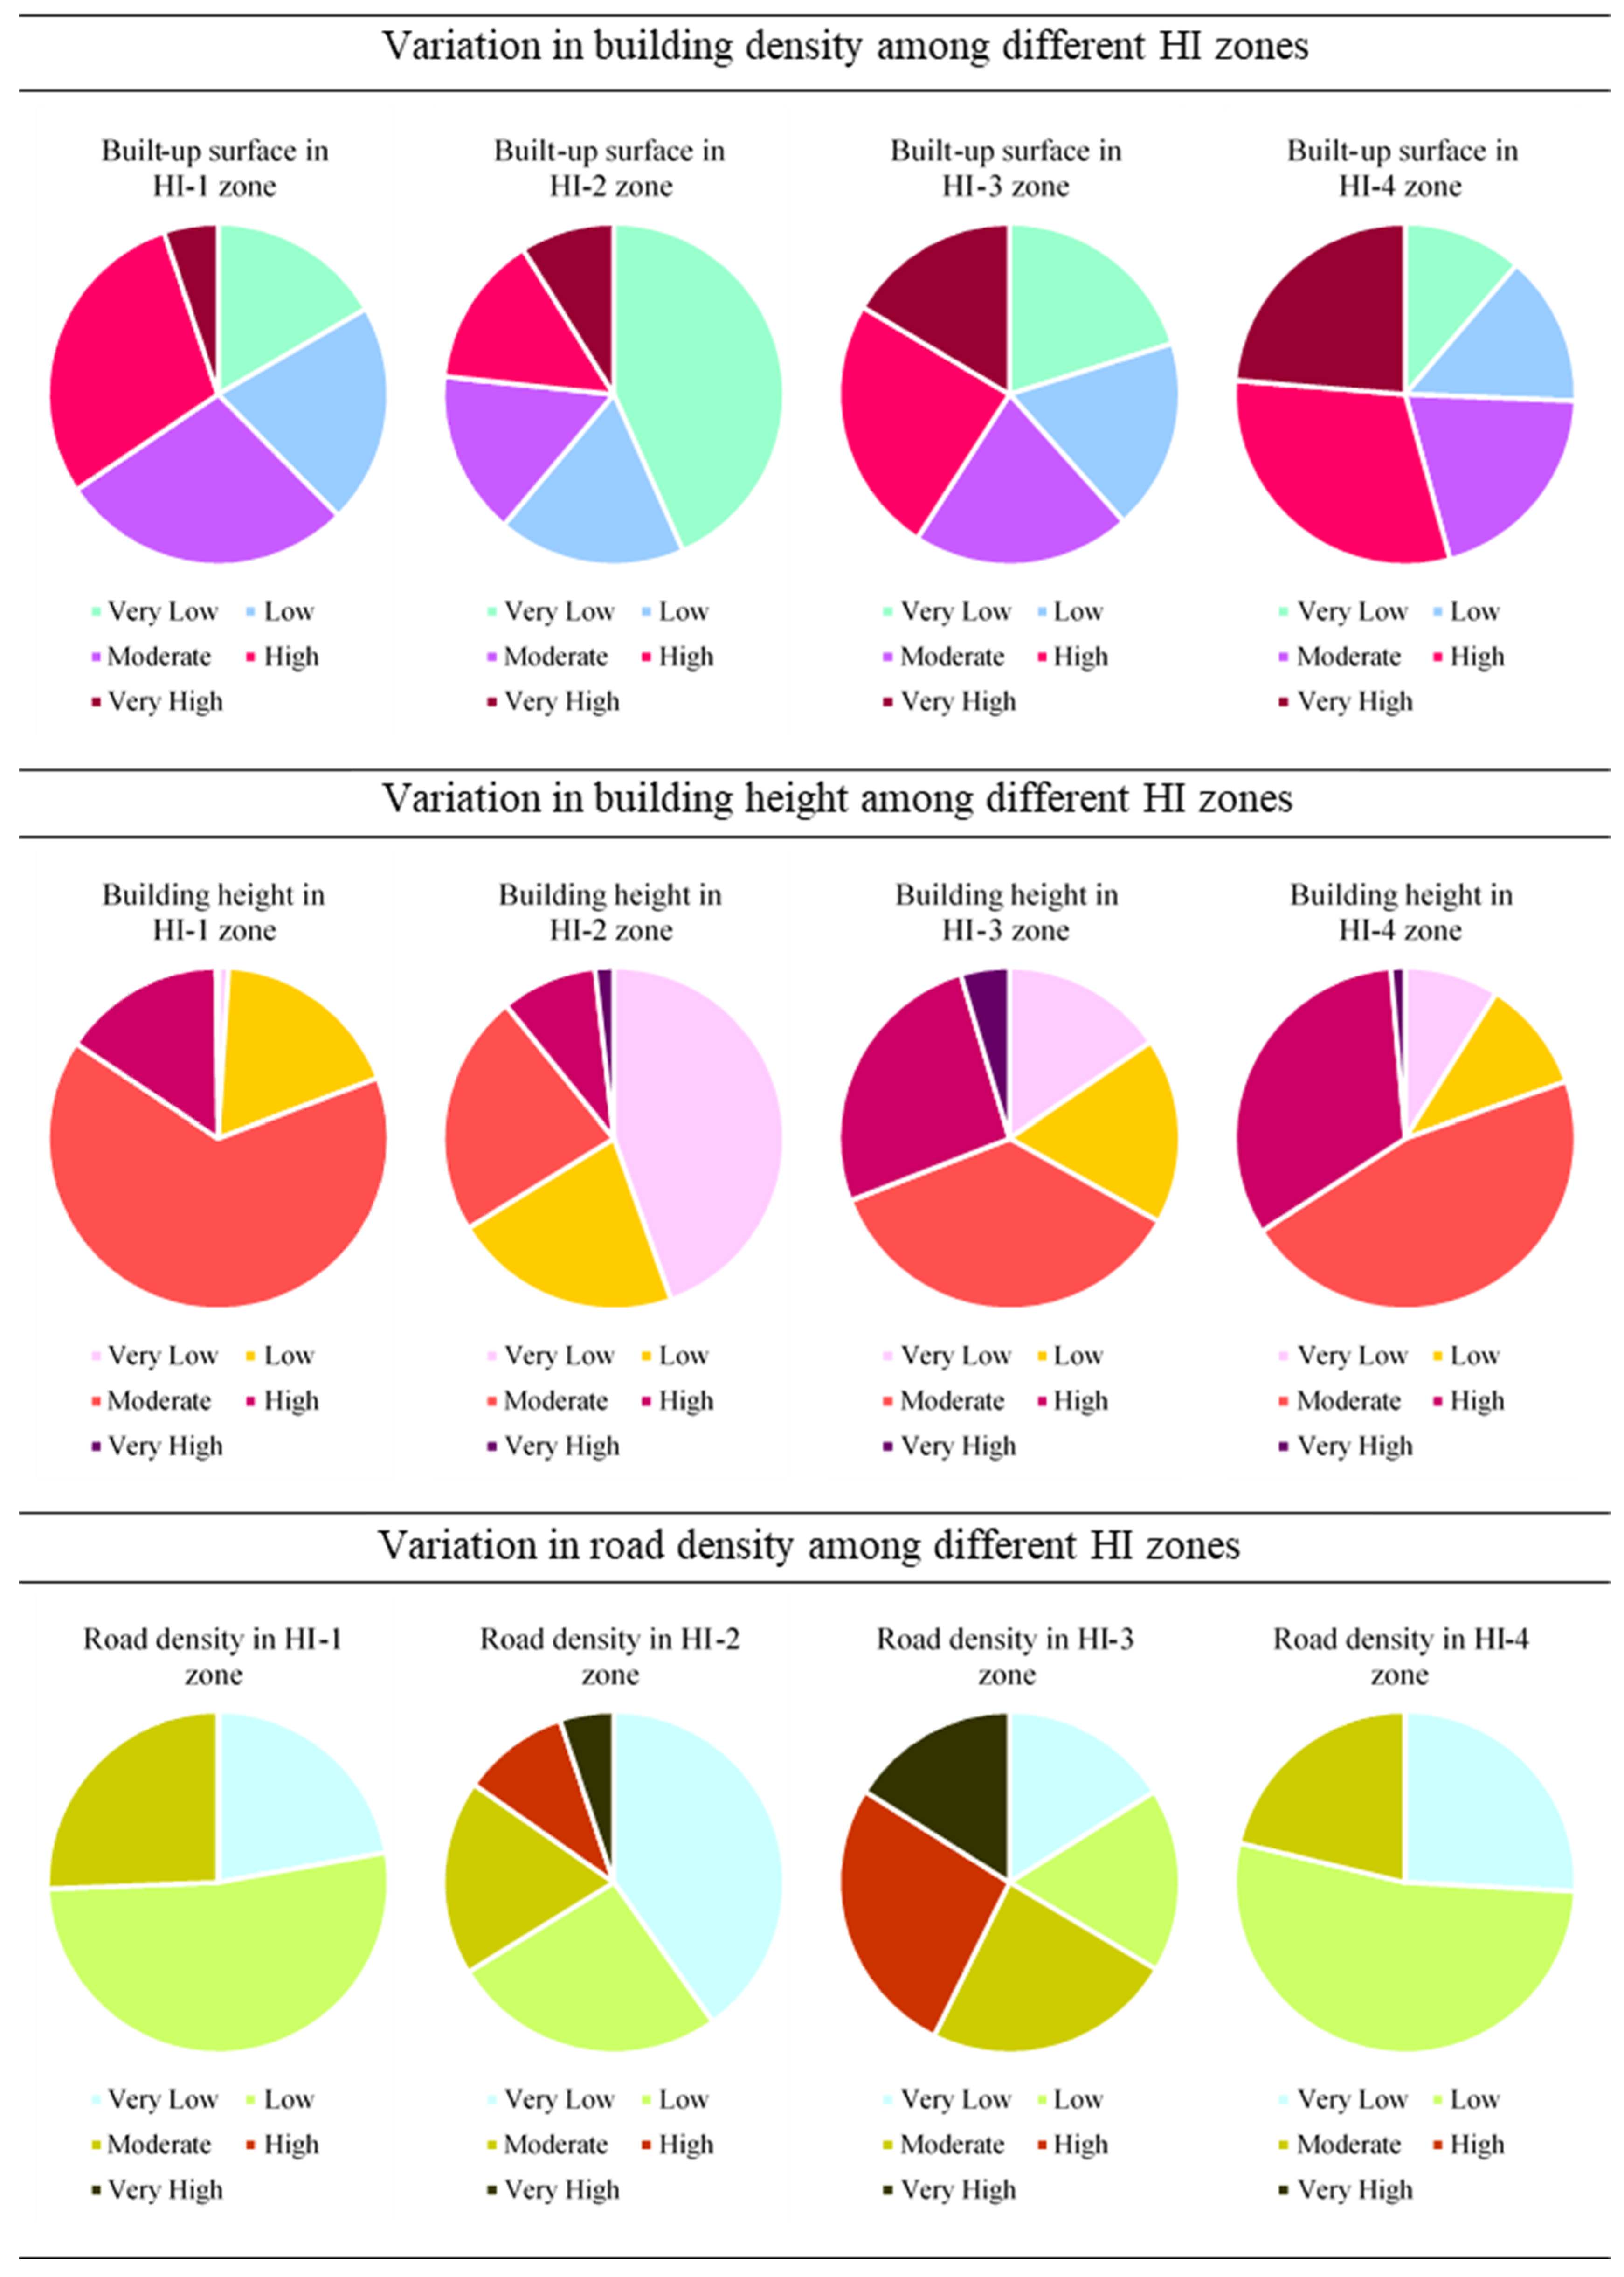
5.3. Contribution of Morphology in Increasing HI Values

The thermal environment of Kolkata can be improved by regulating new urban sprawl activities. First, the knowledge of urban built-up settings and their impact on the heat index must be addressed to achieve this. The contribution of urban morphology was evaluated by computing the percent area of each morphology class in continuously increasing HI zones (HI-1 to HI-4). The higher zone simply reflected higher thermal stress conditions. The contribution values for each zone are shown in Figure 8.
The variation in the urban morphology parameters depicted a notable contribution of building density in increasing the heat index and reducing thermal comfort. The percentage of very high building density gradually increased from the HI-1 zone to the HI-4 zone. Interestingly, the effect of building height was not independent of thermal discomfort. Higher buildings covered a considerable area in both the HI-1 and HI-4 zones. On the other hand, building height combined with density resulted in the worst thermal stress conditions. It can be concluded that in the most congested city centers, building heights should be strictly regulated. Taller structures above 9 m should be limited in the CBD and permitted in the sparsely built city fringes. The quantitative relationship between urban morphology and thermal discomfort provided the much-needed built-up area inputs for policy making. This critical building height information for various built-up density regions should act as thresholds in future city planning.

5.4. Spatial Pattern of Morphological Settlement Zones

The overall pattern of the urban setting in and around Kolkata is shown in Figure 9 along with the spatial area cover of various MSZ types. The majority of the city region was covered by open spaces and residential sectors. Non-residential sectors only covered some central city areas. The hotspots and cold spots of the HI map (from Figure 7) were examined with an overlay of the complex cluster of urban morphology. The mid-rise built-up area was prominently present at the discomfort hotspots of central and northern Kolkata. These zones will be critical in diminishing the heat stress problem. The possibility of green landscaping using these zones is further discussed in the following section.

6. Land Management Prospects from Current Research

Since reconstruction or landscaping all over the city to improve urban health is not a practical solution, the most suitable locations were demarcated, which can aid in enhancing urban health. Overlaying the already-generated results, certain land management prospects were outlined, which will reduce thermal discomfort in this study region. Location-specific suggestions were derived precisely in the following three aspects.

6.1. Densification of Vegetation Canopy in Open Spaces

The MSZ pattern overlayed on the “very hot” zone helped to identify the open spaces lacking considerable vegetation in high-discomfort areas. These open spaces should be given urgent attention to improve the vegetation cover and reduce HI magnitude and should be turned into cold spots. They included areas, like open ground near Bandhaghat Launch Ghat (ferry terminal), railway coaching complex, barren industrial grounds, etc. These locations were verified using Google Earth Engine and are shown in Figure 10.

6.2. Suitable Road Stretches for Pavement Watering

The wind flow pattern of the Kolkata city region on summer days was prominently from the southern direction. At different CPCB stations, the wind direction varied from 151° to 205° (0° at north). The overall trend of wind direction is shown in Figure 11. This suggested that roads aligned in the east–west direction are suitable for cooling through pavement watering. Such roads in the upwind side of hotspots were selectively mapped. These segments are shown in Figure 12 along with the location-specific wind directions.
Overall, 38.44 km road stretches were delineated for cooling purposes. Roads extending for 24.261 km lay near the major northern hotspot, while 3.981 km, 2.649 km and 7.55 km segments were present, respectively, near the eastern, central and southern hotspots. Pavement watering and street-side plantation should both be planned specifically in these locations.

6.3. Zoning plan and Building Regulations

Green landscaping at the already-present urban structures is the only feasible way to diminish thermal discomfort in the CBD region. The crucial residential and commercial built-up areas in Kolkata, which are suitable for green roofs or walls, were identified and are shown in Figure 13. Two major locations near the northern hotspot, Howrah Railway Station area (1) and Bara bazar market place (2), were demarcated for this purpose. Near the eastern hotspot, the Salt Lake stadium area (3) was most suitable for green landscaping. In the central city, the residential and non-residential built-up areas around Ballygunge Science College (4) were present with abundant roof space. In southern Kolkata, mostly residential apartments were available near Jadavpur area (5).
Also, the results from Section 5.3 suggested that to avoid extreme thermal stress, the building density should not increase beyond 70%. The ongoing urbanization in suburbs must be regulated by monitoring-zone-wise building density.

7. Discussion

According to the ranges for the various discomfort indices, the Kolkata city region depicted severe thermal stress. As per HI, city dwellers are at risk of sunstroke, heat cramps and exhaustion during summer days. Heat stroke is possible over the “very hot” zone due to prolonged exposure or physical activities. As per UTCI, moderate heat stress was present everywhere in the study area in the summer season based on average summer conditions. It can be assumed that during maximum AT conditions in the afternoon, the percent cover of the “strong heat stress” zone (UTCI) or the “very hot” zone (HI) is likely to increase. Thus, the findings summarize the necessity to incorporate the thermal environment as an important aspect of smart and sustainable urban planning. Further, some major outcomes of this study are discussed in the following section.

7.1. Key Findings

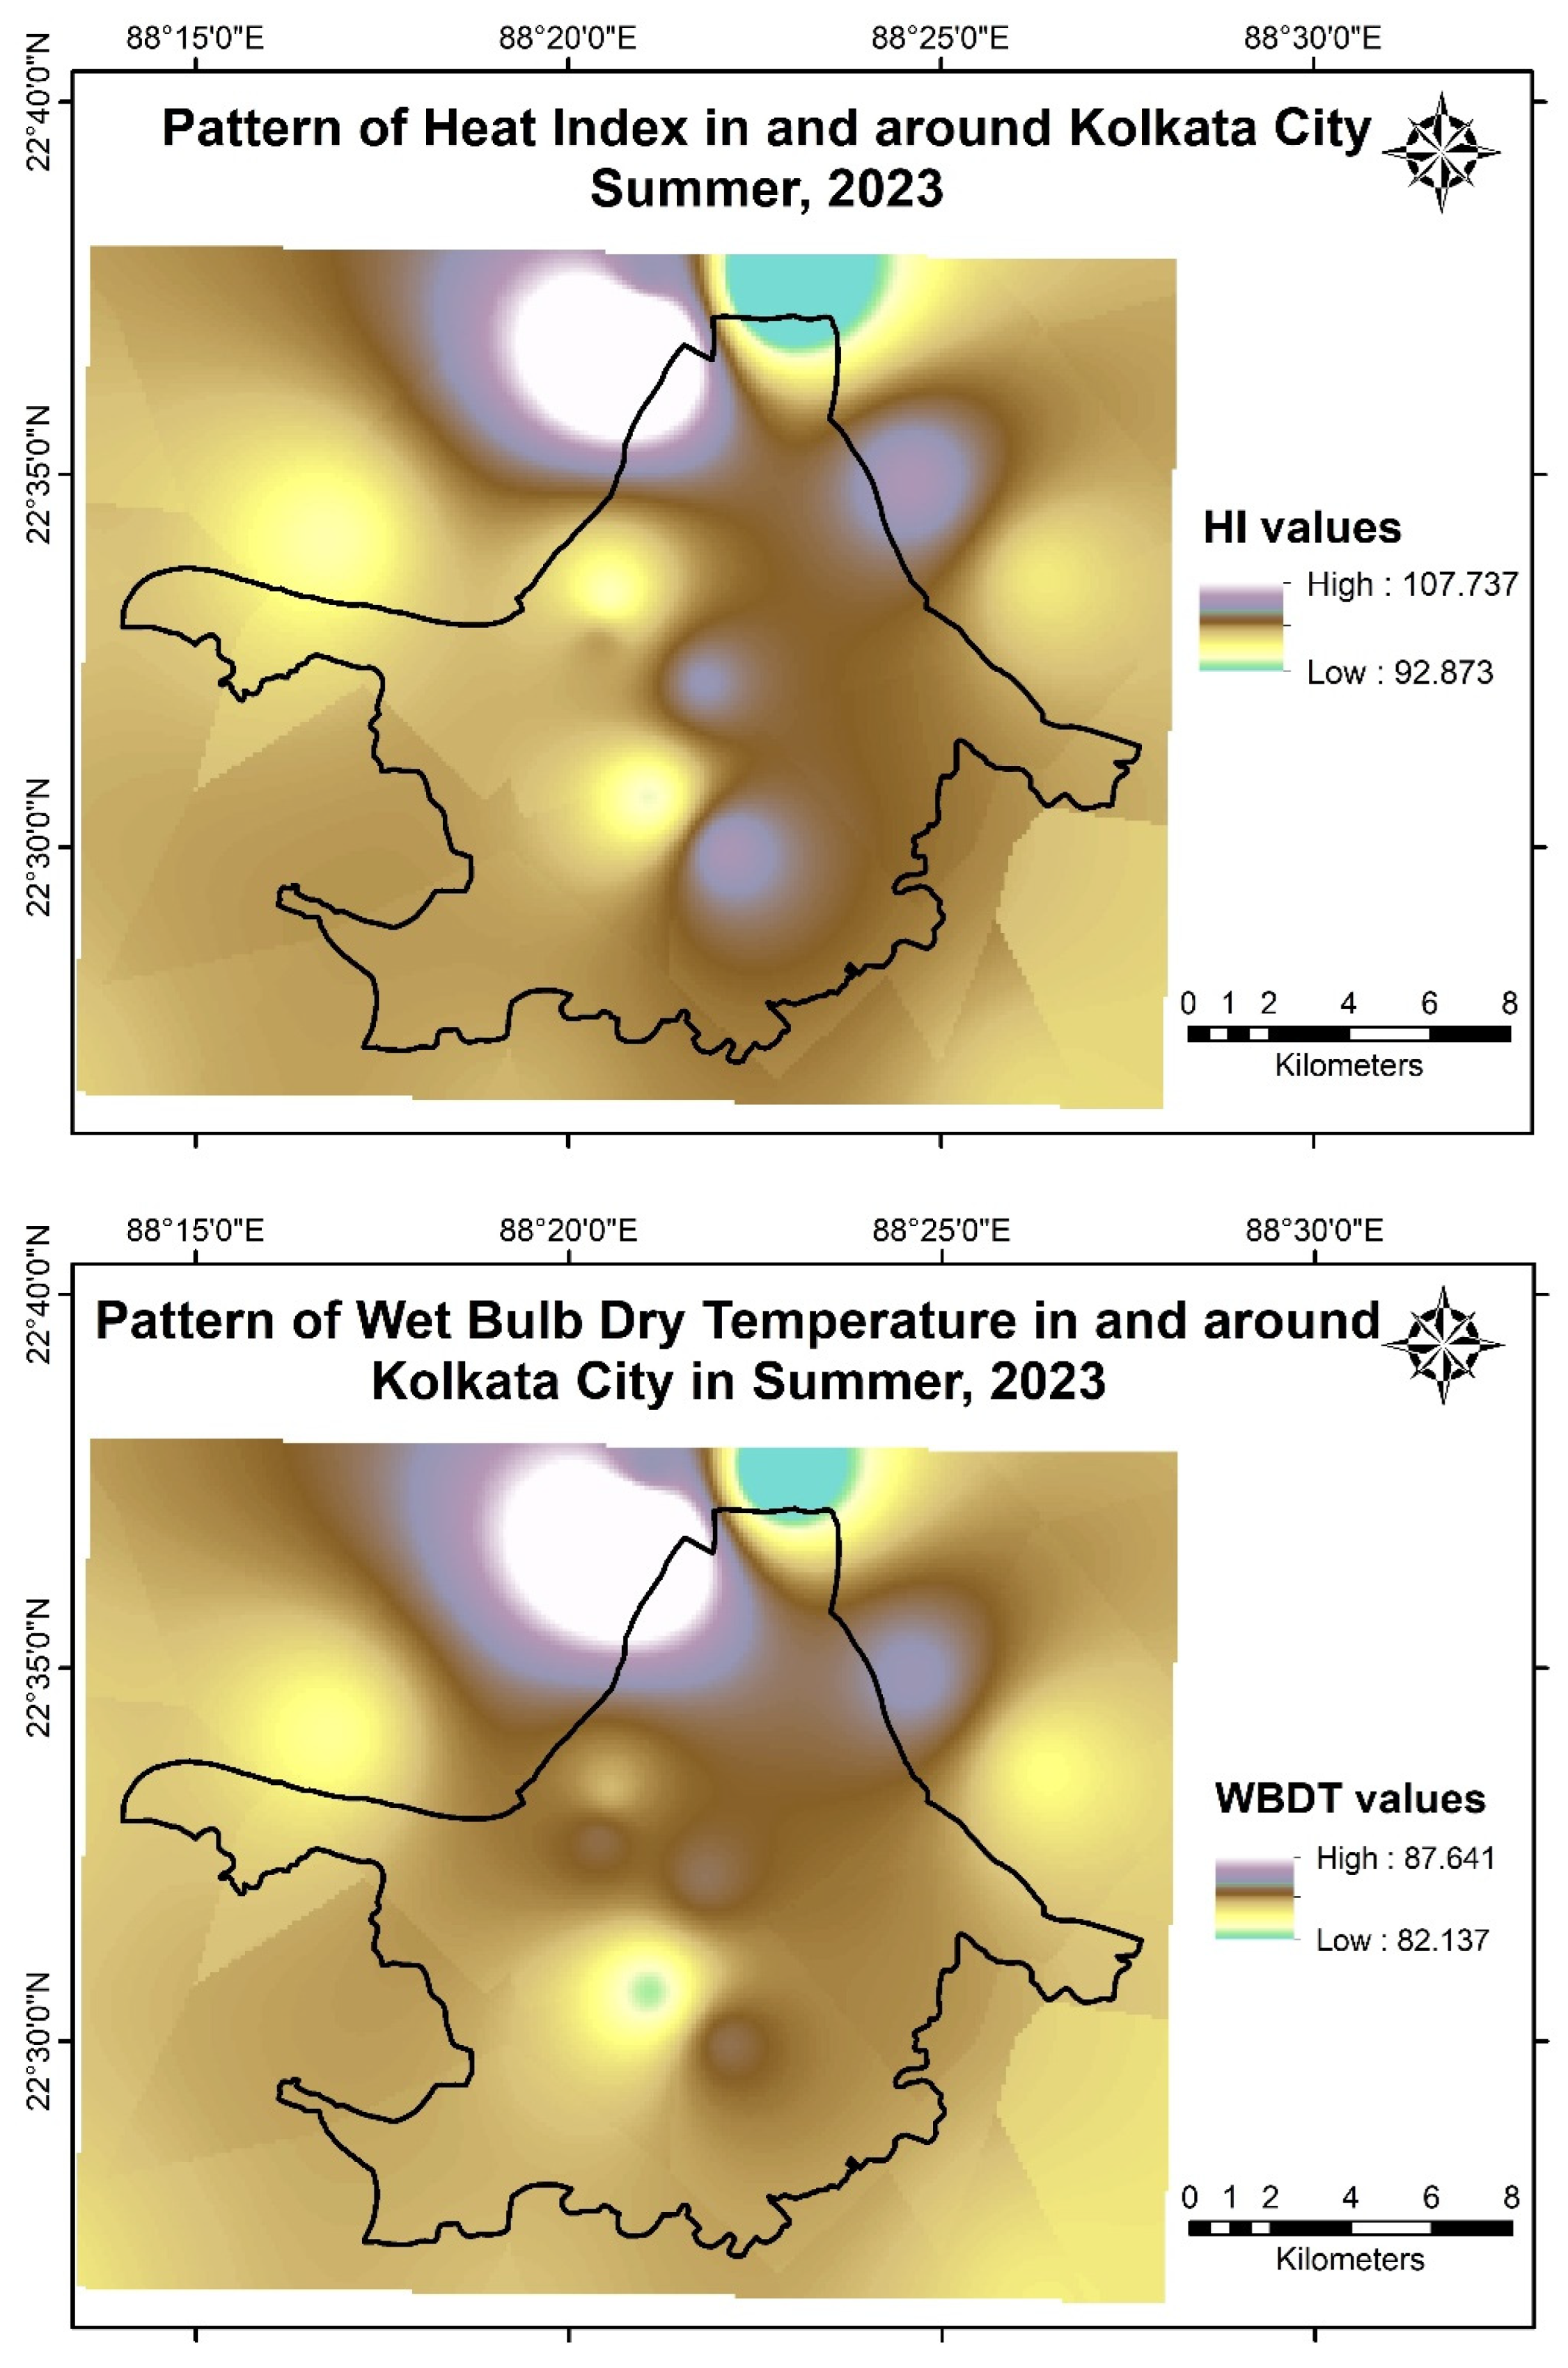
  • The CBD of Kolkata city (northern central part) was the most severely affected by thermal discomfort and stress. Even though this region depicted comparatively lower RH values than city surroundings, the high intensity of the air temperature hotspot (>3 °C) resulted in the development of multiple humid heat stress clusters in the same zone.
  • The results highlighted the significance of RH in heat stress pattern identification, as the inclusion of RH delineated a few additional hotspots within the city during the summer season. For tropical regions, discomfort studies solely based on ambient temperature cannot provide the complete scenario. A direct inclusion of AT and RH produced a more varied pattern with the scope of better zoning.
  • The use of population patterns as an additional layer helped to quantify the vulnerability to different heat stress levels in terms of the number of residents. The results show that nearly 0.69 million people were exposed to a moderate threat from humid heat stress, and around 0.21 million citizens faced strong heat stress in Kolkata during summer.
  • The results show the significance of mid-rise buildings in diminishing comfort only in a highly dense building arrangement. It was notable that building height added to higher density intensified thermal discomfort. Single-handedly, the effects of increasing building height on raising discomfort were not so prominent. In the scenario of a sparse built-up pattern, the contribution of mid-rise buildings in creating humid heat stress hotspots remarkably dropped.
  • Surprisingly, increasing road density did not play an important role in enhancing thermal stress for the current study area. Since heat stress rise was more sensitive to the built-up arrangement, for a dense CBD, more priority should be given to regulating building height and density.
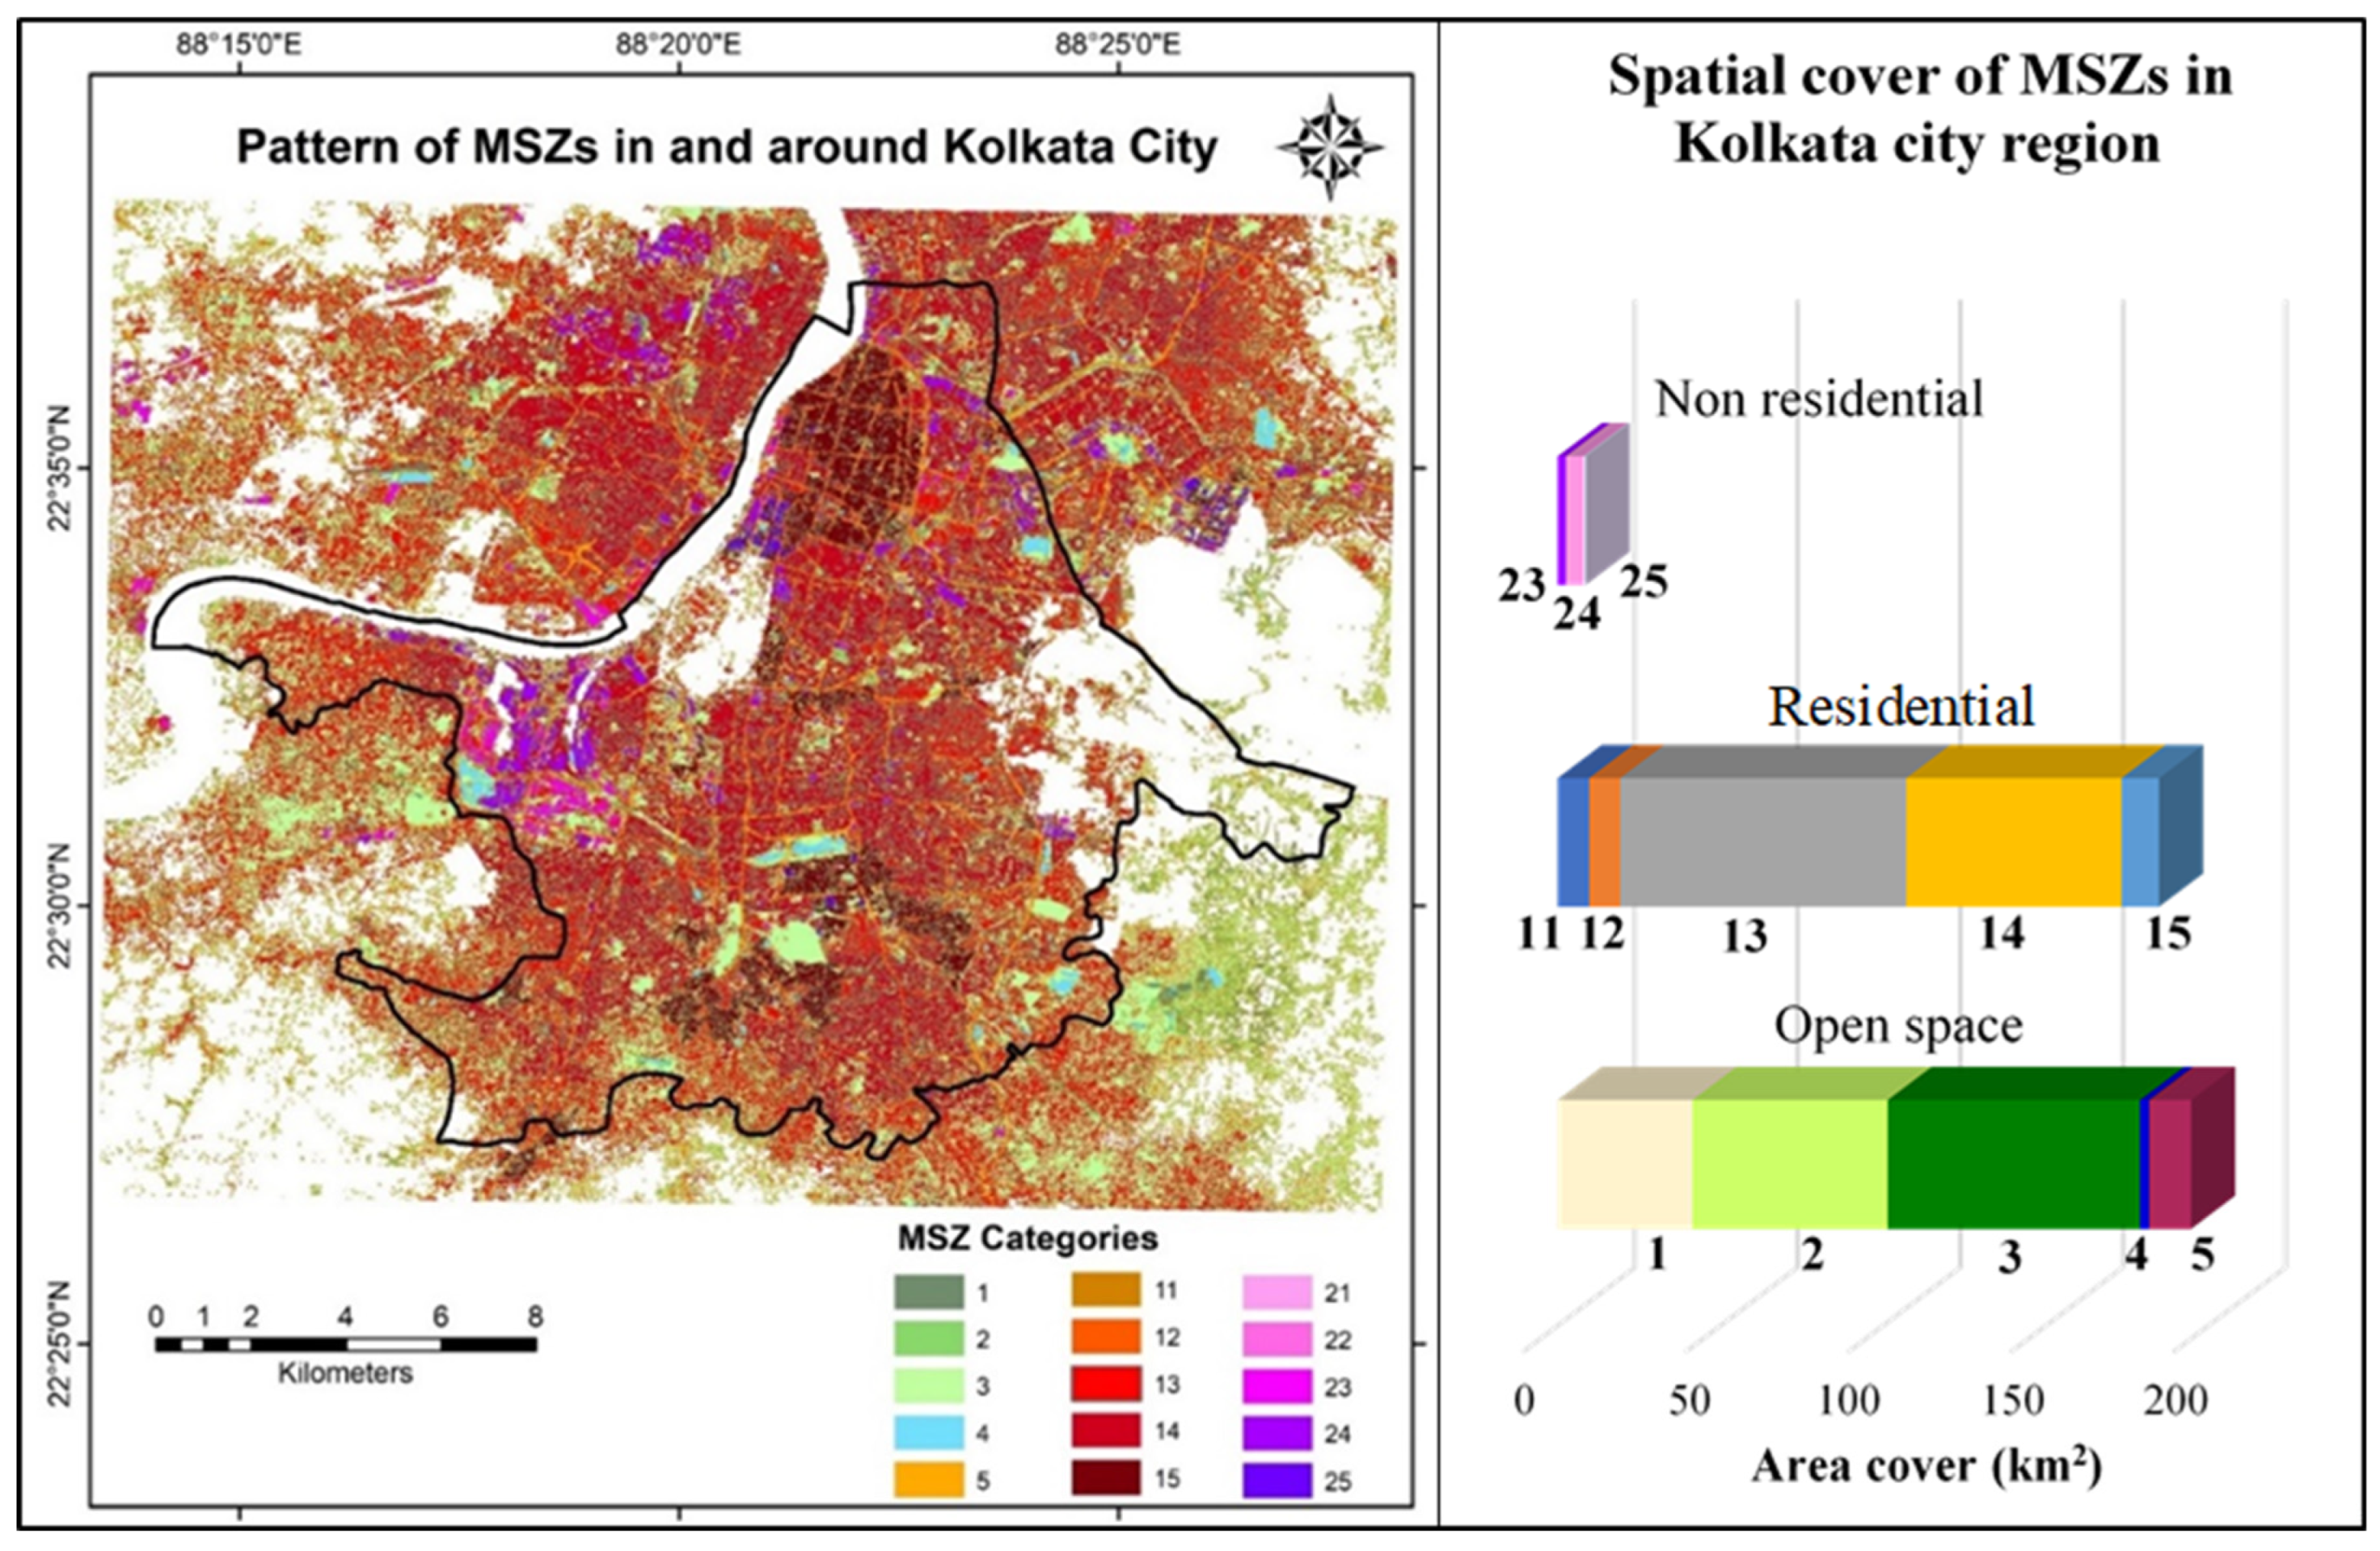
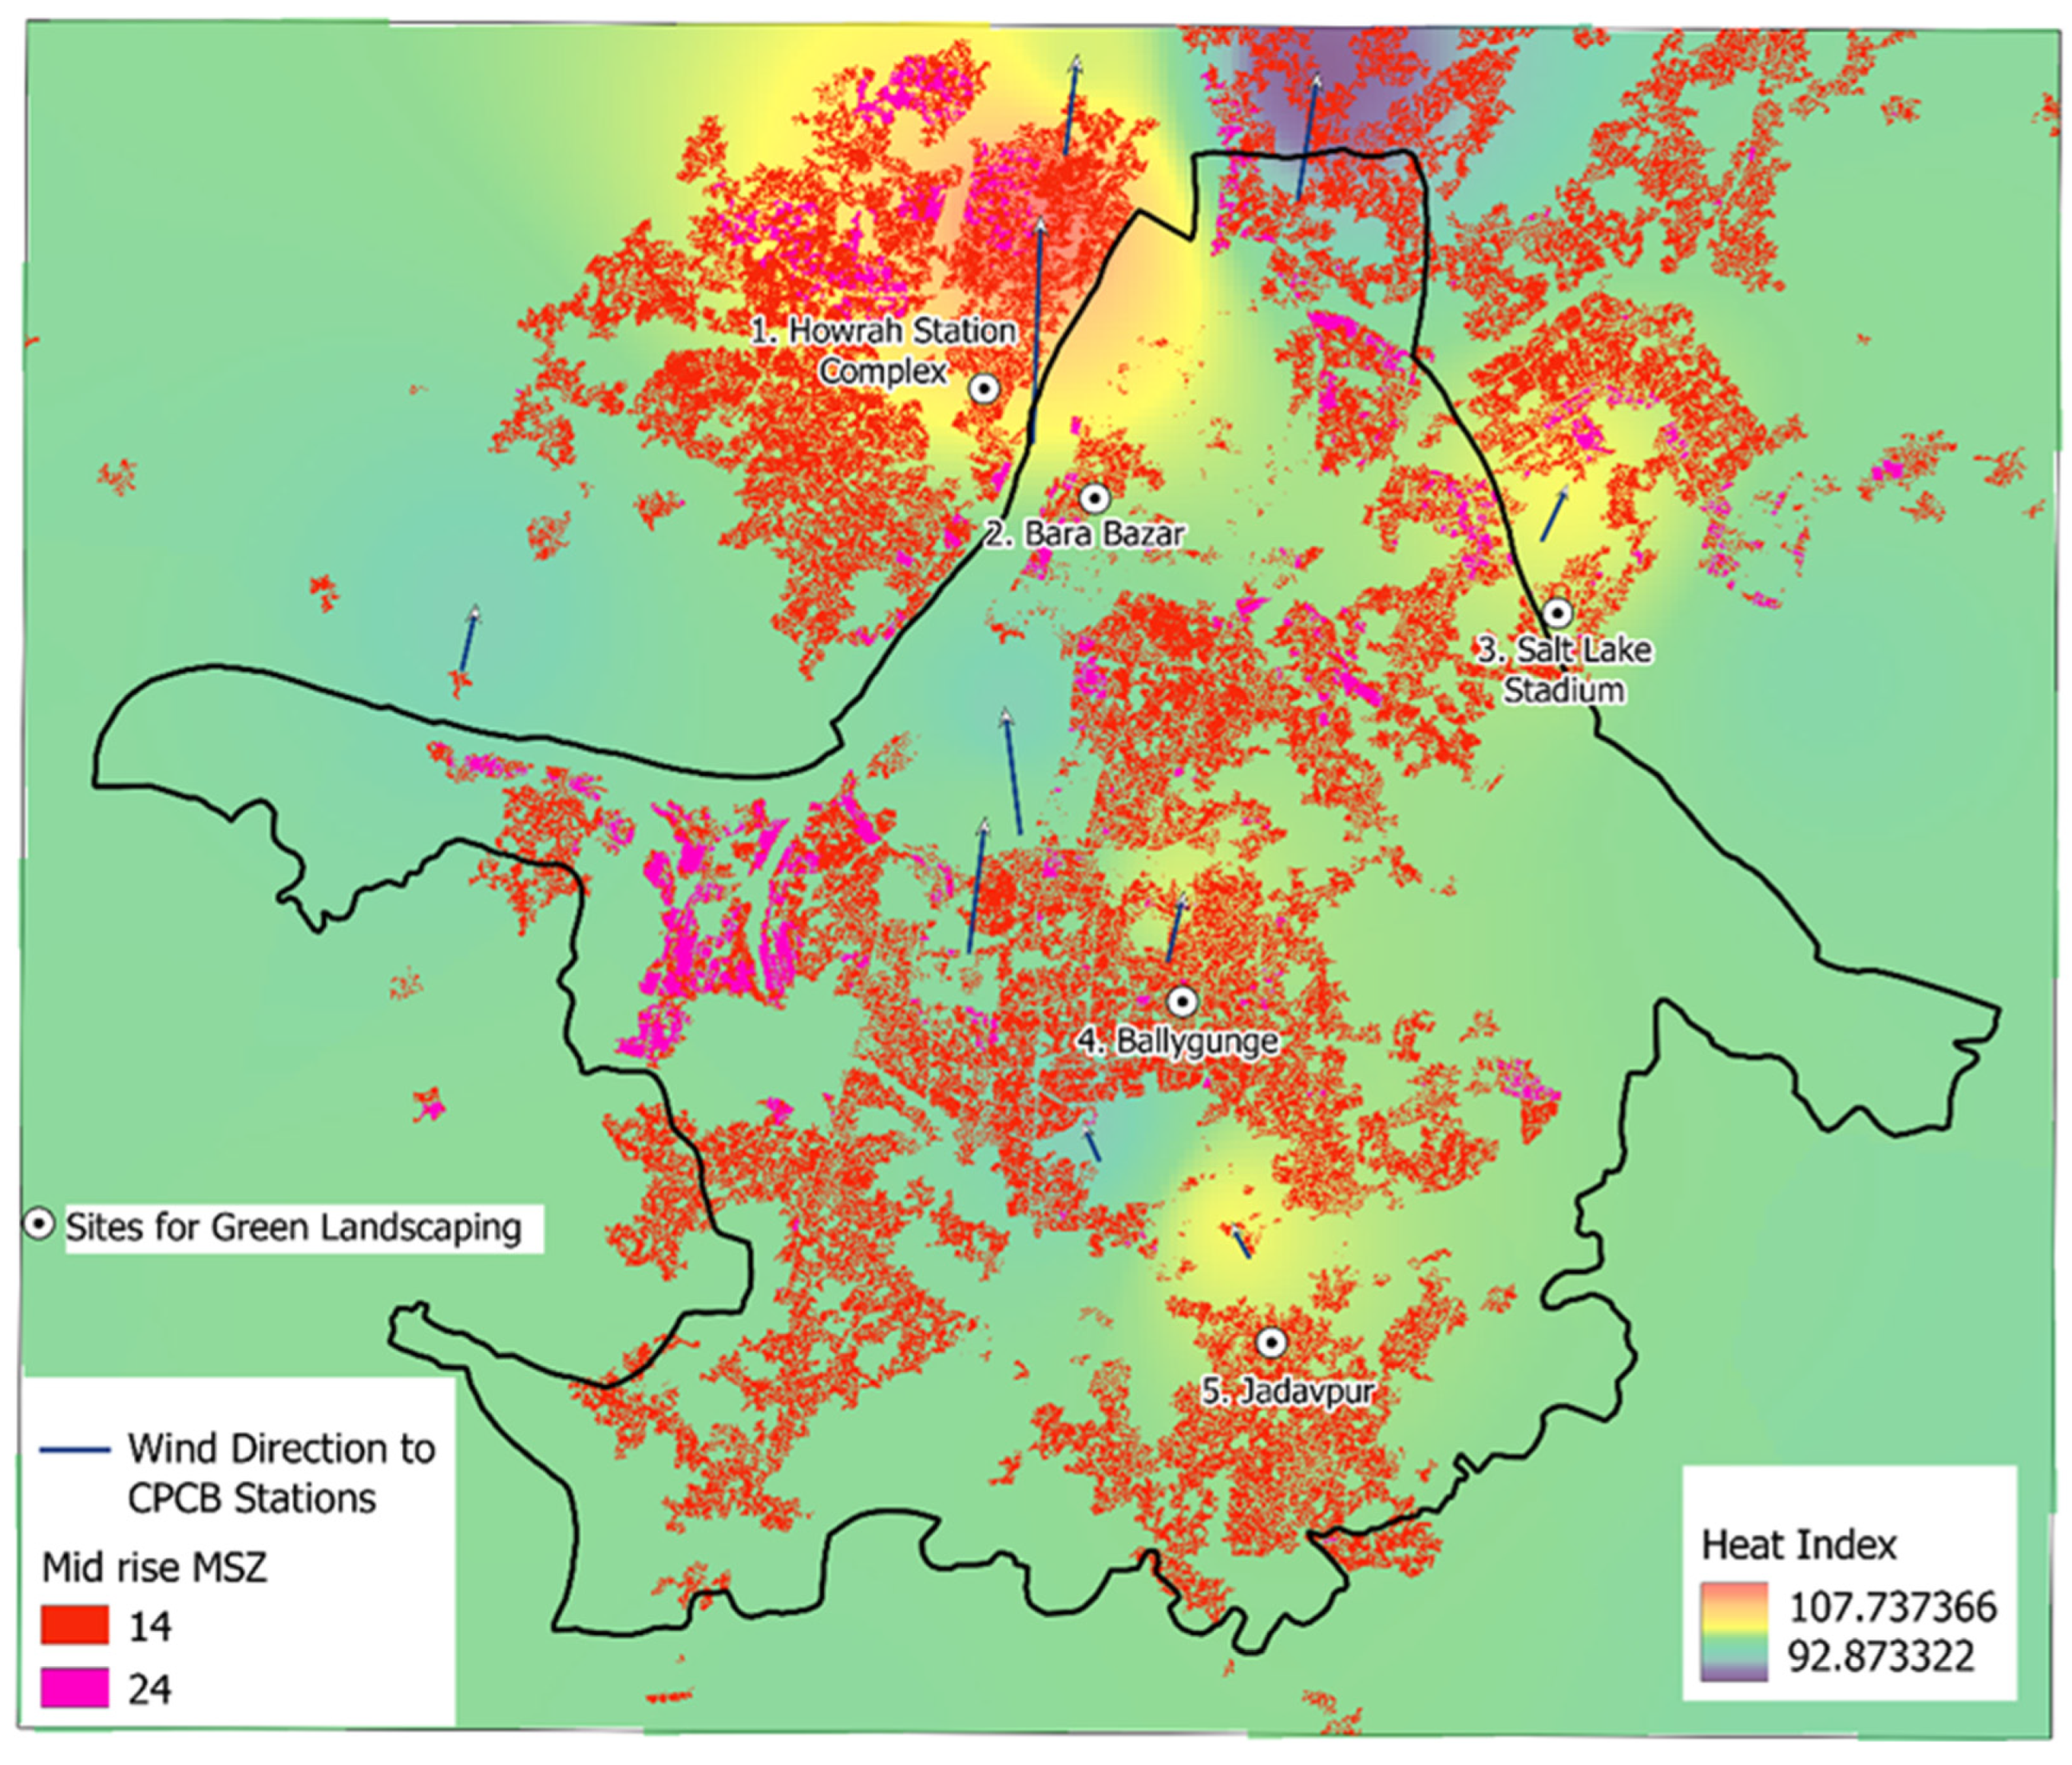
  • MSZ-based results showed the availability of the 980,000 m2 area of MSZ 01 (open space with low vegetation surface) in critical thermal stress regions. Increased vegetation density at these locations can considerably reduce the systolic blood pressure, diastolic blood pressure and pulse rate of the vast population of the city exposed to heat stress in summer [55].
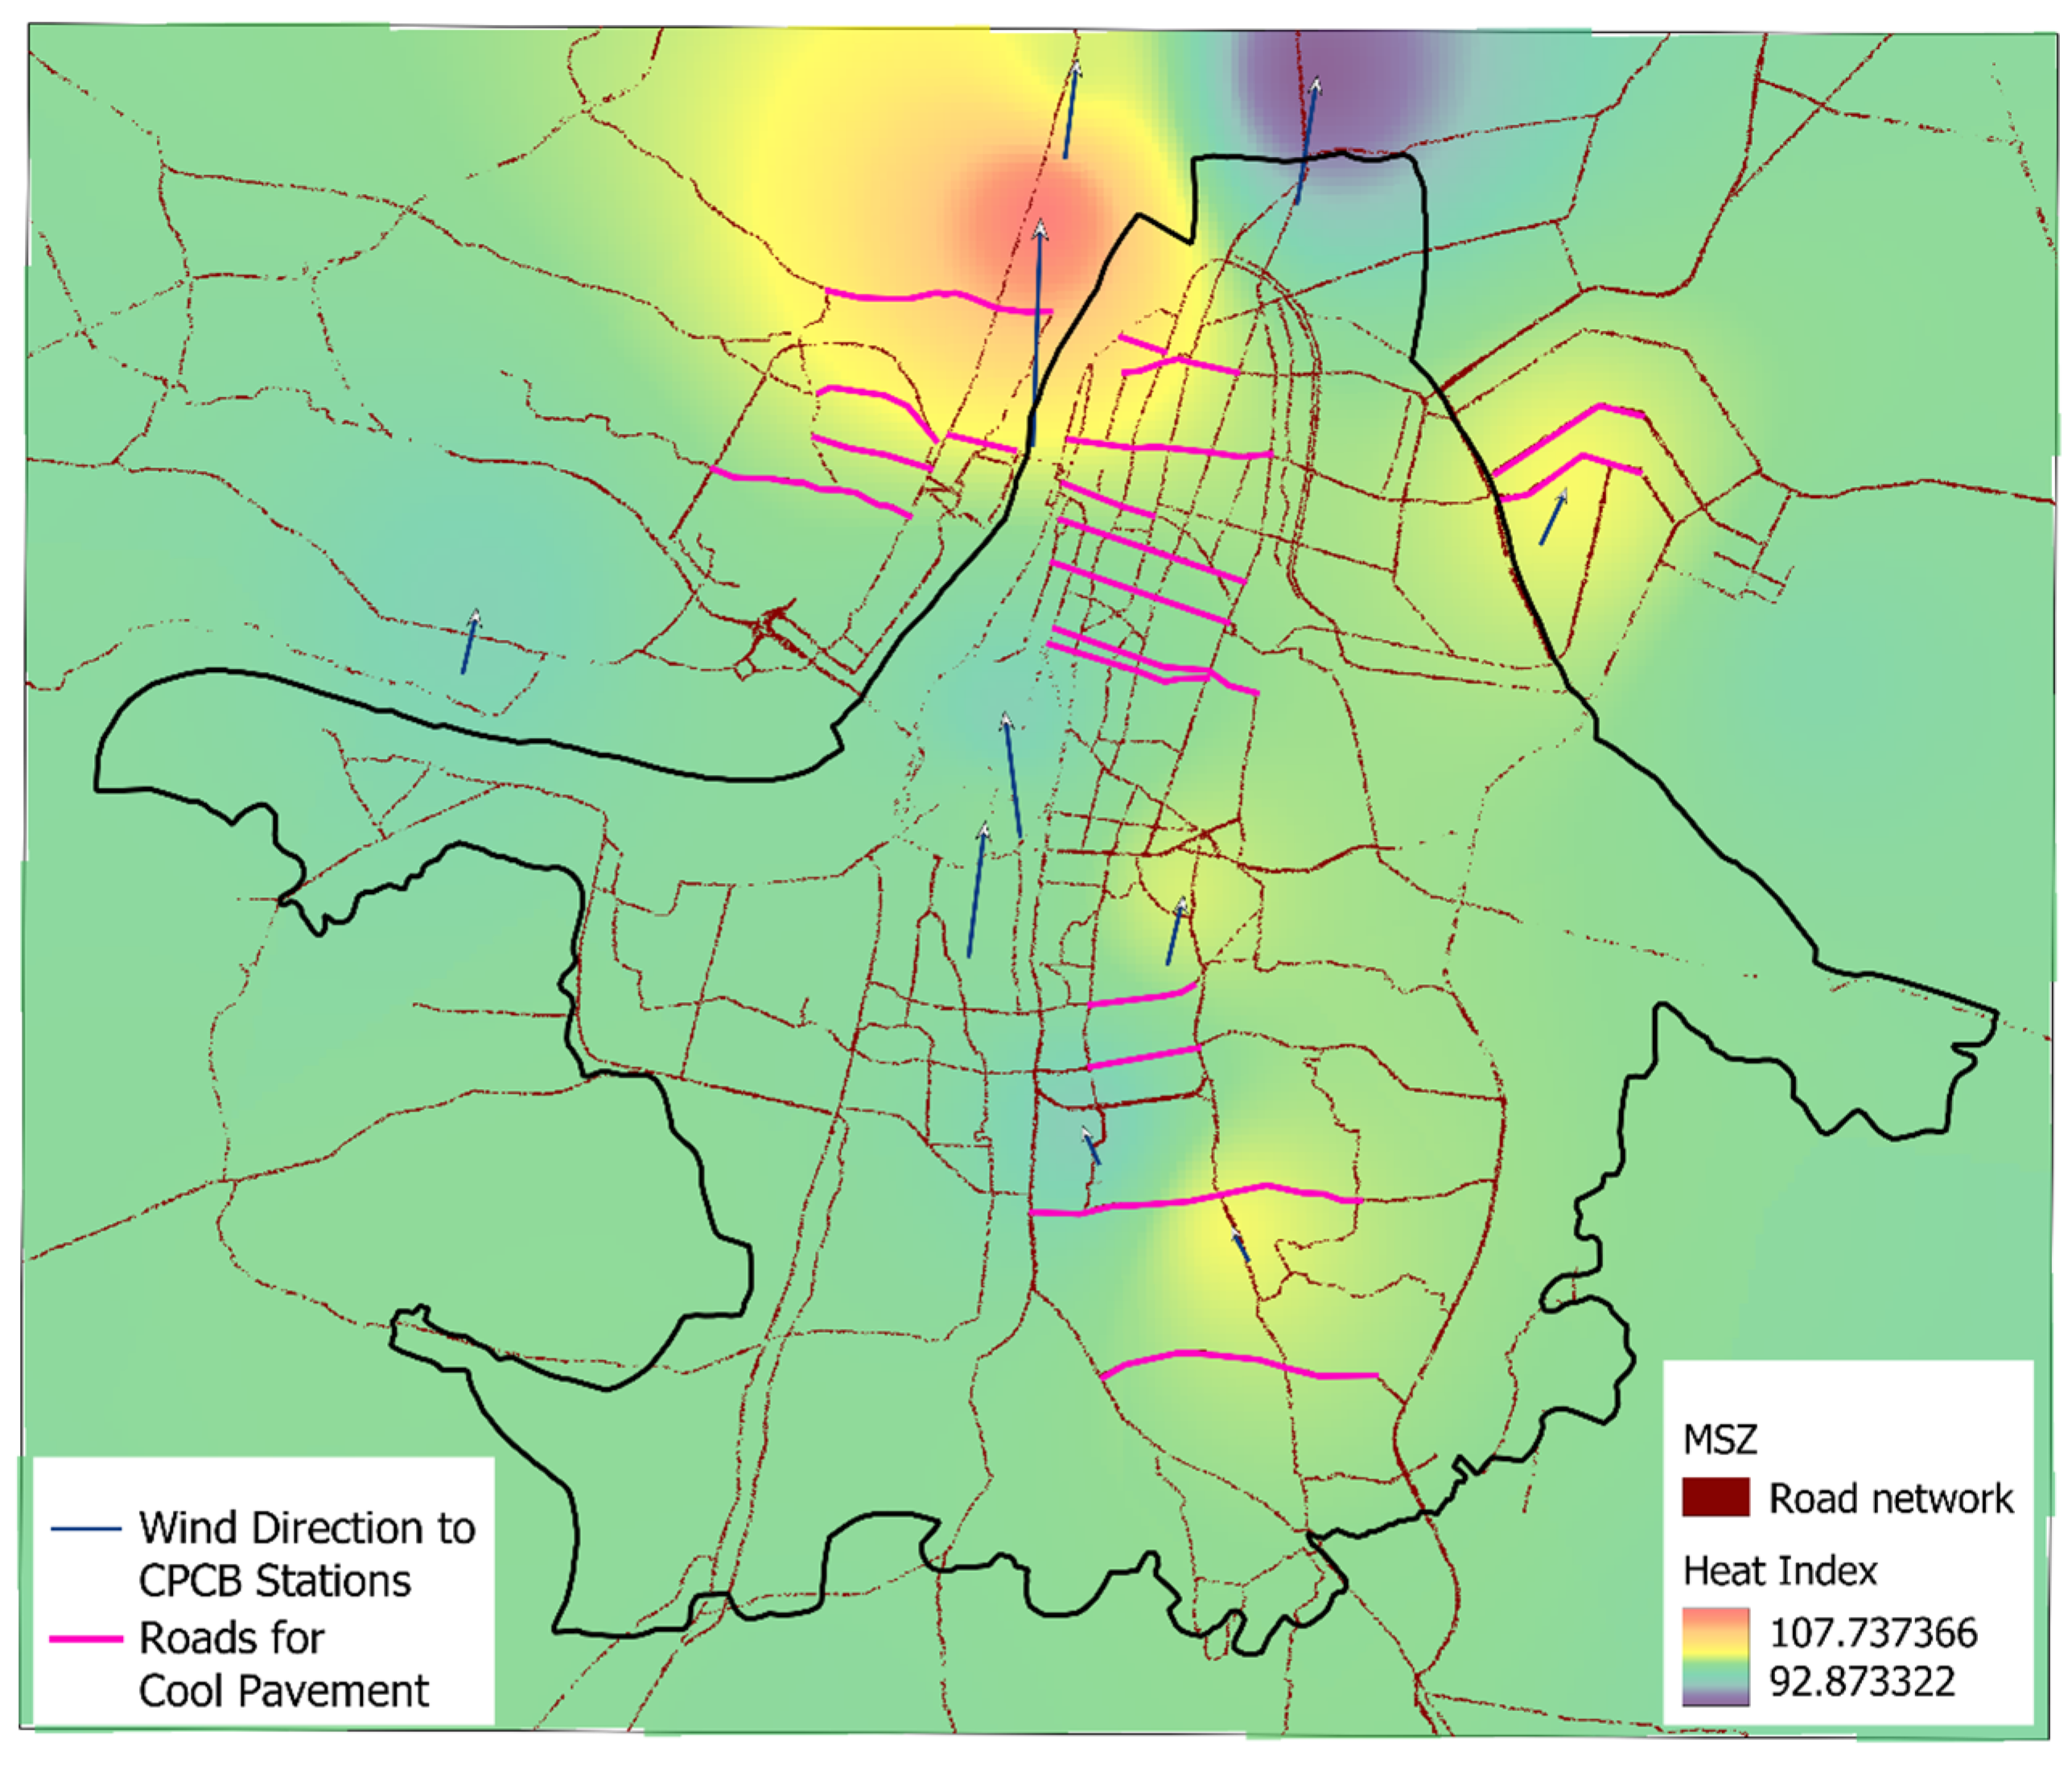
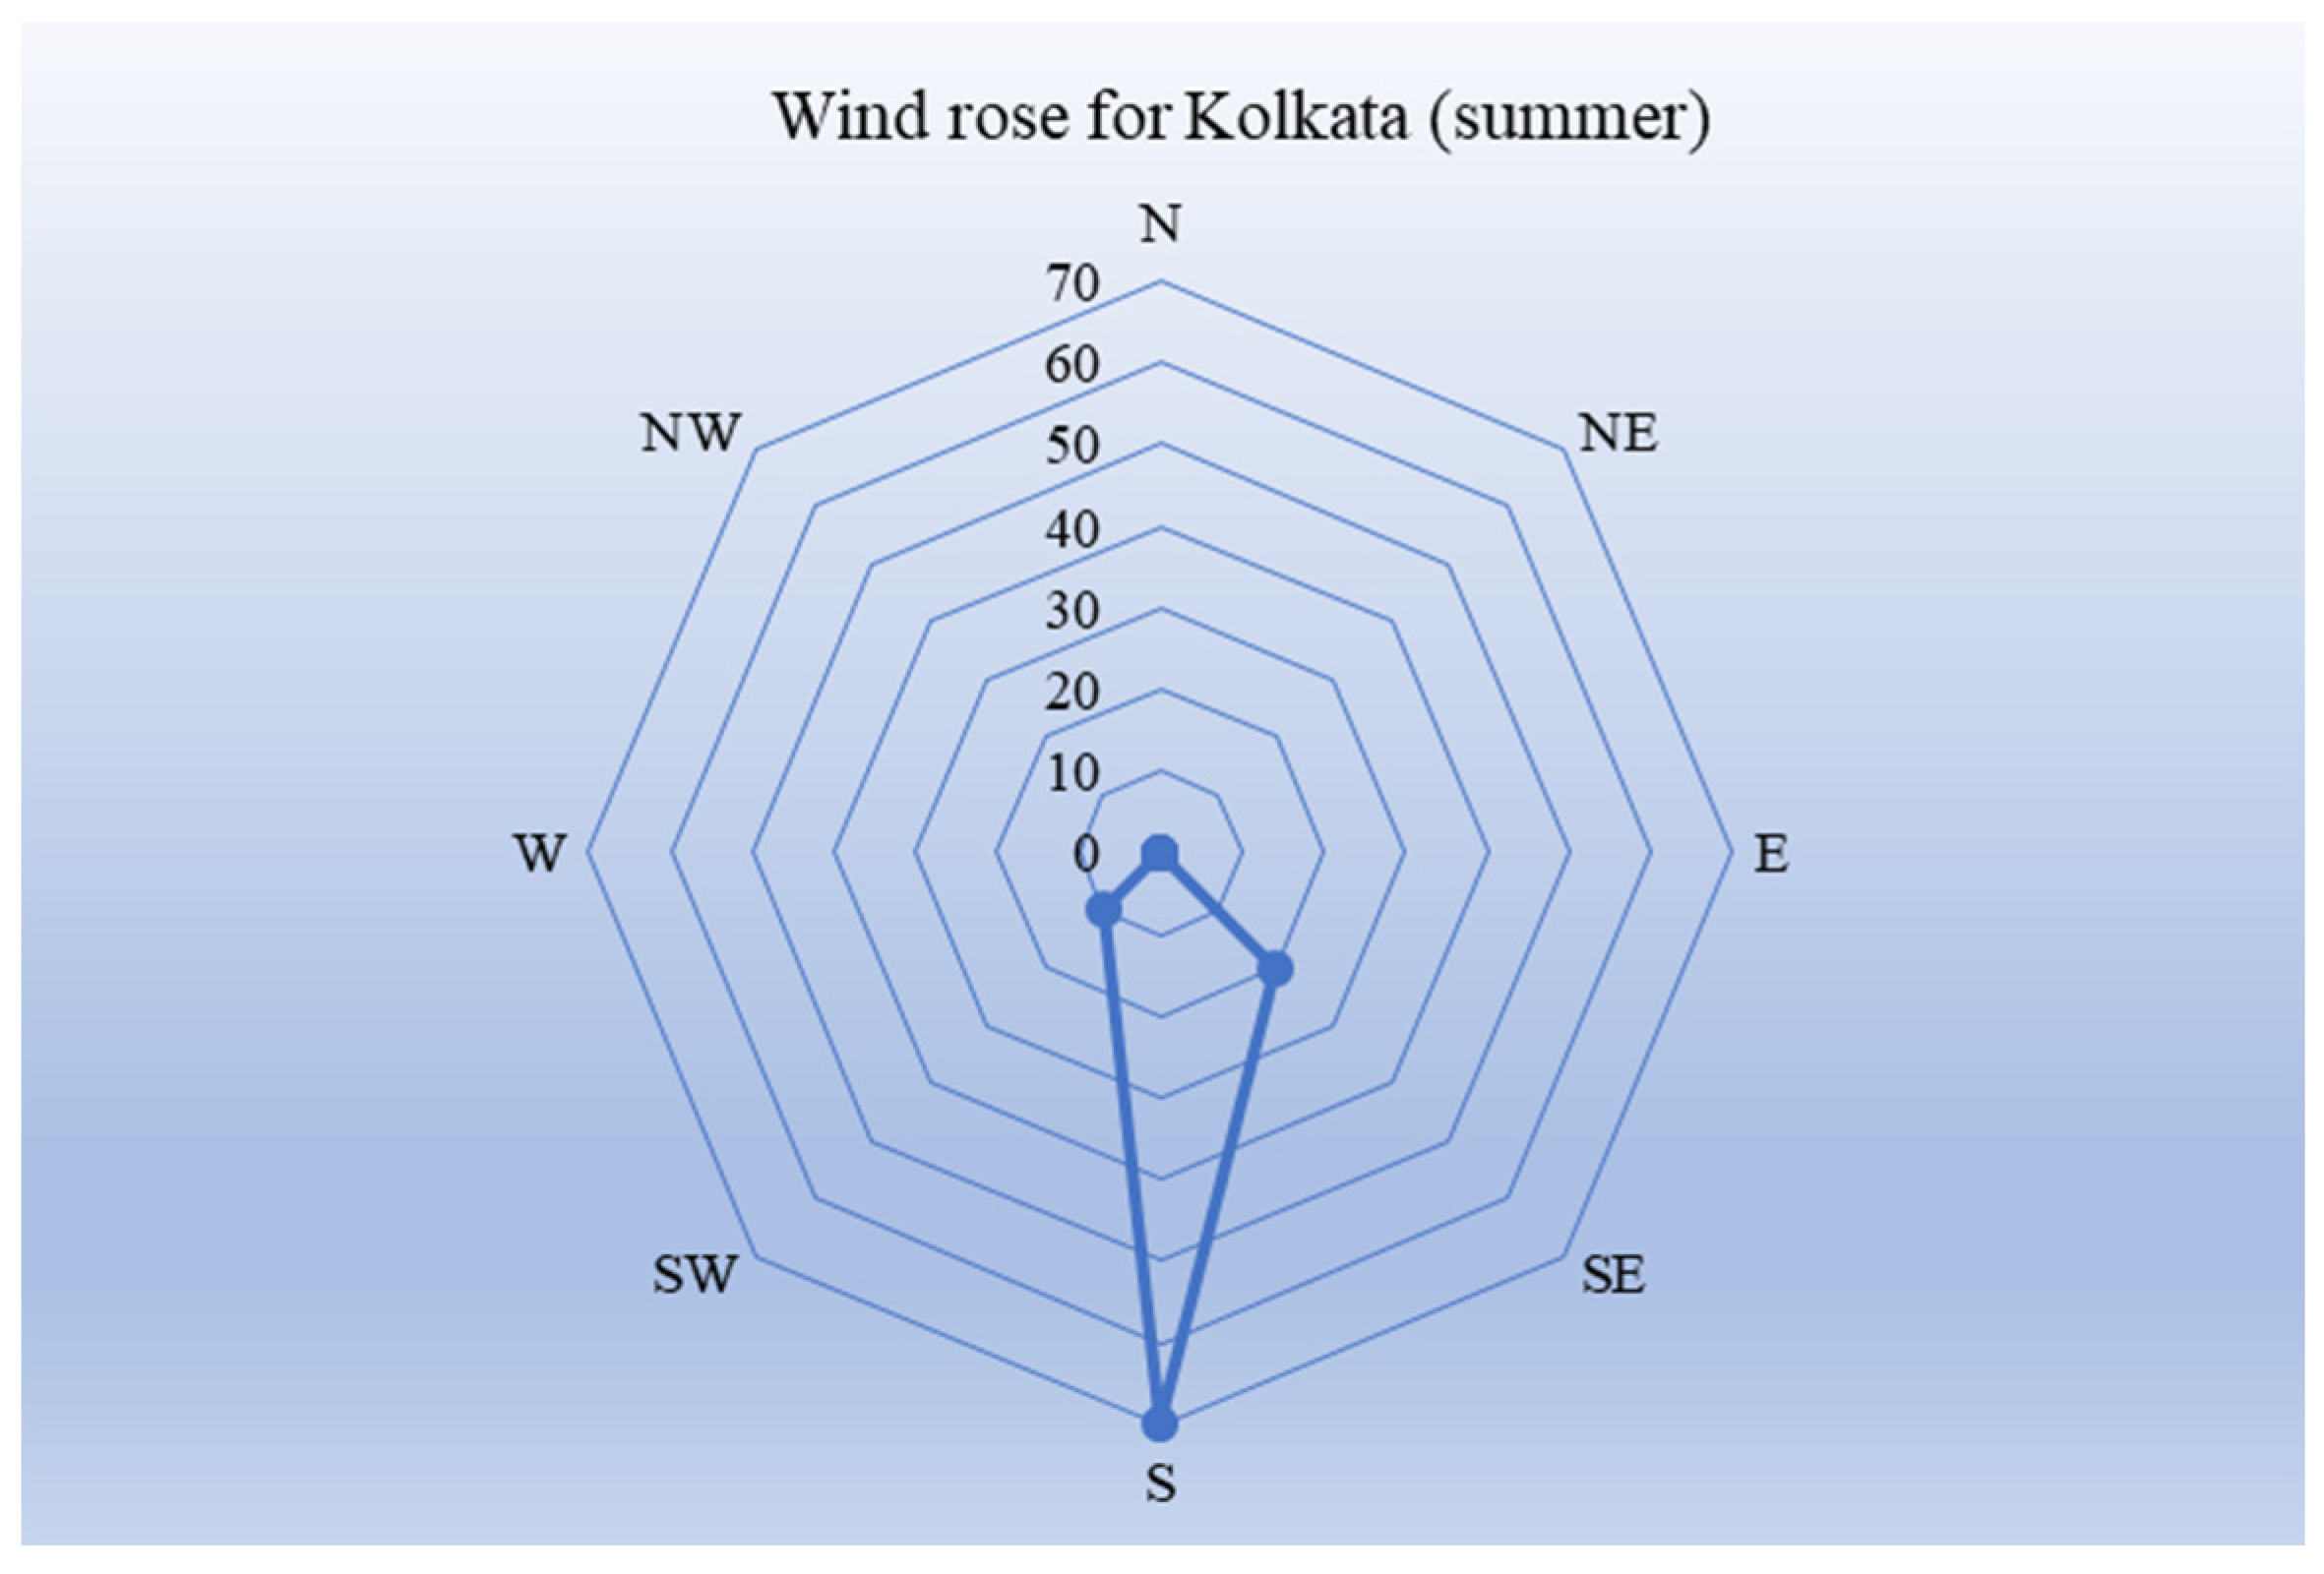
  • East–west-aligned roads of a total 38.44 km length were also marked for water spray cooling and greener pavements. The road length covered less than 10% of the total major road length in the study region. MSZ and wind direction data played a pivotal role in successfully identifying the limited road stretches that can cause higher cooling. Studies have found that maximum cooling can be achieved through 6 mm wetting for 10 min in the morning [56]. The same can be applied in Kolkata to optimize road watering on summer days.

7.2. Limitations

Even though this study highlighted major urban environmental threats for a tropical megacity, in future work, some improvements can be incorporated. For a study carried out in a similar scenario, the in situ data collection of additional climatic parameters will significantly enhance the results. Since high-resolution wind velocity data were not available for the current study region, this particular parameter was excluded for discomfort assessment. A complete summer month survey could be dedicated to collecting such a dataset and, thus, create a finer spatial pattern of the thermal discomfort hotspots.

8. Conclusions

This study considered crucial location-based information for better land management and green landscaping over a tropical megacity. According to the observed results for all discomfort indices, at least 10 million people were prone to severe heat stress in the summer season. The results depicted that the heat index was more suitable to map the slightest variation in the discomfort level for the current study region than other discomfort indices. A quantitative understanding of the influences of building area and height on the thermal environment was reached. The results showed that city areas with more than 68% built-up cover associated with building heights between 5.8 m and 9.3 m created the worst thermal discomfort situations. Such built-up morphology has the potential to cause thermal stress-related mortality. Building surface area cover and height-related regulations must incorporate such empirical observations. Apart from urban policy making and building governance, the city population needs to be aware of the consequences and mitigation techniques for such high thermal stress. Strict mitigation guidelines should be provided to all commercial and residential sectors separately for indoor and outdoor conditions. Specific locations of reducing the hot spots and generating new cold spots were also delineated in this study based on multiple layers, like heat indices, morphological settlement zones, population and land cover characteristics. The results showed the Howrah Railway station complex to be suitable for green landscaping and dense plantations in open places. Policy makers must prioritize the transformation of this vast complex into a cooling land cover. Multiple other residential sectors and road segments were demarcated for city-wide sustainable development while using wind flow pattern data. This would help to carry out prioritized and systematic city planning. This work, hence, successfully broadens the scope of applying geospatial techniques in urban climate problem solving.

Author Contributions

Writing—editing original draft preparation, A.G.; editing, proofreading and supervision, B.D., A.K.S. and G.P. All authors have read and agreed to the published version of the manuscript.

Funding

This research received no external funding.

Data Availability Statement

Data are contained within the article.

Acknowledgments

The authors are also thankful to the anonymous reviewers for their constructive suggestions to improve the quality of the present work.

Conflicts of Interest

The authors declare no conflict of interest.

References

  1. Cohen, B. Urban Growth in Developing Countries: A Review of Current Trends and a Caution Regarding Existing Forecasts. World Dev. 2004, 32, 23–51. [Google Scholar] [CrossRef]
  2. Farrell, K. The Rapid Urban Growth Triad: A New Conceptual Framework for Examining the Urban Transition in Developing Countries. Sustainability 2017, 9, 1407. [Google Scholar] [CrossRef]
  3. Hardoy, J.E.; Satterthwaite, D. “Environmental Problems of Third World Cities: A Global Issue Ignored?”: Public Administration and Development (1991). Cities Glob. South Read. 2014, 361, 155–159. [Google Scholar]
  4. Al Jarah, S.H.; Zhou, B.; Abdullah, R.J.; Lu, Y.; Yu, W. Urbanization and Urban Sprawl Issues in City Structure: A Case of the Sulaymaniah Iraqi Kurdistan Region. Sustainability 2019, 11, 485. [Google Scholar] [CrossRef]
  5. Surya, B.; Ahmad, D.N.A.; Sakti, H.H.; Sahban, H. Land Use Change, Spatial Interaction, and Sustainable Development in the Metropolitan Urban Areas, South Sulawesi Province, Indonesia. Land 2020, 9, 95. [Google Scholar] [CrossRef]
  6. Shahfahad, S.; Talukdar, S.; Rihan, M.; Hang, H.T.; Bhaskaran, S.; Rahman, A. Modelling Urban Heat Island (UHI) and Thermal Field Variation and Their Relationship with Land Use Indices over Delhi and Mumbai Metro Cities. Environ. Dev. Sustain. 2022, 24, 3762–3790. [Google Scholar] [CrossRef]
  7. da Silva Espinoza, N.; dos Santos, C.A.C.; de Oliveira, M.B.L.; Silva, M.T.; Santos, C.A.G.; da Silva, R.M.; Mishra, M.; Ferreira, R.R. Assessment of Urban Heat Islands and Thermal Discomfort in the Amazonia Biome in Brazil: A Case Study of Manaus City. Build. Environ. 2023, 227, 109772. [Google Scholar] [CrossRef]
  8. Dutta, K.; Basu, D.; Agrawal, S. Identification of Critical Urban Clusters for Placating Urban Heat Island Effects over Fast-Growing Tropical City Regions: Estimating the Contribution of Different City Sizes in Escalating UHI Intensity. Photogramm. Eng. Remote Sens. 2023, 89, 667–677. [Google Scholar] [CrossRef]
  9. Yin, Z.; Liu, Z.; Liu, X.; Zheng, W.; Yin, L. Urban Heat Islands and Their Effects on Thermal Comfort in the US: New York and New Jersey. Ecol. Indic. 2023, 154, 110765. [Google Scholar] [CrossRef]
  10. Dutta, K.; Basu, D.; Agrawal, S. Synergetic Interaction between Spatial Land Cover Dynamics and Expanding Urban Heat Islands. Environ. Monit. Assess. 2021, 193, 184. [Google Scholar] [CrossRef]
  11. Seyam, M.M.H.; Haque, M.R.; Rahman, M.M. Identifying the Land Use Land Cover (LULC) Changes Using Remote Sensing and GIS Approach: A Case Study at Bhaluka in Mymensingh, Bangladesh. Case Stud. Chem. Environ. Eng. 2023, 7, 100293. [Google Scholar] [CrossRef]
  12. Xian, G.; Shi, H.; Zhou, Q.; Auch, R.; Gallo, K.; Wu, Z.; Kolian, M. Monitoring and Characterizing Multi-Decadal Variations of Urban Thermal Condition Using Time-Series Thermal Remote Sensing and Dynamic Land Cover Data. Remote Sens. Environ. 2022, 269, 112803. [Google Scholar] [CrossRef]
  13. Yao, L.; Sun, S.; Song, C.; Li, J.; Xu, W.; Xu, Y. Understanding the Spatiotemporal Pattern of the Urban Heat Island Footprint in the Context of Urbanization, a Case Study in Beijing, China. Appl. Geogr. 2021, 133, 102496. [Google Scholar] [CrossRef]
  14. Uddin, A.S.M.S.; Khan, N.; Islam, A.R.M.T.; Kamruzzaman, M.; Shahid, S. Changes in Urbanization and Urban Heat Island Effect in Dhaka City. Theor. Appl. Climatol. 2022, 147, 891–907. [Google Scholar] [CrossRef]
  15. Liu, S.; Wu, A.M.; Ho, H.C. Spatial Variability of Diurnal Temperature Range and Its Associations with Local Climate Zone, Neighborhood Environment and Mortality in Los Angeles. Urban Clim. 2023, 49, 101526. [Google Scholar] [CrossRef]
  16. Nadi, M. Keywords Materials and Method: Discussion. Doctmedico J. 2021, 1, 172–175. [Google Scholar] [CrossRef]
  17. Gupta, A.; De, B. A Systematic Review on Urban Blue-Green Infrastructure in the South Asian Region: Recent Advancements, Applications, and Challenges. Water Sci. Technol. 2024, 89, 382–403. [Google Scholar] [CrossRef]
  18. Ren, Z.; Fu, Y.; Dong, Y.; Zhang, P.; He, X. Rapid Urbanization and Climate Change Significantly Contribute to Worsening Urban Human Thermal Comfort: A National 183-City, 26-Year Study in China. Urban Clim. 2022, 43, 101154. [Google Scholar] [CrossRef]
  19. Kotharkar, R.; Dongarsane, P.; Ghosh, A.; Kotharkar, V. Numerical Analysis of Extreme Heat in Nagpur City Using Heat Stress Indices, All-Cause Mortality and Local Climate Zone Classification. Sustain. Cities Soc. 2024, 101, 105099. [Google Scholar] [CrossRef]
  20. Huang, J.; Shen, S.; Zhao, M.; Cheng, C. Assessment of Summer Regional Outdoor Heat Stress and Regional Comfort in the Beijing-Tianjin-Hebei Agglomeration Over the Last 40 Years. GeoHealth 2023, 7, 725. [Google Scholar] [CrossRef]
  21. Neog, R. Resurfacing Heat Stress Phenomena in Indian Cities during the Post-COVID-19 Lockdown Period. Singap. J. Trop. Geogr. 2024, 45, 85–106. [Google Scholar] [CrossRef]
  22. Zhang, M.; Li, H.; Zhang, L.; Liu, J. Heat Stress, Especially When Coupled with High Light, Accelerates the Decline of Tropical Seagrass (Enhalus Acoroides) Meadows. Mar. Pollut. Bull. 2023, 192, 115043. [Google Scholar] [CrossRef] [PubMed]
  23. d’Ambrosio Alfano, F.R.; Palella, B.I.; Riccio, G. Thermal Environment Assessment Reliability Using Temperature -Humidity Indices. Ind. Health 2011, 49, 95–106. [Google Scholar] [CrossRef]
  24. Brooke Anderson, G.; Bell, M.L.; Peng, R.D. Methods to Calculate the Heat Index as an Exposure Metric in Environmental Health Research. Environ. Health Perspect. 2013, 121, 1111–1119. [Google Scholar] [CrossRef] [PubMed]
  25. Lau, K.K.L.; Chung, S.C.; Ren, C. Outdoor Thermal Comfort in Different Urban Settings of Sub-Tropical High-Density Cities: An Approach of Adopting Local Climate Zone (LCZ) Classification. Build. Environ. 2019, 154, 227–238. [Google Scholar] [CrossRef]
  26. Ren, J.; Yang, J.; Zhang, Y.; Xiao, X.; Xia, J.C.; Li, X.; Wang, S. Exploring Thermal Comfort of Urban Buildings Based on Local Climate Zones. J. Clean. Prod. 2022, 340, 130744. [Google Scholar] [CrossRef]
  27. Yang, J.; Yang, Y.; Sun, D.; Jin, C.; Xiao, X. Influence of Urban Morphological Characteristics on Thermal Environment. Sustain. Cities Soc. 2021, 72, 103045. [Google Scholar] [CrossRef]
  28. De, B.; Mukherjee, M. Optimisation of Canyon Orientation and Aspect Ratio in Warm-Humid Climate: Case of Rajarhat Newtown, India. Urban Clim. 2018, 24, 887–920. [Google Scholar] [CrossRef]
  29. Mochida, A.; Lun, I.Y.F. Prediction of Wind Environment and Thermal Comfort at Pedestrian Level in Urban Area. J. Wind. Eng. Ind. Aerodyn. 2008, 96, 1498–1527. [Google Scholar] [CrossRef]
  30. Wang, T.-W.; Yin, W.; Fu, L.-L.; Zhang, Z.-Y. Estimation Model for Natural Ventilation by Wind Force Considering Wind Direction and Building Orientation for Low-Rise Building in China. Indoor Built Environ. 2022, 31, 2036–2052. [Google Scholar] [CrossRef]
  31. Sharmin, T.; Steemers, K.; Matzarakis, A. Microclimatic Modelling in Assessing the Impact of Urban Geometry on Urban Thermal Environment. Sustain. Cities Soc. 2017, 34, 293–308. [Google Scholar] [CrossRef]
  32. Boeing, G. Spatial Information and the Legibility of Urban Form: Big Data in Urban Morphology. Int. J. Inf. Manag. 2021, 56, 102013. [Google Scholar] [CrossRef]
  33. Bonczak, B.; Kontokosta, C.E. Large-Scale Parameterization of 3D Building Morphology in Complex Urban Landscapes Using Aerial LiDAR and City Administrative Data. Comput. Environ. Urban Syst. 2019, 73, 126–142. [Google Scholar] [CrossRef]
  34. Dutta, K.; Basu, D.; Agrawal, S. Evaluation of Seasonal Variability in Magnitude of Urban Heat Islands Using Local Climate Zone Classification and Surface Albedo. Int. J. Environ. Sci. Technol. 2022, 19, 8677–8698. [Google Scholar] [CrossRef]
  35. Kumar, P.; Rai, A.; Upadhyaya, A.; Chakraborty, A. Analysis of Heat Stress and Heat Wave in the Four Metropolitan Cities of India in Recent Period. Sci. Total Environ. 2022, 818, 151788. [Google Scholar] [CrossRef] [PubMed]
  36. Beljaars, A.; Balsamo, G.; Betts, A.; Viterbo, P. Atmosphere/Surface Interactions in the ECMWF Model at High Latitudes. In Proceedings of the ECMWF Seminar on Polar Meteorology, Reading, UK, 4–8 September 2006; pp. 153–168. [Google Scholar]
  37. Schiavina, M.; Freire, S.; Alessandra, C.; MacManus, K. GHS-POP R2023A-GHS Population Grid Multitemporal (1975–2030). Available online: https://ghsl.jrc.ec.europa.eu/datasets.php (accessed on 9 September 2023).
  38. Pesaresi, M.; Politis, P. GHS-BUILT-H R2022A-GHS Building Height, Derived from AW3D30, SRTM30, and Sentinel2 Composite (2018); European Commission, Joint Research Centre (JRC): Brussels, Belgium, 2018. [Google Scholar]
  39. Pesaresi, M.; Politis, P. GHS-BUILT-S R2023A-GHS Built-up Surface Grid, Derived from Sentinel2 Composite and Landsat, Multitemporal (1975–2030); European Commission, Joint Research Centre (JRC): Brussels, Belgium, 2023. [Google Scholar]
  40. Pesaresi, M.; Politis, P. GHS-BUILT-C R2023A-GHS Settlement Characteristics, Derived from Sentinel2 Composite (2018) and Other GHS R2023A Data; European Commission, Joint Research Centre (JRC): Brussels, Belgium, 2023. [Google Scholar]
  41. Zhang, H.; Arens, E.; Zhai, Y. A Review of the Corrective Power of Personal Comfort Systems in Non-Neutral Ambient Environments. Build. Environ. 2015, 91, 15–41. [Google Scholar] [CrossRef]
  42. Achilleos, G.A. The Inverse Distance Weighted Interpolation Method and Error Propagation Mechanism-Creating a DEM from an Analogue Topographical Map. J. Spat. Sci. 2011, 56, 283–304. [Google Scholar] [CrossRef]
  43. Vecellio, D.J.; Tony Wolf, S.; Cottle, R.M.; Larry Kenney, W. Evaluating the 35C Wet-Bulb Temperature Adaptability Threshold for Young, Healthy Subjects (PSU HEAT Project). J. Appl. Physiol. 2022, 132, 340–345. [Google Scholar] [CrossRef] [PubMed]
  44. Rothfusz, L.P. The Heat Index “Equation” (or, More Than You Ever Wanted to Know About Heat Index); Tech. Attachment, SR/SSD 90-23; Southern Region Headquarters: Forth Worth, TX, USA, 1990. [Google Scholar]
  45. Fiala, D.; Havenith, G.; Bröde, P.; Kampmann, B.; Jendritzky, G. UTCI-Fiala Multi-Node Model of Human Heat Transfer and Temperature Regulation. Int. J. Biometeorol. 2012, 56, 429–441. [Google Scholar] [CrossRef]
  46. McGregor, G.R. Special Issue: Universal Thermal Comfort Index (UTCI). Int. J. Biometeorol. 2012, 56, 419. [Google Scholar] [CrossRef]
  47. Wallace, R.F.; Kriebel, D.; Punnett, L.; Wegman, D.H.; Wenger, C.B.; Gardner, J.W.; Gonzalez, R.R. The Effects of Continuous Hot Weather Training on Risk of Exertional Heat Illness. Med. Sci. Sports Exerc. 2005, 37, 84–90. [Google Scholar] [CrossRef] [PubMed]
  48. Yan, J.; Yin, C.; An, Z.; Mu, B.; Wen, Q.; Li, Y.; Zhang, Y.; Chen, W.; Wang, L.; Song, Y. The Influence of Urban Form on Land Surface Temperature: A Comprehensive Investigation from 2D Urban Land Use and 3D Buildings. Land 2023, 12, 1802. [Google Scholar] [CrossRef]
  49. Sharifi, E.; Boland, J. Heat Resilience in Public Space and Its Applications in Healthy and Low Carbon Cities. Procedia Eng. 2017, 180, 944–954. [Google Scholar] [CrossRef]
  50. MacLeod, T.A.; Hahs, A.K.; Penman, T.D. Balancing Fire Risk and Human Thermal Comfort in Fire-Prone Urban Landscapes. PLoS ONE 2019, 14, e0225981. [Google Scholar] [CrossRef] [PubMed]
  51. Chatzidimitriou, A.; Yannas, S. Microclimate Design for Open Spaces: Ranking Urban Design Effects on Pedestrian Thermal Comfort in Summer. Sustain. Cities Soc. 2016, 26, 27–47. [Google Scholar] [CrossRef]
  52. Daniel, M.; Lemonsu, A.; Viguié, V. Role of Watering Practices in Large-Scale Urban Planning Strategies to Face the Heat-Wave Risk in Future Climate. Urban Clim. 2018, 23, 287–308. [Google Scholar] [CrossRef]
  53. Takahashi, R.; Asakura, A.; Koike, K.; Himeno, S.; Fujita, S. Using Snow Melting Pipes to Verify the Water Sprinkling’s Effect over a Wide Area. In Proceedings of the NOVATECH 2010 Conference, Lyon, France, 27 June–1 July 2010. [Google Scholar]
  54. Jin, C.; Bai, X.; Luo, T.; Zou, M. Effects of Green Roofs’ Variations on the Regional Thermal Environment Using Measurements and Simulations in Chongqing, China. Urban For. Urban Green. 2018, 29, 223–237. [Google Scholar] [CrossRef]
  55. Ren, Z.; Zhao, H.; Fu, Y.; Xiao, L.; Dong, Y. Effects of Urban Street Trees on Human Thermal Comfort and Physiological Indices: A Case Study in Changchun City, China. J. For. Res. 2022, 33, 911–922. [Google Scholar] [CrossRef]
  56. Kubilay, A.; Ferrari, A.; Derome, D.; Carmeliet, J. Smart Wetting of Permeable Pavements as an Evaporative-Cooling Measure for Improving the Urban Climate during Heat Waves. J. Build. Phys. 2021, 45, 36–66. [Google Scholar] [CrossRef]
Figure 1. Study area extent and major locations.
Sustainability 16 03395 g001
Figure 2. Point-based weather data source locations.
Sustainability 16 03395 g002
Figure 3. Flowchart of the methodology.
Sustainability 16 03395 g003
Figure 4. Contribution assessment of urban morphology in creating heat index zones.
Sustainability 16 03395 g004
Figure 5. Land management strategies with climate and morphology overlay.
Sustainability 16 03395 g005
Figure 6. Pattern of major ambient environment parameters.
Sustainability 16 03395 g006
Figure 7. Spatial profile of thermal stress indicators.
Sustainability 16 03395 g007
Figure 8. HI zone-wise contribution of urban built-up area in increasing discomfort.
Sustainability 16 03395 g008
Figure 9. Overall urban land use pattern of Kolkata.
Sustainability 16 03395 g009
Figure 10. Locations and detailed view of selected open spaces for dense plantation.
Sustainability 16 03395 g010
Figure 11. Primary trend of wind flow in Kolkata.
Sustainability 16 03395 g011
Figure 12. Scope of road-based cooling on summer days.
Sustainability 16 03395 g012
Figure 13. Scope of cooling through green landscaping sites.
Sustainability 16 03395 g013
Table 1. UTCI classes and associated AT ranges.
Sl. No.Class CharacteristicsAT Values (°C)
1No thermal stress9–26
2Moderate heat stress26–32
3Strong heat stress32–38
4Very strong heat stress38–46
5Extreme heat stress>46
Table 2. Detailed description of the MSZs in Kolkata.
Type MSZ NameMajor CharacteristicDetailed Characteristics
Open spacesMSZ 01Low vegetation surfacesNDVI ≤ 0.3
MSZ 02Medium vegetation surfaces0.3 < NDVI ≤ 0.5
MSZ 03High vegetation surfacesNDVI > 0.5
MSZ 04Water surfacesLand < 0.5
MSZ 05Road surfaces
Built spacesMSZ 11Residential Building height ≤ 3 m
MSZ 12Residential3 m < building height ≤ 6 m
MSZ 13Residential6 m < building height ≤ 15 m
MSZ 14Residential15 m < building height ≤ 30 m
MSZ 15ResidentialBuilding height > 30 m
MSZ 21Non-residentialBuilding height ≤ 3 m
MSZ 22Non-residential3 m < building height ≤ 6 m
MSZ 23Non-residential6 m < building height ≤ 15 m
MSZ 24Non-residential15 m < building height ≤ 30 m
MSZ 25Non-residentialBuilding height > 30 m
Table 3. Spatial coverage of thermal discomfort zones.
IndexThermal Discomfort ZonesPercent Area CoverResident Numbers in the Zone
HIHot99.0112,087,885
Very hot0.99146,389
UTCIModerate heat stress98.5812,027,521
Strong heat stress1.42206,753
WBDTElevated threat93.6311,538,627
Moderate threat6.37695,647
Disclaimer/Publisher’s Note: The statements, opinions and data contained in all publications are solely those of the individual author(s) and contributor(s) and not of MDPI and/or the editor(s). MDPI and/or the editor(s) disclaim responsibility for any injury to people or property resulting from any ideas, methods, instructions or products referred to in the content.

