Article

Nonlinear Impact of Corporate Financialization on Sustainable Development Ability: Evidence from Listed Companies in China

1
Guangzhou Institute of International Finance, Guangzhou University, Guangzhou 510405, China
2
School of Economics and Statistics, Guangzhou University, Guangzhou 510006, China
*
Author to whom correspondence should be addressed.
Sustainability 2024, 16(8), 3402; https://doi.org/10.3390/su16083402
Submission received: 3 March 2024 / Revised: 9 April 2024 / Accepted: 15 April 2024 / Published: 18 April 2024

Abstract

:
This paper takes 1179 non-financial listed companies in China from 2010 to 2021 as samples and constructs a panel fixed-effect model to examine the effect of corporate financialization on sustainable development ability. Also, we further use the moderating effect model and the mediating effect model to explore the moderating roles played by financing constraints and environmental uncertainty, as well as the influencing mechanisms transmitted by financialization motives. The results are as follows: (1) There is a significant and robust inverted U-shaped relationship between corporate financialization and sustainable development ability, which indicates the existence of a moderate range of corporate financialization in regard to the sustainable development ability of companies. (2) Financing constraints and environmental uncertainty have moderating effects on the inverted U-shaped relationship between corporate financialization and sustainable development ability. With high financing constraints (environmental uncertainty), the sustainable development ability of companies reacts more sensitively to thep change in corporate financialization level. (3) Companies hold financial assets with precautionary saving motive in the low financialization level, and the reservoir effect plays a dominant role. The sustainable development ability of companies is enhanced. However, companies increase their holdings of financial assets for speculative arbitrage motive in the high financialization level, where the short-term wealth effect becomes dominant. The results of this paper are helpful for companies’ decision-making in sustainable development and for government policy formulation in economic development.

1. Introduction

In recent years, China’s economy has shifted from a high-speed growth phase to a high-quality development stage. As the cornerstone and pillar of China’s economic development, companies not only influence the stability of the economic market but also play an indispensable role in realizing the high-quality development of China’s economy and society, as well as in constructing a new development pattern. Hence, under the backdrop of achieving high-quality development, promoting the sustainable development of companies is particularly important. Nevertheless, influenced by economic transformation and upgrading as well as increasing downward pressure on the economy, traditional brick-and-mortar industries are generally confronted with difficulties such as saturated market demand, intensified industry competition, and declining business performance. This situation put forward an unprecedented challenge for corporate sustainable development. In order to achieve corporate sustainable development, it is necessary to legitimately coordinate resources and promote R&D innovation to improve corporate production efficiency and ensure the long-term survival and sustained profitability of corporations [1]. However, the financial and real estate industries have been developing rapidly. Their profit levels are much higher than those of the traditional real economy industries. More and more companies in real industries decide to invest part of their operating funds into the financial sector in pursuit of high returns, showing a significant trend of corporate financialization [2]. As a means of managing their own asset structures, financialization directly affects the investment efficiency and resource allocation of companies [3,4], which is closely related to corporate sustainable development ability. As a result, it is of great significance to explore the relationship between corporate financialization and sustainable development ability.
Existing research has extensively explored the concept, motivations, and economic consequences of corporate financialization. In particular, regarding the economic consequences, studies have focused on the impact of corporate financialization on innovation in research and development, investment efficiency, production efficiency, operational risk, real investment, and corporate performance. In the realm of research and development innovation, corporate financialization exhibits heterogeneity, with varying motivations and impacts on firm innovation. Yu et al. [5] argue that transaction-oriented financialization can significantly enhance firm innovation, whereas there exists a negative correlation between investment-oriented financialization and firm innovation. Xie et al. [6] found that the deviation of optimal financialization has a negative correlation with persistent innovation in companies. Specifically, excessive financialization could hinder persistent innovation, while moderate financialization may foster persistent innovation. Liu et al. [7] confirmed the inverted-U relationship between corporate financialization and R&D investment, indicating that moderate financialization can promote corporate innovation, while excessive financialization significantly inhibits it. In terms of investment efficiency, Lin et al. [8] and Gong et al. [3] have reached consistent findings, suggesting that corporate financialization suppresses the inefficient investment behavior of enterprises. Wang et al. [9] demonstrated the inverted U-shaped relationship between corporate financialization and TFP. Lyu et al. [10] also indicated that corporate financialization has a significant negative influence on TFP. Additionally, corporate financialization significantly inhibits TFP by crowding out R&D investment, while also significantly promoting TFP by alleviating financing restrictions. In terms of real investments, due to the advantages of higher returns, shorter return cycles, and greater liquidity of financial assets, companies allocate more funds to financial assets rather than real investments. The research findings of Tori et al. [11], Jin et al. [4], and Leng et al. [12] have indeed confirmed that corporate financialization has adverse effects on real investment, particularly fixed asset investment. Meanwhile, Xu et al. [13] found that the influence of corporate financialization on corporate performance varies depending on the type of financial assets held. Furthermore, Deng et al. [14] revealed a positive correlation between corporate financialization and operational risk, particularly pronounced among firms facing higher financing constraints. Nevertheless, there is scarce literature directly examining the relationship between corporate financialization and corporate sustainable development ability. The research on corporate sustainable development is more often reflected from the perspectives of corporate innovation and production efficiency. Therefore, this paper explores the possible logical relationship between corporate financialization and sustainable development ability from the existing research. On one hand, holding financial assets enables companies to effectively exert the “reservoir effect”, preventing future funding shortages to a certain extent, alleviating financing constraints [15], and aiding in the continued survival and development of companies. On the other hand, the “short-term wealth effect” of financial assets will induce corporate financialization [16], reducing the capital supply for real business and weakening the willingness and ability for research and innovation [17,18], thereby limiting the sustainable development of companies [19]. But in fact, the “reservoir effect” and “short-term wealth effect” of financial assets are not two entirely unrelated domains. The research on innovation and production efficiency takes into account the above views, arguing that corporate financialization has different effects on enterprise innovation and total factor productivity within different ranges [7,9]. If this line of thinking is applied to the level of corporate sustainable development, there may also be a nonlinear relationship between enterprise financialization and sustainable development ability. That is to say, financial assets not only possess the “reservoir effect” that can cope with liquidity shocks, but also have the “short-term wealth effect” that can improve corporate short-term financial performance. Double effects will have great impacts on corporate businesses and operations. Thus, corporate financialization may be driven either by precautionary saving motives to cope with liquidity shocks or by speculative arbitrage motives to enhance short-term financial performance. This implies that the impact of corporate financialization on sustainable development ability is uncertain. And the motives that play a dominant role in different stages of corporate financialization are also unclear. Therefore, there is an urgent need to address the relationship between corporate financialization and sustainable development ability.
In view of this, based on the data of Chinese non-financial listed companies from 2010 to 2021, this paper examines the nonlinear impact of corporate financialization on sustainable development ability and discusses its internal logic and mechanisms. In the research method, this paper introduces the firm financialization and its square term into the panel fixed-effect model and analyzes their nonlinear relationship with sustainable development ability. Subsequently, drawing on the analysis method of Hanns et al. [20], we incorporate environmental uncertainty and financing constraints as moderating variables into the research model. And we investigate the impact of environmental uncertainty (financing constraints) on the shape, inflection point, and overall level of the nonlinear curve, ensuring the integrity of the moderating effect. Furthermore, we study the transmission mechanism of corporate financialization through the mediating effect of a nonlinear relationship. This research method reveals the complex relationship between corporate financialization and sustainable development ability to a certain extent and provides a more in-depth and comprehensive analysis for the research.
The contribution of this paper lies in the following aspects: First, our evidence enriches the research on the economic consequences of corporate financialization. There is less literature on the impact of corporate financialization on sustainable development ability. This paper focuses on the impact of corporate financialization on corporate sustainable development ability and finds that there is an inverted U-shaped relationship between them, which further expands the nonlinear relationship between corporate financialization and sustainable development ability. Second, this article incorporates financing constraints and environmental uncertainty into the study, examining their moderating effects on corporate financialization and sustainable development ability. The results clarify the differences in the impact of corporate financialization with different moderating factors. This provides inspiration for the government to formulate relevant policies and measures to guide the sustainable development of companies. Third, our study clarifies the mechanism by which corporate financialization affects sustainable development ability. From the perspective of the precautionary saving motive and speculative arbitrage motive, this paper deeply explores the transmission paths of the reservoir effect and short-term wealth effect of financial assets on sustainable development ability and analyzes the source of the nonlinear relationship between corporate financialization and sustainable development ability.
The remainder of the paper is organized as follows: Section 2 provides a theoretical analysis and hypothesis proposal. Section 3 presents the study design, describing the variables and methodology. Section 4 presents empirical results and a detailed discussion. Section 5 demonstrates the moderating effects of environmental uncertainty and financing constraints. Section 6 is a further analysis of transmission mechanisms and financial asset maturities. Section 7 presents conclusions and recommendations.

2. Theoretical Analysis and Hypothesis Proposal

2.1. Corporate Sustainable Development

Diverse scholars hold varying understandings of the concept of corporate sustainable development, which can be primarily divided into two levels. One focuses on the development of the company itself, while the other connects the sustainable development of the company with the external environment. The concept of corporate sustainable development was first proposed by Robert C. Higgins, who measured the level of corporate sustainable development by establishing a sustainable growth rate [21]. Schmidheiney [22] posits that corporate sustainable development entails companies paying attention to their social responsibility and environmental protection while making daily business decisions. Dyllick [23] defines corporate sustainable development as the ability of a company to meet its own developmental interests without compromising the future interests of relevant stakeholders. Gao et al. (2020) [24] argue that the three pillars of sustainable development are the coordinated development of the economy, society, and environment.
Moreover, there is a wealth of research on the factors influencing corporate sustainable development. Regarding this issue, scholars’ research conclusions also vary. Rehman et al. [25] argue that value creation is a crucial factor in corporate sustainable development, and they discuss the technological applications of big data in enhancing value creation within enterprises. Anbarasan et al. [26] believe that the sustainable growth strategy of the company can be achieved by effectively safeguarding the interests of the company’s stakeholders. Boscoianu et al. [27] argue that innovation is the foundation of sustainable development for most companies. Wu et al. [28] found that by bolstering innovation capabilities and shouldering social responsibilities, companies can notably enhance their sustainable development. Li et al. [29] pointed out that increasing executive salaries would raise agency costs and diminish the potential for sustainable development within companies.
Nevertheless, despite extensive discussions on corporate sustainable development, the financial investment behavior is often disregarded. By incorporating financialization factors into discussions on sustainable development, we can better comprehend how investment decisions influence the survival and development of businesses. This is worth further exploration.

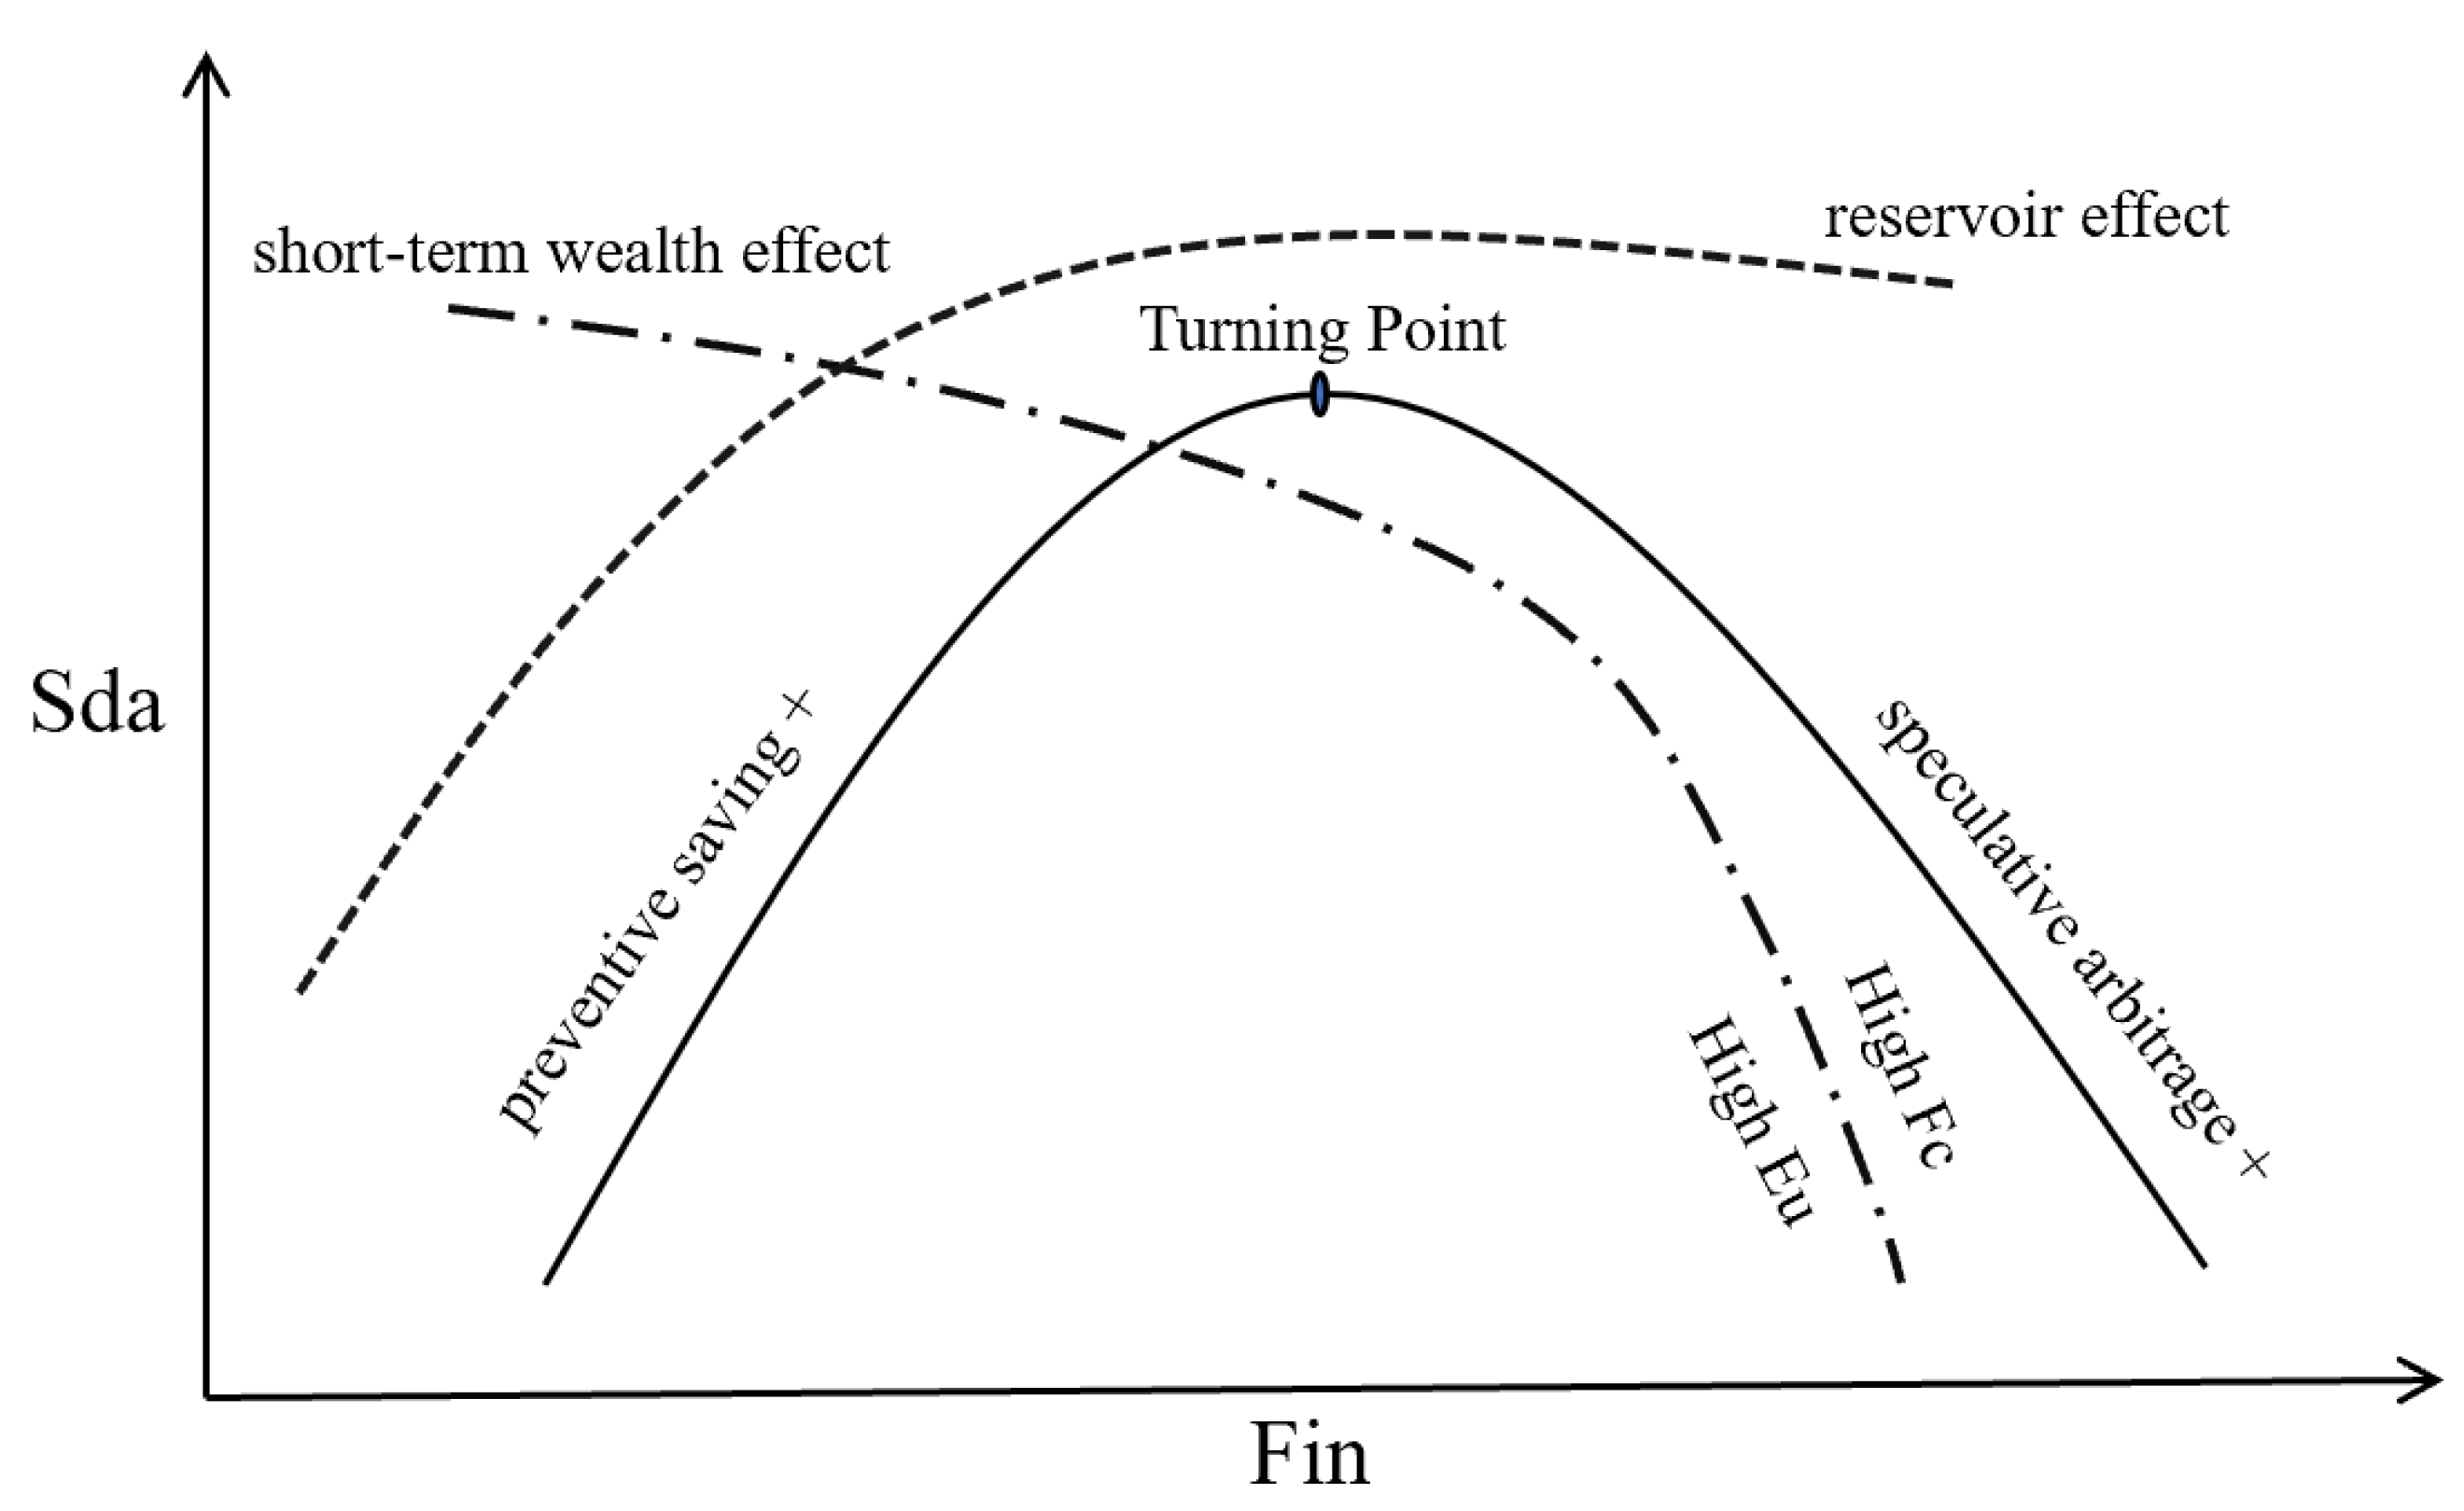
2.2. Corporate Financialization and Sustainable Development Ability

Corporate financialization mainly involves preventive saving and speculative arbitrage motivations, which can lead to two heterogeneous effects [30]. Driven by the precautionary saving motive, companies will allocate idle funds into financial assets, which can not only improve the liquidity of assets, but also earn investment income. The income can in turn accumulate funds for the sustainable development of companies. At the same time, when companies urgently need funds, they can quickly liquidate financial assets to meet their capital needs and promote their sustainable development. Dominated by the speculative arbitrage motive, companies may redirect funds originally meant for the main business to the financial sector in pursuit of high returns on financial assets, focusing solely on immediate gains but hindering the long-term development of the companies. However, the motives for corporate financialization are not clearly demarcated. It may not be accurate to draw a conclusion by examining the impact of corporate financialization on sustainable development from the perspective of preventing saving motivation or speculative arbitrage motivation alone. Thus, it is particularly important to understand the essence of financialization by distinguishing which motivation dominates in the process with changing financialization levels.
On the one hand, a moderate financialization level will have a positive impact on the sustainable development ability of companies. First, moderate financialization can improve or maintain operational advantages and ensure the long-term survival of companies. With the guidance of preventive saving motivation, moderate corporate financialization can obtain considerable investment returns that can be fed back to the main business, improve the operating conditions of companies [31,32], and strengthen investment flexibility to enhance the profitability of companies [3], such that companies can achieve long-term survival. Second, moderate financialization can provide strong financial support for the sustainable development of companies. Moderate financialization is usually reflected by a dominant preventive saving behavior, which can reserve funds for the production, operation, and development of companies [6]. Provided that companies are short of funds in the future, they can quickly bridge the capital gap by selling financial assets [7], alleviating cash flow crises. This strategy avoids the decline of sustainable development ability caused by the breaking of the capital chain and guarantees the capital supply for production and operation, technology innovation investment, and other activities [9], finally promoting corporate sustainable development.
On the other hand, excessive financialization should have a negative impact on the sustainable development ability of companies. First, excessive financialization will squeeze out the main business of companies and hinder their sustainable development. With the dominance of the speculative arbitrage motive, companies usually tend to allocate funds to high-yield financial sectors. However, with a limited total amount of capital, excessive financialization by companies will inevitably occupy the capital needed for the main business investments [33,34]. This damages the foundation of the main business on which companies rely for survival, leading to the gradual hollowing out of companies and affecting the future performance and development potential of the main businesses, which is not conducive to the long-term development of companies. Second, excessive financialization will change corporate business strategies and willingness to invest. From the perspective of business operation, excessive financialization will elevate the position of the financial sector within the real sector, leading to changes in corporate investment behaviors and operational strategies [35]. Companies will abandon low-margin and long-cycle development strategies in favor of pursuing short-term high profits. This shift will weaken the enthusiasm of companies in talent cultivation, technology research and development, innovation investment, and other production and operation activities that need long-term stable financial support. Thus, excessive financialization will reduce the willingness and ability of companies to carry out innovative research and development [36], and limit corporate sustainable development. Thirdly, excessive financialization may bury risks and hidden dangers for companies. Financial assets are investment products with high risks and high returns. Excessive allocation of financial assets by companies easily causes asset price bubbles [37] and accumulates financial risks [38], which poses a potential threat to the stable operation of companies. Moreover, the financial market has strong cyclical fluctuations. Excessive financialization may seriously affect corporate earnings and performance due to market fluctuations. Once the financial crisis or financial risks are amplified, the sharp decline in the prices of financial assets will lead to the rupture of corporate capital chains and the aggravation of debt pressure. This will cause business difficulties and poor capital turnover, such that the companies may suffer huge losses, inhibiting their long-term healthy development. Based on the above analysis, we propose the following hypothesis:
Hypothesis 1 (H1). 
There is an inverted U-shaped relationship between corporate financialization and sustainable development ability. This means that moderate financialization will enhance the sustainable development ability of enterprises, while deficient and excessive financialization will weaken the sustainable development ability of companies.

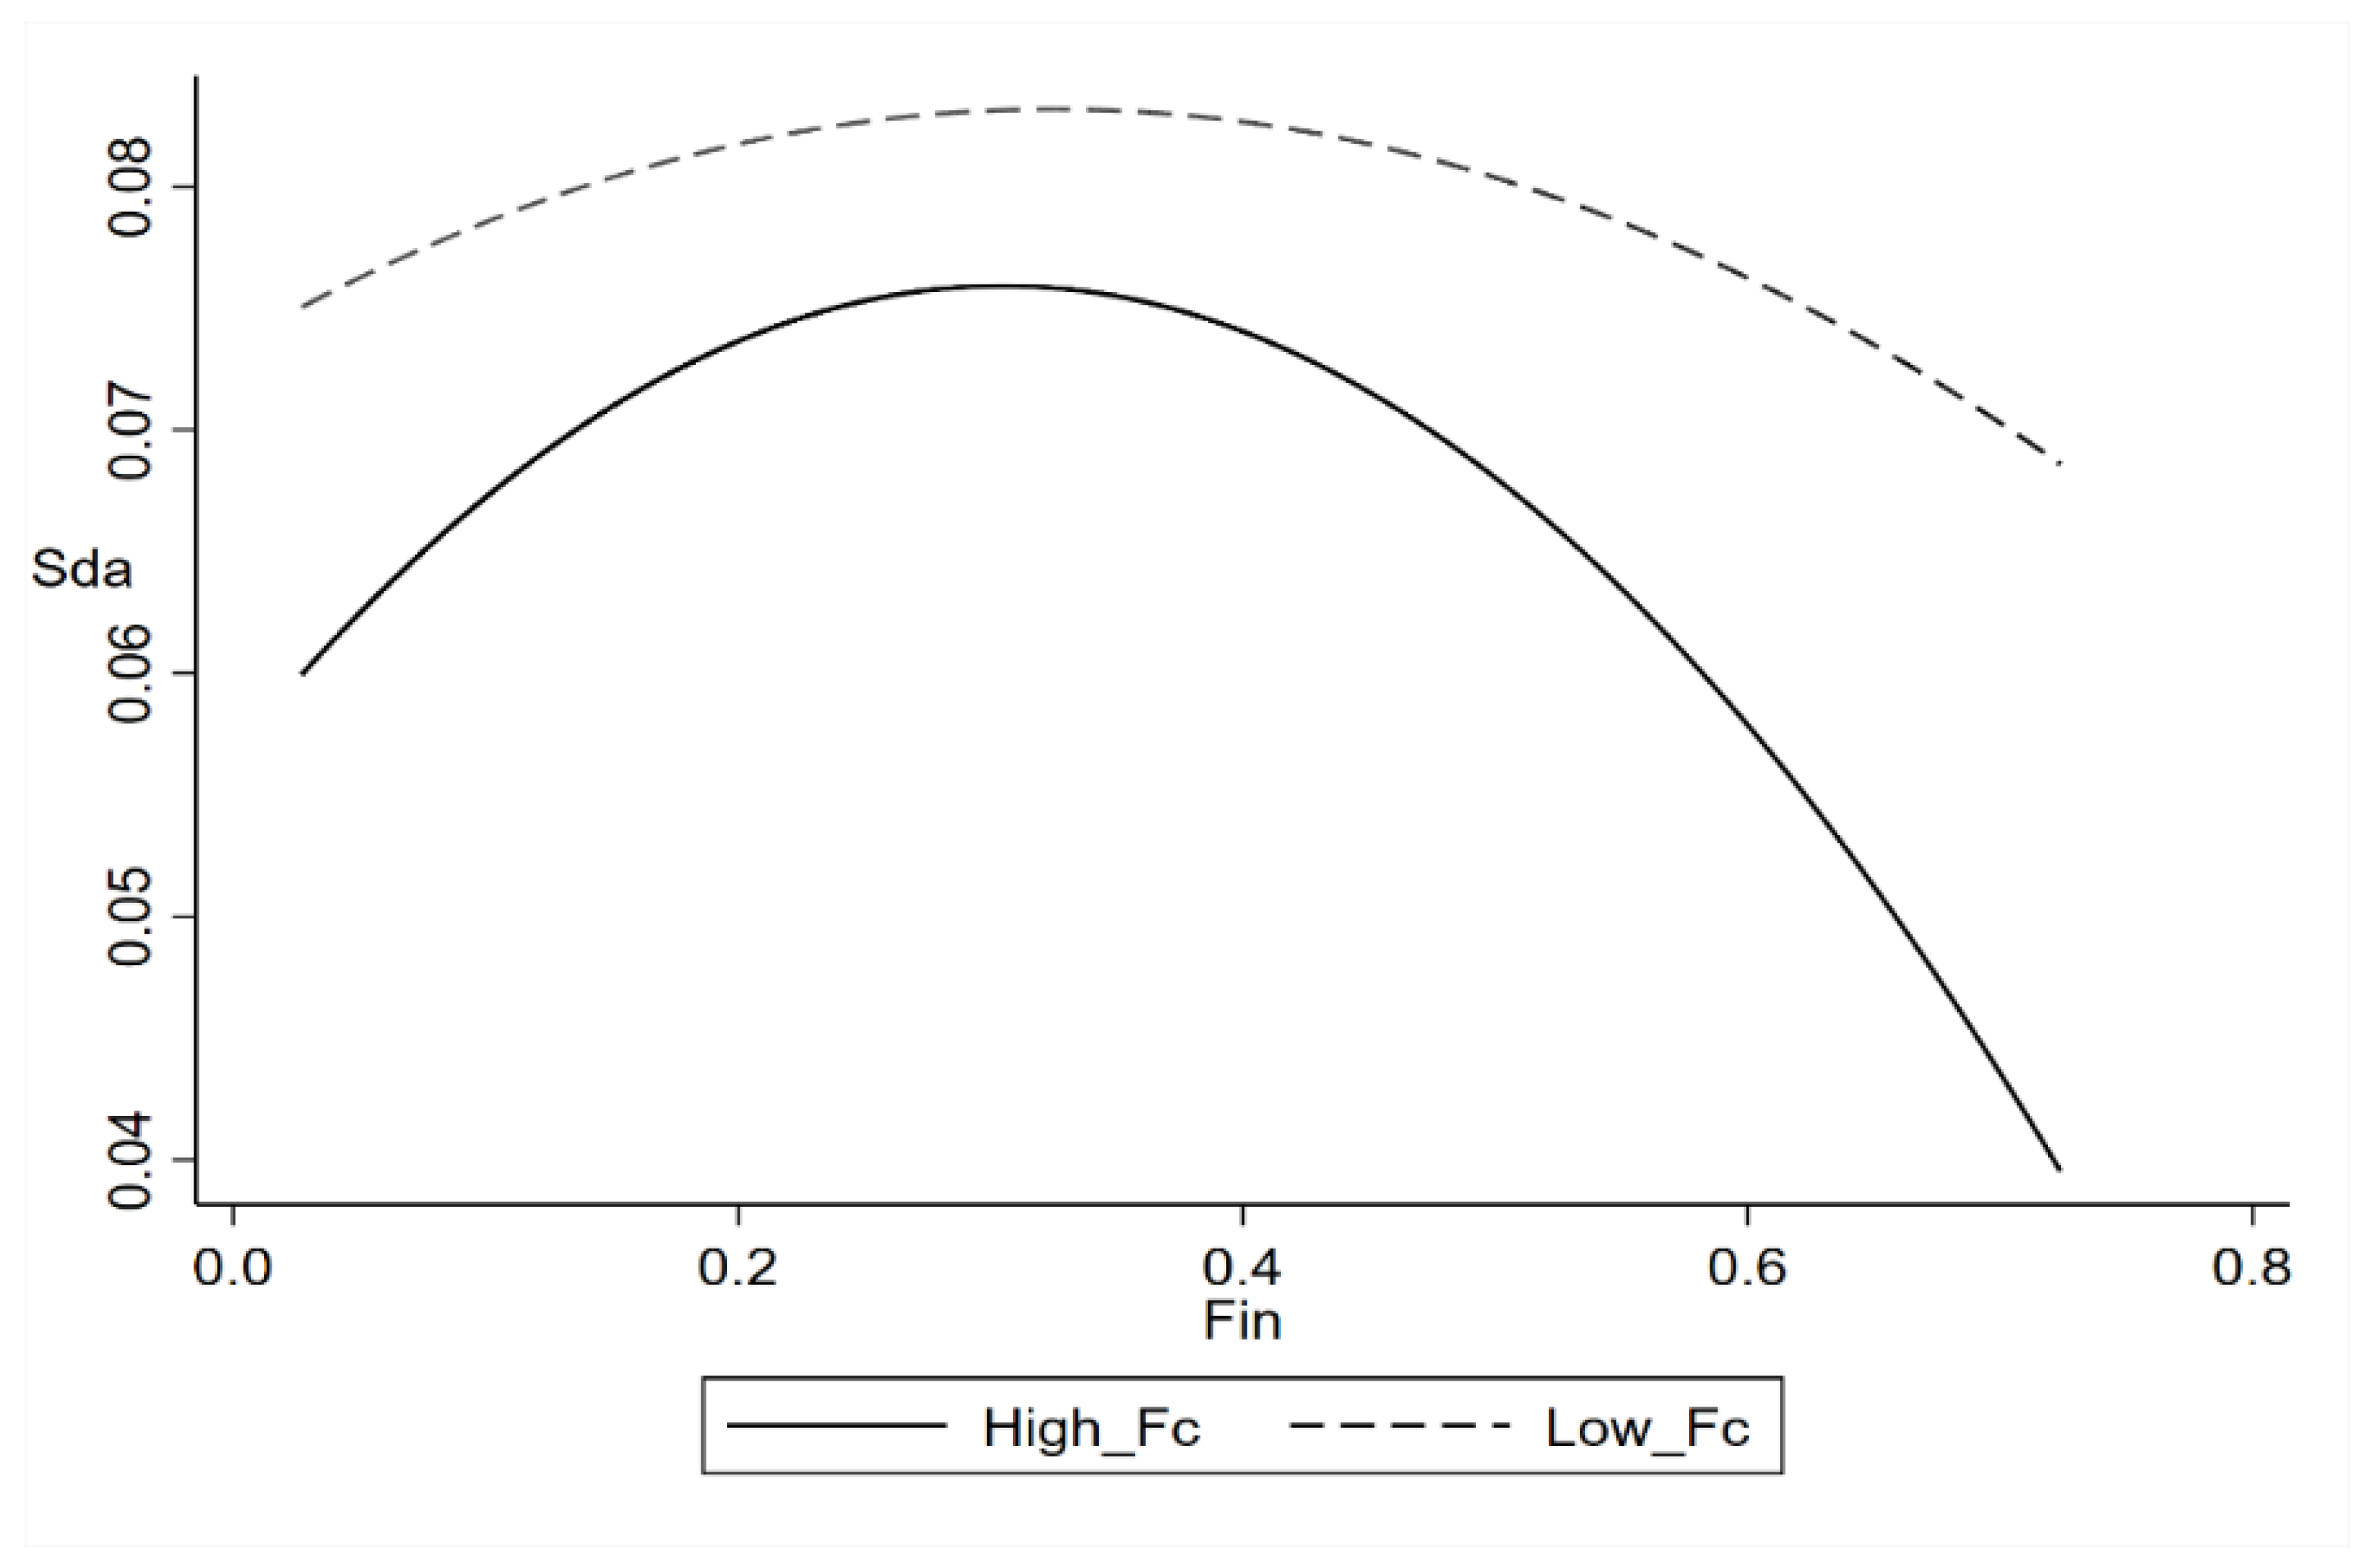
2.3. The Moderating Role of Financing Constraints

External financing is an important factor that affects the R&D innovation and sustainable development of companies. Ayyagari et al. [39] believed that financing constraint plays a key role in the survival and development of companies. When companies are faced with high financing constraints, it is difficult for them to obtain external financing, such that they have limited available funds. As a result, corporate investment scopes and investment scales are bound to be restricted, forcing companies to give up some investment projects that could enhance corporate values [40,41], or they may be forced to bear high financing costs. This reduces the efficiency of project investment, affecting the continuous investment and sustainable development of companies. At this time, moderate financialization can not only alleviate the capital pressure and avoid the risk of insufficient funds, but also increase the investment scales of companies in production and R&D innovation [6,42], solving the problem of insufficient investment to a certain extent [3]. Therefore, with high financing constraints, obtaining some financial support through moderate financialization will play a greater role in promoting the sustainable development ability of companies. However, if financialization cannot be controlled within a reasonable range, the high risk and high volatility of financial assets will bury the hidden danger for companies [43]. It will cause more serious capital shortages in companies and even trigger the risk of stock price collapse [44,45]. Moreover, due to the high financing cost and lack of financing channels, it is more difficult for companies to raise funds again. Therefore, high financing constraints will exacerbate the negative impact of excessive financialization, leading to a rapid decline in the sustainable development ability of companies. Provided companies are faced with low financing constraints, they have adequate capital sources with low borrowing costs, so they can take the initiative to make investment decisions in the face of high-quality investment projects [46]. When companies face difficulties, the funds obtained through financing facilities can effectively reduce the negative impact of external shocks on companies. In addition, low financing constraints have a positive effect on the main businesses of companies, supporting the normal development needs of their main businesses and enhancing the sustainable development ability of companies [47]. In summary, under the low financing constraint level, the effect of corporate financialization on sustainable development will be relatively small because the enterprises themselves have strong anti-risk and sustainable development capabilities. In summary, financing constraints play a moderating role in the relationship between corporate financialization and sustainable development ability. With an increase in financing constraints, both the positive and negative effects of corporate financialization on sustainable development ability may be amplified, and the inverted U-shaped relationship may become more pronounced. Therefore, this paper proposes the following hypothesis:
Hypothesis 2 (H2). 
Financing constraints play a moderating role in the inverted U-shaped relationship between corporate financialization and sustainable development ability. With an increase in financing constraints, the inverted U-shaped curve between corporate financialization and sustainable development ability becomes steeper.

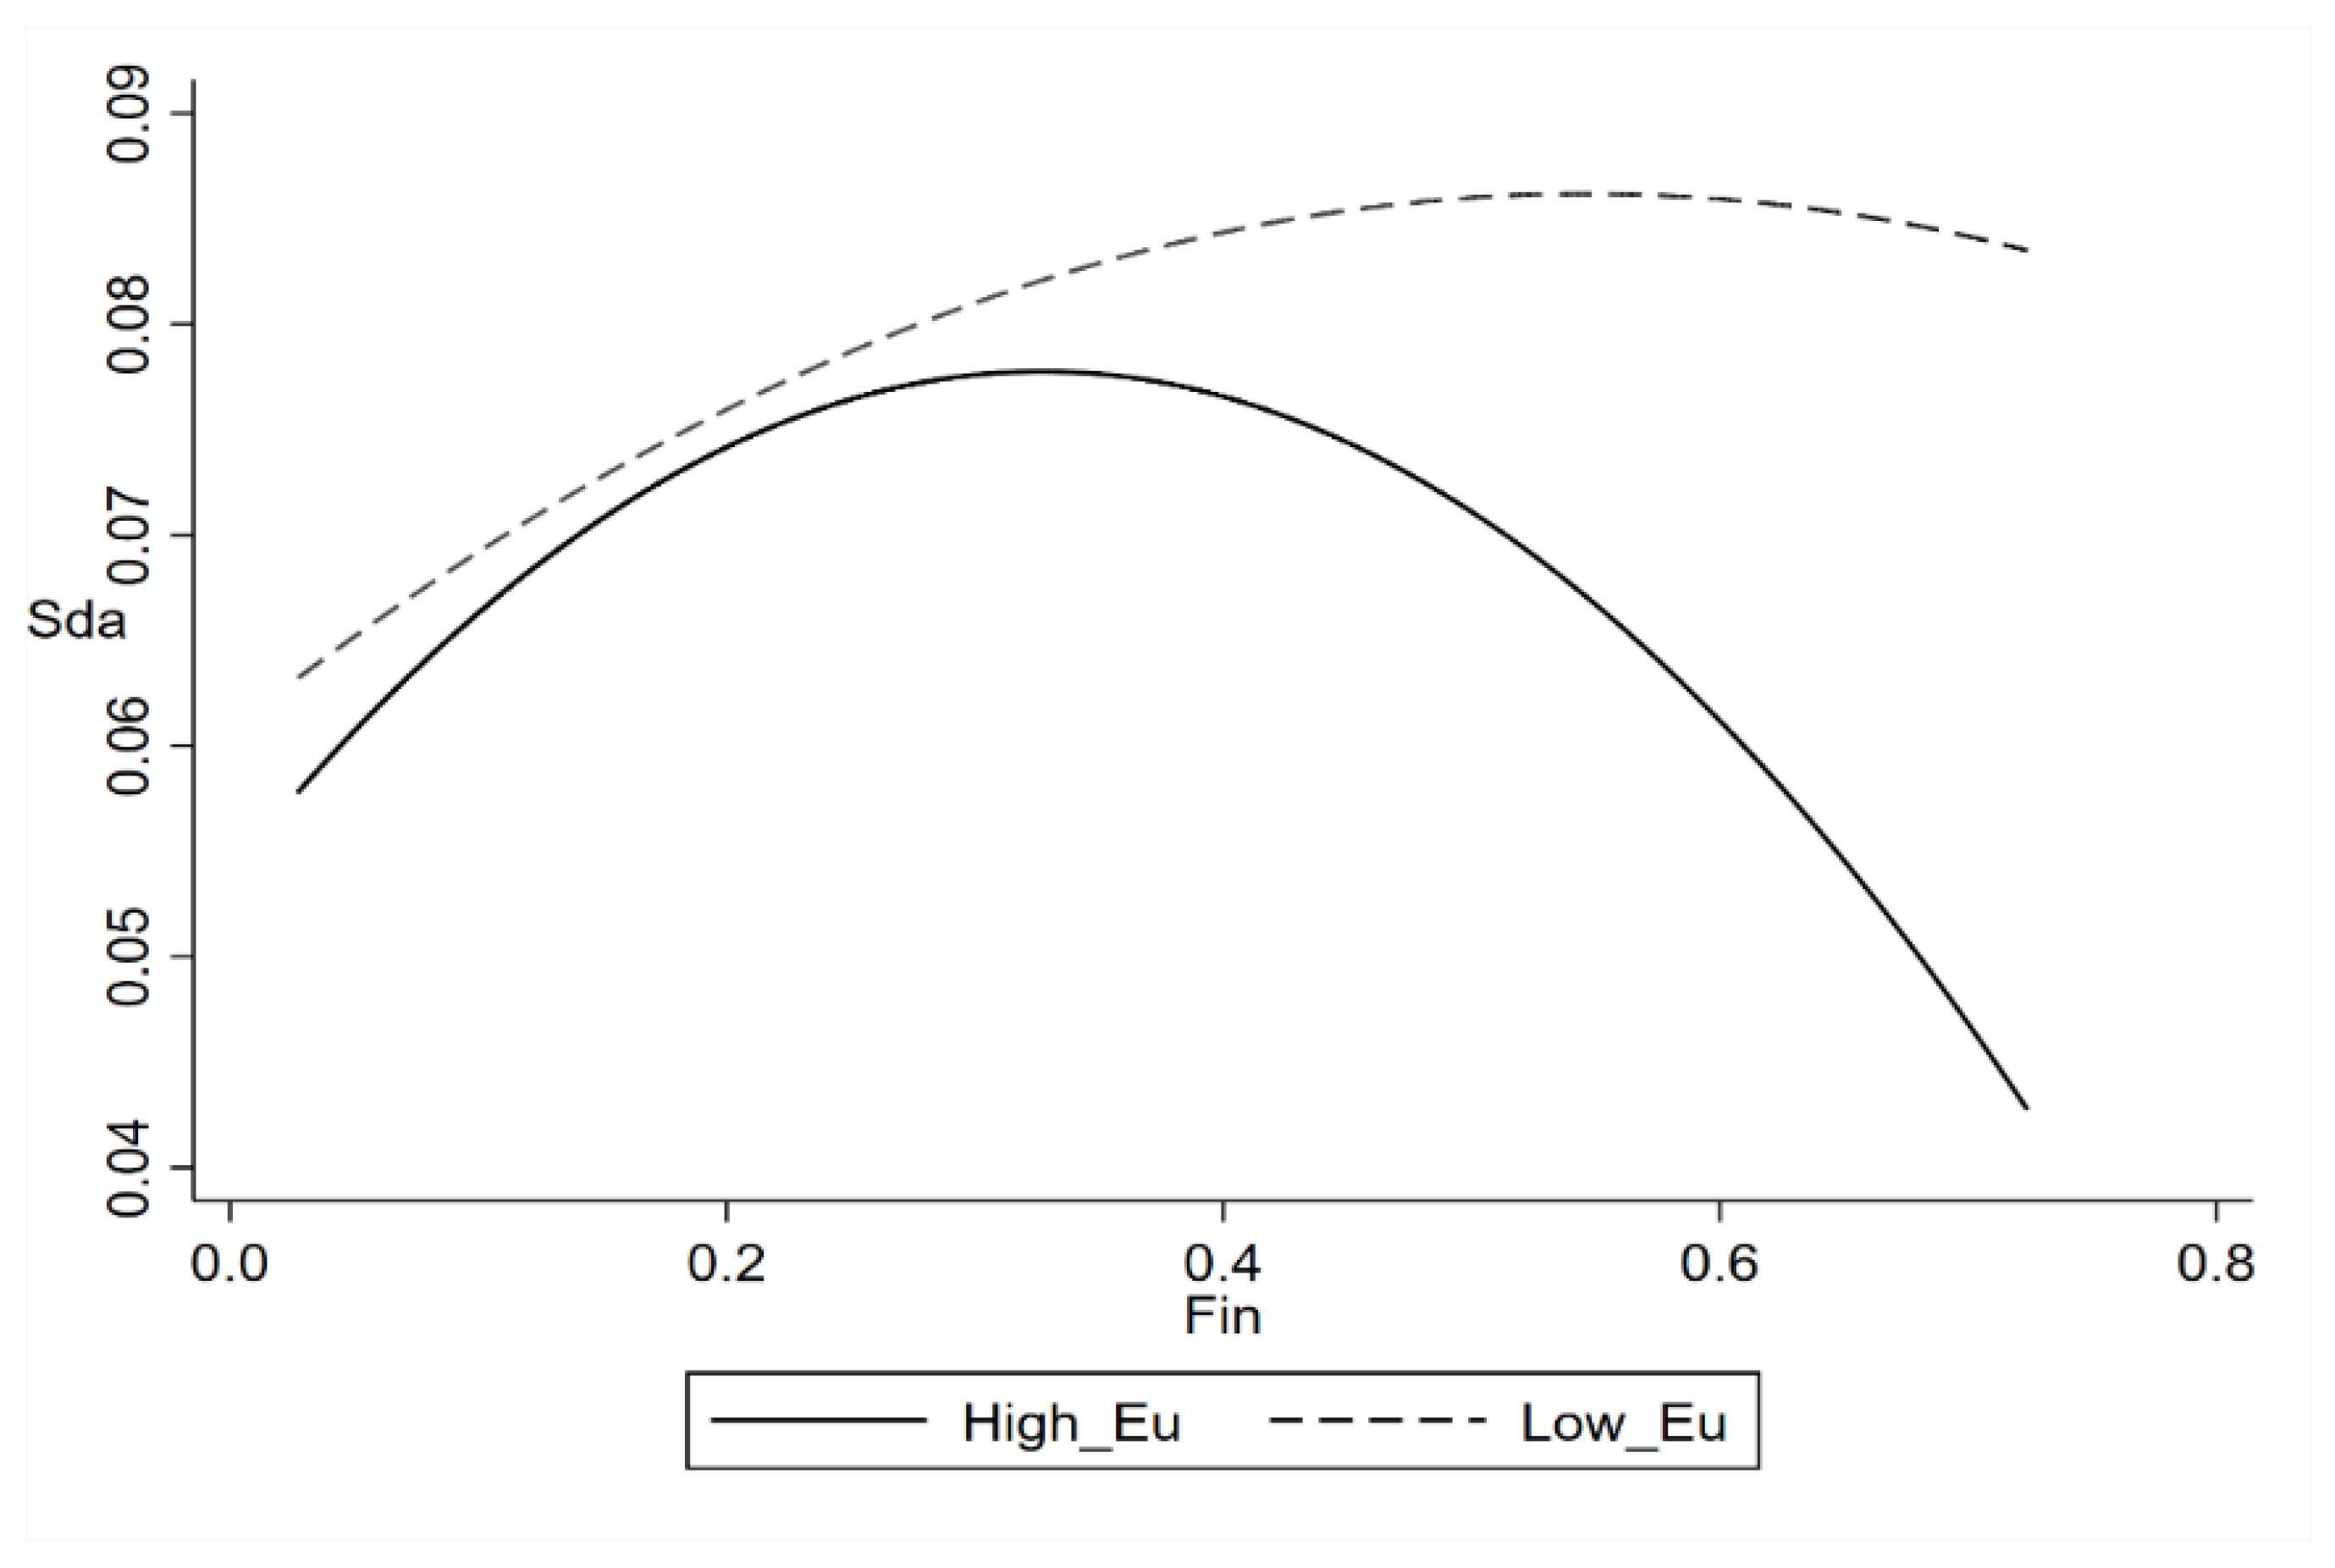
2.4. The Moderating Role of Environmental Uncertainty

Environmental uncertainty refers to the increasing dynamism and complexity of the market and technological environment that make it difficult to predict future changes for companies [48]. With the increase in environmental uncertainty, the constraints of resources and capacities become more and more obvious. Companies are faced with greater external pressures and risk challenges. The sense of crisis brought about by environmental uncertainty forces them to actively innovate and reform to cope with the impact of market and other environmental changes [49]. Su et al. [50] examined the influence of environmental uncertainty on R&D investment from the perspectives of market uncertainty and technological uncertainty. They found that market uncertainty has a positive effect on R&D investment, while technological uncertainty had no significant influence on R&D investment. Van et al. [51] also examined how environmental uncertainty influences R&D investment, revealing that firms tend to increase their R&D investment during periods of heightened environmental uncertainty. This trend is especially pronounced in highly competitive industries and among firms with products possessing lower market power. Zhang et al. [52] investigated the impact of environmental uncertainty on innovation from the dual perspectives of innovation quality and innovation quantity. The results indicate that environmental uncertainty promotes an increase in the quantity of innovation but is negatively correlated with innovation quality. In essence, amidst environmental uncertainty, companies are compelled to innovate and invest in research and development to navigate market dynamics, indicating a strategic response to mitigate risks and seize opportunities for growth and adaptation. Nevertheless, the internal resources that companies rely on are limited, while innovation activities need to seek external resource support. However, the increase in environmental uncertainty will affect the financing constraints of companies by reducing external financing channels and meanwhile increasing financing costs [53,54]. In order to alleviate financing constraints and smooth risks, companies will temporarily invest idle funds in financial assets to exert the reservoir effect [5]. Moderate financialization is beneficial for improving the liquidity of resources, broadening financing means, and smoothing the business risks of companies. At the same time, mutual shareholding with financial institutions can play a certain role in the improvement of production capacity and the renewal of equipment, which is conducive to the sustainable development of companies. However, excessive financialization may not only fail to play the role of reservoir, but also lead to greater possibility of corporate financial investment rather than real investment. This exacerbates the financial risks of companies and the instability of ongoing operations and then hinders the sustainable development of business and the sustainable competitive advantage. In contrast, provided the environmental uncertainty is low, markets tend to be stable and more resilient to external shocks. This also means that companies face relatively few challenges and pressures. Managers’ sensitivity to market and technological changes will decrease accordingly [55]. Management may place less urgency on the idea of proactive innovation and may prefer to maintain the status quo and focus on operating and improving the existing business. This could lead to low efficiency in technology innovation decision-making and implementation. Thus, with low environmental uncertainty, the impact of corporate financialization on sustainable development ability is relatively slight. Based on the above analysis, this paper puts forward the following hypothesis:
Hypothesis 3 (H3). 
Environmental uncertainty plays a moderating role in the inverted U-shaped relationship between corporate financialization and sustainable development ability. With an increase in environmental uncertainty, the inverted U-shaped curve between corporate financialization and sustainable development ability becomes steeper.
In summary, the theoretical framework of this paper is illustrated in Figure 1.

3. Study Design

3.1. Sample Selection and Data Sources

This study selects the data of A-share listed companies from 2010 to 2021 as the initial sample. All data used in this study are sourced from the CSMAR databases. To ensure the accuracy of research and the derived conclusions, the samples were processed as follows: (1) excluded companies in the financial industry and real estate industry; (2) removed companies with special treatment (ST and *ST); (3) removed companies with missing or abnormal observations for main research variables; (4) to avoid the influence of extreme values, winsorize processing was carried out on all continuous variables at the 1% and 99% level. After the above treatment, 13,278 samples were obtained.

3.2. Variable Selection and Description

3.2.1. Dependent Variable

The dependent variable is sustainable development ability (Sda). Sustainable development ability refers to the ability of a company to continue to earn profit and grow steadily in the current competitive area and future business development environment. At present, there are many models and methods for measuring sustainable development ability, among which the Van Horn and Higgins sustainable growth models are widely used in the academic community. However, the Higgins sustainable growth model does not take into account the factor of stock issuances, so it cannot match well with the business environment. Thus, referring to the works of Fonseka et al. [56] and Wen et al. [57], we adopt the Van Horn static model of sustainable development to measure the sustainable development ability of companies. The Van Horn static model is calculated from a number of indicators. Among these, the net profit margin on sales reflects the ability of an enterprise to obtain sales revenue in a certain period, while the retention ratio indicates the degree to which the enterprise retains profits for reinvestment. These indicators collectively unveil the company’s prowess in terms of profitability, expansion, and financial stability, thereby enabling a more comprehensive evaluation of the company’s sustainability.

3.2.2. Independent Variable

The independent variable is corporate financialization (Fin). The existing literature mainly measures corporate financialization from the perspectives of financial asset allocation and financial investment returns. Referring to the works of Demir [2], Zhang et al. [58], Gao et al. [59], this paper uses the ratio of financial assets to total assets to define corporate financialization. The calculation criteria of corporate financial assets include monetary funds, trading financial assets, investment real estate, held-to-maturity investments, available-for-sale financial assets, dividends receivable, and interest receivable.

3.2.3. Moderating Variables

One moderate variable is financing constraint (Fc). Referring to the methods of Kaplan and Zingales [60] and Bai et al. [61], this paper constructs the KZ index to measure the degree of corporate financial constraints, where a higher KZ index indicates a higher degree of financing constraints faced by the company. Following that, we established dummy variables based on the median of the KZ index to depict varying levels of financing constraints. When the KZ index is greater than its median, the company is subject to higher financing constraints, and the variable Fc is set to 1; when the KZ index is less than its median, the company faces lower financing constraints, and the variable Fc is set to 0.
The other moderate variable is environmental uncertainty (Eu). Drawing on the methods of Ghosh et al. [62] and Li et al. [63], this paper uses the industry-adjusted standard deviation of operating income in the past five years to measure environmental uncertainty. We employ dummy variables to measure the degree of environmental uncertainty. When the value of environmental uncertainty is greater than the median, the variable Eu is set to 1, which means that the environmental uncertainty faced by the company is high; otherwise, it is set to 0.

3.2.4. Control Variables

Comprehensively referring to the existing literature, several indicators influencing the corporate sustainable development ability are introduced as control variables from corporate characteristics, corporate finance, corporate governance, and so forth. Specifically, these indicators include corporate size (Size), corporate age (Age), corporate growth (Growth), ownership concentration (Shrcr), executive compensation (Pay), asset–liability ratio (Lev), and management expense ratio (Expen). Detailed definitions of the variables are shown in Table 1.

3.3. Model Design

To examine the nonlinear relationship between corporate financialization and sustainable development ability, this paper constructs the following model:
  S d a i , t = α 0 + α 1 F i n i , t + α 2 F i n i , t 2 + k = 3 9 α k C o n t r o l i , t , k + Y e a r t + I n d u s t r y i + ε i , t    
where Sda represents the sustainable development ability of companies; Fin represents the corporate financialization, while Fin2 represents the quadratic term; Control represents all involved control variables; Year and Industry represent the year and industry fixed effects; ε represents the random error term; i denotes an individual company; and t denotes the year.
In order to test the moderating effects of financing constraints and environmental uncertainty, we introduce interaction terms to the baseline model as follows:
S d a i , t = α 0 + α 1 F i n i , t + α 2 F i n i , t 2 + α 3 F i n i , t × M i , t + α 4 F i n i , t 2 × M i , t + α 5 M i , t + k = 6 12 α k C o n t r o l i , t , k + Y e a r t + I n d u s t r y i + ε i , t
In the above model, Fin × M is the interaction term between the moderating variable M and the financialization Fin, and Fin2 × M is the interaction term between the moderating variable M and the quadratic term of Fin. The moderating variable M is defined as {Fc, Eu}.

4. Empirical Test for Hypothesis 1

4.1. Descriptive Statistics and Correlations

The descriptive statistics of the main variables are shown in Table 2. The mean value of Sda is 0.0714. The minimum value is −0.0177, while the maximum value is 0.3440. The large gap between the mean value and the maximum value means that there are clear differences in sustainable development ability between companies. The overall level still needs to be improved. In regard to corporate financialization, the mean value is 0.227, the minimum value is 0.0272, and the maximum value is 0.7239. This shows that the average level of financial assets held by non-financial companies is still relatively high, implying that corporate financial investments are relatively common. The descriptive statistics of the remaining control variables are similar to the findings from other literature. They will not be explained individually.
Table 3 reports the correlation test results of the main variables. Generally speaking, when the absolute value of the correlation coefficient between variables is large, it means that they are strongly correlated. In general, when the correlation coefficient exceeds 0.8, we think there is a multicollinearity problem. It can be observed that the correlation coefficients are relatively small; there are no potential multicollinearity problems.

4.2. Empirical Results

Table 4 reports the regression results of corporate financialization and sustainable development ability. According to the regression results in column (1), the coefficient of corporate financialization is 0.1195, and the coefficient of the square term of corporate financialization is −0.1735, both of which are significant at the 1% level. Column (2) controls the year and industry effects. The regression results show that the coefficients of corporate financialization and its squared term remain significant, and the directions are both consistent with the results in column (1). In column (3), the test adds a series of control variables. The signs and significances of both corporate financialization and its square term are still unchanged. This shows that there is an inverted U-shaped relationship between corporate financialization and sustainable development ability, that is, moderate financialization will promote the sustainable development of companies, while deficient and excessive financialization may inhibit the sustainable development of companies.
In order to ensure the reliability of the above results, it is necessary to conduct further tests. Specifically, we adopt a rigorous examination of the inverted U-shaped relationship following the method proposed by Lind et al. [64]. The results demonstrate the following: First, the coefficients of corporate financialization and its square term are significant, where the former is positive and the latter is negative. This situation aligns with the characteristics of the inverted U-shaped relationship. Second, the curve is steeper at the left and right ends. According to the descriptive statistics in Table 2, the minimum and maximum values of Fin are 0.0272 and 0.7239, respectively. The slope of the left end ( α 1 + 2 α 2 F i n m i n ) is 0.1285, while the slope of the right end ( α 1 + 2 α 2 F i n m a x ) is −0.1499, again satisfying the characteristics of the inverted U-shaped relationship. Third, the inflection point of the curve( α 1 / 2 α 2 ) is 0.3488, which is within the interval [0.0272, 0.7239], the moderate range of corporate financialization. This indicates that there is a significant inverted U-shaped relationship between corporate financialization and sustainable development ability. Hypothesis 1 is confirmed.

4.3. Robustness Test

To ensure the reliability and robustness of the inverted U-shaped relationship between corporate financialization and sustainable development ability, the following methods are further used to perform a robustness test.

4.3.1. Replacing Dependent Variable

Referring to existing research [57], this study employs total factor productivity (TFP) as a proxy variable for sustainable development ability, measured through the Levinsohn and Petrin method. The updated regression results are shown in column (1) of Table 5. Following the replacement of the sustainable development ability measurement, there have been no significant changes in the sign and significance of the regression coefficients for each major variable. The regression findings remain consistent with the original empirical results. The test results provide support for the aforementioned hypothesis 1.

4.3.2. Replacing Independent Variable

The academic community has not reached a consensus on the composition of corporate financial assets, which leads to differences in the measurement of corporate financialization. Currently, it is still controversial whether investment real estate should be recognized as financial assets [30]. Compared with other financial assets, investment real estate has the disadvantage of poor liquidity, which deviates from the typical characteristics of financial assets. Accordingly, we exclude investment real estate from the financial assets of companies and test by remeasuring the corporate financialization indicator. The specific result is shown in column (2) of Table 5. It can be seen that it is generally consistent with the original empirical result, which implies that the inverted U-shaped relationship between enterprise financialization and sustainable development ability is robust, in terms of the way by replacing the independent variable.

4.3.3. Sub-Sample Regression

Considering that different sample structures and capacities may have an impact on the consistency of the research conclusions, a robustness test is conducted from the following two aspects: ① The first is using manufacturing samples. Manufacturing is the foundation of the real economy. Financialization is critical for its long-term sustainable development. Thus, the manufacturing samples are extracted to conduct a regression test. ② The second is adjusting the sample interval. Due to the repercussions of a severe global economic crisis in 2008, China was not exempt from its effects. Thus, to avoid the disruption caused by the financial crisis, the years in the post-crisis period are excluded. Only the data after 2012 are retained. The regression results can be found in Table 5, columns (3) and (4), which indicate that there is no substantial change in the sub-sample regressions. The inverse U-shaped relationship between corporate financialization and sustainable development ability remains robust in terms of sub-sample regressions.

4.3.4. Addressing Endogeneity

To address the possible endogeneity issues, the following methods are adopted: ① The first is the lagged variable method. Since corporate sustainable development ability may in turn affect financialization behavior, it leads to the endogeneity of reverse causality. Therefore, drawing on the method of Chen et al. [65], we conduct an empirical test using the first-order lag of both the linear and quadratic terms of corporate financialization. At the same time, to avoid potential interference from control variables, the control variables are also treated with a one-period lag. The specific results are shown in column (5) and column (6) of Table 5. The regression results of both the core explanatory variables and all explanatory variables’ first-order lagged terms are consistent with those presented earlier, indicating that there is no effect of reverse causality and that the conclusion drawn is reliable. ② The second is the instrumental variable method. Indeed, it is difficult to overcome the endogeneity problem of the model only using the first-order lag terms of the explanatory variables alone, so this paper further uses the instrumental variable approach. To select the instrumental variable, two approaches were employed. First, referring to the work of Xu et al. [13], we use the average corporate financialization of other companies in the same industry and province as the instrumental variables. The average financialization of other companies in the same industry and the same province is related to the financialization level of the sample company, but it will not directly affect the sustainable development ability of this sample company. The instrumental variables satisfy the prerequisites of relevance and exclusivity. Second, following the processing logic of Lewbell et al. [66], we construct the cubic difference between the corporate financialization and the mean of corporate financialization as an instrumental variable. As the number of instrumental variables must be at least the same as the number of endogenous variables, the square terms of the constructed variables above are included in the two-stage model. This approach can construct an effective instrumental variable without relying on external factors.
Meanwhile, to mitigate potential endogenous effects, this study leads the dependent variable (Sda) by one period and conducts a two-stage least squares regression with the independent and control variables. Table 6 reports the results of the two-stage least squares regression. Columns (1)–(3) present the instrumental variable test results using the first method. The regression results of the first stage show that the regression coefficients of the instrumental variables are all significant at the 1% level. In the second-stage regression, there is still a significant inverse U-shaped relationship between corporate financialization and sustainable development ability. Meanwhile, the Kleibergen–Paap rk LM statistic is significant at the 1% level, and both the Cragg–Donald Wald and Kleibergen–Paap rk Wald F statistics exceed the critical values at the 10% level, indicating that the instrumental variables are identifiable and not weakly instrumental variables. Thus, the selected instrumental variables are effective. Columns (4)–(6) present the instrumental variable test results using the second method. The results are generally consistent with the above ones, which further demonstrates the robustness of our conclusions. Finally, we further conduct the Durbin–Wu–Hausman test on the core explanatory variables using valid instrumental variables. The test results are all significant at the 10% level, rejecting the hypothesis that Fin and Fin2 are exogenous variables. Therefore, we consider Fin and Fin2 to be endogenous. The necessity of the 2SLS model is confirmed.

5. Moderating Effects

5.1. Nonlinear Moderating Effect Test

Referring to the methods testing the inverted U-shaped curve moderating effects by Haans et al. [20] and Jin et al. [67], this paper examines the nonlinear moderating effects of financing constraints and environmental uncertainty from three aspects. First, it examines whether the moderating effect exists. By focusing on the significance of the coefficient α 4 (when M is Fc, α 4 represents the coefficient of Fin2 × Fc; while when M is Eu, α 4 represents the coefficient of Fin2 × Eu) in model (2), we can determine whether the selected moderating variable has a moderating effect. Second, it examines whether the shape of the curve changes. The shape of the curve, whether it is flatter or steeper, is primarily reflected by the sign of α 4 . For the inverted U-shaped curve, if the coefficient α 4 is significantly positive, the curve will become flatter with the moderating variable increasing; if it is significantly negative, the curve will become steeper. Third, it examines whether the inflection point of the curve has shifted left or right. Taking the first partial derivative in model (2) with respect to corporate financialization and then setting it to zero yields the expression for the inflection point, as shown in Equation (3). By taking the partial derivative of the moderating variable in Equation (3), the influence of the moderating variable on the inflection point of the curve can be analyzed, as shown in Equation (4). As the denominator of Equation (4) is strictly greater than zero, the direction of the inflection point shift depends on the sign of the numerator α 1 α 4 α 2 α 3 . Provided α 1 α 4 α 2 α 3 is greater than zero, the inflection point Fin* will move to the right as M increases; conversely, the inflection point Fin* will move to the left as M increases.
                                                  F i n * = α 1 α 3 M 2 α 2 + 2 α 4 M                                                                
                                                F i n * M = α 1 α 4 α 2 α 3 2 ( α 2 + α 4 M ) 2                                                            

5.2. Results and Analysis

In order to test Hypothesis 2 and Hypothesis 3, we examine the moderating roles played by financing constraints and environmental uncertainty and plot the diagrams depicting the moderating effects of financing constraints and environmental uncertainty, respectively, according to the regression results. The results are shown in Table 6 and Figure 1 and Figure 2, where Figure 1 and Figure 2 correspond to columns (1) and (2) in Table 7.
Column (1) in Table 6 shows the moderating effect regression results of financing constraints. It can be seen that the cross-multiplication coefficient between financing constraints and corporate financialization is significantly positive, and the cross-multiplication coefficient between financing constraints and the square term of corporate financialization is significantly negative. This shows that the financing constraints have a significant moderating effect on the relationship between corporate financialization and sustainable development ability. And the higher the financing constraints, the steeper the inverted U-shaped curve between corporate financialization and sustainable development ability. Meanwhile, α 1 , α 2 , α 3 , and α 4 in column (1) are all significant, and the value of α 1 α 4 α 2 α 3 calculated by substituting the coefficient is −0.00077, which is less than zero. Therefore, with the increase in financing constraints, the inflection point of the curve will move to the left. Moreover, it can be intuitively seen from Figure 2 that compared with the low financing constraint, the overall level of the curve under the high financing constraints is lower, and the inverted U-shaped curve is steeper. That is, the sustainable development ability is more sensitive to corporate financialization, subject to high financing constraints. This is because when companies are in financing difficulties, moderate financialization can broaden their financing channels and relieve the pressure of capital tension in the short term. This is conducive to the normal operation of corporate businesses and promotes their sustainable development. However, if corporate financial investment exceeds the moderate range, the positive impact of financialization on sustainable development ability will turn into a negative impact. Especially with high financing constraints, this negative impact becomes particularly pronounced. Excessive financialization will have a significant impact on the structure of the corporate balance sheet. Once the financial market experiences unfavorable changes, companies will face serious financial risks, and their continuing operations will be threatened. Moreover, due to the limited financing channels and high financing costs, it is difficult for companies to raise funds, which will further have a serious impact on the development of the main businesses and then hinder the sustainable development of companies. Based on the above analysis, Hypothesis 2 is validated.
Column (1) in Table 7 shows the moderating effect regression results for environmental uncertainty. Among them, the regression coefficients of the interaction terms are significant, indicating the moderating role played by environmental uncertainty in the relationship between corporate financialization and sustainable development ability. Furthermore, α 4 = 0.1370 , which is significantly negative at the 1% level, so the inverted U-shaped curve becomes steeper with the higher environmental uncertainty. Meanwhile, by calculating the regression coefficients given in column (2) and then returning the shifting discriminant for the inflection point, α 1 α 4 α 2 α 3 = 0.00831 , which is less than 0. This shows that the inflection point of the inverted U-shaped curve moves to the left under the moderating effect of environmental uncertainty. In addition, in order to intuitively show the moderating effect of environmental uncertainty, combined with Figure 3, we can see that the moderating effect curve with a high environmental uncertainty level is steeper, the sustainable development ability level is lower, and the inflection point obviously shifts to the left. This means that corporate financialization has a greater impact on sustainable development ability with high environmental uncertainty. Hypothesis 3 is confirmed.

6. Further Study

6.1. Transmission Mechanism Analysis

The previous sections presented empirical tests on the relationship between corporate financialization and sustainable development ability. It is proved that there is an inverted U-shaped relationship between corporate financialization and sustainable development ability. Next, we will further examine whether corporate financialization affects sustainable development ability through the reservoir effect and the short-term wealth effect. Drawing on the methods of Zhao et al. [68], we construct models (5) and (6) as follows:
  M e d i , t = β 0 + β 1 F i n i , t + k = 3 9 β k C o n t r o l i , t , k + Y e a r t + I n d i + ε i , t                  
S d a i , t = γ 0 + γ 1 F i n i , t + γ 2 F i n i , t 2 + γ 3 M e d i , t + k = 4 10 γ k C o n t r o l i , t , k + Y e a r t + I n d i + ε i , t
In model (5), Med is used as a mediating variable to test the existence of the reservoir effect and short-term wealth effect of corporate financialization. Drawing on the method of Wang et al. [9], we measure liquidity supply (Cash) by the proportion of operating cash flow to total assets to examine the reservoir effect. Building on the work of Yang et al. [69], we measure the financial investment profit rate (Main) by the ratio of financial asset return to net profit to investigate the short-term wealth effect. Here, the financial asset return is the sum of interest return, investment return, and fair value change return, minus the investment return from associates and joint ventures. If the coefficient of β 1 is significant, it indicates that there is a reservoir effect or short-term wealth effect in corporate financialization. Once the effect of corporate financialization is confirmed, we can further examine whether corporate financialization affects sustainable development ability through the mechanism of the reservoir effect or the short-term wealth effect. If the coefficient of γ 3 in model (6) is significant, it indicates that the reservoir effect or the short-term wealth effect plays a mediating role in the process of corporate financialization and sustainable development ability. Otherwise, there is no mediating effect. In addition, if the signs of coefficients β 1 and γ 3 are the same, it means that the reservoir effect or the short-term wealth effect helps enhance the sustainable development ability of companies; otherwise, it indicates that the reservoir effect or the short-term wealth effect weakens the sustainable development ability of companies.
Table 8 reports the empirical results of the reservoir effect affecting the sustainable development ability. As can be seen from column (2), the coefficient of corporate financialization on liquidity supply is 0.0397, which is significantly positive at the 1% level. This indicates that corporate financialization is helpful in improving the liquidity condition of the enterprise, implying the existence of the reservoir effect. In column (3), the coefficient of liquidity supply on sustainable development ability is 0.3274, which is significantly positive at the 1% level. The signs of the two coefficients are the same, indicating that corporate financialization enhances the sustainable development ability of companies through the reservoir effect. With the precautionary saving motive, companies enhance the liquidity of funds through financial means, ease their financing constraints, and effectively prevent the liquidity crises caused by cash flow fluctuation or fund shortages to ensure the stable operation of companies and improve their sustainable development ability. That is, the reservoir effect plays an intermediary role between corporate financialization and sustainable development ability.
Table 9 reports the empirical results of the short-term wealth effect affecting the sustainable development ability. As can be seen from column (2), the coefficient of corporate financialization on financial investment profit rate is 0.177, which is significantly positive at the 5% level. It shows that corporate financialization can improve the profit rate of financial investment and obtain high profits in the short term. Thus, there is the short-term wealth effect. In column (3), the coefficient of financial investment profit rate on sustainable development ability is −0.01541, which is significantly negative at the 1% level. The signs of the two coefficients are opposite, indicating that corporate financialization weakens the sustainable development ability of companies through the short-term wealth effect. With the speculative arbitrage motive, companies will pursue excess profits by rapidly expanding financial investment and financial asset scale to achieve excellent financial performance. Although this behavior will increase profits in the short term, it will squeeze the investment in main businesses and R&D innovation, thereby reducing the market competitiveness of companies and damaging their sustainable development. In other words, the short-term wealth effect plays an intermediary role between corporate financialization and sustainable development ability.
In summary, corporate financialization affects the sustainable development ability through the reservoir effect and short-term wealth effect. This shows that in the process of corporate financialization, the precautionary saving motive and the speculative arbitrage motive will coexist. Only in different stages, the reservoir effect and short-term wealth effect dominate, which is the result of the joint actions of both these motivations. It is confirmed that the motivation for corporate financialization is not clearly demarcated. Therefore, when determining the motivation of financial asset allocation by companies, we should combine different stages of financialization for analysis.

6.2. Heterogeneity Analysis of the Term Structure

Financial assets are not only wide-ranging, but also have differences in investment period, return, risk, and so on. Based on such differences, distinct types of financial assets held by companies may have diverse impacts on sustainable development ability. Therefore, we need to categorize financial assets and further explore the heterogeneity of financial assets with different maturities. Drawing on the research of Zhang et al. [70] and Xu et al. [13], this paper divides financial assets into short-term financial assets and long-term financial assets according to liquidity. Short-term financial assets include monetary funds, trading financial assets, dividends receivable, and interest receivable; long-term financial assets include available-for-sale financial assets, held-to-maturity investments, and investment real estate.
The estimated results of the influence of financial assets with different maturities on sustainable development capabilities are presented in Table 10. It can be observed that the coefficients of the short-term financialization indicator (SFin) and its squared term are both significant at the 1% level. The long-term financialization indicator (LFin) has no significant influence on the sustainable development ability of enterprises. This indicates that the inverted U-shaped relationship between corporate financialization and sustainable development ability is influenced by the maturity structure of financial assets. The reason may stem from the fact that, in comparison to long-term financial assets, short-term financial assets possess high liquidity and strong realization capability. Therefore, the reservoir effect of corporate financialization becomes more pronounced when enterprises hold short-term financial assets. However, too much liquidity may be detrimental to the long-term development of enterprises. Under the dominance of speculative arbitrage motives, enterprises may fall into the profit-seeking cycle of “investing in short-term financial instruments–obtaining income–investing in short-term financial instruments”, which will damage the long-term planning of industrial development and reduce the sustainable development ability of enterprises.

7. Conclusions and Recommendations

Using data from Chinese non-financial listed companies from 2010 to 2021, we conduct an empirical study on the relationship between corporate financialization and sustainable development ability. We test the moderating effects of financing constraints and environmental uncertainty on the relationship between these two and further examine the mechanisms through which corporate financialization affects sustainable development ability.
The main conclusions are as follows: (1) There exists an inverted U-shaped relationship between corporate financialization and sustainable development ability, meaning that a moderate financialization level enhances the sustainable development ability of companies, while excessive financialization weakens it. (2) Financing constraints and environmental uncertainty can moderate the inverse U-shaped relationship between corporate financialization and sustainable development ability. With an increase in financing constraints and environmental uncertainty, changes in the financialization level have a greater impact on sustainable development ability, and the corresponding optimal financialization thresholds are lower. (3) Corporate financialization affects sustainable development ability through the reservoir effect and the short-term wealth effect. The reservoir effect shows that corporate financialization can improve the liquidity of assets, ease cash flow constraints, and enhance the sustainable development ability of companies. The short-term wealth effect manifests that corporate financialization can stimulate managers’ short-sighted behavior and weaken the sustainable development ability of companies by more focusing on short-term financial performance.
Based on the conclusions, we put forward the following recommendations: First, guide companies to moderate financialization and implement the sustainable development concept. The government should actively guide companies to have a correct understanding of the relationship between financialization and sustainable development and encourage them to make moderate financial investments and utilize the cash flow generated from financial assets to support their core business development, so as to achieve the long-term development goals of companies. Second, improve the financial regulatory system. Through the establishment of a scientific regulatory threshold for corporate financialization, the financial regulatory authorities can standardize corporate financial behavior and prevent the problem of excessive financialization in companies. Third, improve the credit management system and optimize the financing environment. By establishing credit reward and punishment mechanisms for companies, we can optimize the credit evaluation system to reduce credit discrimination and improve credit support for high-quality small and medium-sized companies, alleviating their financing pressure. Fourth, we should create a fair and transparent external environment to ensure a stable and orderly economic market, such that finance can better serve the real economy and accelerate the transformation and upgrading of companies.

Author Contributions

Conceptualization, S.C.; Methodology, X.H.; Software, X.H.; Formal analysis, S.C.; Investigation, S.C., B.N. and X.H.; Writing—original draft, B.N. and X.H.; Writing—review & editing, S.C.; Supervision, S.C.; Funding acquisition, S.C. All authors have read and agreed to the published version of the manuscript.

Funding

This research was funded by the National Office of Philosophy and Social Sciences (Grant No. 20BTJ022).

Institutional Review Board Statement

Not applicable.

Informed Consent Statement

Not applicable.

Data Availability Statement

Data sharing is not applicable to this article.

Conflicts of Interest

The authors declare no conflict of interest.

References

  1. Liao, Y.; Qiu, X.; Wu, A.; Sun, Q.; Shen, H.; Li, P. Assessing the impact of green innovation on corporate sustainable development. Front. Energy Res. 2022, 9, 800848. [Google Scholar] [CrossRef]
  2. Demir, F. Financial liberalization, private investment and portfolio choice: Financialization of real sectors in emerging markets. J. Dev. Econ. 2009, 88, 314–324. [Google Scholar] [CrossRef]
  3. Gong, C.M.; Gong, P.; Jiang, M. Corporate financialization and investment efficiency: Evidence from China. Pac. Basin Financ. J. 2023, 79, 102045. [Google Scholar] [CrossRef]
  4. Jin, X.M.; Mai, Y.; Cheung, A.W.K. Corporate financialization and fixed investment rate: Evidence from China. Financ. Res. Lett. 2022, 48, 102898. [Google Scholar] [CrossRef]
  5. Yu, W.; Zhan, Q.; Ameer, W.; Li, L.; Tarczyński, W.; Mentel, U. Effects of Heterogeneity of Financialization on Firm Innovation: Evidence in Context of Energy Transition in Lens of Research and Development. Front. Energy Res. 2022, 10, 930974. [Google Scholar] [CrossRef]
  6. Xie, Z.; Du, J.; Wu, Y. Does financialization of non-financial corporations promote the persistence of innovation: Evidence from A-share listed manufacturing corporations in China. Eurasian Bus. Rev. 2022, 12, 229–250. [Google Scholar] [CrossRef]
  7. Liu, L.; He, J. Does financialization affect firm’R&D investment? Evidence from China. Financ. Res. Lett. 2023, 58, 104311. [Google Scholar]
  8. Lin, Z.; Li, S. Financialization, Earnings Management and Investment Efficiency. In Proceedings of the Fourteenth International Conference on Management Science and Engineering Management: Volume 1, Chisinau, Moldova, 30 July–2 August 2020; Springer International Publishing: Berlin/Heidelberg, Germany, 2020; pp. 130–141. [Google Scholar]
  9. Wang, H.; Wang, Q.; Sheng, X. Does corporate financialization have a non-linear impact on sustainable total factor productivity? Perspectives of cash holdings and technical innovation. Sustainability 2021, 13, 2533. [Google Scholar] [CrossRef]
  10. Lyu, Y.; Zhang, J.; Qing, X.; Bai, Y. The influence of non-financial enterprises’ financialization on total factor productivity of enterprises: Promotion or inhibition? Int. J. Financ. Econ. 2023, 1, 15. [Google Scholar] [CrossRef]
  11. Tori, D.; Onaran, Ö. Financialization, financial development and investment. Evidence from European non-financial corporations. Soc. Econ. Rev. 2020, 18, 681–718. [Google Scholar] [CrossRef]
  12. Leng, T.; Liu, Y.; Xiao, Y.; Hou, C. Does firm financialization affect optimal real investment decisions? Evidence from China. Pac. Basin Financ. J. 2023, 79, 101970. [Google Scholar] [CrossRef]
  13. Xu, S.; Guo, L. Financialization and corporate performance in China: Promotion or inhibition? Abacus 2023, 59, 776–817. [Google Scholar] [CrossRef]
  14. Deng, M.; Fang, X.; Lyu, Q.; Luo, W. How does corporate financialization affect operational risk? Evidence from Chinese listed companies. Econ. Res. Ekon. Istraživanja 2023, 1–21. [Google Scholar] [CrossRef]
  15. Zhang, S.; Yin, X.; Xu, L.; Li, Z.; Kong, D. Effect of environmental, social, and governance performance on corporate financialization: Evidence from China. Sustainability 2022, 14, 10712. [Google Scholar] [CrossRef]
  16. Zhu, G.P.; Gui, H.F.; Peng, T.; Jiang, C.H. Corporate tax avoidance and corporate financialization: The moderating effect of managerial myopia. Manag. Decis. Econ. 2023, 44, 459–472. [Google Scholar] [CrossRef]
  17. Cupertino, S.; Consolandi, C.; Vercelli, A. Corporate social performance, financialization, and real investment in US manufacturing firms. Sustainability 2019, 11, 1836. [Google Scholar] [CrossRef]
  18. Orhangazi, Ö. Financialisation and capital accumulation in the non-financial corporate sector: A theoretical and empirical investigation on the US economy: 1973–2003. Camb. Econ. 2008, 32, 863–886. [Google Scholar] [CrossRef]
  19. Xu, X.; Xuan, C. A study on the motivation of financialization in emerging markets: The case of Chinese nonfinancial corporations. Int. Rev. Econ. Financ. 2021, 72, 606–623. [Google Scholar] [CrossRef]
  20. Haans, R.F.J.; Pieters, C.; He, Z.L. Thinking about U: Theorizing and testing U-and inverted U-shaped relationships in strategy research. Strateg. Manag. J. 2016, 37, 1177–1195. [Google Scholar] [CrossRef]
  21. Higgins, R.C. Sustainable growth under inflation. Financ. Manag. 1981, 10, 36–40. [Google Scholar] [CrossRef]
  22. Schmidheiny, S. Changing Course: A Global Business Perspective on Development and the Environment; MIT Press: Cambridge, MA, USA, 1992. [Google Scholar]
  23. Dyllick, T.; Hockerts, K. Beyond the business case for corporate sustainability. Bus. Strategy Environ. 2002, 11, 130–141. [Google Scholar] [CrossRef]
  24. Gao, P.; Wang, X.; Wang, H.; Cheng, C. A correction to the entropy weight coefficient method by Shen et al. for accessing urban sustainability [Cities 42 (2015) 186–194]. Cities 2020, 103, 102742. [Google Scholar] [CrossRef]
  25. Rehman, M.H.; Chang, V.; Batool, A.; Wah, T.Y. Big data reduction framework for value creation in sustainable enterprises. Int. J. Inf. Manag. 2016, 36, 917–928. [Google Scholar] [CrossRef]
  26. Anbarasan, P.; Sushil. Stakeholder engagement in sustainable enterprise: Evolving a conceptual framework, and a case study of ITC. Bus. Strategy Environ. 2018, 27, 282–299. [Google Scholar] [CrossRef]
  27. Boscoianu, M.; Prelipcean, G.; Lupan, M. Innovation enterprise as a vehicle for sustainable development–A general framework for the design of typical strategies based on enterprise systems engineering, dynamic capabilities, and option thinking. J. Clea. Produ. 2018, 172, 3498–3507. [Google Scholar] [CrossRef]
  28. Wu, L.; Qing, C.; Jin, S. Environmental protection and sustainable development of enterprises in China: The moderating role of media attention. Front. Environ. Sci. 2022, 10, 966479. [Google Scholar] [CrossRef]
  29. Li, S.; Gao, D.; Hui, X. Corporate governance, agency costs, and corporate sustainable development: A mediating effect analysis. Discret. Dyn. Nat. Soc. 2021, 2021, 5558175. [Google Scholar] [CrossRef]
  30. Wang, J.; Mao, N. Does financialization of non-financial corporations promote or prohibit corporate risk-taking? Emerg. Mark. Financ. Trade 2022, 58, 1913–1924. [Google Scholar] [CrossRef]
  31. Baud, C.; Durand, C. Financialization, globalization and the making of profits by leading retailers. Socio-Econ. Rev. 2012, 10, 241–266. [Google Scholar] [CrossRef]
  32. Xu, M.; Albitar, K.; Li, Z. Does corporate financialization affect EVA? Early evidence from China. Green Financ. 2020, 2, 392–408. [Google Scholar] [CrossRef]
  33. Arcand, J.L.; Berkes, E.; Panizza, U. Too much finance? J. Econ. Growth 2015, 20, 105–148. [Google Scholar] [CrossRef]
  34. Tori, D.; Onaran, O. The effects of financialization on investment: Evidence from firm-level data for the UK. Camb. J. Econ. 2018, 42, 1393–1416. [Google Scholar] [CrossRef]
  35. Clarke, T. The impact of financialisation on international corporate governance: The role of agency theory and maximising shareholder value. Law Financ. Mark. Rev. 2014, 8, 39–51. [Google Scholar] [CrossRef]
  36. Su, K.; Liu, H. Financialization of manufacturing companies and corporate innovation: Lessons from an emerging economy. Manag. Decis. Econ. 2021, 42, 863–875. [Google Scholar] [CrossRef]
  37. Wang, J.; Zhu, Z.; Huang, X. Stock bubbles under sudden public crises: A perspective from the excessive financialization of firms. Financ. Res. Lett. 2023, 57, 104189. [Google Scholar] [CrossRef]
  38. Yan, X.; Wang, X.; Liu, S. A U-shaped relationship between real financialization and financial risk: Evidence from a single threshold model. Financ. Res. Lett. 2023, 56, 104017. [Google Scholar] [CrossRef]
  39. Ayyagari, M.; Demirgüç-Kunt, A.; Maksimovic, V. How important are financing constraints? The role of finance in the business environment. World Bank Econ. Rev. 2008, 22, 483–516. [Google Scholar] [CrossRef]
  40. Campello, M.; Graham, J.R.; Harvey, C.R. The real effects of financial constraints: Evidence from a financial crisis. J. Financ. Econ. 2010, 97, 470–487. [Google Scholar] [CrossRef]
  41. Deng, L.; Zhao, Y. Investment lag, financially constraints and company value—Evidence from China. Emerg. Mark. Financ. Trade 2022, 58, 3034–3047. [Google Scholar] [CrossRef]
  42. Tadesse, S. Financial architecture and economic performance: International evidence. J. Financ. Intermediation 2002, 11, 429–454. [Google Scholar] [CrossRef]
  43. Aalbers, M. The Financialization of Home and the Mortgage Market Crisis. Compet. Change 2008, 12, 148–166. [Google Scholar]
  44. Han, X.; Hsu, S.; Li, J.; An, R. Economic policy uncertainty, non-financial enterprises’ shadow banking activities and stock price crash risk. Emerg. Mark. Rev. 2023, 54, 101003. [Google Scholar] [CrossRef]
  45. Tao, L.; Chen, L.; Li, K. Corporate financialization, financing constraints, and environmental investment. Sustainability 2021, 13, 14040. [Google Scholar] [CrossRef]
  46. Broome, T.; Moore, W.; Alleyne, P. Financing constraints and the R&D decision in the Caribbean. Entrep. Reg. Dev. 2018, 30, 964–986. [Google Scholar]
  47. Haider, Z.A.; Liu, M.; Wang, Y.; Zhang, Y. Government ownership, financial constraint, corruption, and corporate performance: International evidence. J. Int. Financ. Mark. Inst. Money 2018, 53, 76–93. [Google Scholar] [CrossRef]
  48. Uzkurt, C.; Kumar, R.; Kimzan, H.S.; Sert, H. The impact of environmental uncertainty dimensions on organisational innovativeness: An empirical study on SMEs. Int. J. Innov. Manag. 2012, 16, 1–23. [Google Scholar] [CrossRef]
  49. Tversky, A.; Kahneman, D. Advances in prospect theory: Cumulative representation of uncertainty. J. Risk Uncertain. 1992, 5, 297–323. [Google Scholar] [CrossRef]
  50. Su, Z.; Xie, E.; Peng, J. Impacts of environmental uncertainty and firms’ capabilities on R&D investment: Evidence from China. Innovation 2010, 12, 269–282. [Google Scholar]
  51. Van Vo, L.; Le, H.T.T. Strategic growth option, uncertainty, and R&D investment. Int. Rev. Financ. Anal. 2017, 51, 16–24. [Google Scholar]
  52. Zhang, Y.; Zhuo, C.; Deng, F. Policy uncertainty, financialization and enterprise technological innovation: A way forward towards economic development. Front. Environ. Sci. 2022, 10, 905505. [Google Scholar] [CrossRef]
  53. Barraza, S.; Civelli, A. Economic policy uncertainty and the supply of business loans. J. Bank. Financ. 2020, 121, 105983. [Google Scholar] [CrossRef]
  54. Waisman, M.; Ye, P.; Zhu, Y. The effect of political uncertainty on the cost of corporate debt. J. Financ. Stab. 2015, 16, 106–117. [Google Scholar] [CrossRef]
  55. Younge, K.A.; Tong, T.W. Competitive pressure on the rate and scope of innovation. J. Econ. Behav. Organ. 2018, 150, 162–181. [Google Scholar] [CrossRef]
  56. Fonseka, M.M.; Ramos, C.G.; Tian, G. The most appropriate sustainable growth rate model for managers and researchers. J. Appl. Bus. Res. (JABR) 2012, 28, 481–500. [Google Scholar] [CrossRef]
  57. Wen, H.; Jiang, L. The challenges of maturity mismatch in investment and financing for sustainable development of carbon-intensive enterprises. Environ. Sci. Pollut. Res. 2023, 30, 99541–99560. [Google Scholar] [CrossRef] [PubMed]
  58. Zhang, C.; Zheng, N. Monetary policy and financial investments of nonfinancial firms: New evidence from China. China Econ. Rev. 2020, 60, 101420. [Google Scholar] [CrossRef]
  59. Gao, Y.; Wang, Z.; Wang, K.; Zhang, R.; Lu, Y. Effect of big data on enterprise financialization: Evidence from China’s SMEs. Technol. Soc. 2023, 75, 102351. [Google Scholar] [CrossRef]
  60. Kaplan, S.N.; Zingales, L. Do investment-cash flow sensitivities provide useful measures of financing constraints. Q. J. Econ. 1997, 112, 169–215. [Google Scholar] [CrossRef]
  61. Bai, X.; Han, J.; Ma, Y.; Zhang, W. ESG performance, institutional investors’ preference and financing constraints: Empirical evidence from China. Borsa Istanb. Rev. 2022, 22, S157–S168. [Google Scholar] [CrossRef]
  62. Ghosh, D.; Olsen, L. Environmental uncertainty and managers’ use of discretionary accruals. Account. Organ. Soc. 2009, 34, 188–205. [Google Scholar] [CrossRef]
  63. Li, K.; Xia, B.; Chen, Y.; Ding, N.; Wang, J. Environmental uncertainty, financing constraints and corporate investment: Evidence from China. Pac. Basin Financ. J. 2021, 70, 101665. [Google Scholar] [CrossRef]
  64. Lind, J.T.; Mehlum, H. With or without U? The appropriate test for a U-shaped relationship. Oxf. Bull. Econ. Stat. 2010, 72, 109–118. [Google Scholar] [CrossRef]
  65. Chen, Y.; Sun, R. Corporate financialization and the long-term use of short-term debt: Evidence from China. Finance Res. Lett. 2023, 58, 104602. [Google Scholar] [CrossRef]
  66. Lewbel, A. Constructing instruments for regressions with measurement error when no additional data are available, with an application to patents and R&D. Econometric 1997, 65, 1201–1213. [Google Scholar]
  67. Jin, G.; Yu, B.; Shen, K. Domestic trade and energy productivity in China: An inverted U-shaped relationship. Energy Econ. 2021, 97, 105234. [Google Scholar] [CrossRef]
  68. Zhao, Y.; Su, K. Economic policy uncertainty and corporate financialization: Evidence from China. Int. Rev. Financ. Anal. 2022, 82, 102182. [Google Scholar] [CrossRef]
  69. Yang, F.; Li, X. Corporate Financialization, ESG Performance and Sustainability Development: Evidence from Chinese-Listed Companies. Sustainability 2023, 15, 2978. [Google Scholar] [CrossRef]
  70. Zhang, Y.; Zhang, H.; Yang, L.; Xu, P. Managerial ownership and corporate financialization. Financ. Res. Lett. 2023, 58, 104682. [Google Scholar] [CrossRef]
Figure 1. Theoretical framework.
Sustainability 16 03402 g001
Figure 2. The moderating effect diagram of financing constraints.
Sustainability 16 03402 g002
Figure 3. The moderating effect diagram of environmental uncertainty.
Sustainability 16 03402 g003
Table 1. Definition of variables.
TypeNameSymbolDefinition
Dependent VariableSustainable Development AbilitySdaNet profit margin on sales × retention ratio × (1 + equity ratio) ÷ [1/turnover of total capital − net profit margin on sales × retention ratio × (1 + equity ratio)]
Independent VariableCorporate
Financialization
FinFinancial assets/total assets
Moderating VariablesFinancing
Constraint
FcDummy variable of financing
constraint degree
Environmental
Uncertainty
EuDummy variables of environmental uncertainty after industry adjustment
Control
Variables
Corporate SizeSizeLn (total assets)
Corporate AgeAgeLn (current year − establishment year + 1)
Corporate GrowthGrowthIncrease rate of main business revenue
Ownership
Concentration
ShrcrPercentage of shares held by the top
ten shareholders
Executive
Compensation
PaySum of top three executives’ compensation/total executive compensation
Asset–Liability
Ratio
LevTotal liabilities/total assets
Management
Expense Ratio
ExpenManagement expense/operating revenue
Table 2. Descriptive statistics of variables.
VariableNMeanSDMedianMinMax
Sda13,2780.07140.06480.0551−0.01770.3440
Fin13,2780.22700.14920.18710.02720.7239
Age13,2782.85320.37462.94441.60943.4657
Size13,27822.55841.319822.389620.208826.4828
Lev13,2780.42230.19210.42580.05050.8254
Shrcr13,27856.832515.319356.953123.676190.5819
Growth13,2780.17780.31440.1220−0.37991.8956
Expen13,2780.08190.05830.06880.00790.3206
Pay13,2780.46130.13420.44130.22830.8827
Table 3. Results of correlation analysis.
SdaFinAgeSizeLevGrowthExpenPayShrcrFcEu
Sda1
Fin0.021 **1
Age−0.023 ***−0.148 ***1
Size0.110 ***−0.283 ***0.256 ***1
Lev0.096 ***−0.411 ***0.222 ***0.526 ***1
Growth0.247 ***0.006−0.122 ***0.0010.036 ***1
Expen−0.114 ***0.231 ***−0.177 ***−0.393 ***−0.409 ***−0.066 ***1
Pay0.010.098 ***0.097 ***−0.158 ***−0.097 ***0.015 *−0.0091
Shrcr0.081 ***0.068 ***−0.245 ***0.224 ***−0.0070.104 ***−0.103 ***−0.030 ***1
Fc−0.068 ***−0.325 ***0.017 *0.089 ***0.495 ***−0.002−0.125 ***−0.048 ***−0.084 ***1
Eu0.00010.097 ***−0.156 ***−0.089 ***−0.071 ***0.217 ***0.048 ***0.040 ***0.103 ***0.023 ***1
Note: ***, **, and * represent 1%, 5%, and 10% significance levels, respectively.
Table 4. Baseline results.
(1)(2)(3)
SdaSdaSda
Fin0.1195 ***0.1243 ***0.1393 ***
(5.1587)(5.4941)(7.2871)
Fin2−0.1735 ***−0.2105 ***−0.1998 ***
(−5.2530)(−6.5439)(−6.7804)
Age 0.008664 **
(2.0172)
Size 0.008158 ***
(5.9861)
Lev 0.008474
(0.8600)
Growth 0.04369 ***
(12.9853)
Expen −0.07555 ***
(−3.3865)
Pay 0.01655 *
(1.8055)
Shrcr 0.00009516
(1.3761)
YearNoYesYes
IndustryNoYesYes
_cons0.05705 ***0.05870 ***−0.1725 ***
(19.1159)(19.4679)(−4.8227)
N13,27813,27813,278
R20.0064630.075480.1568
Note: ***, **, and * represent 1%, 5%, and 10% significance levels, respectively.
Table 5. Robustness test.
(1)(2)(3)(4)(5)(6)
TFP_LPSdaSdaSdaSdaSda
Fin1 0.1524 ***
(8.3886)
Fin12 −0.2245 ***
(−7.3702)
Fin1.9472 *** 0.1450 ***0.1181 ***
(11.5945) (5.0103)(6.4710)
Fin2−2.4304 *** −0.2153 ***−0.1390 ***
(−7.2129) (−4.3985)(−4.6020)
L.Fin 0.1140 ***0.1123 ***
(5.6932)(5.5864)
L.Fin2 −0.1585 ***−0.1478 ***
(−5.3447)(−5.0045)
Control
Variables
YesYesYesYesYesYes
YearYesYesYesYesYesYes
IndustryYesYesYesYesYesYes
_cons−4.3418 ***−0.1728 ***−0.2248 ***−0.1804 ***−0.1878 ***−0.1250 ***
(−10.8613)(−4.8757)(−5.1317)(−5.7715)(−5.3377)(−3.6217)
N13,00513,278846310,96011,52911,529
R20.82350.15800.16140.14880.15430.1261
Note: *** represents 1% significance levels.
Table 6. Instrumental variable regressions results.
(1)(2)(3)(4)(5)(6)
FinFin2F.SdaFinFin2F.Sda
IV1, the first stagethe second stageIV2, the first stagethe second stage
Fin 0.6661 ** 0.1394 ***
(1.98) (6.55)
Fin2 −0.9987 * −0.1800 ***
(−1.91) (−6.63)
IV1−18.37 ***−12.005 *** 14.447 ***9.059 ***
(−4.13)(−4.77) (101.50)(154.80)
IV20.3392 ***0.1794 *** −93.936 ***−47.344 ***
(8.37)(6.87) (−71.88)(−88.15)
Control
Variables
YesYesYesYesYesYes
YearYesYesYesYesYesYes
IndustryYesYesYesYesYesYes
N12,11412,11412,11412,11412,11412,114
F-statistics19.6219.4860.143190.623836.7372.88
Note: ***, **, and * represent 1%, 5%, and 10% significance levels, respectively.
Table 7. Moderating effect regression results.
(1)(2)
SdaSda
Fin0.05959 *0.09315 ***
(1.8865)(3.4749)
Fin2−0.09167 **−0.08526 *
(−2.1724)(−1.8180)
Fin × Fc0.06678 *
(1.7375)
Fin2 × Fc−0.1156 **
(−2.4029)
Fc−0.01684 ***
(−6.0913)
Fin × Eu 0.05219 *
(1.9147)
Fin2 × Eu −0.1370 ***
(−2.6557)
Eu −0.006741 ***
(−4.1594)
Control
Variables
YesYes
YearYesYes
IndustryYesYes
N13,27813,278
R20.16750.1603
Note: ***, **, and * represent 1%, 5%, and 10% significance levels, respectively.
Table 8. Empirical results of the reservoir effect.
(1)(2)(3)
SdaCashSda
Cash 0.3274 ***
(13.2817)
Fin0.1393 ***0.03970 ***0.1146 ***
(7.2871)(3.6530)(6.6053)
Fin2−0.1998 *** −0.1811 ***
(−6.7804) (−6.9767)
Control
Variables
YesYesYes
YearYesYesYes
IndustryYesYesYes
_cons−0.1725 ***−0.0931 ***−0.1406 ***
(−4.8227)(−3.0330)(−4.3742)
N13,27813,27813,278
R20.15680.15650.2428
Note: *** represents 1% significance levels.
Table 9. Empirical results of the short-term wealth effect.
(1)(2)(3)
SdaMainSda
Main −0.01541 ***
(−15.1021)
Fin0.1393 ***0.1770 **0.1435 ***
(7.2871)(2.0230)(7.8882)
Fin2−0.1998 *** −0.2021 ***
(−6.7804) (−7.0539)
Control
Variables
YesYesYes
YearYesYesYes
IndustryYesYesYes
_cons−0.1725 ***−0.2001−0.1757 ***
(−4.8227)(−0.9279)(−5.0216)
N13,27813,27813,278
R20.15680.082370.1760
Note: ***, ** represent 1%, and 5% significance levels, respectively.
Table 10. Empirical results of different term structures.
(1)(2)
SdaSda
SFin0.1603 ***
(7.9224)
SFin2−0.2422 ***
(−6.7947)
LFin 0.004137
(0.0915)
LFin2 −0.06461
(−0.3951)
Control
Variables
YesYes
YearYesYes
IndustryYesYes
_cons−0.1743 ***−0.1551 ***
(−4.9279)(−3.9800)
N13,27813,278
R20.15910.1495
Note: *** represents 1% significance levels.
Disclaimer/Publisher’s Note: The statements, opinions and data contained in all publications are solely those of the individual author(s) and contributor(s) and not of MDPI and/or the editor(s). MDPI and/or the editor(s) disclaim responsibility for any injury to people or property resulting from any ideas, methods, instructions or products referred to in the content.

