Abstract
Utilizing renewable energy sources (RESs), such as wind and solar, to convert electrical energy into hydrogen energy can promote the accommodation of green electricity. This paper proposes an optimal capacity planning approach for an industrial electricity-hydrogen multi-energy system (EHMES) aimed to achieve the local utilization of RES and facilitate the transition to carbon reduction in industrial settings. The proposed approach models the EHMES equipment in detail and divides the system’s investment and operation into producer and consumer sides with energy trading for effective integration. Through this effort, the specialized management for different operators and seamless incorporation of RES into industrial users can be achieved. In addition, the variations in investment and operating costs of equipment across different installed capacities are considered to ensure a practical alignment with real-world scenarios. By conducting a detailed case study, the influence of various factors on the capacity configuration outcomes within an EHMES is analyzed. The results demonstrate that the proposed method can effectively address the capacity configuration of equipment within EHMES based on the local accommodation of RES and variable unit cost sequence. Wind power serves as the primary source of green electricity in the system. Energy storage acts as crucial equipment for enhancing the utilization rate of RES.
1. Introduction
Following the adoption of the Paris Climate Agreement and the global commitment to achieving carbon neutrality, the transition towards renewable energy has become crucial around the world [1,2]. Driven by the imperatives of mitigating climate change and ensuring energy security, the integration of renewable energy sources (RESs), such as wind and solar power, has been widely recognized as a key strategy in addressing low carbon and sustainable development [3]. As a result, the installed capacity of RES has seen a significant increase worldwide.
However, the inherent variability and uncertainty associated with RES pose substantial challenges to their integration, primarily due to their mismatch with consumption patterns and the inflexibility of their controllability [4]. The efficient accommodation of intermittent RES necessitates innovative solutions to enhance their utilization and mitigate the risks associated with their unpredictability. One promising approach is the utilization of hydrogen energy as a medium for storing and utilizing excess renewable energy [5]. By converting surplus green electricity from RES into hydrogen, the electrical power can be stored for long periods. Meanwhile, hydrogen can be used across a wide range of applications [6].
Industrial users account for substantial energy usage, positioning them as a pivotal sector for carbon emission [7]. The application of hydrogen energy by industrial users offers an ideal solution for promoting the clean and efficient substitution of traditional fossil fuels with green electricity [8]. In the industrial landscape, there exists a significant demand for both electricity and hydrogen energy. For example, hydrogen can be used to coke in the reduction of iron ore to iron [9] or produce cleaner fuel products [10]. A RES-based energy community represents a promising approach to reducing complexity and costs, improving efficiency, and boosting local resilience [11]. It supports energy independence, thereby facilitating the transition towards reduced carbon emissions. Due to the concentrated load characteristics, industrial users are a natural application object for local energy communities with RES. Existing research has demonstrated the effectiveness of industrial energy communities, ranging from theoretical frameworks to applied validations [12]. In this context, the industrial electricity-hydrogen multi-energy system (EHMES) based on hydrogen production through electrolysis using RESs can achieve coordination between electricity and hydrogen [13].
EHMES offers numerous benefits, including facilitating the accommodation of RESs, reducing carbon emissions, and enhancing the overall sustainability of energy consumption [14]. Investigating the capacity configuration issue of EHMES for industrial users becomes a critical factor for system efficiency and economic viability. In [15], a two-stage stochastic mixed-integer nonlinear planning framework for power to hydrogen sizing and siting is proposed, considering system flexibility requirements. In [16], an optimal planning approach for an electricity-hydrogen-integrated energy system, considering degradation and multi-timescale operations of storage devices, is proposed to minimize the life cycle costs. In [17], an industrial park-integrated energy system with a hydrogen energy industry chain is proposed, considering hydrogen production, transportation, and storage technologies. In [18], a novel bi-level planning model of the electricity-hydrogen hybrid energy storage system is proposed, considering the energy storage location, voltage fluctuation, and net load fluctuation.
For large-scale industrial EHMES such as metallurgy and refining, the capacity of RESs within the system is often substantial [9,19], leading to the potential generation of considerable surplus electricity. Unlike distributed renewable sources or pre-planned large-scale renewable energy plants, the excess substantial electricity generated within an EHMES may pose challenges for accommodation by the main power grid [20]. In the existing references on the integrated electricity-hydrogen system planning mentioned above, there is a lack of focus on local accommodation of this surplus RESs power in the industrial EHMES planning. Moreover, as the installed capacity of RESs and energy storage for industrial applications varies widely, their unit investment and operating costs may fluctuate with changes in capacity [21,22,23]. This scenario underscores the need for innovative planning approaches that not only address the efficient local utilization of surplus renewable energy but also consider the cost implications of varying renewable energy capacities within an industrial EHMES framework.
To address the gaps mentioned above, this paper proposes an optimal capacity planning approach for industrial EHMES to facilitate the local accommodation of RES and enable the substitution of green electricity for industrial users. The equipment within the EHMES is modeled in detail. The investment and operation of EHMES are divided into producer and consumer sides, with energy trading for coordination. This approach allows for specialized management and the seamless incorporation of RES into industrial settings. Additionally, the model takes into account the variation in investment and operating costs of each device within the system at different installed capacities, ensuring a closer alignment with real-world applications. Through a case study, the impact of various factors on capacity configuration results of a test EHMES is analyzed, which provides a reference for the actual implementation of green electricity into industrial EHMES.
2. System Overview
2.1. Basic Framework
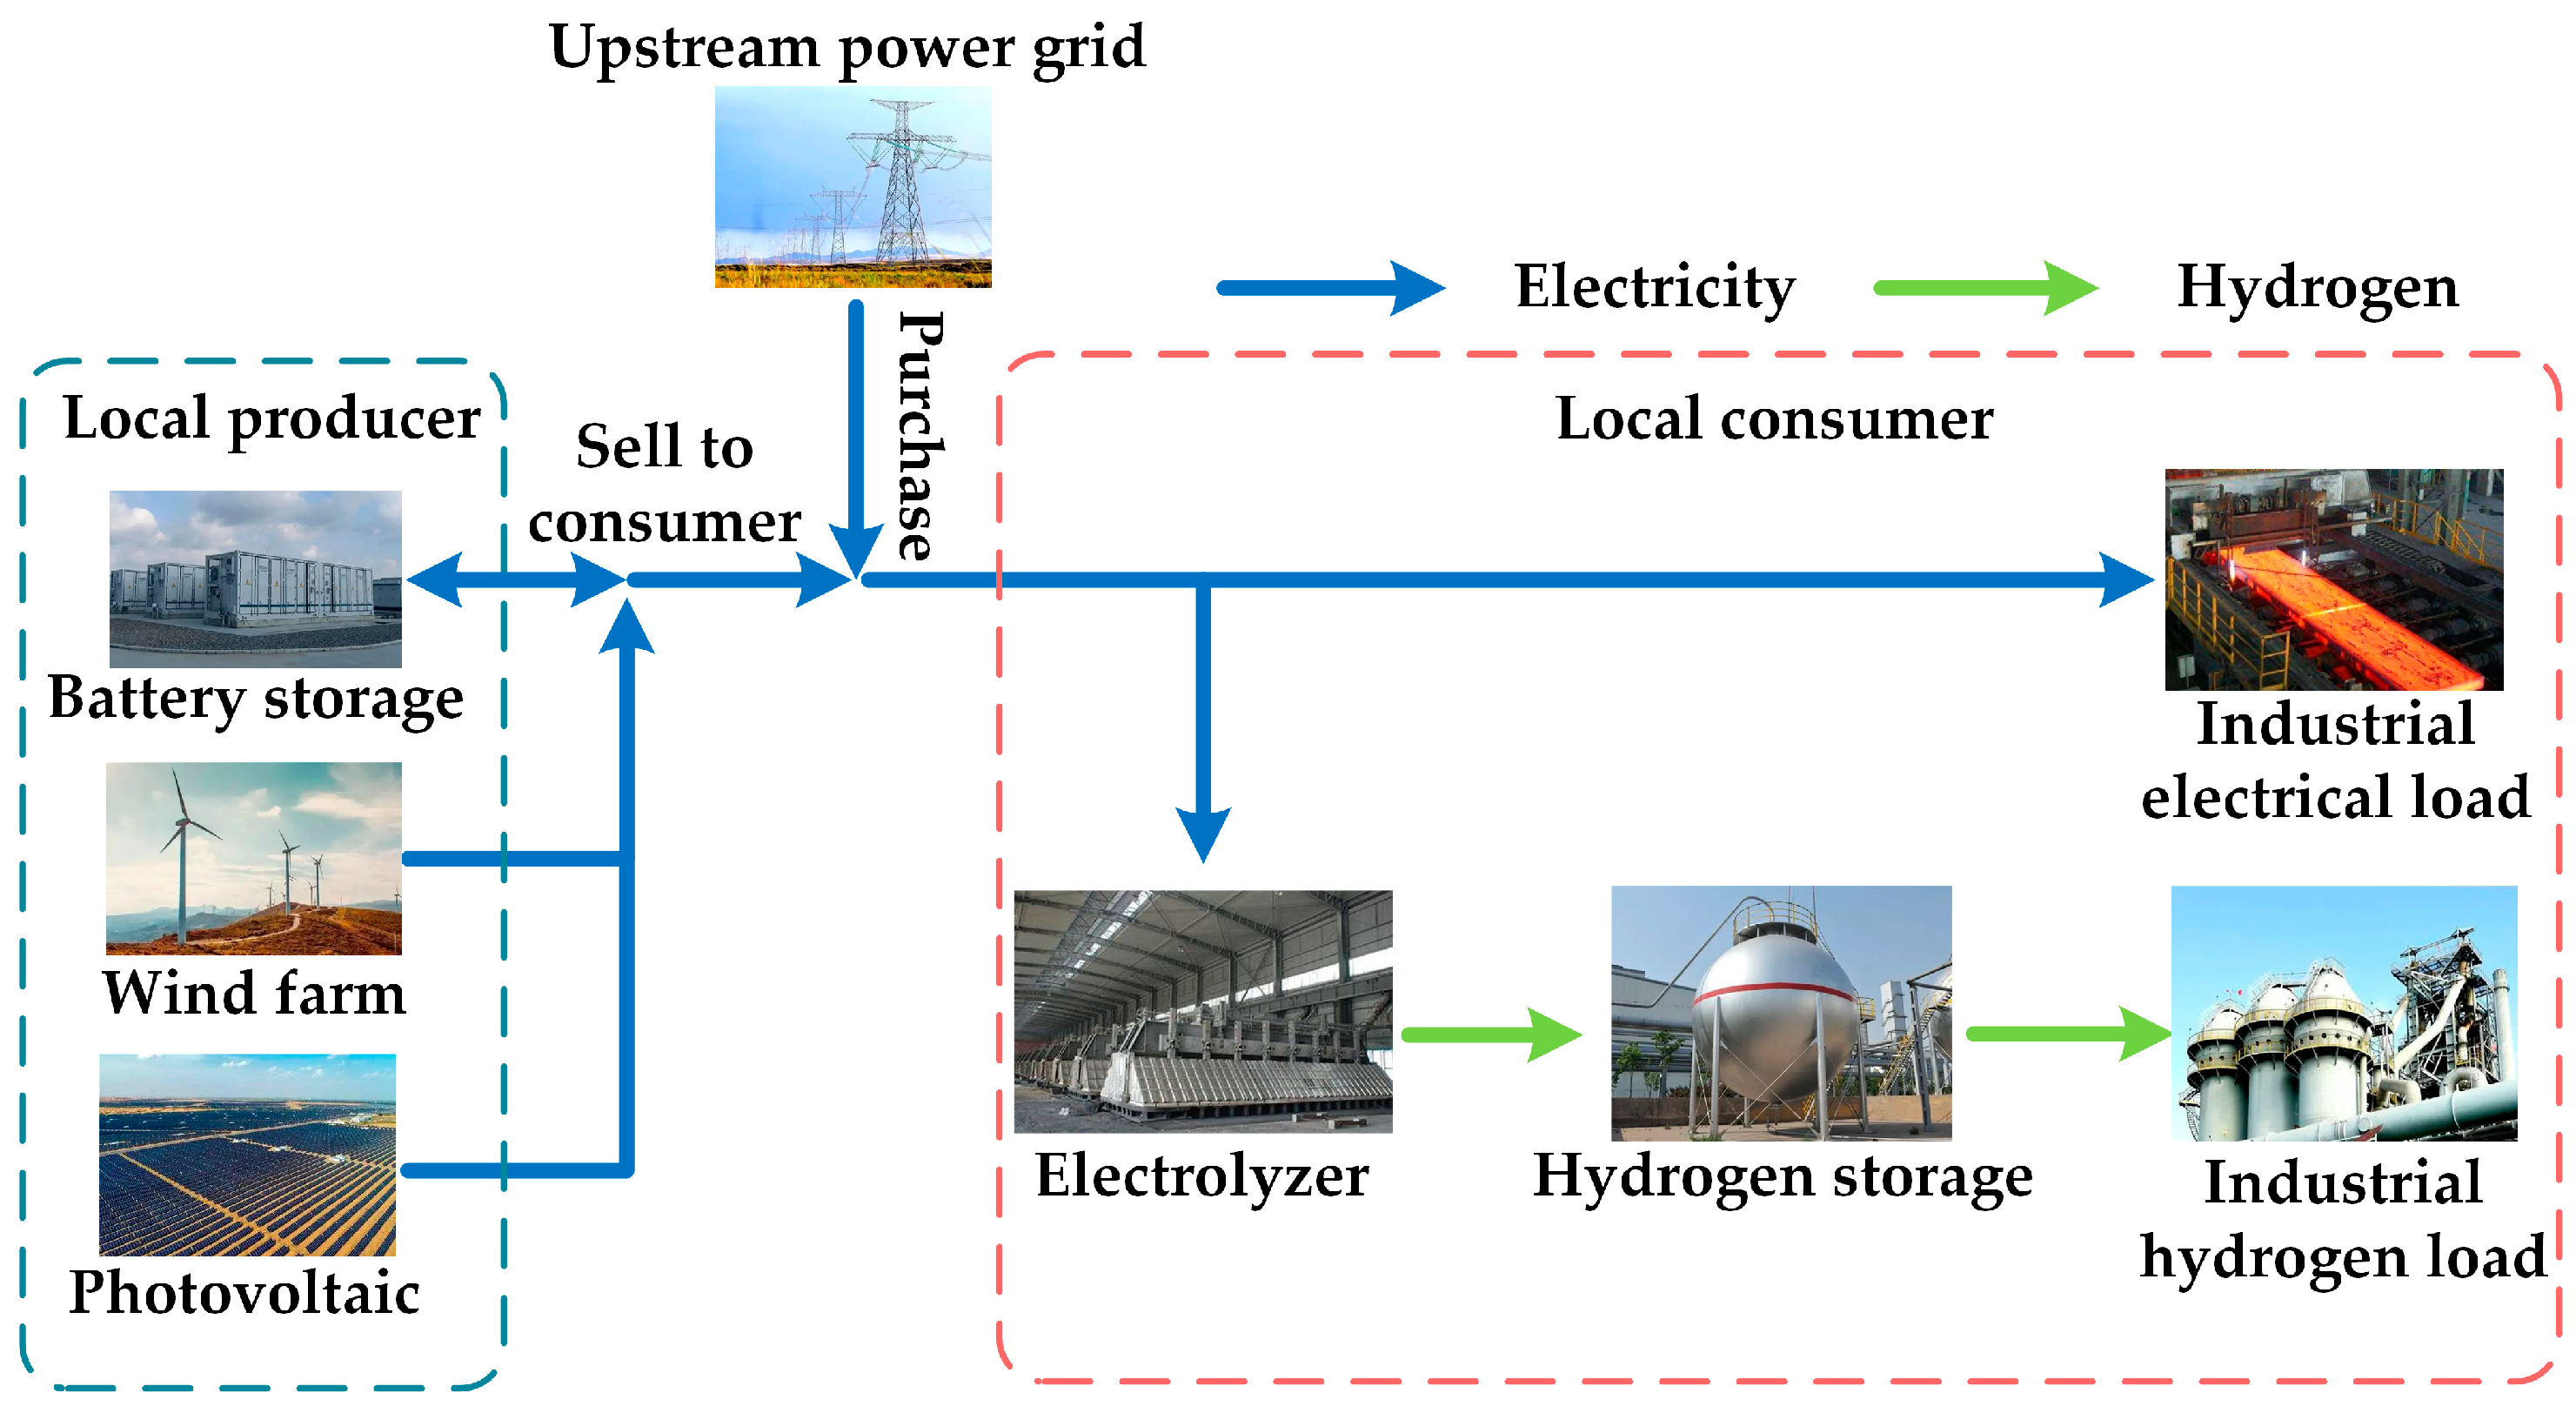
The EHMES studied in this paper mainly focuses on large-scale industrial electro-hydrogen consumers, such as steel or refining plants. This formulation of EHMES is already seeing practical application [24,25]. Such systems are located in non-residential areas abundant with wind and solar RESs. These settings are characterized by a dominance of industrial electricity and hydrogen demands, with only a minimal proportion of office or living loads included [26]. The primary objective is to substitute green electricity for fossil fuels, reducing both fossil energy consumption and electricity purchases from the grid, thereby achieving efficient renewable utilization and low-carbon, economical operation. The main structure of the EHMES is illustrated in Figure 1. The energy demands of large industrial electro-hydrogen consumers within the system encompass both electricity and hydrogen. The electricity system includes wind turbines (WTs), photovoltaics (PVs), and battery storage (BS), all of which are constructed in close proximity to the user for enhanced accessibility. Additionally, the system connects to the upstream power grid, while the hydrogen system comprises electrolyzer and hydrogen storage facilities. Within the electricity system, the electrical loads of consumers and the hydrogen production requirements of the electrolyzer are met through wind and solar power generation, along with grid electricity purchases based on time-of-use (TOU) prices [27]. The TOU price typically features higher rates during peak electricity consumption periods and lower rates during off-peak times. The BS is mainly responsible for balancing fluctuations in RES generation and promoting the utilization of RES. The BS is intentionally configured to avoid charging or discharging electricity to or from the upstream power grid, instead dedicating its function entirely to supporting local energy substitution within the system. In the hydrogen energy system, all hydrogen is produced through the electrolyzer. The produced hydrogen is stored in hydrogen storage; hydrogen storage can store hydrogen within permitted limits and supply hydrogen to meet the demands of the hydrogen load. Advanced communication technologies [28] along with sophisticated industrial control systems [29] are responsible for facilitating the collection, interaction, and scheduling of information among devices within the producer and consumer segments.

Figure 1.
Diagram of the studied industrial electricity-hydrogen multi-energy system.
2.2. Operation Mode
In this paper, the planning and operation of the EHMES are divided into the local producer side and the local consumer side. The equipment on the producer side is invested and operated by power supply enterprises, encompassing WT, PV, and BS. These components are responsible for generating electricity using RESs with the help of BS to reduce curtailment. All electricity power generated from producers is directly supplied and sold to industrial users, with no capability for transmission to the upstream power grid. On the consumer side (i.e., industrial users), the equipment includes the electrolyzer and hydrogen storage, which are invested and operated by industrial users with both electric and hydrogen loads. The consumer side schedules its electrolyzer and hydrogen storage and optimizes the electricity power purchases from the local prosumer and upstream power grid based on the electricity generation information from the producer side, as well as its equipment status, electricity, and hydrogen loads. This approach aims to ultimately achieve a balance between supply and demand within the EHMES and ensure the economic operation.
The operation mode described above facilitates the integration of RES developers and operators into existing industrial users more seamlessly. On one hand, investors in the power supply enterprise only need to focus on the investment. This allows them to directly sell electricity to users on-site, thereby realizing returns more efficiently. On the other hand, the consumer side needs only to invest in and operate equipment according to their own electricity and hydrogen demands, without the necessity for substantial investments in power sources to achieve the substitution with green electricity. This operation model disperses the investment costs of EHMES, while operations and investments by both producers and consumers become more specialized, making it more aligned with practical application scenarios.
3. Modeling of the Industrial Electricity-Hydrogen Multi-Energy System Planning
In this section, the optimal planning model for industrial EHMES planning considering variable investment and operating costs for RESs and BS, as well as energy trading between the local consumer and prosumer, is established. The proposed model is based on the annual RES outputs and energy demand data, with specific objectives for both consumer and prosumer. To more accurately capture the investment and operating costs of WT, PV, and BS, which can vary greatly in planned capacity, this paper adopts a sequence of variable unit investment and operating costs to replace the traditional fixed-cost approach for modeling. The equipment model is given in detail. To facilitate the solution process, the Big-M method is employed to relax the constraints.
3.1. Objective Function
As mentioned above, the EHMES is segmented into producer and consumer sides. The producer side is responsible for investing in and maintaining WT, PV, BS and subsequently selling electricity power to the consumer side based on the local wind and solar resources. Conversely, the consumer side is responsible for investing in electrolyzer and hydrogen storage equipment according to the electricity and hydrogen demands. This paper establishes the objective functions for both the producer and consumer sides separately.
3.1.1. Objective of Producer
For the producer in EHMES, the objective is to maximize the total revenue from electric power trading while reducing the variable investment and operating costs of its equipment. The objective function for the consumer side is formulated as follows:
where represents a time step, and is the time interval between two adjacent time steps (h). is the total number of time steps. represents the energy trading price agreed upon between the producer and consumer sides (CNY/MWh) [30], and is the trading power (MW).
In (5), is the total investment cost of the producer
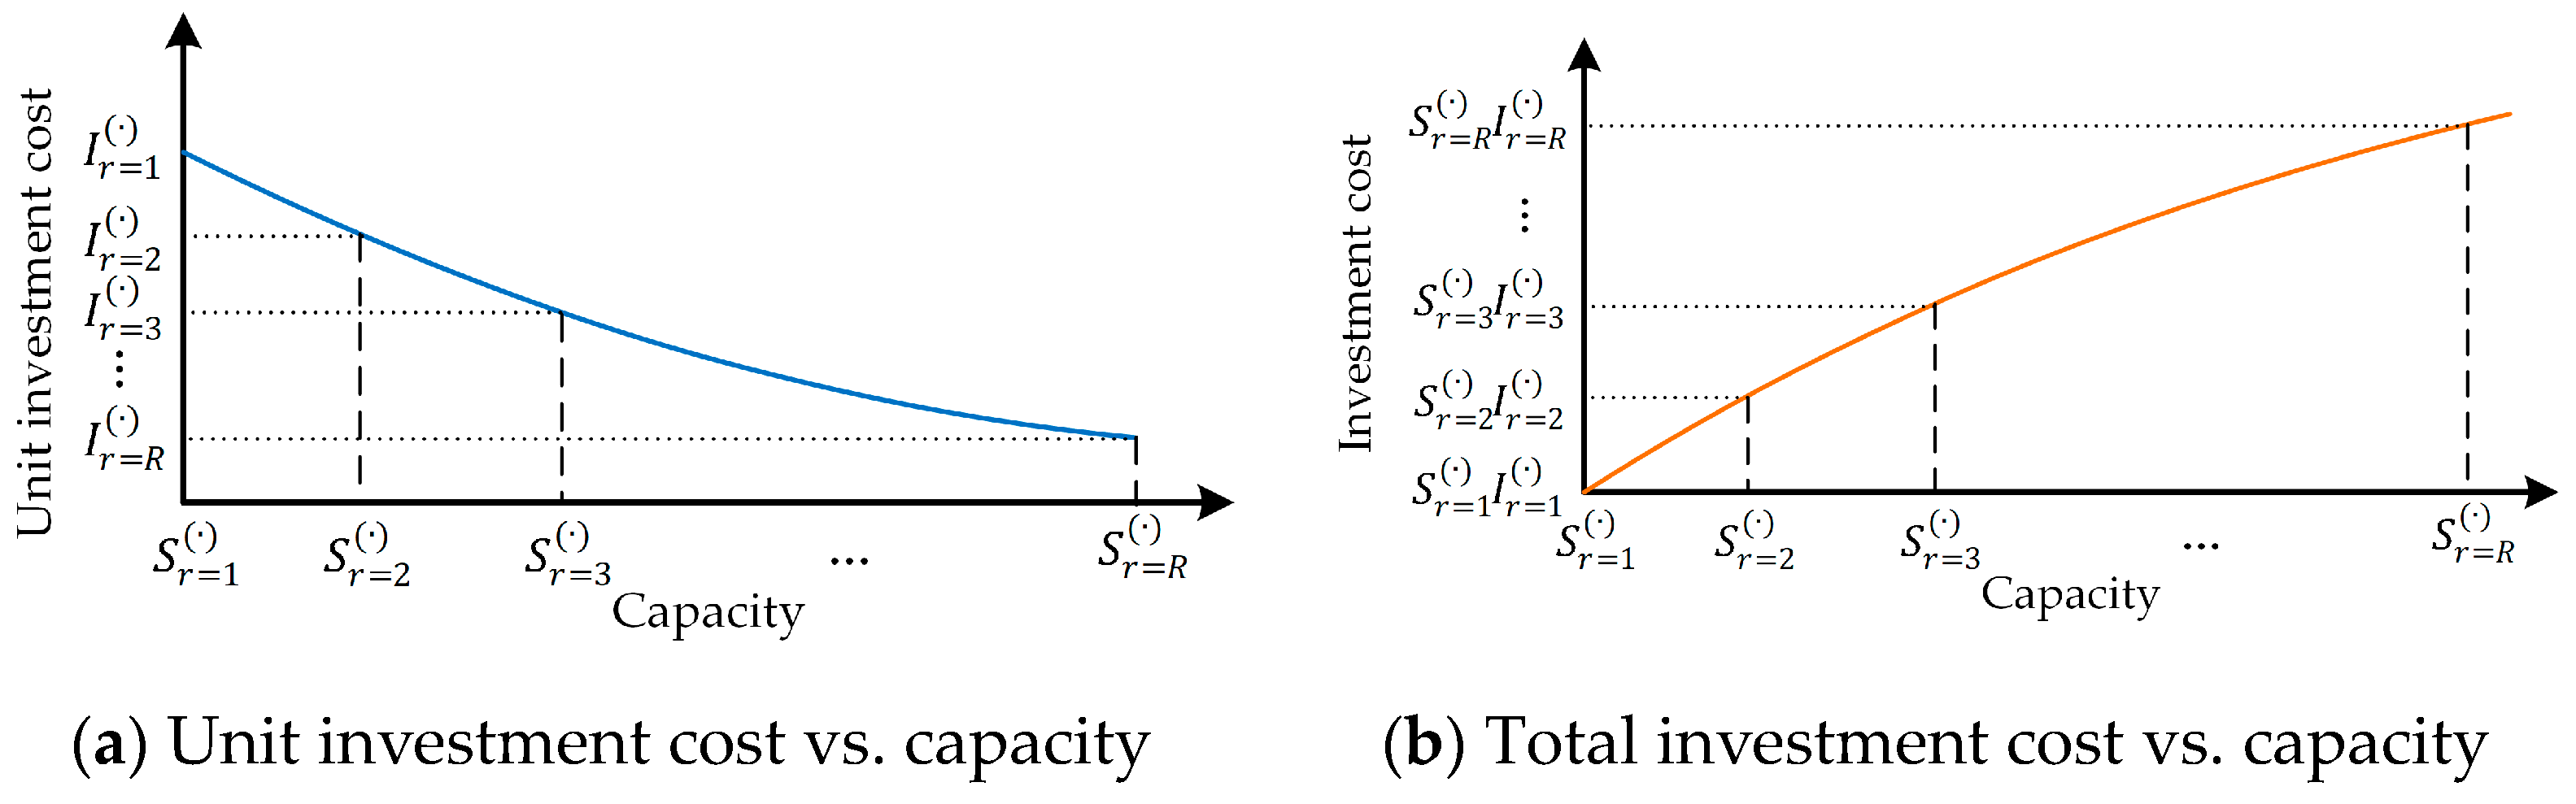
where is the annual interest rate for investment. In this paper, the investment of equipment is considered as a one-time cost, . , , and are the service life of WT, PV, and BS with unit “year”, respectively. and are the installation capacity of WT and PV with unit MW. and are the installation capacity of the battery (MWh) and power converter system (MW) of BS. , , , and are the investment cost functions with unit CNY. These investment cost functions can be represented by the capacities of WT, PV, battery, and power converter system of BS, along with their corresponding variable unit capacity investment costs under different capacities , , , and . Generally, the larger the capacity, the lower the unit capacity investment cost, as illustrated in Figure 2a. Based on the above, in this paper, additional piecewise functions are utilized to express the final investment cost functions, as shown in Figure 2b. Take WT as an example, by dividing the investment cost functions into different capacity range segments with index , the can be expressed as
where and are the capacity (MW) and corresponding unit capacity investment cost (CNY/MW) of the start value for each segment , where , as shown in Figure 2. is the installation capacity that needs to be solved through optimization. Similarly, the investment cost functions for PV, battery, and power converter system of BS can be formulated in the same manner with unit capacity investment cost (CNY/MW) , , and with , , and segments with indices , , and .
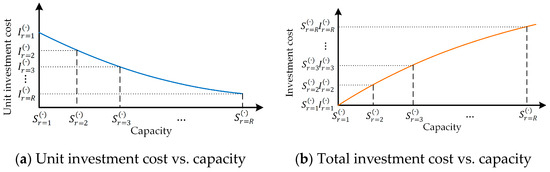
Figure 2.
Equipment investment cost function considering variable unit investment cost under different capacities.
is the total operating cost of the producer
where , , , and are the operating cost functions of WT, PV, battery, and the power converter system of BS, which are represented by the installation capacities (MW) that need to be optimized with corresponding variable unit operating costs (CNY/MW). The characteristics and formulation of these operating cost functions are similar to those of the investment cost functions, requiring only the substitution of the unit capacity investment costs for WT, PV, battery, and power converter system of BS with their respective unit annualized capacity operating costs under different capacities , , , and . The indices , , , and denote the segments , , , and for linearization.
3.1.2. Objective of Consumer
For the consumer in EHMES, the objective is to minimize the costs associated with purchasing electricity, as well as the annualized investment and operating expenses for equipment. The objective function for the consumer side is outlined as follows:
In (1), is the annualized investment costs of the consumer
where is the installation capacity of the electrolyzer (MW), and is the installation capacity of hydrogen storage (kg). Similar to the equipment within the producer, and are the corresponding investment cost functions of the electrolyzer (CNY/MW) and hydrogen storage (CNY/kg) with corresponding unit investment costs under different capacities and . is the service life of hydrogen storage. is the service life of the electrolyzer.
represents the operating costs of the consumer
where is the TOU price (CNY/MWh), which varies across different months and fluctuates within a day. It is higher during peak load periods and lower during off-peak times. is the power purchased from the upstream power grid (MW). and are the unit annualized operating cost functions of the electrolyzer (CNY/(MW·year)) and hydrogen storage (CNY/(kg·year)), corresponding to different unit annualized operating costs under different capacities and . , , and are the power outputs of WT, PV, and BS with unit MW, respectively.
3.2. Constraints
The constraints take into account the equipment output and installation capacity constraints, stored energy constraints of BS, stored gas constraints of hydrogen storage, and energy balance constraints.
3.2.1. Electrolyzer
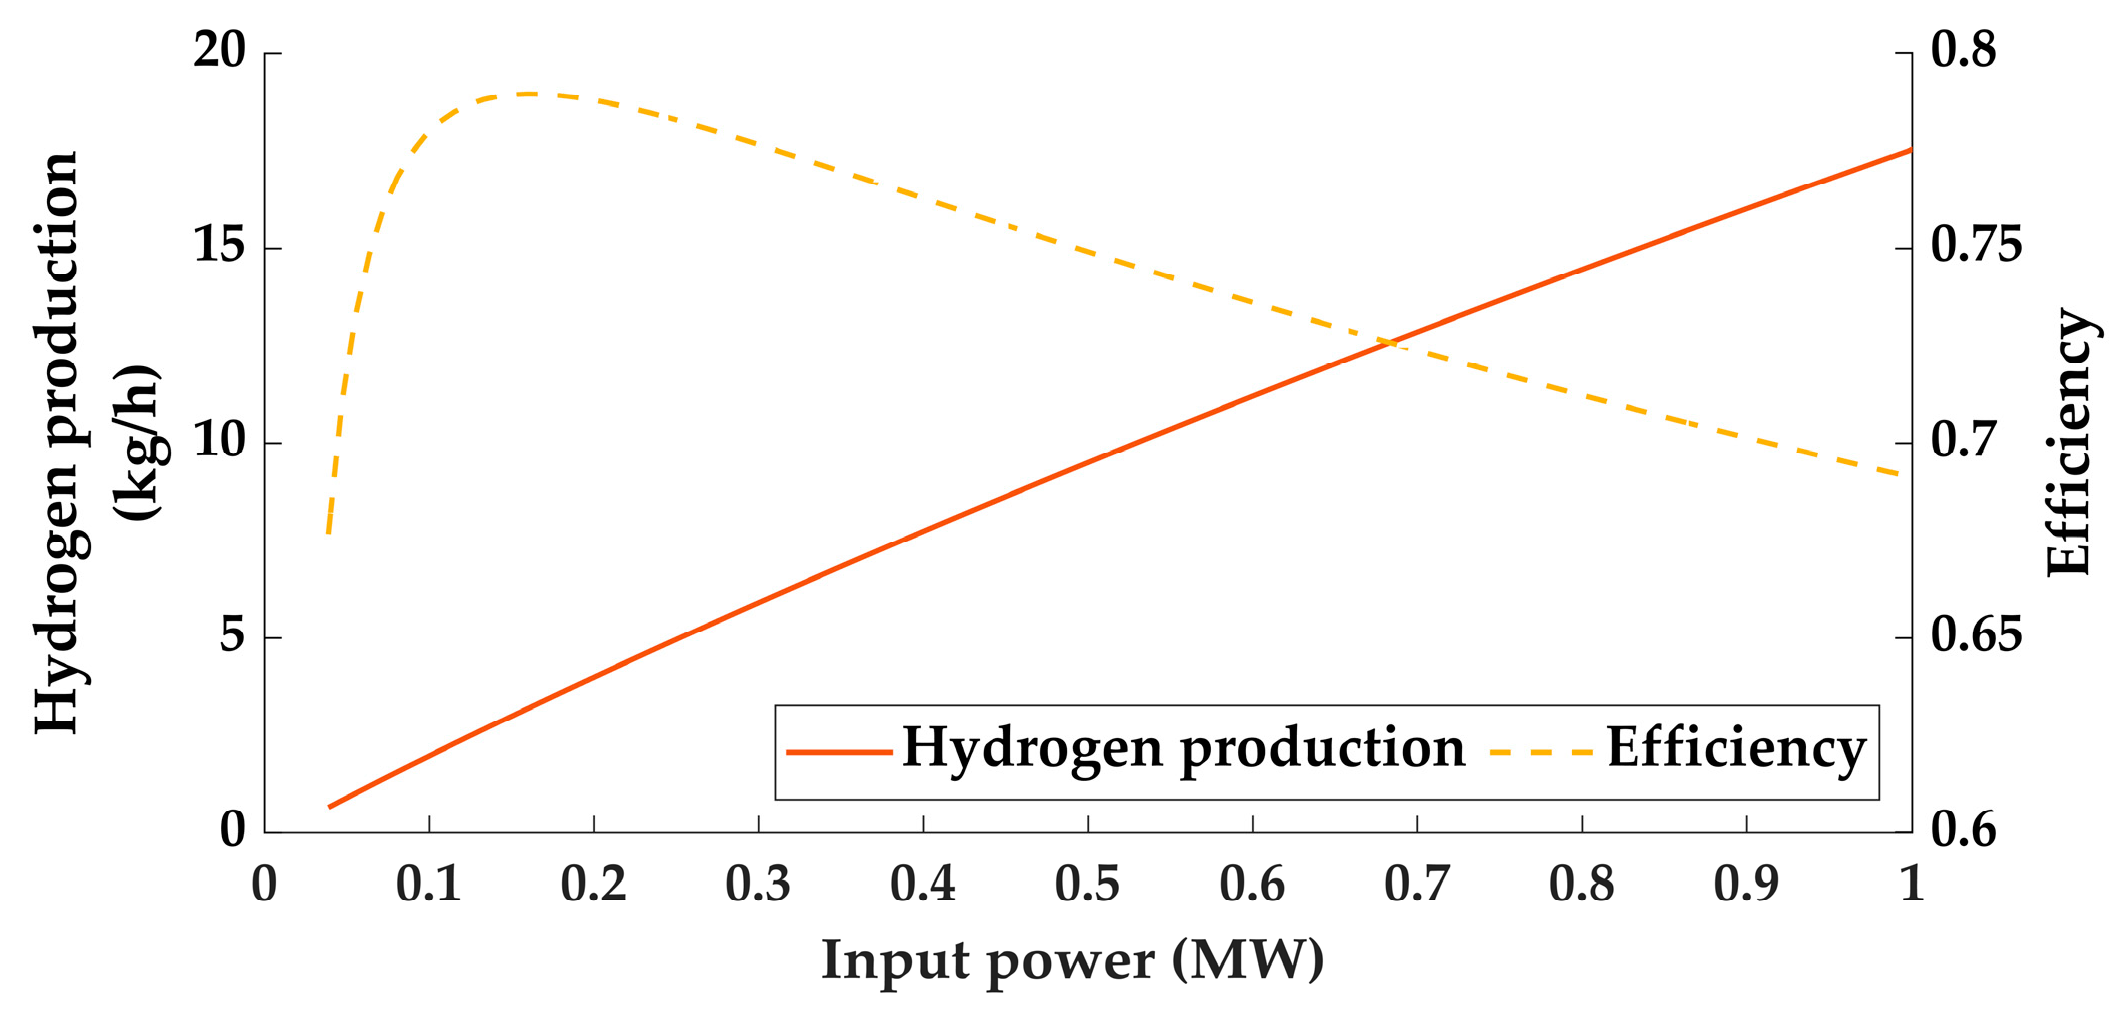
The typical proton exchange membrane electrolyzer model is considered in this paper. The basic principle of the electrolysis process involves utilizing electrical energy to convert two water molecules into two hydrogen molecules and one oxygen molecule, thereby achieving hydrogen production. More detailed electrochemical characteristics of the proton exchange membrane electrolyzer can be found in [31]. The efficiency of proton exchange membrane electrolyzers dynamically changes with the input power, exhibiting nonlinear characteristics. During operation, the diffusion of hydrogen and oxygen across the membrane leads to Faraday efficiency losses [32] and further impacts the energy conversion process. Figure 3 illustrates the relationship between the input power, efficiency, and hydrogen production rate of a typical proton exchange membrane electrolyzer. The figure demonstrates that the efficiency of the electrolyzer escalates with an increase in input power, reaching an optimum at light loading conditions. Beyond this operational point, the electrolyzer requires more electrical energy to produce the same amount of hydrogen, resulting in decreased efficiency [33].
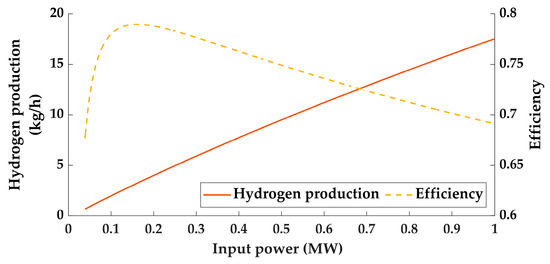
Figure 3.
Relationship between the input power, hydrogen production, and efficiency of a proton exchange membrane electrolyzer.
Based on the input and output relationship of the electrolyzer, a piecewise linear approximation can be adopted to represent the above relationship of the proton exchange membrane electrolyzer with dynamic efficiency
where is the hydrogen output of the electrolyzer (Nm3), and is the input power of the electrolyzer (MW). The above linearization method divides the original relationship between the power input and hydrogen output of the electrolyzer into segments with index in their feasible range.
The electrolyzer is also constrained by the installation capacity limits and input power limits, they are formulated as follows [34]
where and are the maximum and minimum possible installation capacity of the electrolyzer (MW). is the minimum output rate of the electrolyzer.
3.2.2. Renewable Energy Sources
The outputs of WT and PV are constrained by their maximum curtailment rate and installation capacity
where and are the maximum available per-unit outputs of WT and PV, it is related to the predicted value and real-time fluctuations. and are the maximum curtailment rate of WT and PV, aiming to prevent excessive wastage of RESs [35].
The installation capacity of WT and PV are constrained by corresponding limits
where and are the maximum and minimum possible installation capacity of WT (MW). and are the maximum and minimum possible installation capacity of PV (MW).
3.2.3. Battery Storage
The output of BS is constraints by the installation capacity of the battery and power converter system, and the stored energy status of the battery [36]
where is the energy stored in the BS at a time step (MWh). and are the charge and discharge efficiency of BS, and is the dissipation factor of BS. and are the maximum and minimum state-of-charge (SoC) of BS.
Equation (16) defines the output constraints of BS. The first line establishes the relationship between the BS output and its charge/discharge power and (MW). The second line specifies that the BS output is limited by the installation capacity of the power converter system. The third line is the limitations on annual cycle charging and discharging times . The fourth line indicates that the BS can be in either a charging or discharging state but not both simultaneously [36]. The fifth line asserts that both the charging and discharging powers of the BS must be positive values.
The installation capacity of BS and its power converter system are constrained by corresponding limits
where and in the first line of the equation are the maximum and minimum possible installation capacity of the battery in BS. The second line of the equation is the maximum installation capacity of the power converter system of BS, it needs to be greater than the demand for charge and discharge rate [37].
3.2.4. Hydrogen Storage
The output of hydrogen storage is constrained by the installation capacity of the hydrogen storage tank, and the stored gas status of the hydrogen storage [38]
where is the volume of hydrogen gas stored in hydrogen storage (kg). and are the charge and discharge efficiency, and is the dissipation factor of hydrogen storage. Equation (19) defines the output constraints of the hydrogen storage. A positive output of signifies a net outflow of hydrogen gas, whereas a negative value denotes a net inflow. Both the charging and discharging of hydrogen are positive values. The maximum volumes for charging and discharging hydrogen gas are constrained by the output factor , which is related to the capacity of hydrogen storage. The charge and discharge of the hydrogen storage can occur simultaneously. is the minimum ratio of volume that can be stored in hydrogen storage.
The installation capacity of hydrogen storage is limited by
where and are the maximum and minimum installation capacity of hydrogen storage (kg).
3.2.5. Energy Balance Constraints
The energy balance constraints comprise electric power balance and gas balance constraints, which represent the total energy supply needs to meet the demand in EHMES. They are formulated as
where and are the electric load (MW) and gas load (Nm3/h) demands of the consumer. can be calculated by Equation (2). The unit of hydrogen can be converted to “kg” based on its density at standard atmospheric pressure.
3.2.6. Flexible and Upstream Grid Constraints
In this paper, the power output of BS and the electric power from the upstream power grid are the flexible resources in the EHMES to manage the fluctuations of WT and PV. During the planning stage, the and need to possess a certain degree of flexibility reserve to accommodate the uncertainty associated with WT and PV
where is the maximum value of the difference between electricity demand () and RESs generation (), considering uncertainty at a specified level of confidence . The fluctuations of WT and PV can be estimated through corresponding probability density functions from existing studies [39].
The electric power from the upstream power grid is also constrained by its maximum transmission power limit. To ensure the substitution with green electricity in EHMES, the amount of electricity obtained from the grid should not exceed a certain percentage of the installed capacity of RESs. In addition, the power generated in EHMES cannot transmit to the upstream power grid as mentioned above.
where is the ratio to ensure the green electricity substitution.
3.3. Decision Variables and Model Linearlization
The core decision variables in the optimal planning model of the EHMES proposed in this paper include the capacities of various pieces of equipment: WT, PV, BS (including battery and PCS), hydrogen storage, and electrolyzer. Moreover, the output of this equipment is also an essential decision variable that plays a significant role in defining the capacity configurations. The planning model is a mixed integer nonlinear programming (MINLP). To tackle this, the big-M method [40] is utilized to re-formulate the piecewise functions and nonlinear constraints, allowing the model to be converted into a Mixed Integer Linear Optimization Programming (MILP) [41]. This transformation enables the solution of the model using the Gurobi solver [42].
Specifically, the investment and operating cost functions of WT, PV, battery, and PCS, like Equation (4), can be linearized with the help of auxiliary binary variables and a large positive integer . Similarly, taking the investment cost functions as an example, other functions can be processed in a similar manner. Binary variables are introduced to denote the capacity interval that falls within. is the total number of intervals. Consequently, the can be reformulated as
where represents falls within the interval . By employing these binary integer variables, the piecewise function is converted into linear constraints, which can then be efficiently solved by the MILP solver. The output function of the electrolyzer can also be linearized by employing a similar approach, which involves the introduction of binary variables and the use of the Big-M method as outlined above.
The output constraints for the charge and discharge power of BS can be linearized by introducing the binary variables and
3.4. Overall Planning Process
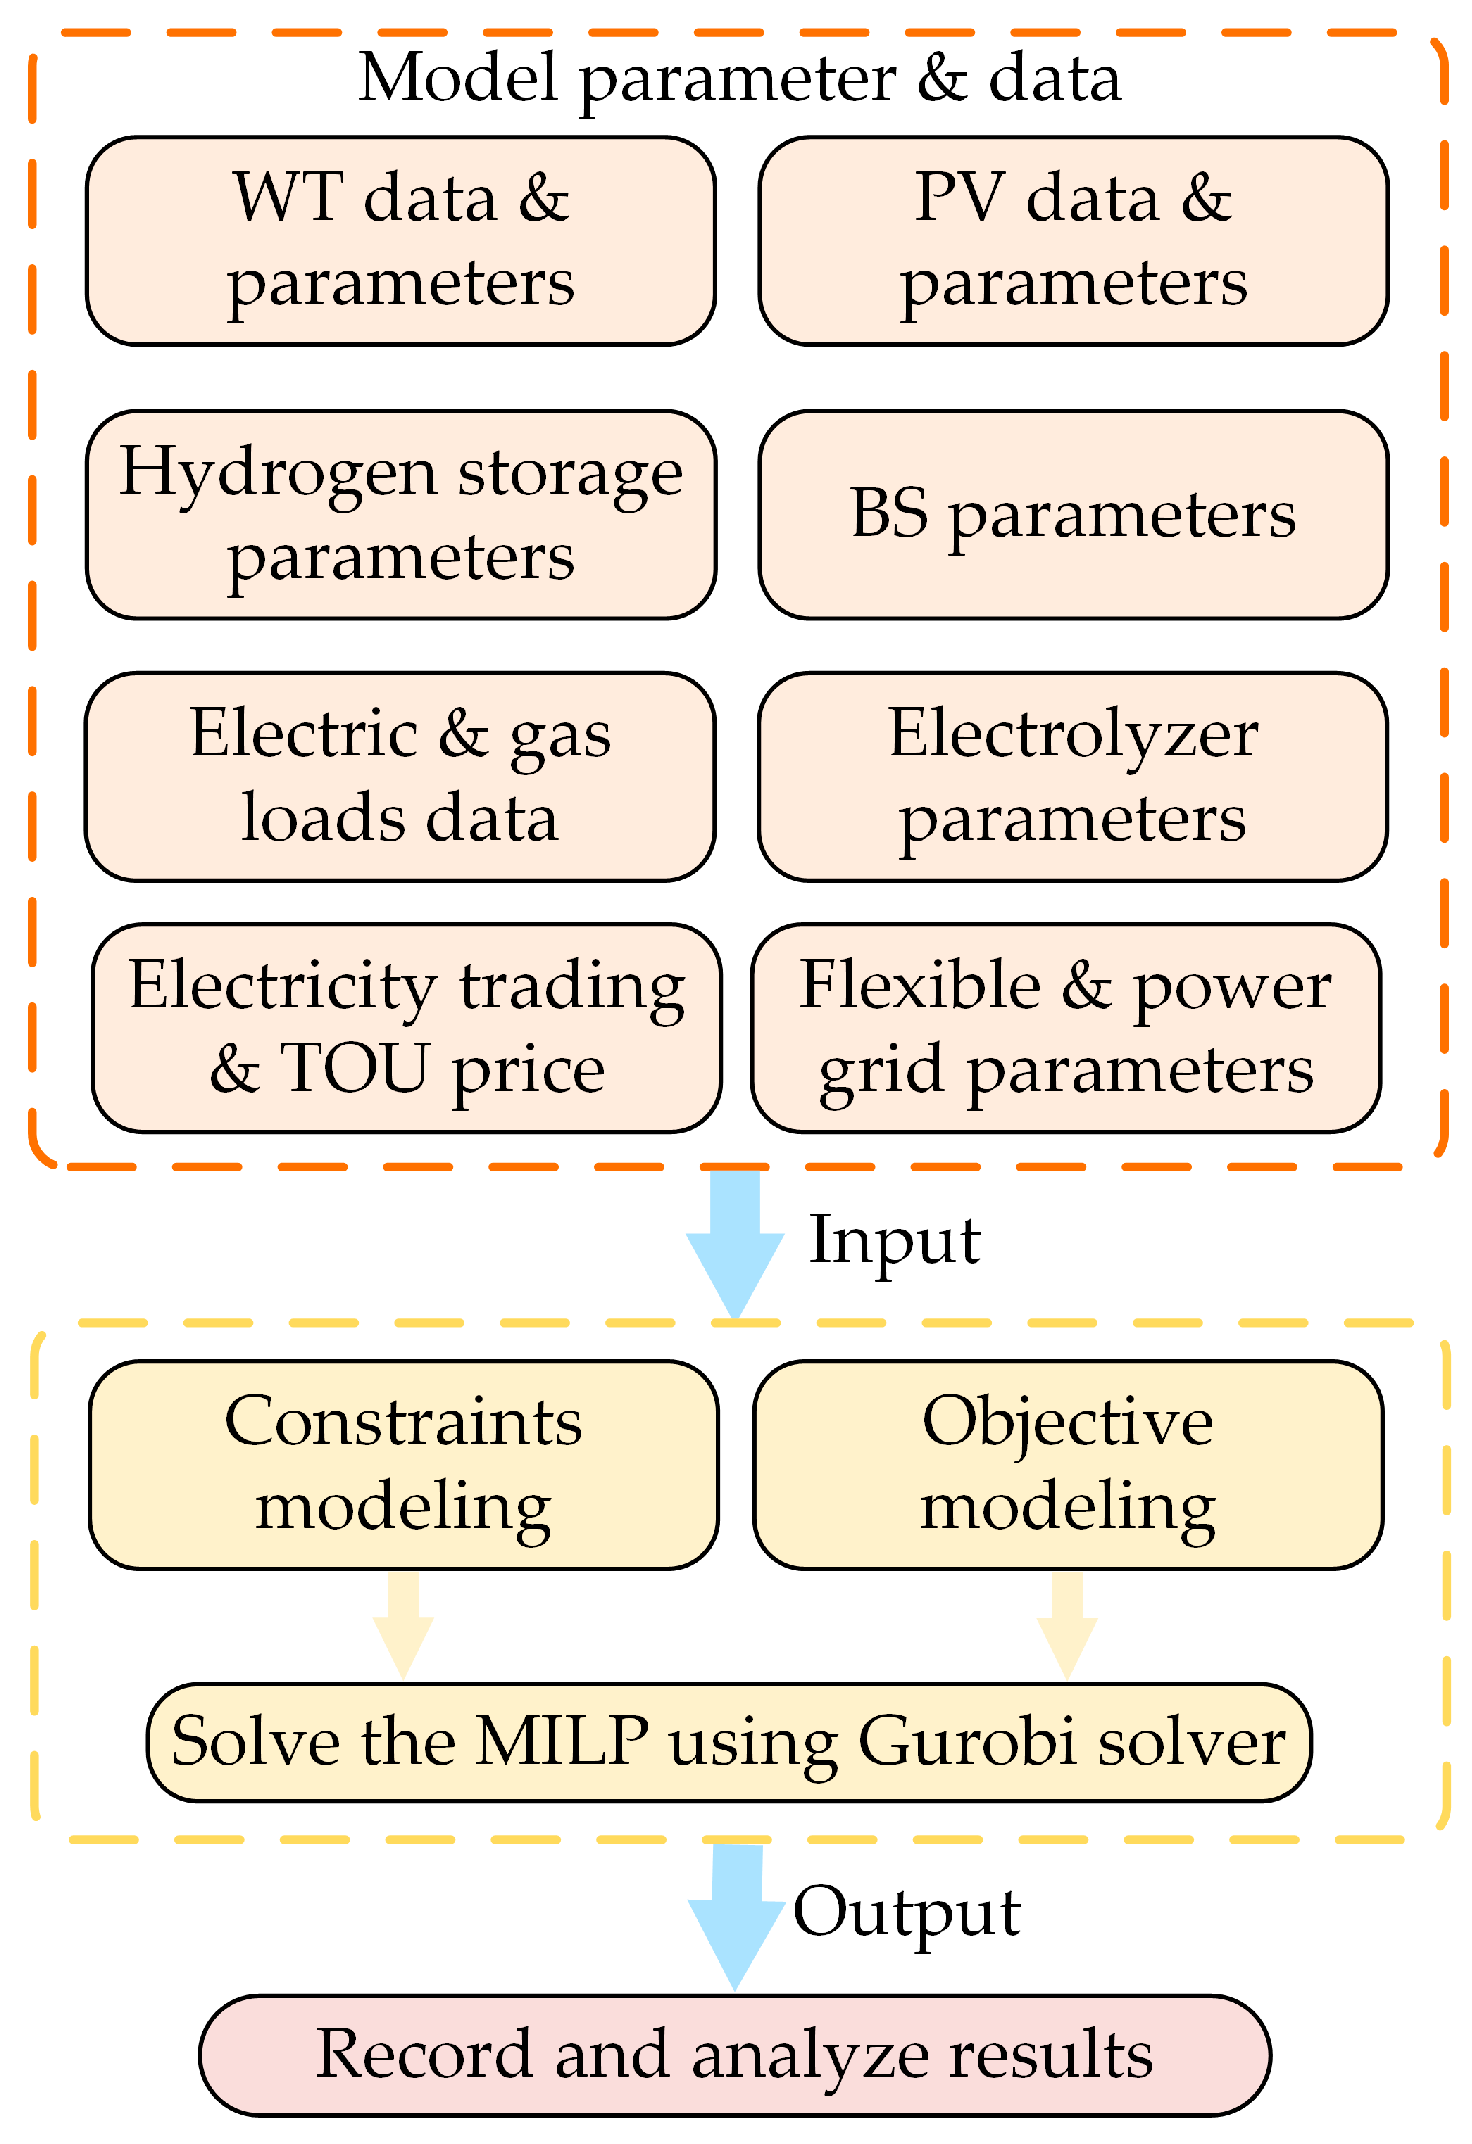
The overall process for the EHMES planning proposed in this paper is shown in Figure 4 and summarized as follows:
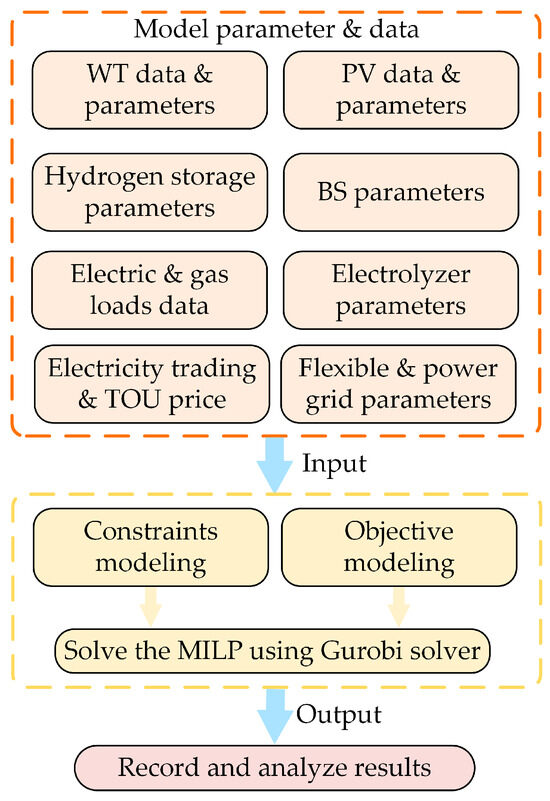
Figure 4.
Flowchart of the proposed EHMES planning approach.
- Equipment Data and Parameter Collection: For the area under study, compile historical data for WT and PV with per-unit values. Collect historical data on electricity and gas load demands with actual values. Gather information on costs and technical parameters, as well as installation capacity requirements for PV, WT, BS, hydrogen storage, and electrolyzer within EHMES.
- Other Parameter Collection: Gather TOU price information and the limits on flexible and upstream power transmission within EHMES. Establish the unit price for electricity transactions between the producer and consumer within EHMES, which can be set through negotiations [30]. Pricing could be based on a fixed rate or a certain discount on the TOU electricity price.
- EHMES Planning Modeling and Solution: Using the collected data and parameters, define the objectives and constraints. Solve the optimization model using the MILP solver to determine the equipment capacity configuration.
- Results Analysis: Assess whether the results satisfy the set requirements and adjust parameters for further calculation as needed.
4. Case Study
4.1. Test System and Basic Data
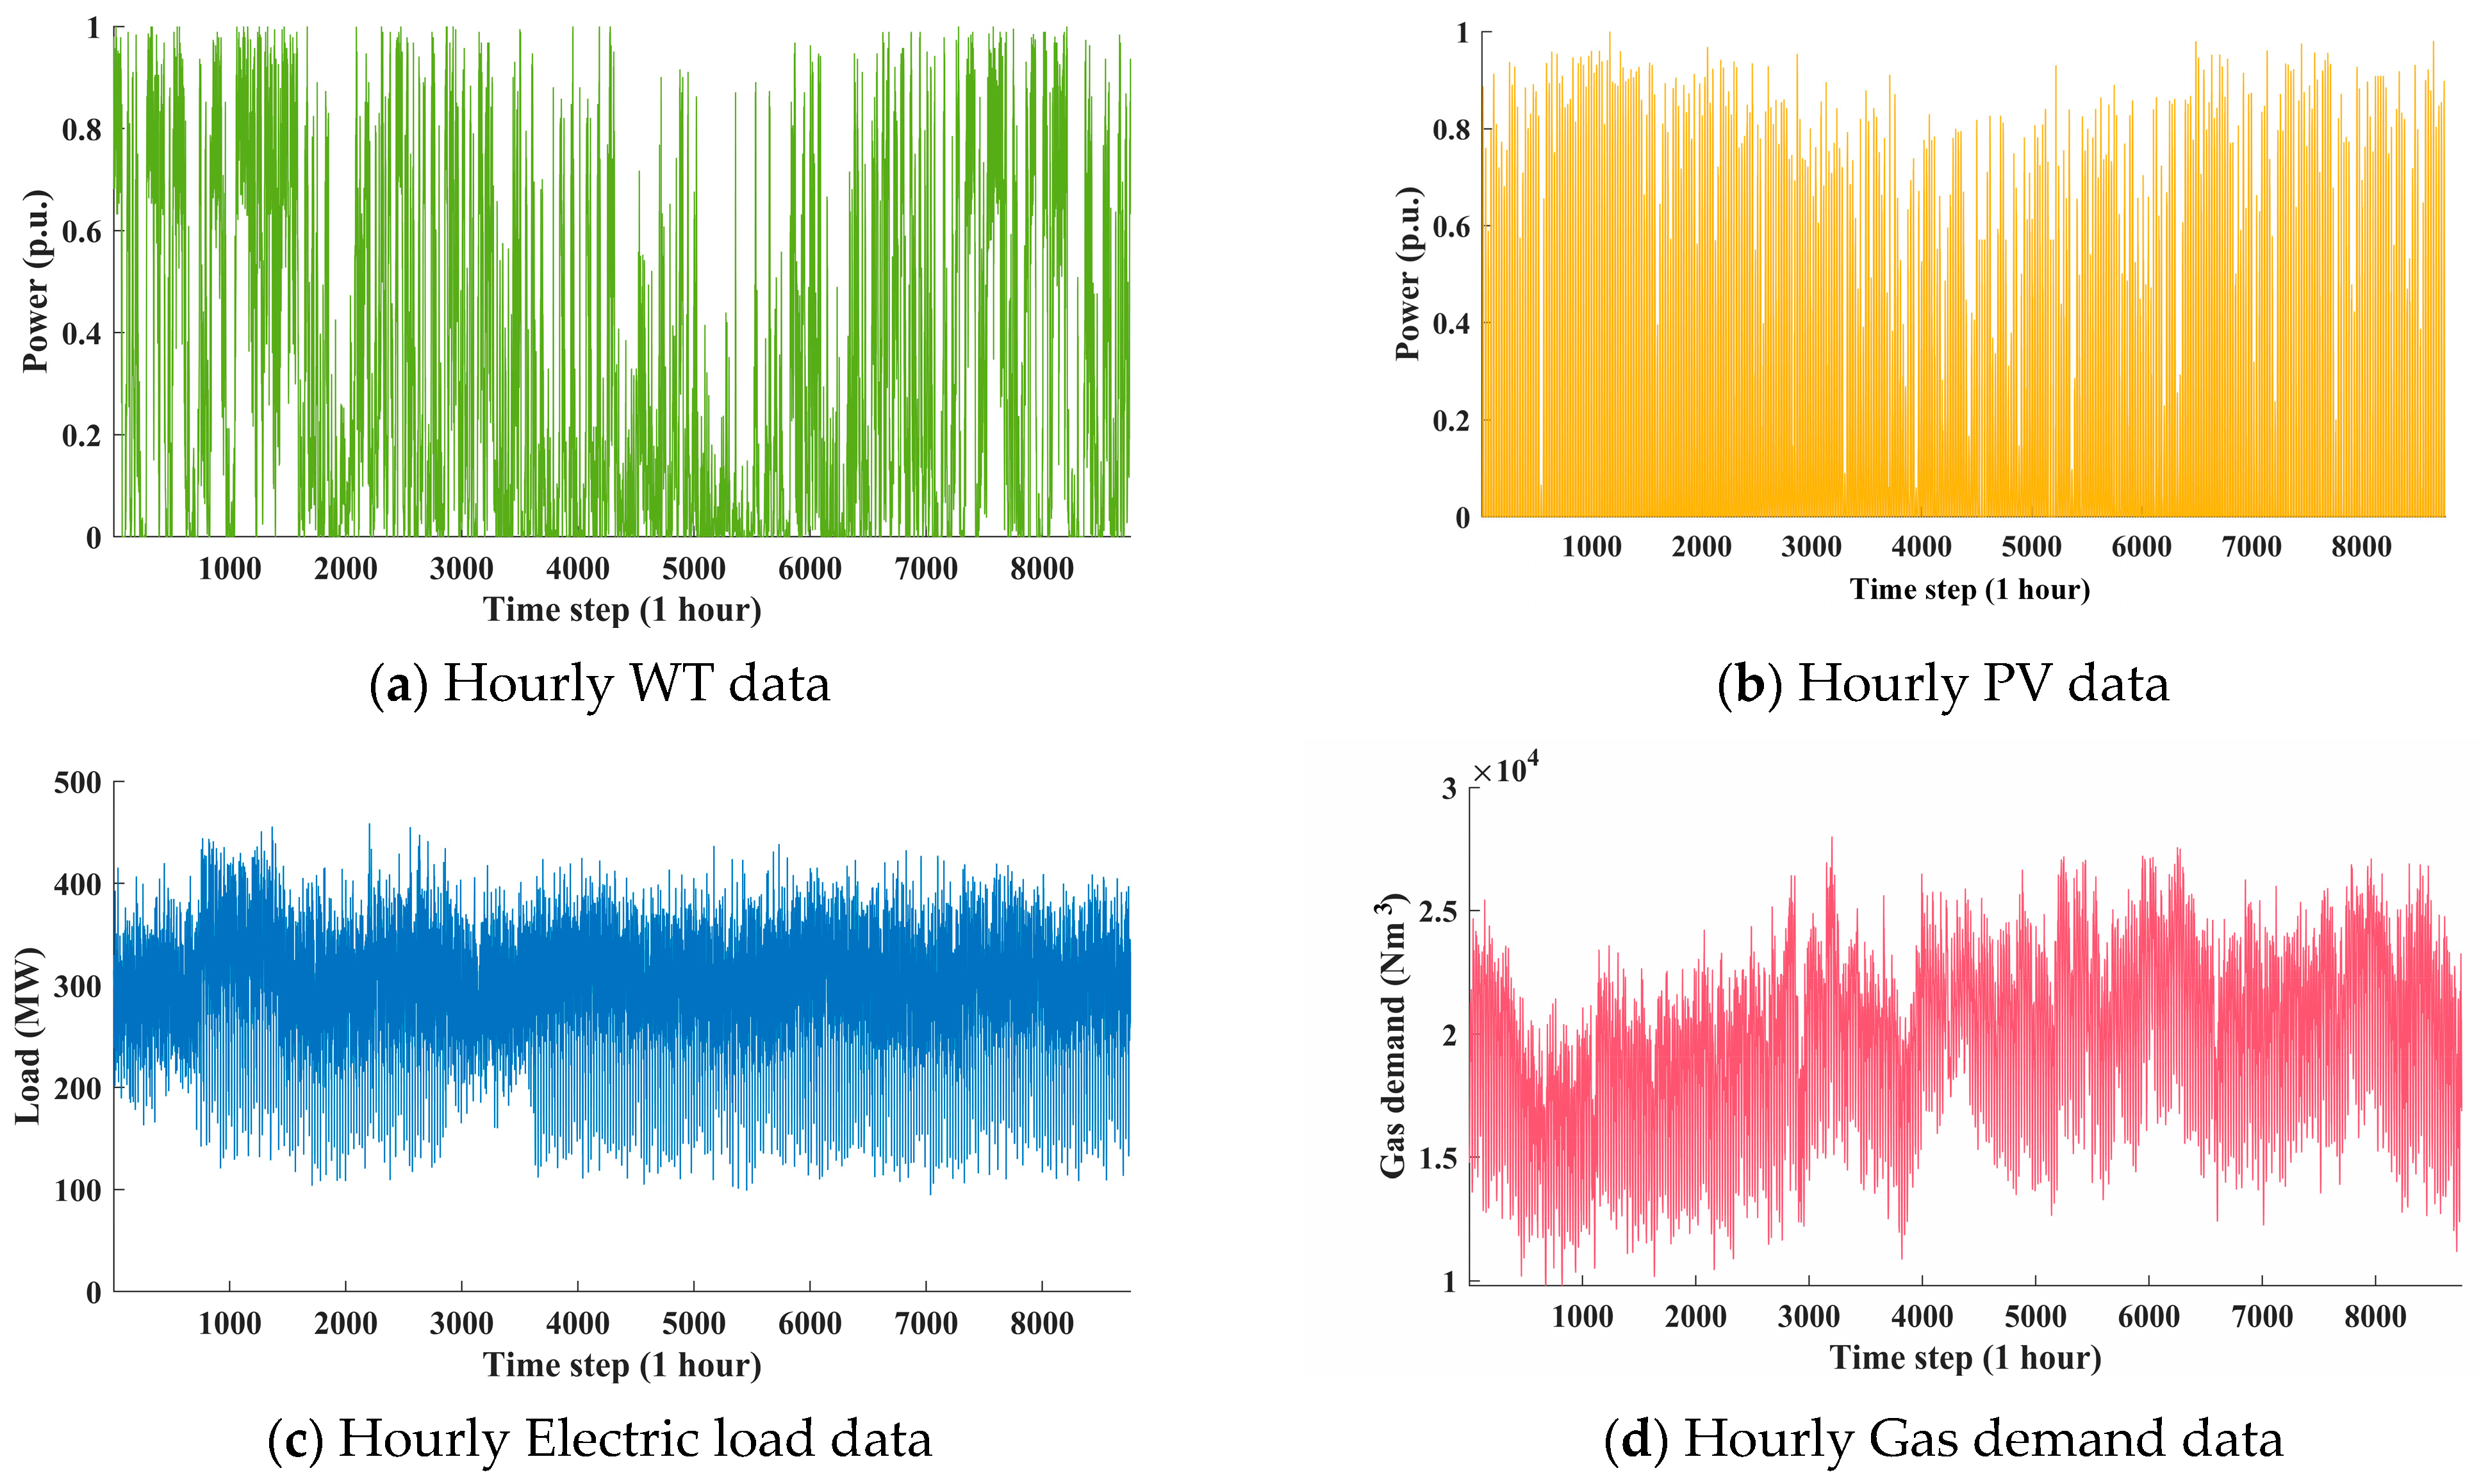
This case study is conducted on the industrial EHMES, as shown in Figure 1. The WT and PV data are based in the northwest region of China. The energy demand data are collected from the real-world industrial user. The demand for electrical load encompasses industrial production loads, which account for over 99% of the electrical consumption in the EHMES, as well as a smaller proportion of other loads such as office operations and living necessities. Considering the common scheduling time scales used in power systems [43] and taking into account the need to determine equipment capacity and overall output during the planning stage, the time scale for the collected data is based on 1 h in a year. The RES data and energy demand data are shown in Figure 5. The system parameter and TOU price are listed in Tables A1 and A2 in Appendix A. The objective of EHMES is . The installation capacity limits for the equipment are determined based on factors such as site constraints and energy demand within the industrial area under study.

Figure 5.
Annual hourly data of WT, PV, and industrial energy demand in the studied area.
4.2. Capacity Configurations under Different Curtailment Rate
In this part, the capacity configurations under various maximum wind and solar curtailment rate conditions are studied and analyzed. The results are presented in Table 1, encompassing the capacity configurations for each equipment and the annual RES utilization.

Table 1.
Capacity configuration of EHMES under different curtailment rates of WT and PV.
The table reveals that, as the curtailment rate increases, the installed capacity of RESs gradually rises, while the capacity of BS progressively diminishes. This is because the output from RESs in the EHMES is uncontrollable and cannot consistently match load variations. Meanwhile, surplus power generated from RESs cannot be transmitted to the upstream power grid. To ensure a high utilization rate of renewable energy, the system relies on BS and hydrogen storage for RES accommodation and peak shaving. In the studied EHMES, even when accounting for the energy losses associated with converting electrical energy to hydrogen, the investment and operating costs for hydrogen storage remain relatively low. Therefore, the hydrogen storage is configured at the maximum allowable capacity across various curtailment rates in this case study. The capacity of BS increases significantly when the curtailment rate is below 0.1. At a curtailment rate of 0.01, the capacity of BS reaches 819.47 MWh, which is about 65% higher than the total capacity of RESs, which enables the annual RES utilization rate to achieve 100%. This indicates that the full accommodation of RES and the substitution with green electricity require sufficient flexible resources such as energy storage for support. The capacity of BS also grows gradually when the curtailment rate exceeds 0.1, with the annual RES utilization rate reduced from 96.13% to 89.73%. This is because, at higher curtailment rates, the total installed capacity of RES increases, leading to a concurrent rise in the demand for flexible resources within the system. Consequently, BS needs to expand its capacity to match this demand.
In terms of specific RES capacity, WT is prioritized over PV for installation under each curtailment rate, with their capacity significantly exceeding that of PV. This is because WT can generate power throughout the day, whereas PV can only generate power during daylight hours. Additionally, PV output experiences substantial variations in the morning and afternoon, making it challenging to match load demands and necessitating more energy storage for achieving high utilization. When the curtailment rate is between 0.01 and 0.1, PV constitutes only about 5% of the total RES capacity. At curtailment rates of 0.15 and 0.20, the installed capacity of PV increases to approximately 15% of the total RES capacity.
The installed capacity of the electrolyzer is primarily related to the hydrogen demand within the system and needs to roughly match the maximum hydrogen load. Therefore, its capacity does not significantly change across different curtailment rates. At lower curtailment rates, the electrolyzer requires relatively higher hydrogen production capabilities to complement the BS by converting surplus electrical power into hydrogen for storage in the hydrogen storage. At higher curtailment rates, as the equipment with the second-highest unit investment cost within the system, the electrolyzer accordingly reduces the installed capacity to lower the overall investment cost of the system.
The annual total cost of the system decreases with the increase in the curtailment rate, experiencing a rapid decline from 0.01 to 0.1 and then slowing down beyond 0.1. This pattern is because the system requires substantial investment in energy storage to ensure a high RES utilization rate at lower curtailment rates. The increase in the curtailment rate allows for a higher installed capacity of RES, enabling more electricity generation and thereby reducing the need to purchase electricity from the upstream power grid.
The aforementioned results highlight the crucial role of energy storage in ensuring green electricity substitution within the EHMES, as mentioned in reference [23]. It serves as a flexible resource to fully absorb the uncontrollable RESs [44]. Furthermore, although increasing the curtailment rate of RES can reduce the annual total cost of the system and enhance the installed capacity of RES, it is not conducive to the efficient utilization of resources within the system. Therefore, the curtailment rate should be set to a reasonable level.
4.3. Capacity Configurations under Different Energy Demands
In this part, the capacity configurations under different energy demand scenarios are studied and analyzed. Firstly, to simulate the impact of load growth or overall changes on capacity configuration, the electrical and gas loads at each time step within the EHMES are multiplied by a certain coefficient. The results are shown in Table 2.
Table 2.
Capacity configuration of EHMES under different energy demands.
The table shows that with an overall increase in electrical load, the installed capacities of RES, BS, and electrolyzer in the system undergo various degrees of cyclical changes. This is primarily due to the complex interaction between the variable cost sequences of the equipment, as well as the matching of sources and loads. The capacity of equipment within the producer side increases with the overall growth of the electrical load. When the overall electrical load is higher, the installed capacities of BS in the system increase correspondingly. The variations in RES and electrical load within the system can be better accommodated, resulting in higher RES utilization at about 97% when the overall electrical load is 1.1 and 1.2 times the original. Meanwhile, the EHMES needs to deploy equipment with more capacity and purchase more electricity from the upstream power grid to meet the growth in electrical load. Thus, the annual total cost of the system also gradually rises.
The overall growth in hydrogen load primarily leads to an increase in the installed capacity of the electrolyzer. This is because the electrolyzer is the only source for hydrogen production in the EHMES; its installed capacity needs to match the maximum hydrogen load. Given that hydrogen production relies mainly on electricity, in essence, and considering hydrogen storage, the hydrogen load can be equivalent to a controllable electrical load. Thus, an overall increase in hydrogen load also leads to an overall increase in the installed capacity of RES. Meanwhile, due to the hydrogen load having a certain degree of controllability, its overall growth has a minimal impact on the installed capacity of BS. As the installed capacity of RES increases, the annual total cost of the system gradually rises with the increase in hydrogen load. The overall increase in RES capacity with unchanged BS capacity does not efficiently accommodate the RES, resulting in a slight decrease in RES utilization.
Secondly, the impact of varying peak-to-valley ratios of electrical and gas loads on the capacity configuration of EHMES equipment is analyzed. In the analysis, the maximum load remains unchanged, while the range of load variation is uniformly reduced to adjust the peak-valley difference ratios (PVDRs) of both electrical and gas loads. The methods are based on reference [43]. Different PVDR ratios primarily aim to simulate scenarios employing various load adjustment strategies, such as demand–side response, to study the capacity configuration of equipment and operating costs of EHMES. The results are presented in Table 3.
Table 3.
Capacity configuration of EHMES under different Peak-Valley Rate.
From the table, it is evident that, with a decreasing PVDR of the electrical load, the capacity for WT generally increases, highlighting WT’s effectiveness as a relatively stable power source within the EHMES to accommodate smoother electrical load profiles. On the other hand, PV capacity exhibits fluctuations within relatively narrow ranges. This variability shows the limited capability of PV to align precisely with electrical load demands. When the PVDR is high, the installed capacity of BS is significantly large. This indicates that during periods of substantial load variability, energy storage (i.e., BS and hydrogen storage) plays a crucial role in peak shaving and load leveling within the system. The capacity of BS decreases with a reduction in PVDR and then shows a small variability. This trend could imply that less storage is required as the electrical load becomes smoother. However, when the PVDR is small, the load may not match the generation from RES. Under these circumstances, it is necessary to increase the installed capacity of BS to accommodate the surplus imbalance between RES and load demand. RES utilization and annual total cost exhibit fluctuations across different PVDRs, indicating that regional wind and solar resources need to be effectively matched with electrical load variations to achieve better green energy substitution and cost reduction. The capacity of the electrolyzer changes less with the changes in PVDR, as its output is mainly influenced by the hydron demand.
The variation in the PVDR for hydrogen load has a minimal impact on the installed capacity of RESs, as the electricity consumed for hydrogen production accounts for only about 30% of the electrical load. The trend changes in the hydrogen load curve caused by PVDR are primarily managed by energy storage more economically for peak shaving and valley filling. Consequently, the installed capacity of BS gradually increases as the hydrogen load PVDR decreases. The installed capacity of the electrolyzers first decreases and then increases as the PVDR decreases, whereas RES utilization and annual total cost initially rise and then fall, with a decrease in PVDR. This pattern also underscores the necessity of aligning wind and solar resources with hydrogen demand in the region where the EHMES is located.
The above results demonstrate the importance of considering the match between regional renewable energy resources and energy demand in capacity configuration to achieve efficient utilization of RES and economical operation of the system. This finding is in accordance with the analysis in reference [45]. Moreover, by employing potential measures, such as demand response [30] to reshape the load profile, the overall resource utilization of the system can be enhanced.
4.4. Benefit Analysis of Green Electricity-Based Hydrogen Production
In this part, the benefits brought by the EHMES system are analyzed. The optimized capacity configuration results are based on basic energy demand and curtailment rate (i.e., ); the key indices are presented in Table 4.
Table 4.
Benefit analysis of EHMES planning results based on basic load demand data.
The data highlights the EHMES’s significant impact on green electricity production, accounting for 42.18% of the total electricity generation, which illustrates the system’s capacity to integrate RES effectively. The total green electricity generation of over 1.4 million MWh is entirely consumed within the EHMES, achieving efficient local utilization of RESs. The EHMES system demonstrates a strategic reduction in dependence on external power supplies, attributed to its capacity for local green electricity generation. The savings in electricity purchase costs, amounting to approximately 89.05 million CNY, further underline the financial benefits of substituting traditional electricity supplies with green alternatives within the EHMES framework. The total electricity consumption for hydrogen production reflects the system’s dedication to leveraging green electricity for hydrogen production, underscoring the dual benefit of reducing carbon emissions while promoting renewable energy integration.
The capacity configuration of EHMES with and without considering hydrogen demand is depicted in Table 5. As shown in the table, when electrolytic hydrogen production is not considered, the system’s total electricity demand decreases, the installed capacity of renewable energy sources reduces by 70 MW, and the capacity of electrical energy storage increases by 125 MWh. The generation of green electricity decreases by 2.35 MWh. These results underscore the role of electrolytic hydrogen production in boosting the installed capacity of RESs.
Table 5.
Capacity configuration of EHMES with/without considering hydrogen demand.
The results demonstrate the benefits of the EHMES in fostering a more sustainable and energy-efficient industrial landscape.
5. Conclusions
This paper proposes an optimal capacity planning approach for the industrial EHMES, considering the variable cost sequence of equipment to address the challenges of integrating and accommodating RES locally for large-scale industrial users. By dividing the EHMES investment and operation into consumer and producer sides, specialized management, seamless energy trading, and effective RES integration into industrial applications can be achieved. By considering variations in investment and operating costs across different installed capacities, the proposed capacity planning approach is economically viable and closely aligned with practical industry requirements. Based on a case study from a real-world EHMES, the results are summarized as follows:
- The proposed optimal planning approach optimizes the specific installation capacities of equipment within the EHMES considering variable investment costs of the equipment, as well as the characteristics of the energy supply and demand. This capacity configuration can ensure the efficient local utilization of RESs, aligning with the system’s objectives for sustainable and cost-effective energy management.
- WT emerges as a more cost-effective RES for supplying green electricity within EHMES compared to PV. Despite its relatively higher unit capacity investment cost, WT still maintains a proportionally higher installation capacity within the EHMES relative to PV. Reducing the RES curtailment rate can lead to a decrease in the overall cost of the system, but it might not contribute to the effective utilization of RES.
- The flexible resources, like BS and hydrogen storage, are instrumental in addressing the RES locally, thus supporting the efficient operation and economic feasibility of the EHMES. Hydrogen storage with a lower unit investment cost is prioritized for installation in the system. As the RES curtailment rate decreases, the installed capacity of BS increases accordingly for achieving RES accommodation.
- Detailed analysis of the EHMES capacity configuration under various scenarios demonstrates the importance of matching the system equipment’s capacity with industrial energy demands. An overall increase in the electrical load leads to a rise in the BS capacity, while an overall increase in hydrogen demand leads to a rise in the electrolyzer capacity. Both excessively high and low peak-to-valley ratios of energy demand could contribute to an increase in the system’s total costs and the installed capacity of energy storage.
- Substituting with green electricity can help industrial users reduce nearly half of their electricity purchase costs from the upstream power grid. Employing hydrogen production through electrolysis enhances the installed capacity of RESs and achieves efficient local accommodation.
The planning approach proposed in this paper does not evaluate the effectiveness of source-load matching, which cannot assess the suitability of constructing an EHMES in the studied region. Future research could consider establishing a set of source-load matching indicators to quantify the matching effects, like the study in [46]. This effort would facilitate the preliminary selection of areas suitable for EHMES construction based on the wind and solar resources of the area. Moreover, investigating demand–side response strategies tailored to the production processes of different industrial EHMES to enhance capacity configuration effectiveness represents another potential direction for future research.
Author Contributions
Conceptualization, Y.Z. and Q.W.; methodology, Y.Z. and Q.X.; software, Y.Z. and Q.X.; validation, Q.W.; formal analysis, Q.W.; investigation, Q.X.; resources, Q.W.; data curation, Y.Z.; writing-original draft preparation, Q.X.; writing-review and editing, Y.Z. and Q.X.; visualization, Q.X.; supervision, Q.W.; project administration Q.W. and Y.Z.; funding acquisition, Q.W. All authors have read and agreed to the published version of the manuscript.
Funding
This research is supported by Fundamental Research Funds for the Central Universities (Project No. 2023CDJYXTD-004).
Institutional Review Board Statement
Not applicable.
Informed Consent Statement
Not applicable.
Data Availability Statement
The data presented in this study are available on request from the corresponding author.
Conflicts of Interest
The authors declare no conflicts of interest.
Appendix A
Table A1.
Main parameters of the test industrial EHMES.
Table A1.
Main parameters of the test industrial EHMES.
| Equipment | Parameter |
|---|---|
| WT | |
| PV | |
| BS | ,,, |
| Hydrogen storage | , |
| Electrolyzer | , |
| Other |
Table A2.
Time-of-use price of the upstream power grid (CHY/kwh).
Table A2.
Time-of-use price of the upstream power grid (CHY/kwh).
| Jan. | Feb. | Mar. | April | May | June | July | Aug. | Sep. | Oct. | Nov. | Dec. | |
|---|---|---|---|---|---|---|---|---|---|---|---|---|
| 1:00 | 0.2454 | 0.2457 | 0.2366 | 0.2277 | 0.2206 | 0.2454 | 0.2454 | 0.2454 | 0.2454 | 0.2206 | 0.2454 | 0.2454 |
| 2:00 | 0.2454 | 0.2457 | 0.2366 | 0.2277 | 0.2206 | 0.2454 | 0.2454 | 0.2454 | 0.2454 | 0.2206 | 0.2454 | 0.2454 |
| 3:00 | 0.2454 | 0.2457 | 0.2366 | 0.2277 | 0.2206 | 0.2454 | 0.2454 | 0.2454 | 0.2454 | 0.2206 | 0.2454 | 0.2454 |
| 4:00 | 0.2454 | 0.2457 | 0.2366 | 0.2277 | 0.2206 | 0.2454 | 0.2454 | 0.2454 | 0.2454 | 0.2206 | 0.2454 | 0.2454 |
| 5:00 | 0.2454 | 0.2457 | 0.2366 | 0.2277 | 0.2206 | 0.2454 | 0.2454 | 0.2454 | 0.2454 | 0.2206 | 0.2454 | 0.2454 |
| 6:00 | 0.2454 | 0.2457 | 0.2366 | 0.2277 | 0.2206 | 0.2454 | 0.2454 | 0.2454 | 0.2454 | 0.2206 | 0.2454 | 0.2454 |
| 7:00 | 0.2454 | 0.2457 | 0.2366 | 0.2277 | 0.2206 | 0.2454 | 0.2454 | 0.2454 | 0.2454 | 0.2206 | 0.2454 | 0.2454 |
| 8:00 | 0.6458 | 0.6466 | 0.6226 | 0.5992 | 0.5805 | 0.6458 | 0.6458 | 0.6458 | 0.6458 | 0.5805 | 0.6458 | 0.6458 |
| 9:00 | 1.0333 | 1.0346 | 0.9962 | 0.9588 | 0.9288 | 1.0333 | 1.0333 | 1.0333 | 1.0333 | 0.9288 | 1.0333 | 1.0333 |
| 10:00 | 1.0333 | 1.0346 | 0.9962 | 0.9588 | 0.9288 | 1.0333 | 1.0333 | 1.0333 | 1.0333 | 0.9288 | 1.0333 | 1.0333 |
| 11:00 | 1.0333 | 1.0346 | 0.9962 | 0.9588 | 0.9288 | 1.0333 | 1.0333 | 1.0333 | 1.0333 | 0.9288 | 1.0333 | 1.0333 |
| 12:00 | 0.2454 | 0.2457 | 0.2366 | 0.2277 | 0.2206 | 0.2454 | 0.2454 | 0.2454 | 0.2454 | 0.2206 | 0.2454 | 0.2454 |
| 13:00 | 0.2454 | 0.2457 | 0.2366 | 0.2277 | 0.2206 | 0.2454 | 0.2454 | 0.2454 | 0.2454 | 0.2206 | 0.2454 | 0.2454 |
| 14:00 | 0.6458 | 0.6466 | 0.6226 | 0.5992 | 0.5805 | 0.6458 | 0.6458 | 0.6458 | 0.6458 | 0.5805 | 0.6458 | 0.6458 |
| 15:00 | 0.6458 | 0.6466 | 0.6226 | 0.5992 | 0.5805 | 0.6458 | 0.6458 | 0.6458 | 0.6458 | 0.5805 | 0.6458 | 0.6458 |
| 16:00 | 0.6458 | 0.6466 | 0.6226 | 0.5992 | 0.5805 | 0.6458 | 0.6458 | 0.6458 | 0.6458 | 0.5805 | 0.6458 | 0.6458 |
| 17:00 | 0.6458 | 0.6466 | 0.6226 | 0.5992 | 0.5805 | 0.6458 | 0.6458 | 0.6458 | 0.6458 | 0.5805 | 0.6458 | 0.6458 |
| 18:00 | 1.0333 | 1.0346 | 0.9962 | 0.9588 | 0.9288 | 1.0333 | 1.0333 | 1.0333 | 1.0333 | 0.9288 | 1.0333 | 1.0333 |
| 19:00 | 1.2400 | 1.0346 | 0.9962 | 0.9588 | 0.9288 | 1.0333 | 1.2400 | 1.2400 | 1.0333 | 0.9288 | 1.0333 | 1.2400 |
| 20:00 | 1.2400 | 1.0346 | 0.9962 | 0.9588 | 0.9288 | 1.0333 | 1.2400 | 1.2400 | 1.0333 | 0.9288 | 1.0333 | 1.2400 |
| 21:00 | 1.0333 | 1.0346 | 0.9962 | 0.9588 | 0.9288 | 1.0333 | 1.0333 | 1.0333 | 1.0333 | 0.9288 | 1.0333 | 1.0333 |
| 22:00 | 1.0333 | 1.0346 | 0.9962 | 0.9588 | 0.9288 | 1.0333 | 1.0333 | 1.0333 | 1.0333 | 0.9288 | 1.0333 | 1.0333 |
| 23:00 | 1.0333 | 1.0346 | 0.9962 | 0.9588 | 0.9288 | 1.0333 | 1.0333 | 1.0333 | 1.0333 | 0.9288 | 1.0333 | 1.0333 |
| 24:00 | 0.6458 | 0.6466 | 0.6226 | 0.5992 | 0.5805 | 0.6458 | 0.6458 | 0.6458 | 0.6458 | 0.5805 | 0.6458 | 0.6458 |
References
- Glanemann, N.; Willner, S.N.; Levermann, A. Paris Climate Agreement passes the cost-benefit test. Nat. Commun. 2020, 11, 110. [Google Scholar] [CrossRef]
- Liu, Z.; Deng, Z.; He, G.; Wang, H.; Zhang, X.; Lin, J.; Qi, Y.; Liang, X. Challenges and opportunities for carbon neutrality in China. Nat. Rev. Earth Environ. 2022, 3, 141–155. [Google Scholar] [CrossRef]
- Yu, B.; Fang, D.; Xiao, K.; Pan, Y. Drivers of renewable energy penetration and its role in power sector’s deep decarbonization towards carbon peak. Renew. Sustain. Energy Rev. 2023, 178, 112374. [Google Scholar] [CrossRef]
- Li, Y.; Zou, Y.; Tan, Y.; Cao, Y.; Liu, X.; Shahidehpour, M.; Tian, S.; Bu, F. Optimal stochastic operation of integrated low-carbon electric power, natural gas, and heat delivery system. IEEE Trans. Sustain. Energy 2018, 9, 273–283. [Google Scholar] [CrossRef]
- Groll, M. Can climate change be avoided? Vision of a hydrogen-electricity energy economy. Energy 2023, 264, 126029. [Google Scholar] [CrossRef]
- Rasul, M.G.; Hazrat, M.A.; Sattar, M.A.; Jahirul, M.I.; Shearer, M.J. The future of hydrogen: Challenges on production, storage and applications. Energy Convers. Manag. 2022, 272, 116326. [Google Scholar] [CrossRef]
- Gao, P.; Yue, S.; Chen, H. Carbon emission efficiency of China’s industry sectors: From the perspective of embodied carbon emissions. J. Clean. Prod. 2021, 283, 124655. [Google Scholar] [CrossRef]
- Kovač, A.; Paranos, M.; Marciuš, D. Hydrogen in energy transition: A review. Int. J. Hydrogen Energy 2021, 46, 10016–10035. [Google Scholar] [CrossRef]
- Tang, J.; Chu, M.; Li, F.; Feng, C.; Liu, Z.; Zhou, Y. Development and progress on hydrogen metallurgy. Int. J. Min. Met. Mater. 2020, 27, 713–723. [Google Scholar] [CrossRef]
- Griffiths, S.; Sovacool, B.K.; Kim, J.; Bazilian, M.; Uratani, J.M. Industrial decarbonization via hydrogen: A critical and systematic review of developments, socio-technical systems and policy options. Energy Res. Soc. Sci. 2021, 80, 102208. [Google Scholar] [CrossRef]
- Ahmed, S.; Ali, A.; D’Angola, A. A Review of Renewable Energy Communities: Concepts, Scope, Progress, Challenges, and Recommendations. Sustainability 2024, 16, 1749. [Google Scholar] [CrossRef]
- Eslamizadeh, S.; Ghorbani, A.; Künneke, R.; Weijnen, M. Can industries be parties in collective action? Community energy in an Iranian industrial zone. Energy Res. Soc. Sci. 2020, 70, 101763. [Google Scholar] [CrossRef]
- Li, Q.; Xiao, X.; Pu, Y.; Luo, S.; Liu, H.; Chen, W. Hierarchical optimal scheduling method for regional integrated energy systems considering electricity-hydrogen shared energy. Appl. Energy 2023, 349, 121670. [Google Scholar] [CrossRef]
- Ran, L.; Mao, Y.; Yuan, T.; Li, G. Low-carbon transition pathway planning of regional power systems with electricity-hydrogen synergy. Energies 2022, 15, 8764. [Google Scholar] [CrossRef]
- Wang, J.; Zeng, P.; Li, Y.; Liu, J. Optimal capacity planning of power to hydrogen in integrated electricity–hydrogen–gas energy systems considering flexibility and hydrogen injection. Front. Energy Res. 2022, 10, 845637. [Google Scholar] [CrossRef]
- Li, Z.; Xia, Y.; Bo, Y.; Wei, W. Optimal planning for electricity-hydrogen integrated energy system considering multiple timescale operations and representative time-period selection. Appl. Energy 2024, 362, 122965. [Google Scholar] [CrossRef]
- Lin, J.; Cai, R. Optimal planning for industrial park-integrated energy system with hydrogen energy industry chain. Int. J. Hydrogen Energy 2023, 48, 19046–19059. [Google Scholar] [CrossRef]
- Li, J.; Yang, B.; Huang, J.; Guo, Z.; Wang, J.; Zhang, R.; Hu, Y.; Shu, H.; Chen, Y.; Yan, Y. Optimal planning of Electricity–Hydrogen hybrid energy storage system considering demand response in active distribution network. Energy 2023, 273, 127142. [Google Scholar] [CrossRef]
- Lin, B.; Du, Z. Promoting energy conservation in China’s metallurgy industry. Energy Policy 2017, 104, 285–294. [Google Scholar] [CrossRef]
- Li, C.; Yao, Y.; Zhao, R.; Xie, K. Optimization model for time-varying settlement of renewable energy consumption considering accommodation difficulty and supply–demand interaction. Int. J. Electr. Power Energy Syst. 2021, 125, 106469. [Google Scholar] [CrossRef]
- Fleten, S.E.; Maribu, K.M.; Wangensteen, I. Optimal investment strategies in decentralized renewable power generation under uncertainty. Energy 2007, 32, 803–815. [Google Scholar] [CrossRef]
- Deng, X.; Lv, T. Power system planning with increasing variable renewable energy: A review of optimization models. J. Clean. Prod. 2020, 246, 118962. [Google Scholar] [CrossRef]
- Wang, W.; Yuan, B.; Sun, Q.; Wennersten, R. Application of energy storage in integrated energy systems—A solution to fluctuation and uncertainty of renewable energy. J. Energy Storage 2022, 52, 104812. [Google Scholar] [CrossRef]
- The World’s First Carbon-Neutral Steel Plant. Available online: https://www.sms-group.com/en-cz/plants/projects/h2-green-steel (accessed on 10 April 2024).
- China’s First 10,000-ton Photovoltaic Green Hydrogen Pilot Project Now Fully Built and Put into Production. Available online: http://www.sinopec.com/listco/en/media_centre/news/20230912/news_20230912_495398828564.shtml (accessed on 10 April 2024).
- Qu, M.; Ding, T.; Huang, L.; Wu, X. Toward a global green smart microgrid: An industrial park in China. IEEE Electrif. Mag. 2020, 8, 55–69. [Google Scholar] [CrossRef]
- Zhao, D.; Wang, H.; Huang, J.; Lin, X. Time-of-use pricing for energy storage investment. IEEE Trans. Smart Grid 2022, 13, 1165–1177. [Google Scholar] [CrossRef]
- Zou, Y.; Wang, Q.; Chi, Y.; Wang, J.; Lei, C.; Zhou, N.; Xia, Q. Electric load profile of 5G base station in distribution systems based on data flow analysis. IEEE Trans. Smart Grid 2022, 13, 2452–2466. [Google Scholar] [CrossRef]
- Smadi, A.A.; Ajao, B.T.; Johnson, B.K.; Lei, H.; Chakhchoukh, Y.; Abu Al-Haija, Q. A Comprehensive Survey on Cyber-Physical Smart Grid Testbed Architectures: Requirements and Challenges. Electronics 2021, 10, 1043. [Google Scholar] [CrossRef]
- Lu, Z.; Li, Z.; Guo, X.; Yang, B. Optimal Planning of Hybrid Electricity–Hydrogen Energy Storage System Considering Demand Response. Processes 2023, 11, 852. [Google Scholar] [CrossRef]
- Yigit, T.; Selamet, O.F. Mathematical modeling and dynamic Simulink simulation of high-pressure PEM electrolyzer system. Int. J. Hydrogen Energy 2016, 41, 13901–13914. [Google Scholar] [CrossRef]
- Yodwong, B.; Guilbert, D.; Phattanasak, M.; Kaewmanee, W.; Hinaje, M.; Vitale, G. Faraday’s Efficiency Modeling of a Proton Exchange Membrane Electrolyzer Based on Experimental Data. Energies 2020, 13, 4792. [Google Scholar] [CrossRef]
- Mazloomi, S.K.; Sulaiman, N. Influencing factors of water electrolysis electrical efficiency. Renew. Sustain. Energy Rev. 2012, 16, 4257–4263. [Google Scholar] [CrossRef]
- Toghyani, S.; Fakhradini, S.; Afshari, E.; Baniasadi, E.; Jamalabadi, M.Y.A.; Shadloo, M.S. Optimization of operating parameters of a polymer exchange membrane electrolyzer. Int. J. Hydrogen Energy 2019, 44, 6403–6414. [Google Scholar] [CrossRef]
- García-Miguel, P.L.C.; Zarilli, D.; Alonso-Martinez, J.; Plaza, M.G.; Gómez, S.A. Optimal Operation and Market Integration of a Hybrid Farm with Green Hydrogen and Energy Storage: A Stochastic Approach Considering Wind and Electricity Price Uncertainties. Sustainability 2024, 16, 2856. [Google Scholar] [CrossRef]
- Zhong, J.; Li, Y.; Wu, Y.; Cao, Y.; Li, Z.; Peng, Y.; Qiao, X.; Xu, X.; Yu, Q.; Yang, X.; et al. Optimal operation of energy hub: An integrated model combined distributionally robust optimization method with Stackelberg game. IEEE Trans. Sustain. Energy 2023, 14, 1835–1848. [Google Scholar] [CrossRef]
- Khalilpour, R.; Vassallo, A. Planning and operation scheduling of PV-battery systems: A novel methodology. Renew. Sustain. Energy Rev. 2016, 53, 194–208. [Google Scholar] [CrossRef]
- Li, P.; Wang, Z.; Wang, J.; Guo, T.; Yin, Y. A multi-time-space scale optimal operation strategy for a distributed integrated energy system. Appl. Energy 2021, 289, 116698. [Google Scholar] [CrossRef]
- Zou, Y.; Wang, Q.; Hu, B.; Chi, Y.; Zhou, G.; Xu, F.; Zhou, N.; Xia, Q. Hierarchical evaluation framework for coupling effect enhancement of renewable energy and thermal power coupling generation system. Int. J. Electr. Power Energy Syst. 2023, 146, 108717. [Google Scholar] [CrossRef]
- Ding, T.; Bo, R.; Gu, W.; Sun, H. Big-M based MIQP method for economic dispatch with disjoint prohibited zones. IEEE Trans. Power Syst. 2013, 29, 976–977. [Google Scholar] [CrossRef]
- Zhou, Y.; Wang, Q.; Huang, T.; Liao, J.; Chi, Y.; Zhou, N.; Xu, X.; Zhang, X. Convex optimal power flow based on power injection-based equations and its application in bipolar DC distribution network. Electr. Power Syst. Res. 2024, 230, 110271. [Google Scholar] [CrossRef]
- Gurobi. Available online: https://www.gurobi.com/ (accessed on 16 March 2024).
- Jiang, H.; Zhang, Y.; Muljadi, E. New Technologies for Power System Operation and Analysis; Academic Press: London, OH, USA, 2020; pp. 11–12. [Google Scholar]
- Sun, Y.; Zhao, Z.; Yang, M.; Jia, D.; Pei, W.; Xu, B. Overview of energy storage in renewable energy power fluctuation mitigation. CSEE J. Power Energy Syst. 2019, 6, 160–173. [Google Scholar]
- Liu, Z.; Yu, H.; Liu, R. A novel energy supply and demand matching model in park integrated energy system. Energy 2019, 176, 1007–1019. [Google Scholar] [CrossRef]
- Shi, Q.; Yang, P.; Tang, B.; Lin, J.; Yu, G.; Muyeen, S.M. Active distribution network type identification method of high proportion new energy power system based on source-load matching. Int. J. Electr. Power Energy Syst. 2023, 153, 109411. [Google Scholar] [CrossRef]
Disclaimer/Publisher’s Note: The statements, opinions and data contained in all publications are solely those of the individual author(s) and contributor(s) and not of MDPI and/or the editor(s). MDPI and/or the editor(s) disclaim responsibility for any injury to people or property resulting from any ideas, methods, instructions or products referred to in the content. |
© 2024 by the authors. Licensee MDPI, Basel, Switzerland. This article is an open access article distributed under the terms and conditions of the Creative Commons Attribution (CC BY) license (https://creativecommons.org/licenses/by/4.0/).