Article

A Sensor-Based Application for Eco-Driving Management in Short-Term Car Rentals

1
Chair of Operations Management, Poznan School of Logistics, 61-755 Poznan, Poland
2
Faculty of Engineering Management, Poznan University of Technology, 60-965 Poznan, Poland
3
Independent Researcher, 96-321 Żelechów, Poland
4
Rentis S.A., 62-081 Wysogotowo, Poland
*
Author to whom correspondence should be addressed.
Sustainability 2024, 16(9), 3805; https://doi.org/10.3390/su16093805
Submission received: 7 March 2024 / Revised: 18 April 2024 / Accepted: 26 April 2024 / Published: 1 May 2024

Abstract

:
How to reduce fuel consumption to mitigate CO2 emissions to the atmosphere and improve road safety is one of the priorities to be addressed in the field of transport in the European Union. Considering the trend towards more frequent car rentals, it seems important to encourage drivers to change their driving style to a more ecological and economic one. This can be achieved by a system (built of a sensor located in the car, analytical software in the cloud and a mobile application for displaying results) that analyzes driving style and tells the driver how to drive better. Solutions such as the car bus PCB, GSM/GPS modem and 3D sensors were used in the development of the sensor. The validation of the sensor and the development of the analytical system are based on tests carried out in road conditions and in a closed area. Graphical methods (box-plot charts), correlation analysis and testing statistical hypotheses using the Mann–Whitney method were used in the analysis of the test results. The developed sensor and the analytical system allow for identifying the driving style of drivers. This system, through the use of a sensor that allows for downloading data not only from the car’s CAN bus but also the forces acting on the vehicle, permits the checking of 14 driving parameters used to interpret the driver’s driving style.

1. Introduction

Reducing the environmental damage caused by road transport, the only transportation mode that has observed an increase in carbon dioxide emissions in recent years, is one of the key directives of the European Union under the EU’s long-term strategy for 2050—a climate-neutral Europe [1,2]. Because this mode of transport generates the largest amount of exhaust fumes affecting the atmosphere, reducing its harm caused not only by cargo but also by passenger transport, is one of the key objectives of the European Community and, at the same time, one of the important assumptions of the sustainable development policy. Sustainable development is one of the key principles that should guide UE countries [3,4]. It can be defined in the following three dimensions: (1) society—the need to provide current and future generations with access to natural goods, (2) economy—the use of available resources to implement more and more economically effective processes, and (3) environment—taking into account the consumption and rational managing of available resources while considering their carbon footprints [5].
While the European hybrid car market is slowly gaining the attention of consumers who have been driving internal combustion vehicles, so far, electric cars, because of the prohibitive prices of new models, are currently unavailable to a significant part of society [6]. Until Europe completely abandons combustion vehicles, the European Union will strive to reduce the harmfulness of road transport. It is obvious that the key aspect of the decrease in the amount of exhaust gas emissions is technological progress. However, currently, the conscious behavior of drivers has a key impact on the increase in the environmental performance of car transport. One of the ways to reduce the emission of car transport is precisely by following the principles of eco-driving. In addition, eco-driving not only reduces the amount of fuel consumed, directly causing an increase in economic benefits, but it also contributes to an increase in road safety [7].
This article will provide an impact analysis of sensor use and an application that analyses the driving style of short-term car rentals. The authors of this publication assume that using both the sensor and application will be useful in changing the behavior of drivers and increasing respect for the principles of eco-driving, which is an action promoted by the European Community.
By proposing the European Green Deal program, the European Union imposes a 90% reduction in greenhouse gas emissions emitted by transport in each member country. This assumption is planned to be achieved by 2050 in order to fulfill the requirements of sustainable development. This strategy contains pathways leading to a reduction in the harmfulness of various modes of transport. The first suggested method is to increase the level of multimodal transport use. The next path involves reducing the number of combustion vehicles as a result of increasing the use of hybrid and electric cars. However, this solution will require a significant reduction in the prices of new, greener cars so that more European citizens can afford them. The third solution involves the use of digital technological solutions supporting traffic management in the largest European agglomerations. Providing access to an application enables residents of European cities to have the infrastructure and tools to use short-term vehicle rental (part of the MaaS strategy—Mobility-as-a-Service) [3].
The need to reduce CO2 emissions caused mostly by road transport results not only from research conducted by the European Commission and guidelines adapted to their results but also from the characteristics of individual types of transport or the combustion standards of vehicles fulfilled by individual models. There is no doubt that residents of large cities most often choose road transport, which, according to the authors of the publication [8], provides them with a high degree of independence and mobility. Nevertheless, transport is a source of excessive emissions of harmful substances, increased vehicle traffic, increased noise and reduced road safety in large urban agglomerations [9]. Urban development leads to an increase in the number of public sector vehicles moving around a city, causing its uncontrolled growth. The most serious effects of the increase in the number of cars driving in large cities include, above all, an increase in pollution, which, considering the pro-ecological attitude of the EU, is one of the biggest problems. The constant increase in noise levels, which significantly affects the lives of residents, is also becoming problematic. Due to traffic intensity, there is also a noticeable increase in the accident rate [10,11]. Road transport, the most harmful mode of transport, is responsible for 75% of CO emissions, 40% of HC emissions and 48% of NOx emissions in European countries. In Brazil, road transport is responsible for 90% of CO emissions and 80–90% of HC and NOx emissions in total [12]. The effects of excessive traffic also include significantly elevated noise levels, which was indicated by several authors [8,9,13,14,15]. Moreover, noise caused by street traffic at a level of 30–65 dB can significantly worsen the quality of life of residents, causing, for example, sleep and concentration disorders or anger. Long-term exposure to noise levels of 65–90 dB may cause serious health problems such as increased blood pressure or increased heart rate [13]. Research performed in the publication [13] shows that noise caused by street traffic at the most intense times of the day may vary between 40 and 99 dB, which certainly affects residents.
The above analysis of publications relating to the harmful effects of road transport has identified many negative effects on the atmosphere and quality of life. It is undoubted that in order to fulfill the postulates of sustainable development promoted by the European Union and, above all, to reduce the harmfulness of road transport, it is necessary to limit the number of vehicles traveling in the largest urban agglomerations. The low affordability of hybrid or electric vehicles will not allow for a drastic reduction in the number of combustion vehicles traveling on European roads, and thus, it will be impossible to reduce the emission of substances harmful to the atmosphere and to increase the environmental friendliness of car transport in a short time. It is necessary to use solutions that will allow for a significant reduction in emissions in a short time until the availability of zero-emission vehicles on the market of both new and used vehicles is increased.
One of the ways to reduce the number of combustion vehicles used in large Euro-pean cities, and thus reduce the amount of CO2 affecting the atmosphere, is to increase the use of short-term vehicle rentals for both passenger cars and trucks.
The number of vehicles traveling on city streets, which increases year by year, generates a very high volume of road traffic, especially during rush hours. In addition to the obvious ecological and social effects felt by city residents, it should be noted that many of these vehicles are parked idle under the workplace or home of city dwellers during most of the day. The segment or dimensions of private users’ vehicles most often exceed the requirements and needs of their owners, thus generating much higher operating costs and being characterized by much higher fuel consumption. As the vehicle class, size and engine capacity increase, insurance and maintenance fees also grow. The use of short-term rental vehicles could significantly reduce these costs. Residents could rent a car that meets their expectations, depending on whether they are moving to an urban or non-urban area. This solution is called Shared Mobility [16,17].
The mere provision of short-term rental vehicles is not a solution that reduces the use of private-sector vehicles. In addition, the following are also required to be provided: adequate urban infrastructure, the appropriate number of vehicles and a well-balanced vehicle distribution system. A very important variable that increases the chance of success of carsharing and car rental is the maximization of vehicle use in the Mobility-on-Demand service. Drivers will decide to resign from private vehicles only when the use of a short-term rental will not result in the loss or deterioration of their mobility [18,19].
In the literature on the subject, there are some examples of vehicle usage impact analysis as part of short-term rental on increasing the trafficability performance of streets in large cities and reducing the use of private sector vehicles, which directly translates into a reduction in the emissions of car transport. The analysis of this phenomenon conducted in the Italian capital in 2012 allowed for estimating a nearly 50% decrease in the harmfulness of car transport on the environment [20]. Similar research was carried out in 2014 in the Portuguese capital, Lisbon. The implementation of Mobility-on-Demand solutions allowed for reducing the use of taxis by about 17% and public sector vehicles by 21% [21]. Dutch cities with a nearly 30% decrease in the use of private vehicles were also analyzed [22], and in Germany, similar analyses showed that nearly 12% of vehicles have disappeared from the streets of German cities [23].
The above examples show that the use of short-term rentals contributes to reducing the number of private-sector vehicles. In the opinion of the authors of this paper, however, it is important to notice additional opportunities that are associated with the use of vehicles as part of car rentals. The use of the sensor presented in the fourth section of this article allowed us to collect data on 14 driving parameters. The analysis of these variables enabled the development of an algorithm that provides tips to drivers using rented vehicles on how to drive more ecologically and economically. A mere increase in the use of vehicles under short-term rental may contribute to a reduction in the harmfulness of car transport, so the compliance of these drivers with the principles of ecological, economic and safe driving may significantly accelerate a decline in the emission of vehicles used under car rental.
The benefits of eco-driving are being considered by many authors increasingly. Eco-driving is a concept that covers changes in drivers’ behavior, the aim of which is to reduce the emission of substances harmful to the atmosphere by reducing fuel consumption. This action also allows for an increase in economic benefits and may also contribute to an increase in road safety. Examples of behaviors that fit into the concept of eco-driving include driving at a constant speed, no sudden acceleration or braking, avoiding stopping with the engine on, checking tire pressure, etc. [24]. By adhering to eco-driving principles, drivers can achieve significant benefits. It is estimated that the use of eco-driving allows for reducing fuel consumption by about 15–25%, which translates into a nearly 30% decrease in greenhouse gas emissions. For comparison, switching from a combustion vehicle to a vehicle with a significantly reduced emission level allows for reducing fuel consumption by only 10–12%, which is a significantly worse result than applying the principle of eco-driving [25]. A solution that can significantly contribute to an even greater reduction in fuel consumption and, consequently, an increase in the environmental performance of car transport, may therefore be a change in car driver behavior, which can be achieved by respecting the principles of eco-driving and thus the use of vehicles equipped with very ecological propulsion units, i.e., hybrid and electric vehicles. The combination of the latest technology and changes in driver behavior may, according to the authors of [26], contribute to reducing fuel consumption by up to 40–45%. Because of the fact that the car-sharing and car rental industry is characterized by the use of new, often technologically advanced vehicles, including hybrid and electric vehicles [27], the benefits of the increased interest in short-term rental may allow for smoother road traffic in large cities as a result of reducing the number of private-sector vehicles, consequently also contributing to lower fuel consumption by cab drivers and following the eco-driving principles.
The main aim of this paper is to validate the IoT system used to identify drivers’ driving styles and eco-driving management.
The supporting aims are as follows:
  • Identification of driving parameters that will enable the determination of driving style;
  • The analysis of the possibility of using IoT sensors for eco-driving management in short-term car rental companies.

2. Driving Style Management and Related Research

Before the authors of this paper analyzed the available publications, the concept of driving style management was defined. Driving style management focuses primarily on the identification and analysis of driver behavior in order to identify those aspects of their driving style that may generate financial losses, e.g., in the form of excessive fuel consumption, harm caused to the environment, e.g., due to excessively high fuel consumption, or that may be responsible for the deterioration of road safety, e.g., as a result of excessive speed or the use of an aggressive driving style. Driving style management allows for the proper identification of inappropriate behaviors, the elimination or improvement of which may contribute to an increase in the safety of drivers as well as an increase in the environmental friendliness and economy of driving as a result of lowering fuel consumption [28].
In the literature, you can find studies that interpreted driving style based on several parameters. Table 1 presents the results of the literature search in this area.
The authors of [31] proposed a driving style analysis system combined with gamification—GamECAR. An OBD II device installed in a car sends data to a database located in the cloud, with which the driver’s phone, a wearable device and weather, mapping and traffic tracking applications are also integrated. The system analyzes driving style and, after the end of the route, shows the driver how to improve eco-driving skills using the mobile application. The system uses additional incentives for drivers, such as rankings, rewards, daily challenges, etc., to improve their driving style. However, the article lacks unequivocal results showing to what extent the proposed solution contributed to the growth of drivers’ skills in terms of driving eco-friendliness [31]. Another example of the use of sensors for driving style management is the publication by D.A. Johnson and M.M. Trivedi [33]. The system they developed uses Dynamic Time Warping (DTW), as well as a smartphone with built-in sensors and functionalities, such as a gyroscope, magnetometer, GPS, accelerometer and video, which are used to sense, identify and record these activities without the need for external processing. Their research was aimed at verifying whether ordinary smartphone functionalities can replace professional tools and identify driver behavior in the following aspects:
  • Right and left turns (90 degrees);
  • U-turns (180 degrees);
  • Aggressive right and left turns (90 degrees);
  • Aggressive U-turns (180 degrees);
  • Aggressive acceleration and braking;
  • Aggressive lane change (right and left);
  • Device removal and excessive speed.
As a result, it turned out that an ordinary mobile phone can replace professional measuring tools such as an accelerometer, gyroscope, magnetometer, GPS, etc. [33].
Moreover, the authors of the publications [34,35] provided a comparative analysis of the research carried out so far and the methods of analyzing driving styles, most often identifying the behavior of drivers in three categories as follows: safe, neutral and dangerous.
Because of the fact that none of the publications mentioned above relate to the car rental industry, the authors of this article decided to analyze the possibility of measuring and analyzing 14 parameters of driver style when using short-term rental. A list of the 14 selected parameters that were used to identify driving style is presented in Table 2.

3. Materials and Methods

3.1. System Structure

As a result of the dynamic development of automotive telematics systems, in new terminals, more and more attention is being paid to issues related to the assessment of driving style. There are many technical solutions available on the market that attempt to analyze a driver’s driving style. The vast majority of these are based solely on overload and gyroscopic sensors. Sometimes these data are supplemented by basic parameters read from the vehicle CAN bus. However, such solutions have two major disadvantages as follows:
  • Overload and gyroscopic sensors only record changes in the parameters read, without giving any information about what is happening to the vehicle between the read changes;
  • The basic data read from the CAN bus gives only a picture of how the driver operates the power unit.
This does not provide enough information to assess a driver’s real driving style. To come closer to the real identification of a driver’s driving style, it is necessary to obtain information on whether the driver drives smoothly, properly selects gear ratios and maintains a safe distance from preceding vehicles as well as how often he/she uses cruise control and if he/she drives in city traffic, outside city traffic or on a highway. And further, there should be a rating system separate for each driving mode.
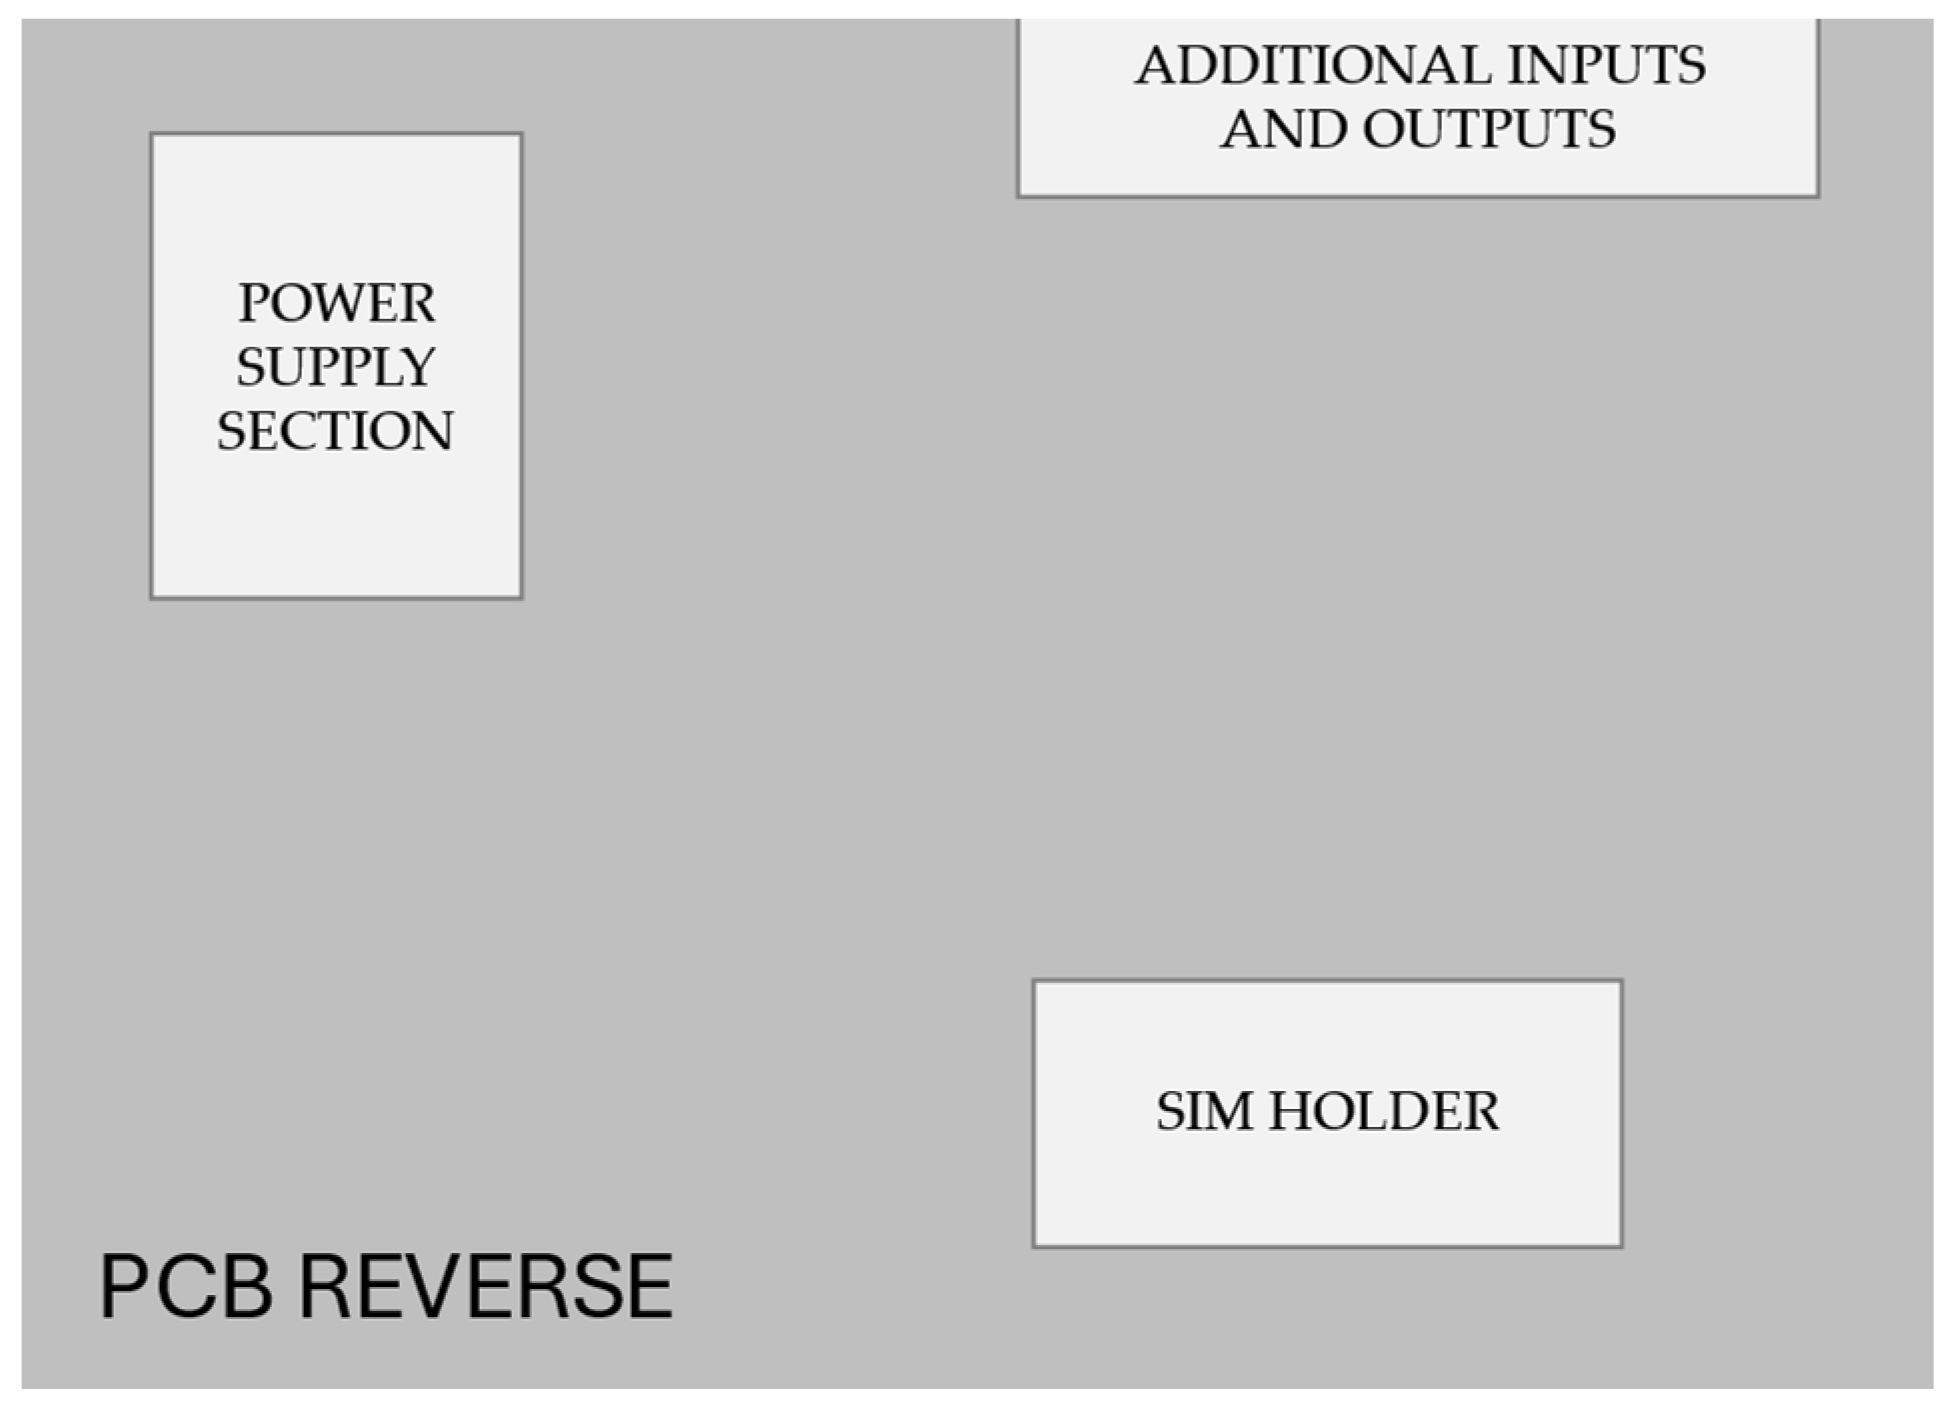
While designing the telematics terminal, only commonly available components were used. Such components include the following:
  • PCB;
  • A processor that provides the computing power to read and analyze data frames with a frequency of 0.01 s;
  • GSM/GPS modem;
  • Additional inputs and outputs;
  • CAN data readout module;
  • Three-dimensional sensors;
  • Power supply section.
Figure 1 and Figure 2 show a telematics terminal from the first test series.
In this project, the research team focused mostly on firmware dedicated to the terminal. Many algorithms were also designed. These algorithms based on data from the CAN bus, 3D sensors, and external data sources allowed for precise measurement of 15 driving style parameters, making up a total assessment of the driver’s driving style.
In Table 3, the measured parameters with their source are listed.
Testing of the implemented hardware solutions and innovative algorithms in the firmware showed that the driving style assessment identified by the telematics terminal coincides with the assessment reported by the test driver.

3.2. Validation Methodology

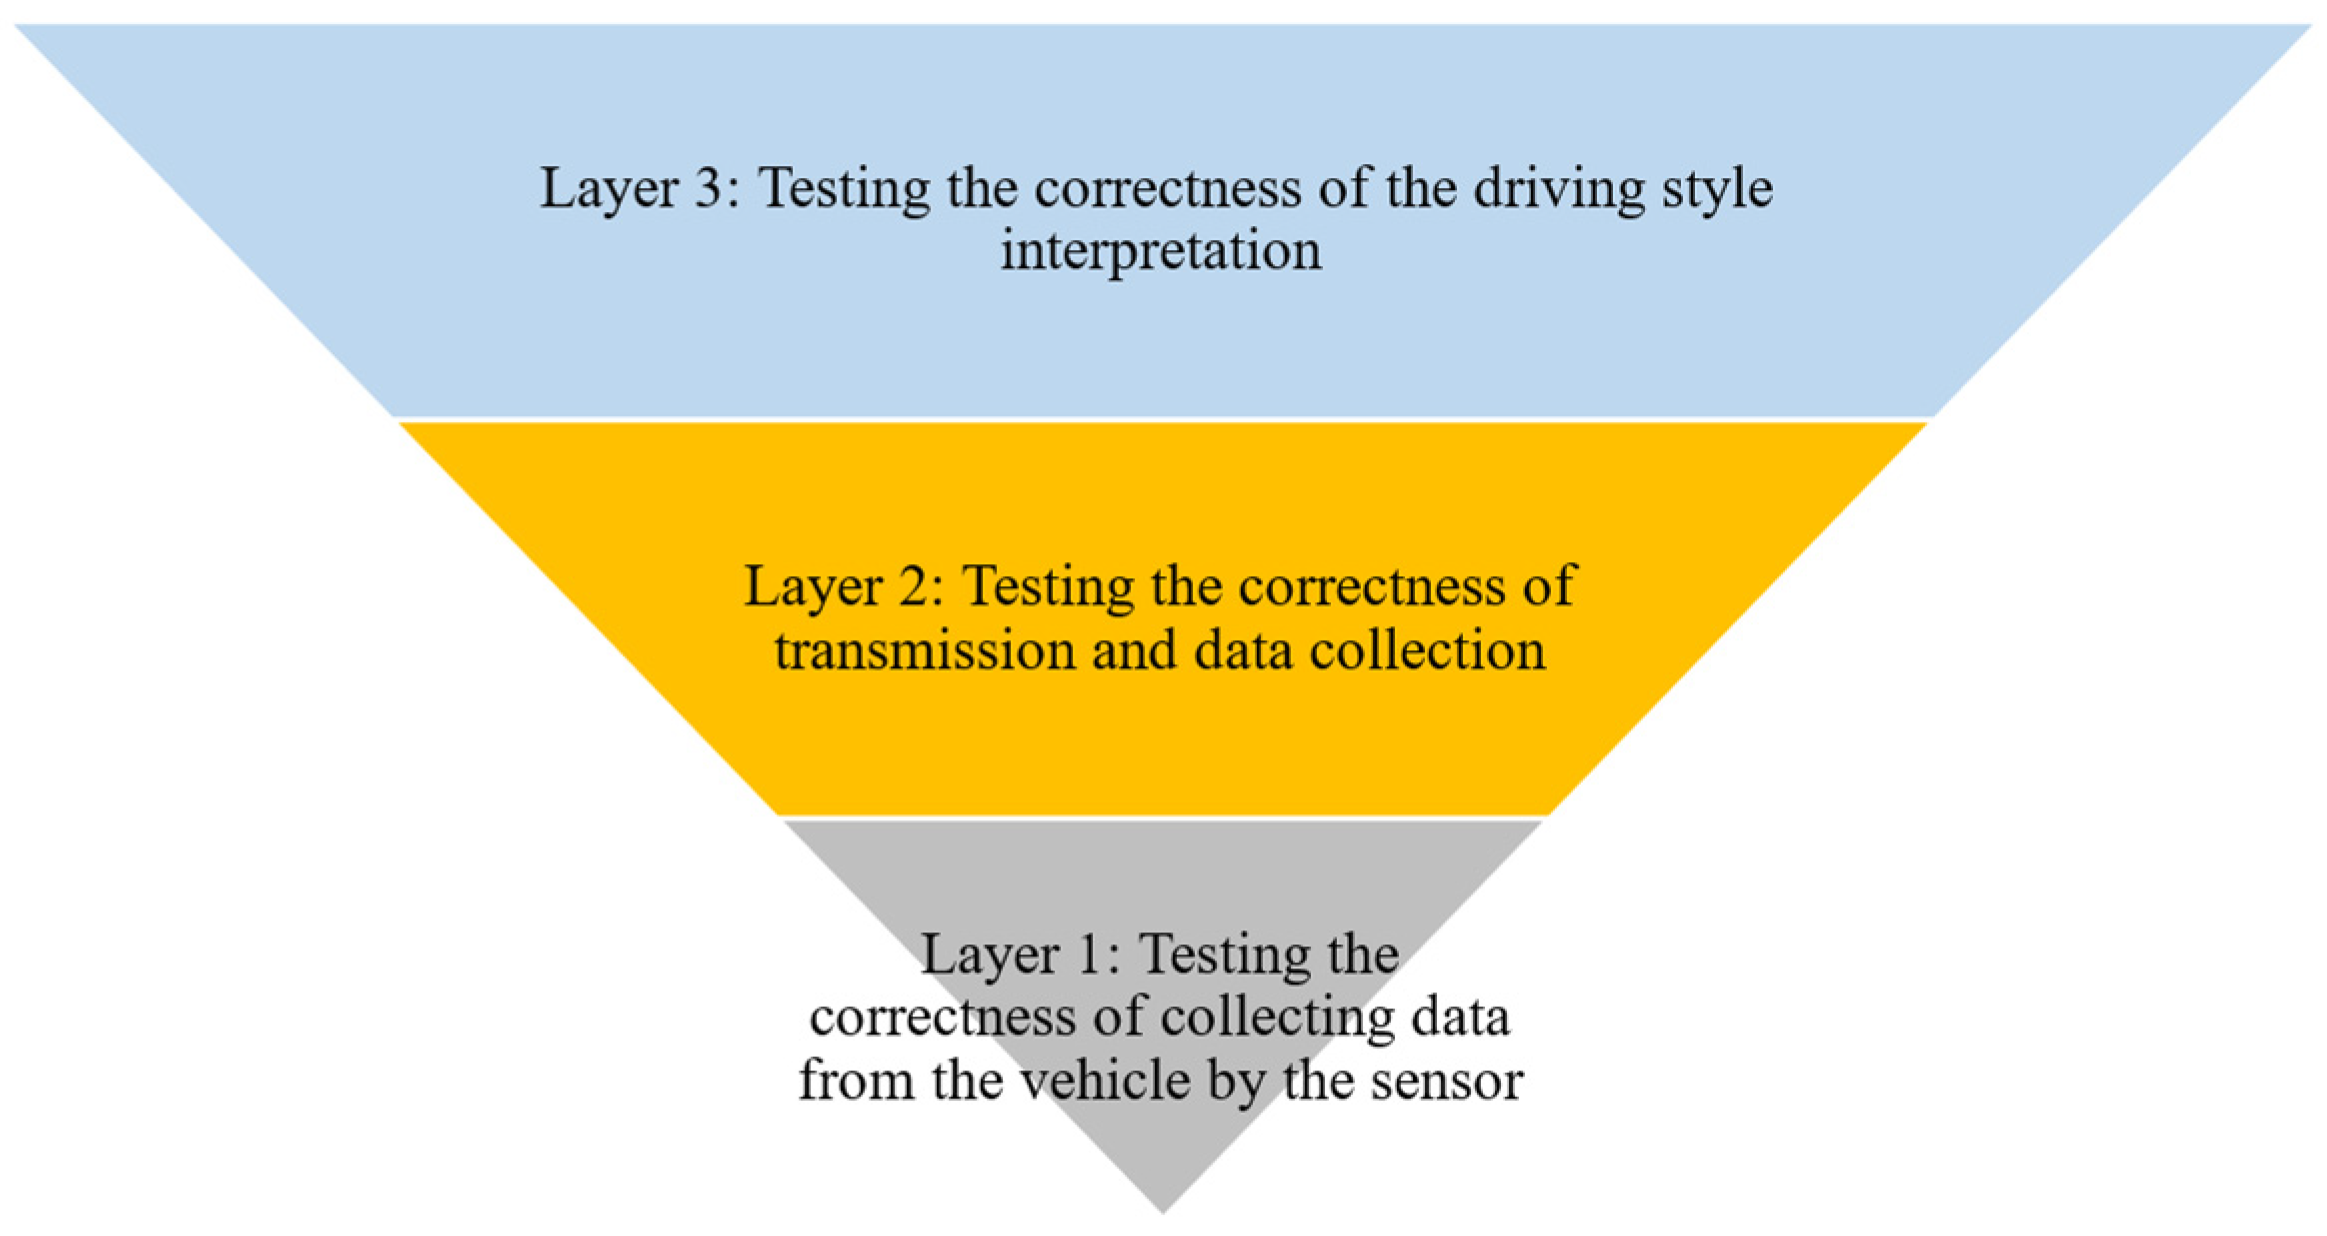
The validation of the analytical system based on the sensor was divided into three stages (layers). Each layer is responsible for the validation of a specific layer of the system. Figure 3 shows the validation methodology.
In the first layer, the correctness of collecting telematics data from the car was validated. The purpose of testing this layer of the solution is to make sure that the sensor correctly collects data from the CAN bus in the car and the sensors installed in it (including accelerometers). Positive detection of the sensor and the data collecting system is a necessary action to be able to continue the work. Lack of certainty about the correctness of the readings makes it impossible to test the entire solution. One sensor, which is still a prototype at this stage, was used for the validation of the first layer of the system.
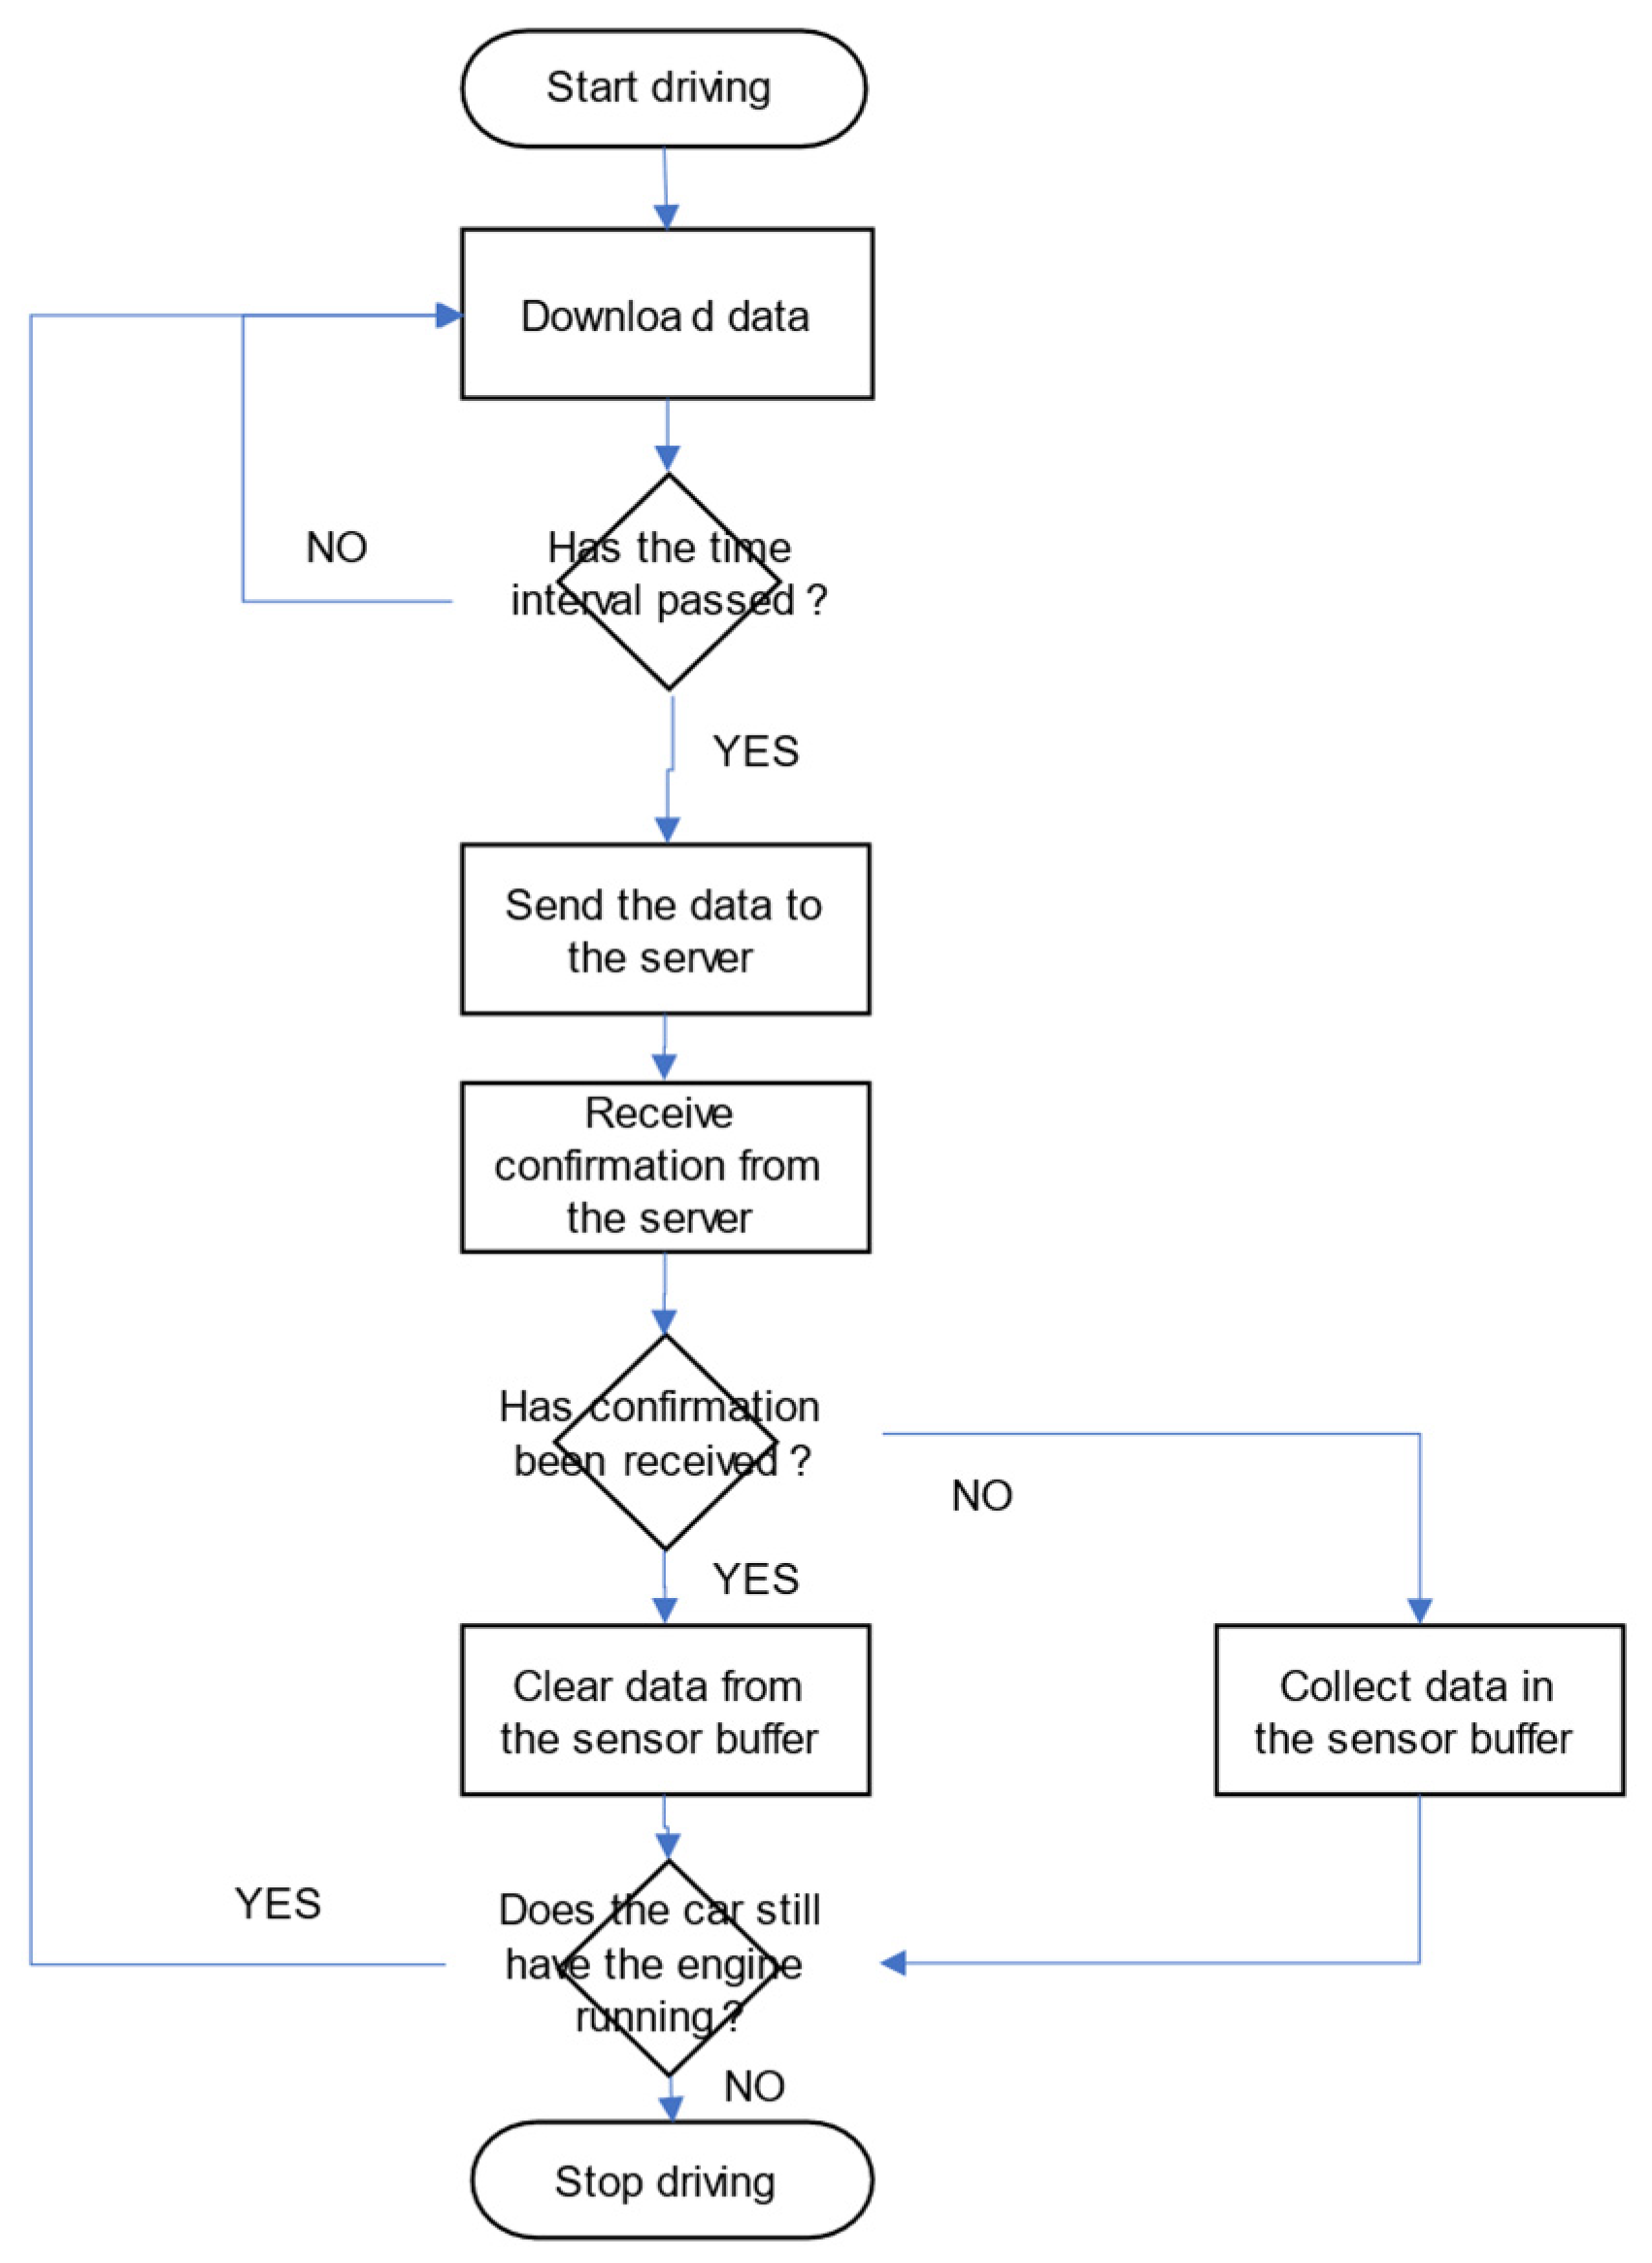
In the second layer, the mechanism of data transfer and collection was validated. Thus, it checked that all data from the sensor (in the form of frames (where a data frame is one record in the database and the data set of 14 driving style parameters is transferred to the database) were correctly sent and saved in the database of the analytical system. The validation of the second layer was carried out in parallel with the validation of the third layer, i.e., checking the correctness of the interpretation of the driving style. The data collected during test drives was not only checked for driving style ratings but also for completeness. For the purposes of validating the transmission and collecting data, a special solution was designed to minimize the risk of data loss. The algorithm for the described solution is shown in Figure 4.
In the third layer, as already mentioned, mainly, the functioning of the analytical system, whose task is to interpret the driver’s driving style, was checked. For this purpose, 120 test scenarios were developed. The number of scenarios results from the number of features and the states of those features in which the operation of the system was tested. The scenarios were realized with the use of five cars differing in size (segment), engine type (PB—gasoline engine, ON—diesel engine) and gearbox (MT manual transmission, AT—automatic transmission). The most important feature, however, was the driving style. The testers performed the rides in line with eco-driving suggestions or not in line with eco-driving suggestions. The mobile application, which was part of the developed system, provided testers with suggestions that were supposed to guide drivers towards eco-style driving. A detailed list of features and their states that make up the scenarios is presented in Table 4.
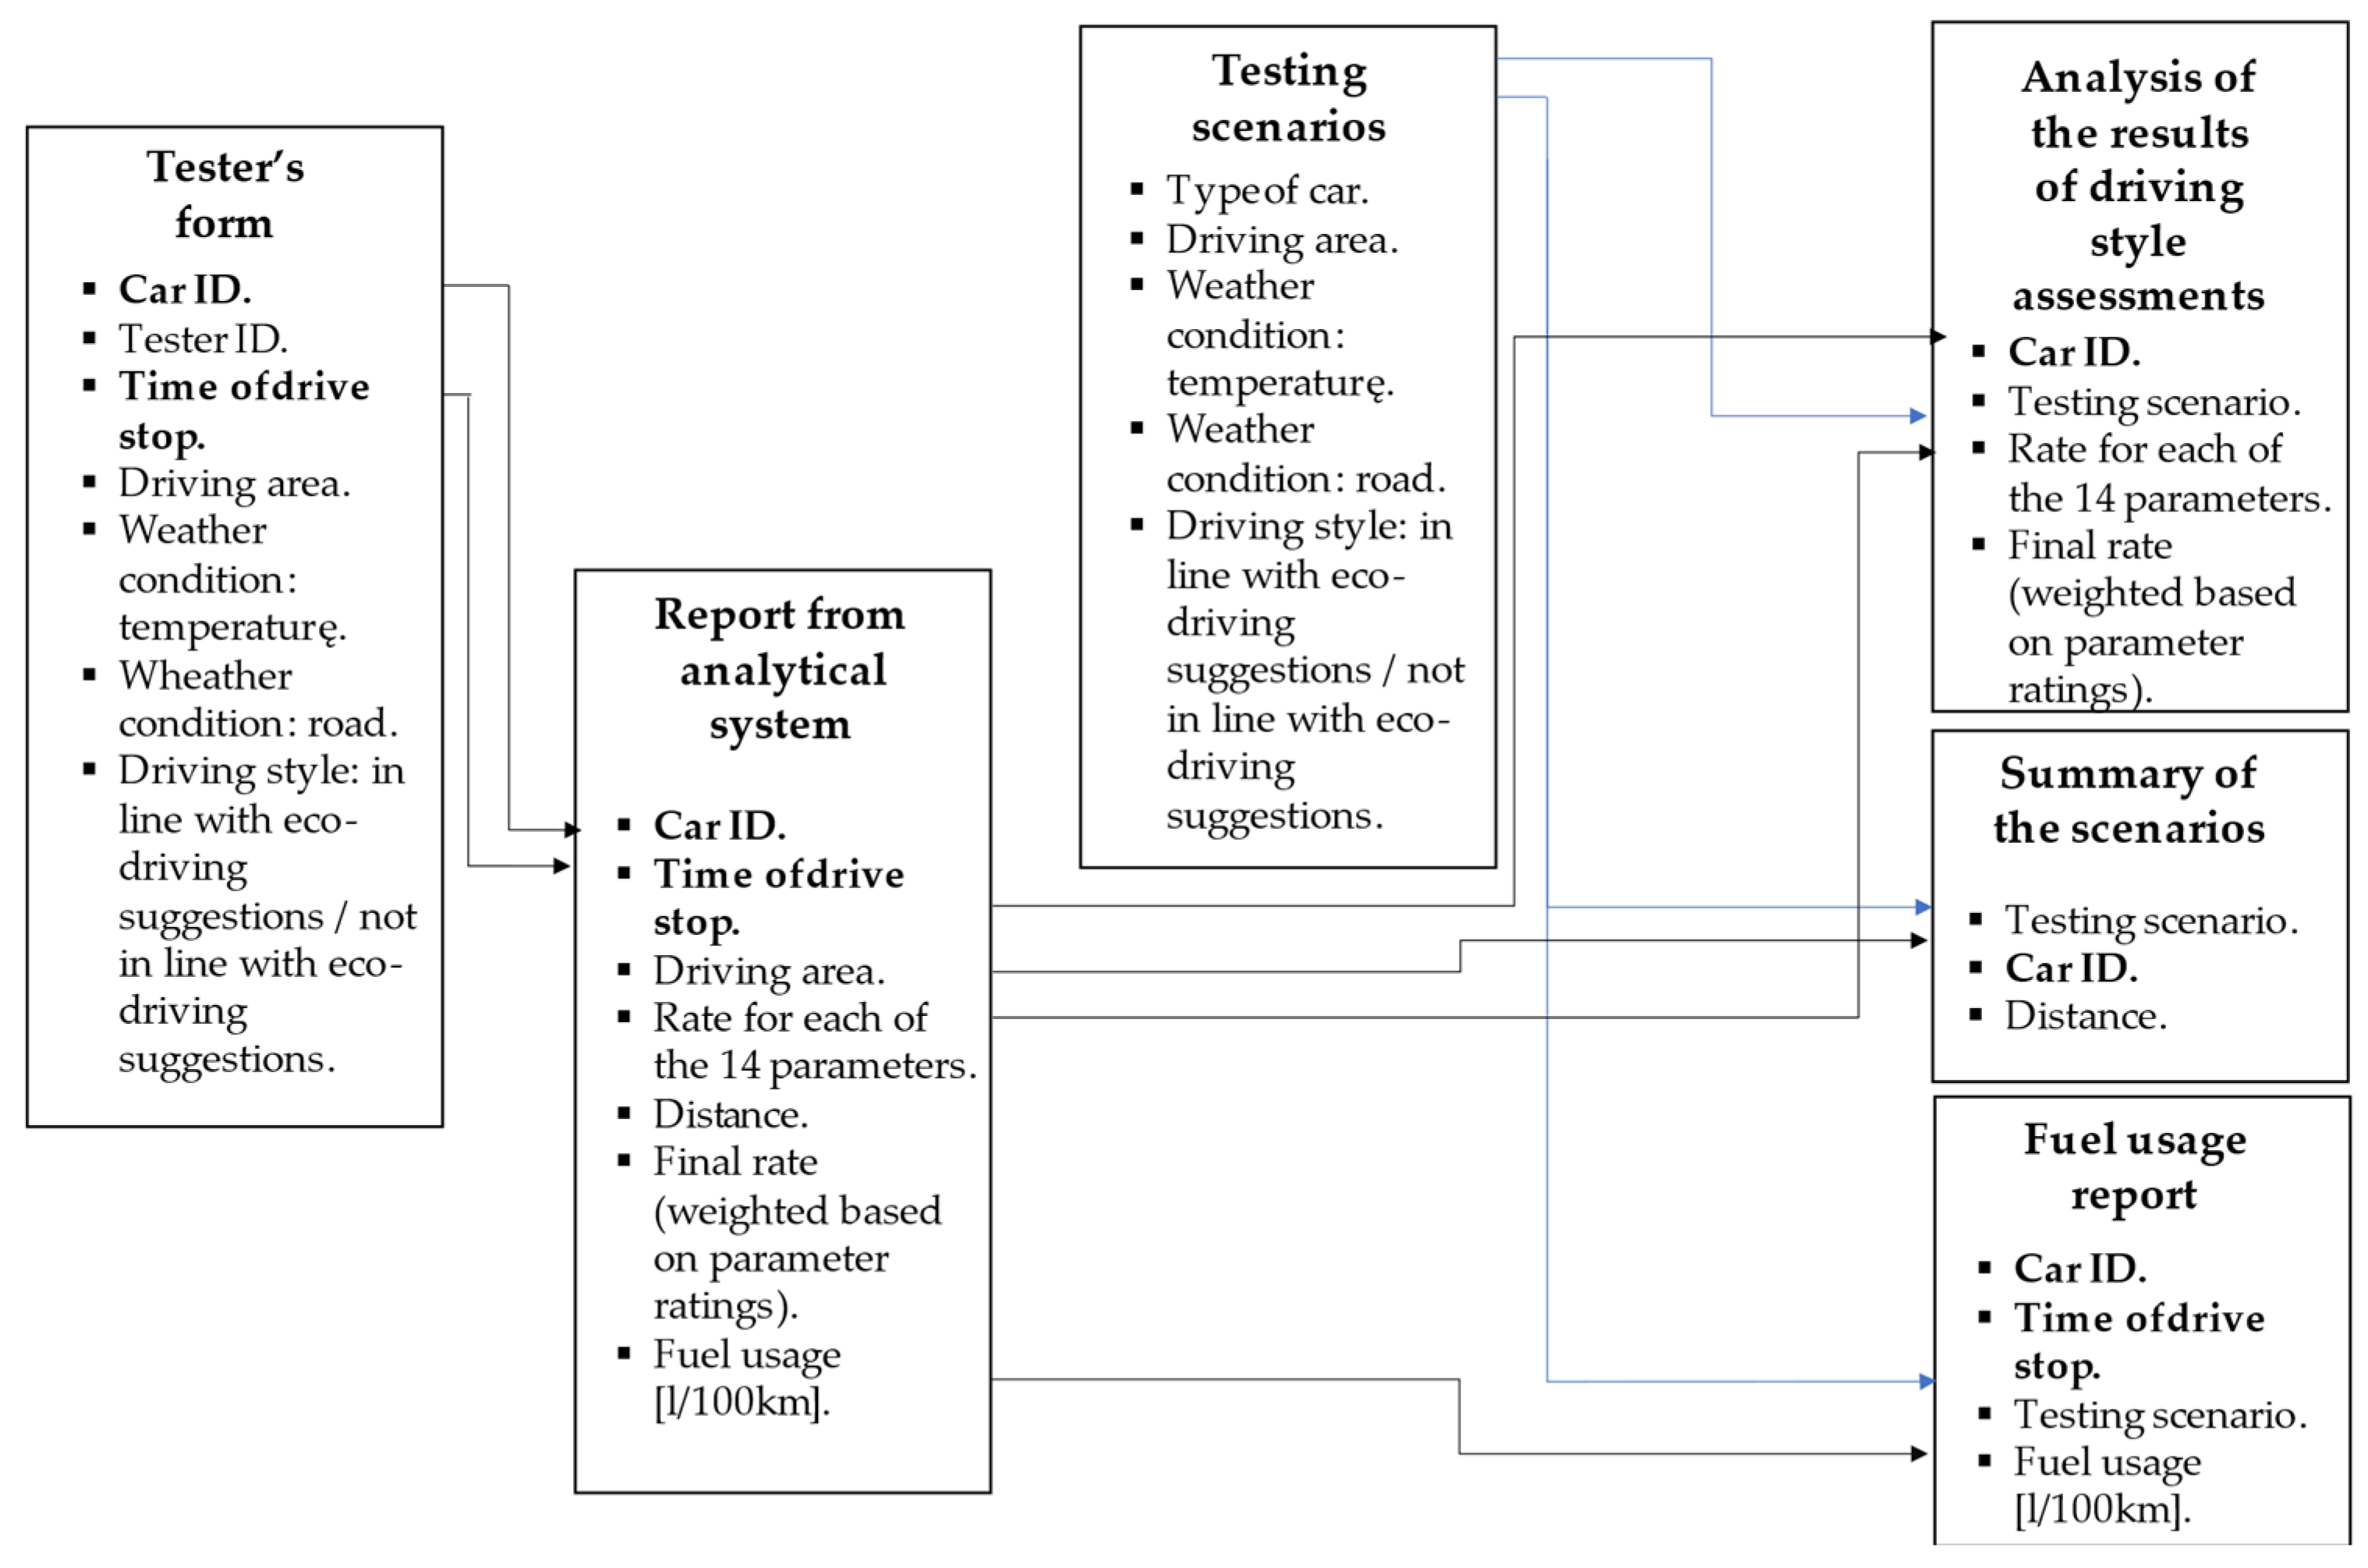
Testing in the third layer involved six drivers, five testers and one eco-driving expert (instructor of this driving style), who performed positioning tests with the following cars: Skoda Scala and BMW X1. It was assumed that each of the 120 scenarios (constituting combinations of states of the distinguished features) had to be performed at a distance of at least 10 km. Additionally, each of the five sensors (one sensor in each car) had to be tested at a minimum distance of 2000 km. Each tester was equipped with a form (in the form of a mobile application), which was used to determine his or her driving style and the status of other features. The diagram of the functioning of the electronic solution supporting testing in the third layer is shown in Figure 5.
The developed tool (a diagram of which is presented in Figure 5) combines the testers’ declarations regarding the state of features (driving style, the car they were driving, the area in which they were driving and weather conditions) with the data collected in the analytical system (driving style ratings). The result of the tool was a report on the implementation of test scenarios, assigning ratings for individual drives to the weather conditions and the tester’s driving style (in line with eco-driving suggestions or not in line with eco-driving suggestions).

4. Results Analysis

According to the methodology described for the first layer, the correctness of the data collection by the sensor (prototype) installed in the Skoda Scala car was tested. Tests were performed in many dimensions as follows:
  • Testing the GPS transmitter—the route traveled by the vehicle is reflected on the map;
  • Testing on a parked car—testing driving parameters such as stopping the car with the engine on (checking the correctness of recording the time when the car is parked with the engine on, testing the pressure on the accelerator pedal and recording RPMs);
  • Testing while driving—based on video recordings of test drives. The course of the test drive was recorded, and the readings of the devices installed in the car were compared with the data sent by the sensor and collected by the analytical system in the database. The following data were compared: RPM, speed, rapid acceleration, rapid braking, sharp turn, kickdown, idling, cruise control and driving mode (city, outside the city, highway).
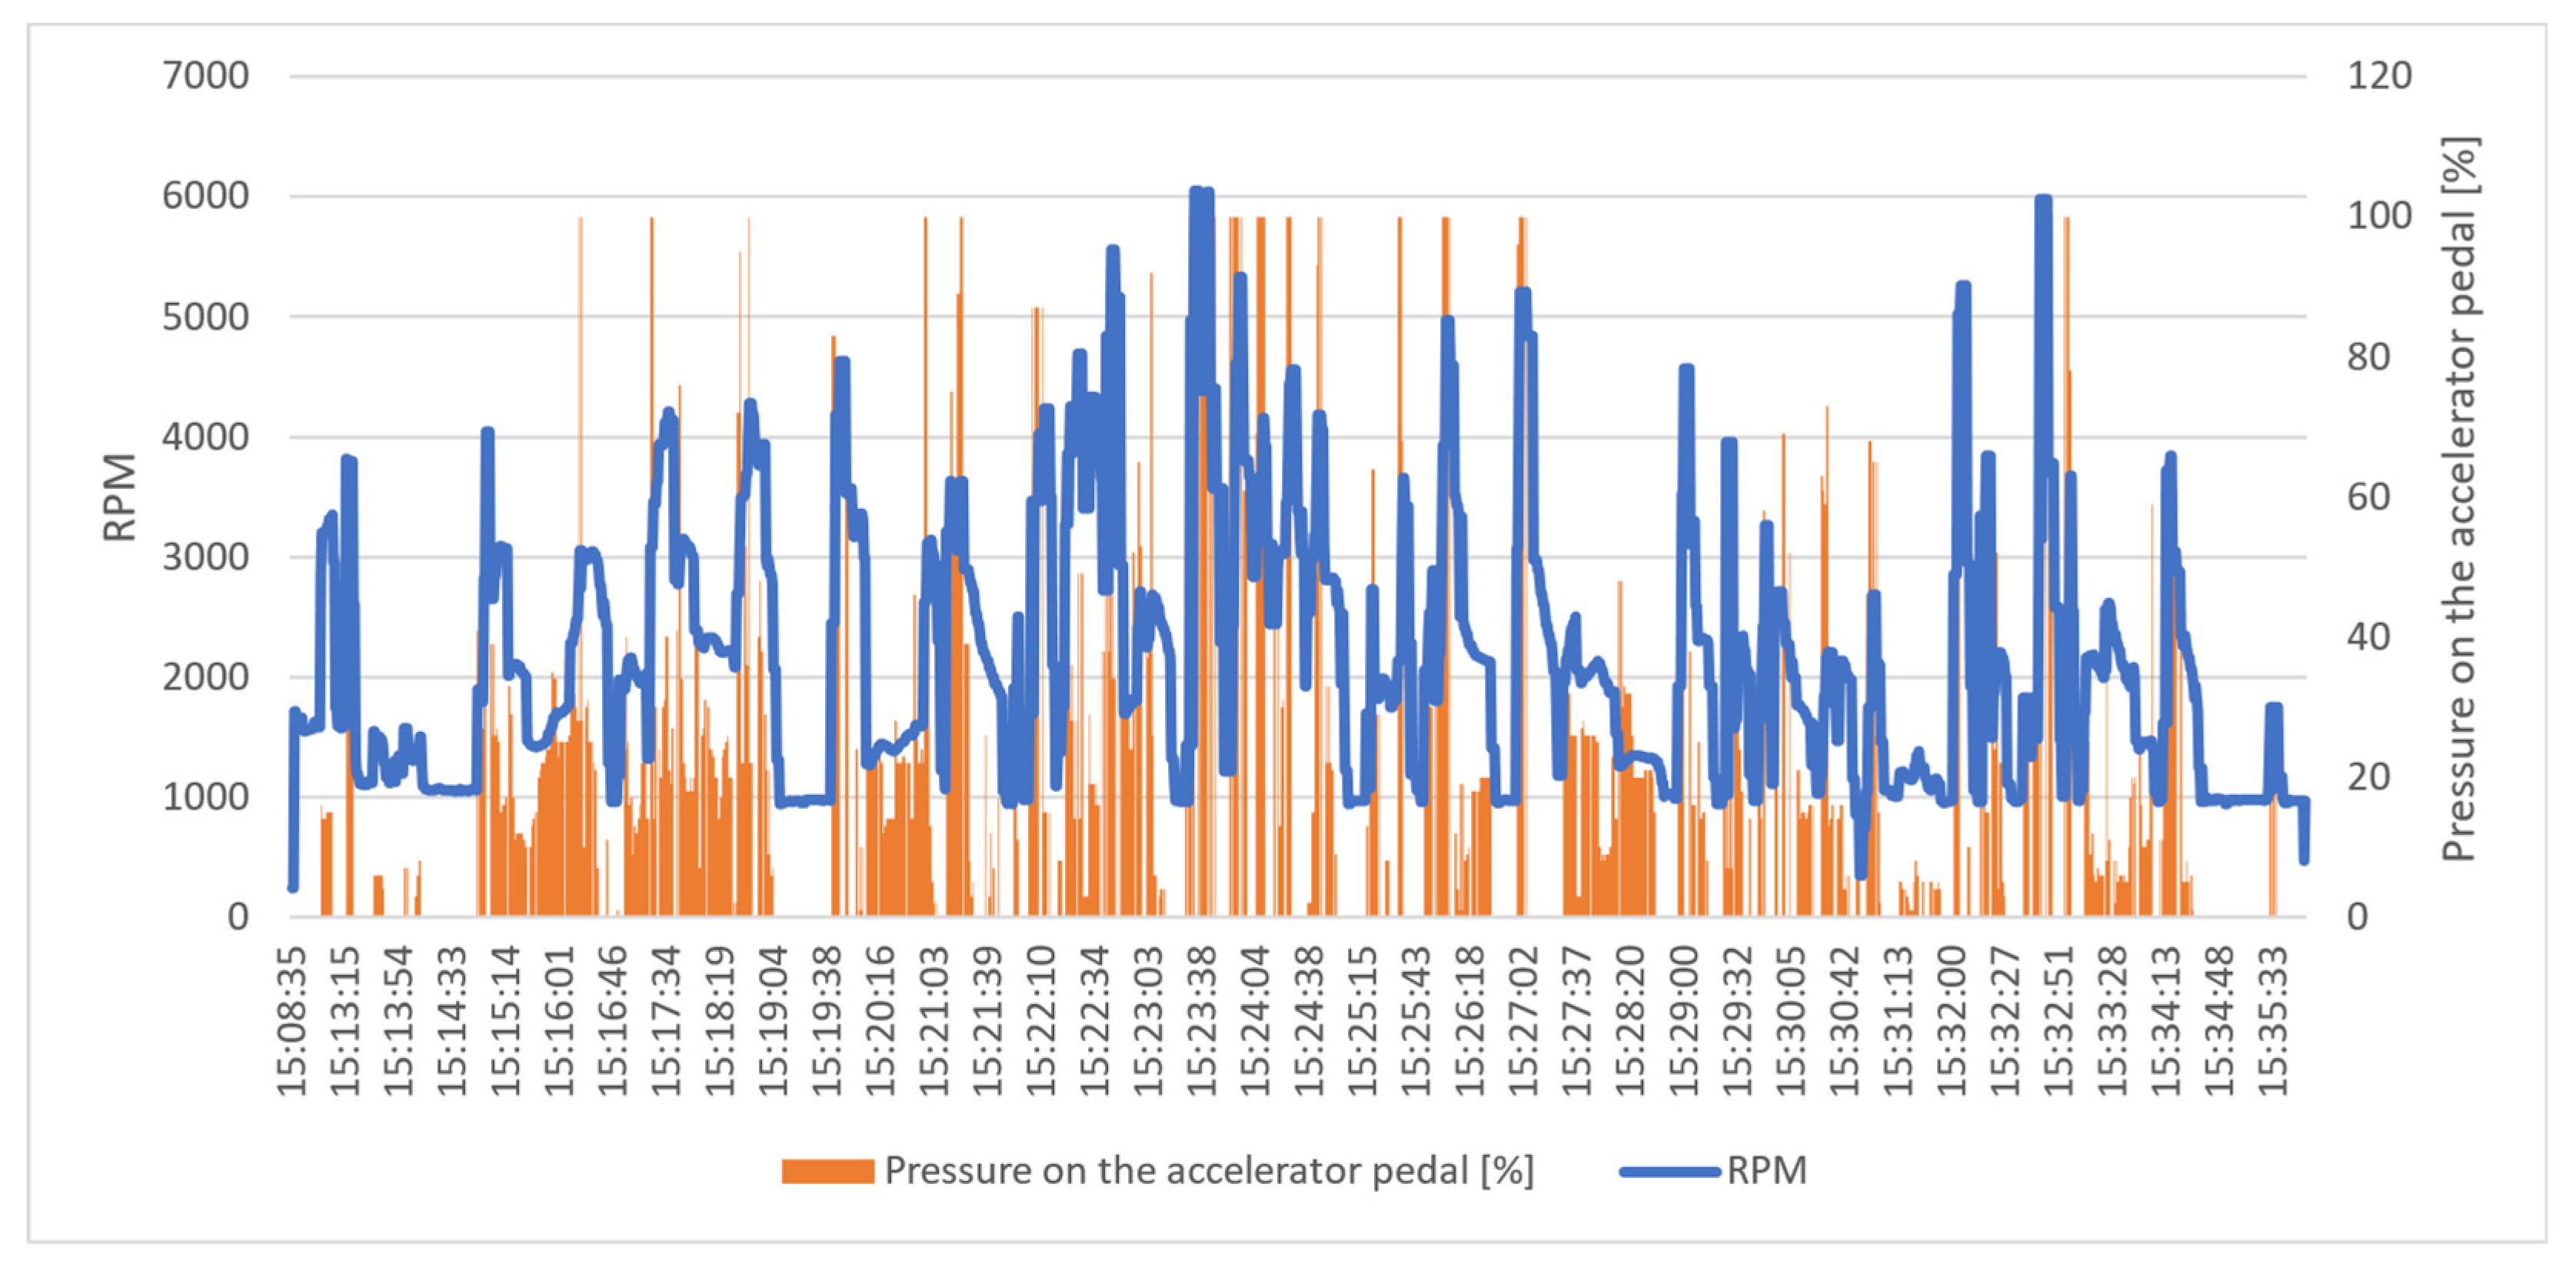
The tests described above were successful. The sensor records sent to the analytical system were determined to be correct. In addition, the relationships among the values of the selected parameters were also analyzed by looking for relationships in a graphical and static perspective (e.g., correlation). Figure 6 shows the relationship between the RPM and the pressure on the accelerator pedal.
As shown in Figure 6, there is a clear relationship between the pressure on the accelerator pedal and RPM. This logical relationship, as shown in the graph, shows that the data records from the sensor are correct.
Testing in the second layer was performed according to the methodology in parallel with the testing of the next layer. The purpose of testing in this layer was to check whether all data collected by the sensor was transmitted and saved in the database of the analytical system. In this case, the test scenario required checking whether all data frames sent by the sensor were saved in the database. The developed solution numbered the data frames generated by each sensor. On the server side, a script was developed to check if the numbering of the saved frames was correct. According to the results, each data frame was saved. Therefore, it can be concluded that the mechanism of transferring and confirming frames between the sensor and the server presented in this paper is an effective solution and eliminates the risk of data loss.
The purpose of testing in the third layer, in accordance with the developed methodology, was to check whether the analytical system correctly interprets a driver’s driving style in various road conditions (hence the need to implement as many as 120 test scenarios). Based on the complexity of the features and their states constituting the scenarios, it was found that a satisfactory level of test scenery implementation was their performance in 90% of the scenarios. The percentage of scenario implementation was determined by the ratio of the number of kilometers traveled in the given scenarios to their assumed number (according to the methodology, a minimum of 10 km was assumed for each scenario). A summary of the implementation of test scenarios is presented in Table 5.
The data presented in Table 5 show that the assumed number of scenarios was implemented during the tests. The only exception (% of scenario realization below the assumed level of 90%) concerns the sensor installed in the BMW 318GT. However, the missing 0.3% of the implemented scenarios did not affect the interpretation of the results, according to the team of researchers. Each of the sensors was tested at a distance significantly exceeding the assumed 2000 km.
In accordance with the assumptions of the third layer testing presented in the Materials and Methods Section, in addition to test rides implementing the defined scenarios, additional rides were also carried out to define the boundaries of the result space including the following:
  • Tests for 12 scenarios (combination of conditions: temperature, road surface and driving area) performed by an experienced eco-driving driver, which were performed with the BMW X1 (petrol engine, AT) and Skoda Scala (petrol engine, MT);
  • Closed track tests in which dangerous behavior was checked, where the tests were carried out on a dry surface at temperatures above 10 degrees in a Skoda Scala (petrol engine, MT).
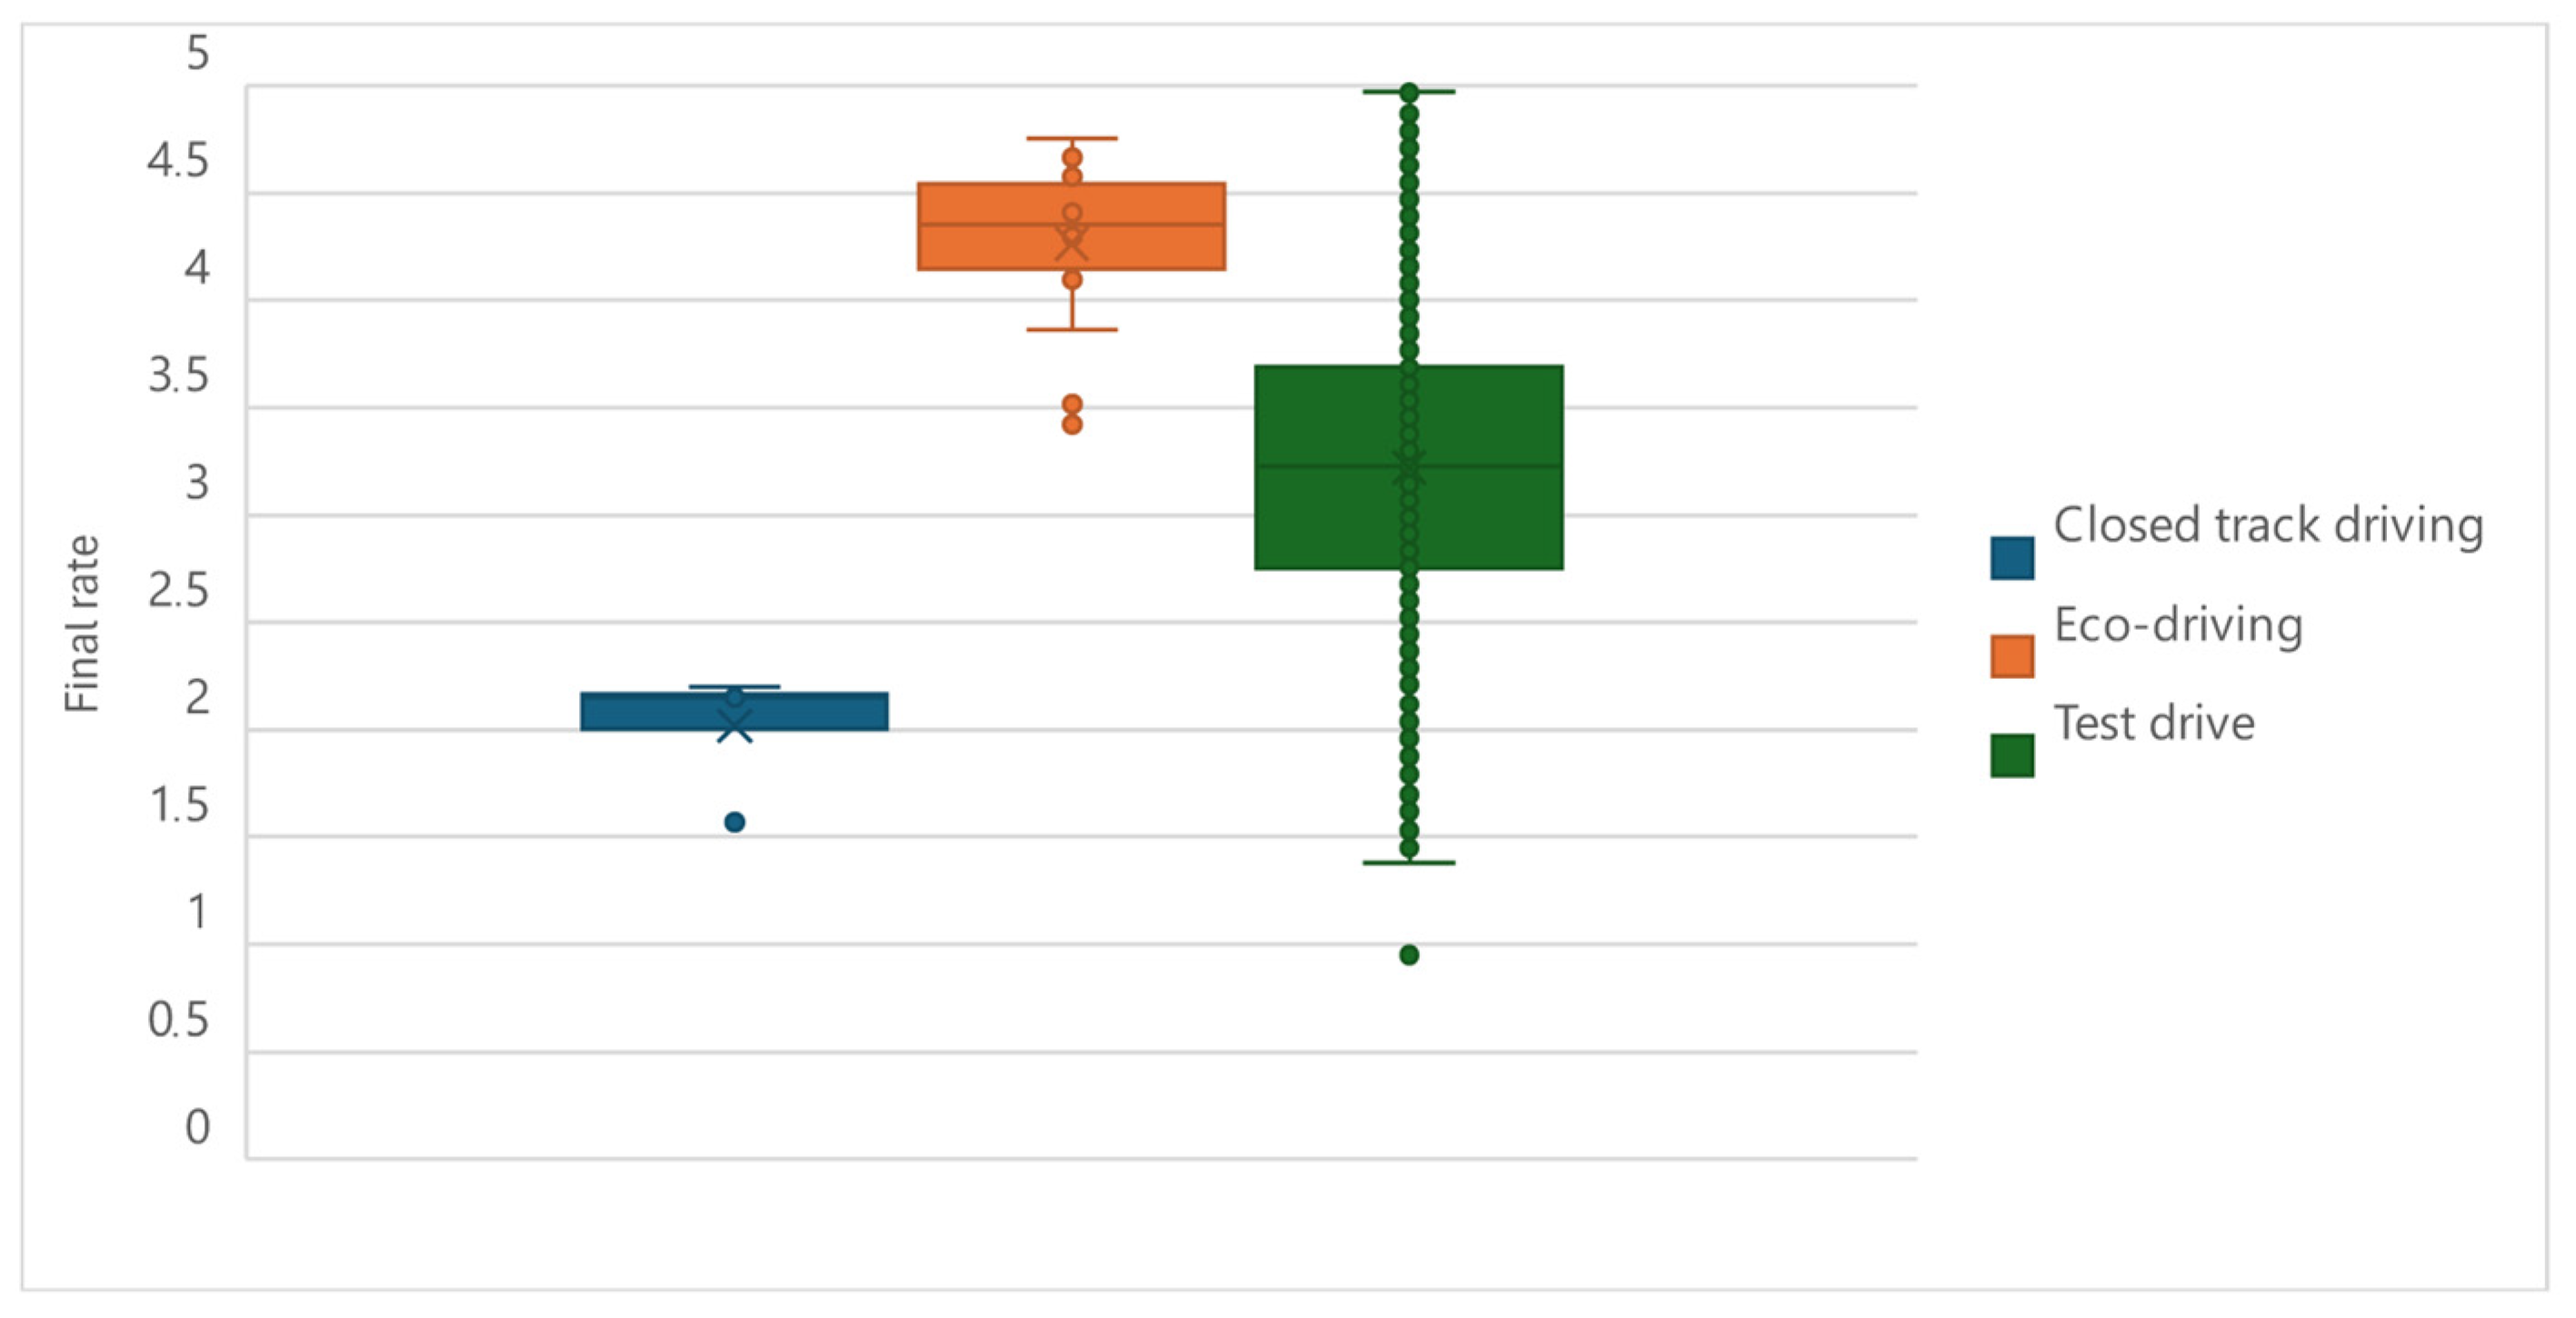
The analytical system, based on the data from the sensor installed in the car (signals from the CAN bus and accelerometers installed in it), calculates the rating of driving style on a scale from 0 (worst) to 5 (best) for each of the defined driving style parameters and the aggregated rating (weighted average of the ratings for all parameters). The distribution of aggregate ratings obtained for the rides made by the eco-driving instructor, test drives made by tests and closed track rides is shown in Figure 7.
The final rates obtained during the test drives show the correct interpretation of driving style. Rides made by an eco-driving instructor were characterized by the highest marks. The lowest scores were obtained when testing dangerous behaviors (rapid acceleration, rapid braking, sharp turn on a closed track). Among these ratings are those obtained during road tests. This logical sequence implies that the system correctly interprets the driving style.
For a more detailed analysis of the interpretation of driving style, the scores obtained for each of the 14 parameters were analyzed. The built-in analytical tool allowed for the verification, in any time interval, of the ratings obtained for each of the parameters, both globally (for the entire population of vehicles) and broken down into a specific vehicle, taking into account specific and test scenarios. Moreover, the tool was supported by a system of verification of the assumptions made. Table 6 presents the ratings for individual parameters in the period September 2020–March 2021 in all five cars. The table includes the ratings for driving in line with eco-driving suggestions and contrary to the suggestions of ecological driving.
Rides in line with eco-driving suggestions, in accordance with the adopted score, should receive higher rates. In Table 6, the rates that do not show this logical relationship are marked in red. The average rating for rides contrary to eco-driving suggestions is higher than for rides compliant with these suggestions. This difference is visible for the parameter engine braking. The rate is calculated based on the % of distance traveled by the car with the gear engaged and without pressing the accelerator pedal. The higher % of the distance traveled in this way for rides contrary to eco-driving suggestions is due to the higher speed and, therefore, greater momentum of the car. Thus, the driver could cover a longer distance with the engine braking than in the case of rides at much lower speeds (and, therefore, lower momentum). Hence, the difference in this parameter is not consistent with the assumptions.
In order to verify the statistical significance of the differences in ratings for compliance with and contrary to driving for each of the driving style parameters and average fuel consumption, statistical tests were carried out using the Mann–Whitney method. This method was chosen because of the lack of dependence between the samples, the ratio scale for the ratings and the lack of normality of the distribution of ratings for each of the analyzed parameters. Gray in Table 6 shows the values of the ratings that do not differ significantly from each other in a statistically significant manner (p-value for the Mann–Whitney test higher than the assumed significance level α = 0.05). A p-value higher than the assumed significance level provides support for the null hypothesis, which, for the Mann–Whitney test, means that the compared samples come from one population. This means that there is no statistically significant difference between them. Thus, it can be seen that the results for the parameters including idling, sharp turns, rapid braking and rapid acceleration do not differ significantly. The most important conclusion from the analysis is that the final rating and average fuel consumption show differences between driving compliant with and contrary to eco-driving suggestions in the assumed direction, which, in addition, are statistically significant.
Additionally, based on the collected data, it was checked whether the ratings calculated by the analytical system were sensitive to changing weather conditions. The verification was carried out using the Mann–Whitney method for the variable “final rating” in relation to the pavement variable, which provided support for the assumption of the null hypothesis that both samples come from one population (p-value = 0.8479, assuming the significance level 0.05). This means that the ratings obtained on the dry road do not differ statistically significantly from the ratings obtained on the wet road. The test carried out with the same method for the variable “final rating” against the variable temperature provided support for the assumption of the null hypothesis that both samples come from the same population (p-value = 0.4595 assuming a significance level of 0.05). This means that the ratings obtained at temperatures below 10 degrees Celsius do not differ statistically significantly from those obtained at temperatures above 10 degrees. Thus, the ratings are not sensitive to weather conditions.

5. Discussion

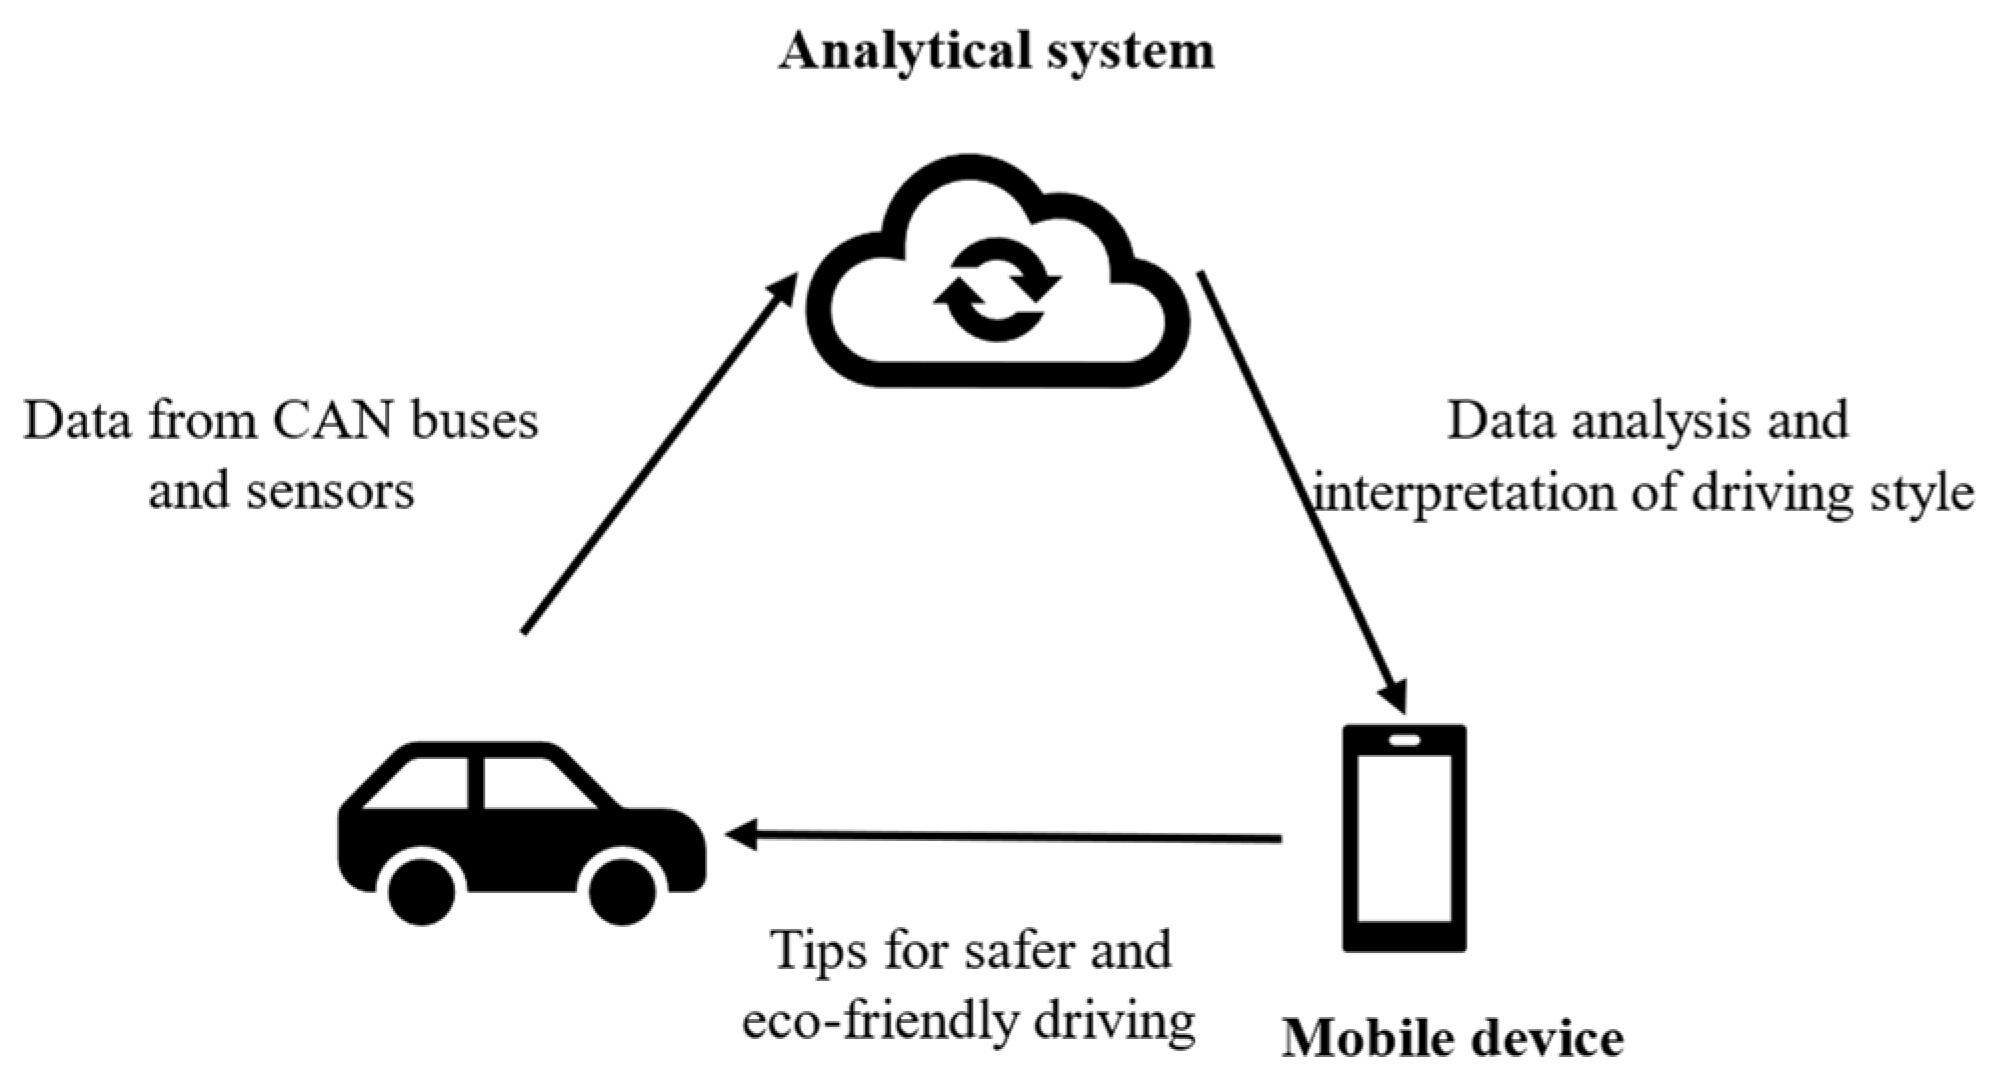
The need to promote eco-driving is related to several reasons, which were presented in the introduction to the literature provided in this study. According to the authors, promoting this driving style is particularly important among drivers who drive rented cars. According to the available data, these drivers drive rental cars much more aggressively than drivers driving their own cars. This style of driving causes not only greater danger on the road but also greater fuel consumption and greater emission of CO2 into the atmosphere. It is only possible to encourage drivers who rent a car to practice eco-friendly driving when their driving style has been identified. For this purpose, it is essential to develop a system that allows, on the one hand, the collection of data about the car and, on the other hand, the processing of these data for the assessment of driving style (data interpretation) and sending of instructions to drivers. A schematic presentation of such a system is shown in Figure 8.
The presented system provides drivers with tips on how to drive in a safer and more environmentally friendly manner (eco-driving style). An important issue that is not discussed in this publication is the development of a system of business incentives for car rentals. The benefits they can obtain from eco-driving should encourage them to drive safely and reduce fuel consumption and thus CO2 emissions.

6. Conclusions

This article presents the concept of a system that analyzes the driving style of drivers who rent cars. The analytical system is based on a specially designed IoT sensor that allows for data to be downloaded at high frequency from the CAN bus of the car and accelerometers installed in it. The main aim of this paper is to validate the IoT system used to identify a driver’s driving style and eco-driving management. The concept of three-step validation allowed for a multidimensional analysis of both the device (sensor) and the analytical system. The validation included aspects of the system functionality such as the correct reading of data from the CAN bus and vehicle condition, both when the car is parked and in traffic, data transmission and collection, as well as data interpretation and evaluation calculation. The described methodology was used to validate the presented system. It was positively validated. The obtained grades were in line with the assumed direction. A correct interpretation of driving style allows companies specializing in short-term car rental to create a system of incentives for customers. This incentive system should encourage customers to drive in an eco-friendly manner. Thus, the developed solution makes it possible to manage drivers’ driving styles.
The limitation of the conducted research is the implementation of sensors only in cars with combustion engines (gasoline and diesel).
In a later stage of this research, our team plans to implement the analyzed system based on the designed sensor for the entire fleet of one car rental company (short- and medium-term rental). Thanks to this, it will be possible to effectively monitor the driving style of drivers and reward those who drive in an ecological and safe manner.

7. Patents

Patent application no EP22170593.2 Title: Integrated system and method of analyzing vehicle operating parameters.

Author Contributions

Conceptualization, M.T. and Ł.N.; methodology, P.C. and M.A.; software, Ł.N.; validation, Ł.N. and M.A.; formal analysis, M.A.; investigation, M.T.; resources, A.T.-W. and Ł.N.; data curation, A.T.-W. and M.A.; writing—original draft preparation, A.T.-W.; writing—review and editing, A.T.-W.; visualization, M.A. and Ł.N.; supervision, P.C.; project administration, A.T.-W.; funding acquisition, M.T. All authors have read and agreed to the published version of the manuscript.

Funding

This research was funded by “THE NATIONAL CENTRE FOR RESEARCH AND DEVELOPMENT” in Poland, grant number: POIR.01.01.01-00-0431/19 “Development of technology and tools in the field of car telematics for intelligent reading of advanced driving parameters and reconstruction of the course of road accidents”. Article Processing Charges was cofinanced by: Faculty of Engineering Management, Poznan University of Technology (grant no.: 0812/SBAD/4218) and Poznan School of Logistics (own funds).

Institutional Review Board Statement

Not applicable.

Informed Consent Statement

Not applicable.

Data Availability Statement

Conflicts of Interest

The authors declare no conflicts of interest.

References

  1. Cichosz, S.M.; Pluta-Zaremba, A. How to improve freight transport emission’ management? LogForum 2019, 15, 93–105. [Google Scholar] [CrossRef]
  2. European Commission. A Roadmap for Moving to a Competitive Low Carbon Economy in 2050. In Communication from the commission to the European Parliament, the Council, the European Economic and Social Committee and the Committee of the Regions; European Commission: Brussels, Belgium, 2011; pp. 1–15. [Google Scholar]
  3. European Commission. A European Strategy for Low-Emission Mobility. In Communication from the Commission to the European Parliament, the Council, the European Economic and Social Committee and the Committee of the Regions; European Commission: Brussels, Belgium, 2016; pp. 1–13. [Google Scholar]
  4. Pająk, M.; Cyplik, P. Truck platooning in the context of sustainable development’s targets defined in European Union’s strategies. LogForum 2020, 16, 311–321. [Google Scholar] [CrossRef]
  5. Mosaberpanah, M.A.; Darban Khales, S. The Role of Transportation in Sustainable Development. In ICSDEC 2012: Developing the Frontier of Sustainable Design, Engineering, and Construction, Fort Worth, TX, USA, 7–9 November 2012; Chong, W.K.O., Gong, J., Chang, J., Siddiqui, M.K., Eds.; American Society of Civil Engineers: Reston, VA, USA, 2012; pp. 441–448. [Google Scholar] [CrossRef]
  6. Casals, L.C.; Martinez-Laserna, E.; García, B.A.; Nieto, N. Sustainability analysis of the electric vehicle use in Europe for CO2 emission reduction. J. Clean. Prod. 2016, 127, 425–437. [Google Scholar] [CrossRef]
  7. Huang, Y.; Ng, E.C.Y.; Zhou, J.L.; Surawski, N.C.; Chan, E.F.C.; Hong, G. Eco-driving technology for sustainable road transport: A review. Renew. Sustain. Energy Rev. 2018, 93, 596–609. [Google Scholar] [CrossRef]
  8. Nejadkoorki, F.; Yousefi, E.; Naserip, F. Analysing street traffic noise pollution in the city of Yazd, Iran. J. Environ. Health Sci. Eng. 2010, 7, 53–62. [Google Scholar]
  9. Jacyna, M.; Wasiak, M.; Lewczuk, K.; Karoń, G. Noise and environmental pollution from transport: Decisive problems in developing ecologically efficient transport systems. J. Vibroeng. 2017, 19, 5639–5655. [Google Scholar] [CrossRef]
  10. Koźlak, A.; Wach, D. Causes of traffic congestion in urban areas. Case of Poland. In Proceedings of the SHS Web of Conferences, the 10th Jubilee Scientific Conference—InfoGlob, Gdansk, Poland, 18–20 September 2018; Volume 57. [Google Scholar] [CrossRef]
  11. Zadobrischi, E.; Cosovanu, L.M.; Dimian, M. Traffic Flow Density Model and Dynamic Traffic Congestion Model Simulation Based on Practice Case with Vehicle Network and System Traffic Intelligent Communication. Symmetry 2020, 12, 1172. [Google Scholar] [CrossRef]
  12. Cartaxo, E.; Valois, I.; Miranda, V.; Costa, M. Issuances of Automotive Vehicles and the Impacts on Air Quality in the Largest City in the Brazilian Amazon. Sustainability 2018, 10, 4091. [Google Scholar] [CrossRef]
  13. Jakovljevic, B.; Paunovic, K.; Belojevic, G. Road-traffic noise and factors influencing noise annoyance in an urban population. Environ. Int. 2009, 35, 552–556. [Google Scholar] [CrossRef]
  14. Montes-González, D.; Vílchez-Gómez, R.; Barrigón-Morillas, J.M.; Atanasio-Moraga, P.; Rey-Gozalo, G.; Trujillo-Carmona, J. Noise and Air Pollution Related to Health in Urban Environments. In Proceedings of the Environment, Green Technology, and Engineering International Conference, Cáceres, Spain, 18–20 June 2018; Volume 20, p. 1311. [Google Scholar] [CrossRef]
  15. Murat, O.; Ebru, S.E. Determination of traffic noise pollution of the city of Tekirdag. J. Environ. Prot. Ecol. 2016, 17, 1276–1284. [Google Scholar]
  16. Almeida, F.; Silva, P.; Leite, J. Proposal of a carsharing system to improve urban mobility. Theor. Empir. Res. Urban Manag. 2017, 12, 32–44. [Google Scholar]
  17. Wang, Y.; Boggio-Marzet, A. Evaluation of Eco-Driving Training for Fuel Efficiency and Emission Reduction According to Road Type. Sustainability 2018, 10, 3891. [Google Scholar] [CrossRef]
  18. Adamczak, M.; Kovacic-Lukman, R.; Toboła, A.; Tórz, M.; Cyplik, P. Role of IoT Solutions in Reducing CO2 Emission and Road Safety in Car Rental and Car Sharing Market. In Integration of Information Flow for Greening Supply Chain Management; Koliński, A., Dujak, D., Golinska-Dawson, P., Eds.; Springer: Cham, Switzerland, 2020. [Google Scholar] [CrossRef]
  19. Fiedler, D.; Cap, M.; Certicky, M. Impact of Mobility-on-Demand on Traffic Congestion: Simulation-based Study. In Proceedings of the 20th IEEE International Conference on Intelligent Transportation Systems (ITSC 2017), Yokohama, Japan, 16–19 October 2017; pp. 1–6. [Google Scholar]
  20. Musso, A.; Corazza, M.; Tozzi, M. Car Sharing in Rome: A Case Study to Support Sustainable Mobility. Procedia-Soc. Behav. Sci. 2012, 48, 3482–3491. [Google Scholar] [CrossRef]
  21. Baptista, P.; Meloa, S.; Rolima, C. Energy, environmental and mobility impacts of car-sharing systems. Empirical results from Lisbon, Portugal. Procedia-Soc. Behav. Sci. 2014, 111, 28–37. [Google Scholar] [CrossRef]
  22. Nijland, H.; van Meerkerk, J. Mobility and environmental impacts of car sharing in the Netherlands. Environ. Innov. Soc. Transit. 2017, 23, 84–91. [Google Scholar] [CrossRef]
  23. Santos, G. Sustainability and Shared Mobility Models. Sustainability 2018, 10, 3194. [Google Scholar] [CrossRef]
  24. Sun, L.; Zhang, T.; Liu, S.; Wang, K.; Rogers, T.; Yao, L.; Zhao, P. Reducing energy consumption and pollution in the urban transportation sector: A review of policies and regulations in Beijing. J. Clean. Prod. 2021, 285, 125339. [Google Scholar] [CrossRef]
  25. Fafoutellis, P.; Mantouka, E.G.; Vlahogianni, E.I. Eco-Driving and Its Impacts on Fuel Efficiency: An Overview of Technologies and Data-Driven Methods. Sustainability 2021, 13, 226. [Google Scholar] [CrossRef]
  26. Sivak, M.; Schoettle, B. Eco-driving: Strategic, tactical, and operational decisions of the driver that influence vehicle fuel economy. Transp. Policy 2012, 22, 96–99. [Google Scholar] [CrossRef]
  27. Kubera, M.; Kot, S. Evolution of Carsharing in Poland. In Proceedings of the 31st International Business Information Management Association (IBIMA), Milan, Italy, 25–26 April 2018; pp. 5328–5336, ISBN 978-0-9998551-0-2. [Google Scholar]
  28. Lajunen, T.; Summala, H. Can we trust self-reports of driving? Effects of impression management on driver behaviour questionnaire responses. Transp. Res. Part F 2003, 6, 97–107. [Google Scholar] [CrossRef]
  29. Andria, G.; Attivissimo, F.; Di Nisio, A.; Lanzolla, A.M.L.; Pellegrino, A. Development of an automotive data acquisition platform for analysis of driving behavior. Measurement 2016, 93, 278–287. [Google Scholar] [CrossRef]
  30. Puchalski, A.; Komorska, I. Driving style analysis and driver classification using OBD data of a hybrid electric vehicle. Transp. Probl. 2020, 15, 83–94. [Google Scholar] [CrossRef]
  31. Nousias, S.; Tselios, C.; Bitzas, D.; Amaxilatis, D.; Montesa, J.; Lalos, A.S.; Moustakas, K.; Chatzigiannakis, I. Exploiting Gamification to Improve Eco-driving Behaviour: The GamECAR Approach. Electron. Notes Theor. Comput. Sci. 2019, 343, 103–116. [Google Scholar] [CrossRef]
  32. Jachimczyk, B.; Dziak, D.; Czapla, J.; Damps, P.; Kulesza, W.J. IoT On-Board System for Driving Style Assessment. Sensors 2018, 18, 1233. [Google Scholar] [CrossRef] [PubMed]
  33. Johnsona, D.A.; Trivedi, M.M. Driving Style Recognition Using a Smartphone as a Sensor Platform. In Proceedings of the 14th International IEEE Conference on Intelligent Transportation Systems (ITSC), St. Louis, MO, USA, 5–7 October 2011; pp. 1609–1615. [Google Scholar] [CrossRef]
  34. Cordero, J.; Aguilar, J.; Aguilar, K.; Chávez, D.; Puerto, E. Recognition of the Driving Style in Vehicle Drivers. Sensors 2020, 20, 2597. [Google Scholar] [CrossRef]
  35. Meiring, G.A.M.; Myburgh, H.C. A Review of Intelligent Driving Style Analysis Systems and Related Artificial Intelligence Algorithms. Sensors 2015, 15, 30653–30682. [Google Scholar] [CrossRef]
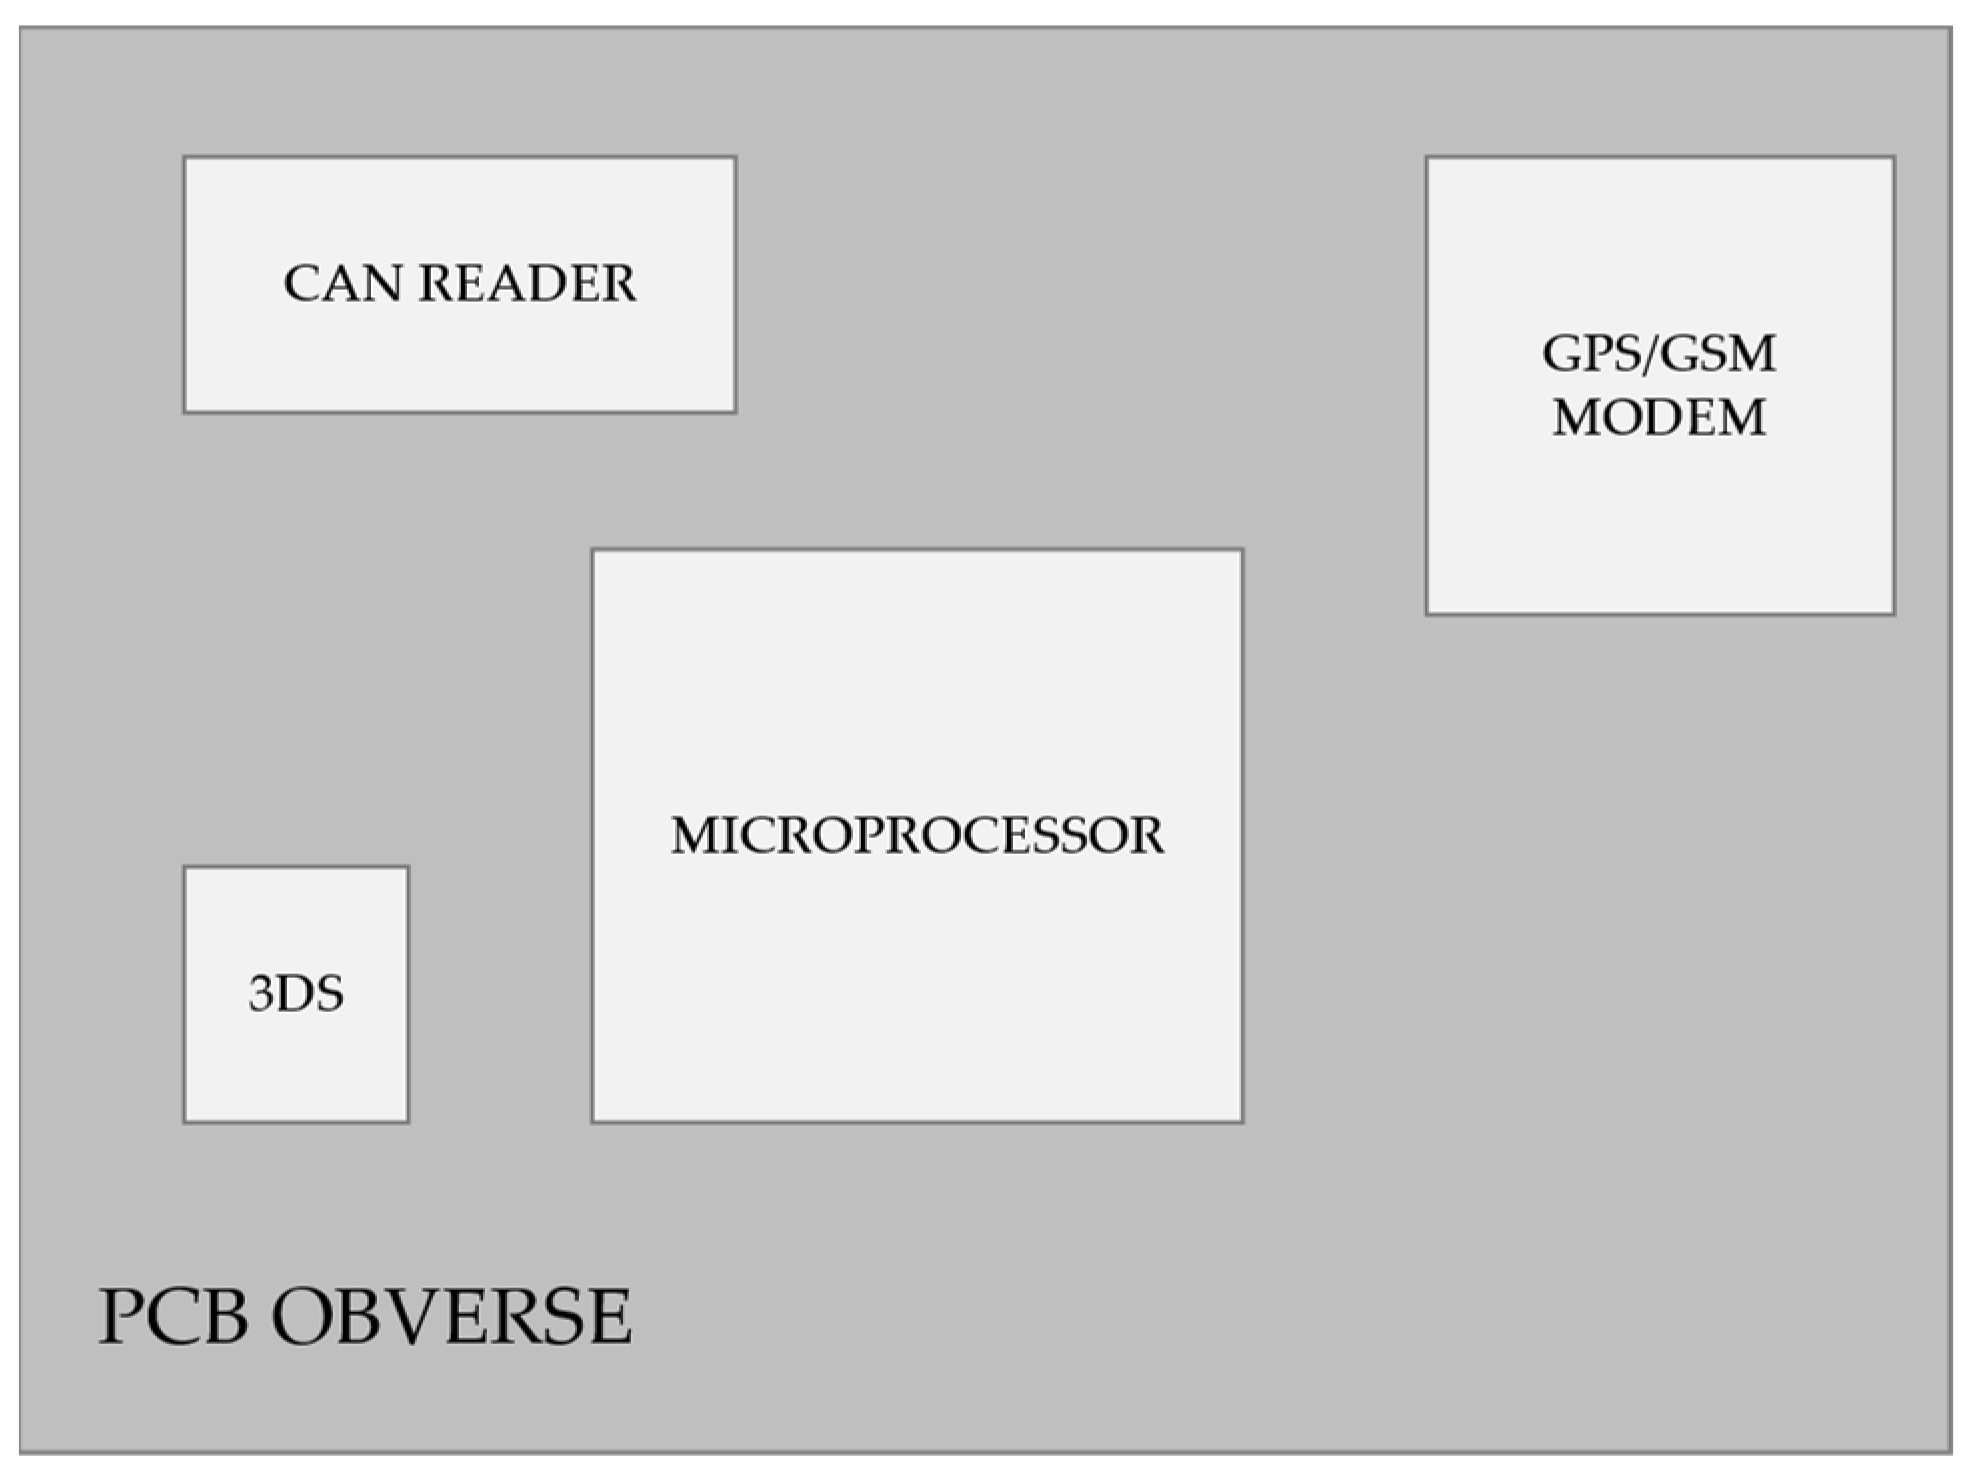
Figure 1. Obverse of the sensor.
Sustainability 16 03805 g001
Figure 2. Reverse of the sensor.
Sustainability 16 03805 g002
Figure 3. Validation methodology.
Sustainability 16 03805 g003
Figure 4. Data receipt confirmation algorithm.
Sustainability 16 03805 g004
Figure 5. Structure of a support tool used on Layer 3.
Sustainability 16 03805 g005
Figure 6. Graph of the relationship between RPM and pressure on the accelerator pedal.
Sustainability 16 03805 g006
Figure 7. Box-plot final rates during test drives.
Sustainability 16 03805 g007
Figure 8. The structure of a sensor-based application for eco-driving management in short-term car rental.
Sustainability 16 03805 g008
Table 1. Driving style parameters.
Authors and PublicationParameters
Andria, G.; Attivissimo, F.; Di Nisio, A.; Lanzolla, A.M.L.; Pellegrino [29]acceleration, engine speed and car speed
Puchalski, A.; Komorska, I. [30]car speed, acceleration, instantaneous gasoline consumption, battery charge level and engine speed
Nousias, S.; Tselios, C.; Bitzas, D.; Amaxilatis, D.; Montesa, J.; Lalos, A.S.; Moustakas K.; Chatzigiannakis, I. [31]fuel consumption, changing the gear, acceleration, braking, aggressiveness score denoting frequency and number of braking and accelerations per minute
Jachimczyk, B.; Dziak, D.; Czapla, J.; Damps, P.; Kulesza, W.J. [32]deceleration and acceleration ratio (driver’s tendency for aggressive driving), bumping ratio (the tendency of a driver to avoid speed bumps at too high a speed), cornering ratio (the way driver takes corners—fast and aggressive or calm and slow), driving time without rest ratio (taking a break or not taking a it after a specified period of driving), car speeding ratio (average speed exceeding the speed limit), car speeding duration ratio (how long the driver is driving at excessive speed), excessive engine rotational speed ratio (not using the correct gear) and excessive engine rotational speed duration ratio (time using the wrong gear)
Table 2. Chosen driving style parameters.
No.Parameter
1Stop with the engine running
2RPM
3Speed
4Pressure on the accelerator pedal
5Engine braking
6Gentle drive
7Rapid acceleration
8Rapid braking
9Sharp turn
10Correct gear
11Overspeed
12Kickdown
13Idling
14Cruise control
15Driving mode (urban, extra-urban, highway)
Table 3. Measured parameters.
No.ParameterCan BusDedicated
Sensor
Dedicated
Algorithm in the Firmware
External Data
1Stop with the engine runningYESNOYESNO
2RPMYESNONONO
3SpeedYESNONONO
4Pressure on the accelerator pedalYESNONONO
5Engine brakingNONOYESNO
6Gentle driveNONOYESNO
7Rapid accelerationNOYESNONO
8Rapid brakingNOYESNONO
9Sharp turnNOYESNONO
10Correct gearNONOYESNO
11OverspeedNONONOYES
12KickdownNONOYESNO
13IdlingNONOYESNO
14Cruise controlYESNOYESNO
15Driving mode (urban, extra-urban, highway)NONOYESYES
Table 4. Testing scenarios.
FeatureCarDriving StyleDriving AreaWeather
Conditions
State of the featuresegment C
PB, MT
(Skoda Scala)
in line with
eco-driving suggestions
citydry road and temperature < 10 degrees
segment C
PB, MT
(Nissan Qashqai)
contrary to the
suggestions of ecological driving
outside the citywet road and temperature < 10 degrees
segment C
PB, AT
(BMW X1)
highwaydry road and temperature > 10 degrees
segment D
ON, MT
(Volkswagen Passat)
wet road and temperature > 10 degrees
segment D
ON, AT
(BMW 318DGT)
Table 5. Summary of test scenarios.
CarTotal
Kilometers [km]
% of the 2000 km
Scenario Requirements
% of Test Scenarios Completed
Skoda Scala2365118.3%93.5%
Nissan Qashqai2500125.0%99.5%
Volkswagen Passat2432121.6%98.5%
BMW 318DGT2220111.0%89.7%
BMW X12278113.9%97.1%
Table 6. Testing results.
Driving StyleIn Line with Eco-Driving
Suggestions
Contrary to the Suggestions of Ecological Driving
Stop with the engine running4.714.23
Engine braking2.553.31
Idling4.754.73
RPM4.533.45
Speed4.734.61
ACC3.963.62
Cruise control3.532.48
Gentle drive2.411.85
Sharp turn3.823.82
Rapid braking4.053.96
Rapid acceleration4.184.08
Kickdown3.981.64
Correct gear3.773.30
Exceeding the speed limit1.581.26
Final note3.603.08
Fuel usage [l/100 km]6.567.79
Disclaimer/Publisher’s Note: The statements, opinions and data contained in all publications are solely those of the individual author(s) and contributor(s) and not of MDPI and/or the editor(s). MDPI and/or the editor(s) disclaim responsibility for any injury to people or property resulting from any ideas, methods, instructions or products referred to in the content.