Abstract
The increasing frequency and intensity of extreme weather events pose significant challenges to mountain communities, particularly in terms of flash flood risks. This study presents a framework for stress testing and evaluating flood resilience in mountain communities through the integration of high-resolution InfoWorks ICM two-dimensional hydrodynamic modeling and systematic resilience assessment. The framework makes three key innovations: (1) multi-scale temporal stress scenarios combining short-duration extreme events (1–2 h) with long-duration persistent events (24 h) and historical extremes; (2) integrated infrastructure–drainage stress analysis that explicitly models roads’ dual role as critical infrastructure and emergency drainage channels; and (3) dynamic resilience quantification under multiple stressors across 15 systematically designed stress conditions. Using Western Beijing as a case study, the model is validated, achieving Nash–Sutcliffe efficiency values exceeding 0.9, demonstrating its robust capability in simulating complex mountainous terrain flood processes. Through systematic analysis of fifteen rainfall scenarios designed based on Chicago rainfall patterns and historical events (including the July 2023 Haihe River basin flood), encompassing various intensities (30–200 mm/h), durations (1 h, 2 h, 24 h), and return periods (10, 50, 100 years), the key findings include the following: (1) A rainfall intensity of 60 mm/h represents a crucial threshold for system performance, beyond which significant impacts on community infrastructure emerge, with built-up areas experiencing inundation depths of 0.27–0.4 m that exceed safe passage limits. (2) Road networks become primary drainage channels during intense precipitation, with velocities exceeding 5 m/s in village roads and exceeding 5 m/s in country road sections, creating significant hazard potential. (3) Four major risk spots were identified with distinct waterlogging patterns, characterized by maximum depths ranging from 0.8 to 2.0 m and recovery periods varying from 2 to 12 hours depending on the topographic confluence effects and drainage efficiency. (4) The system demonstrates strong recovery capability, achieving >90% recovery within 3–6 hours for short-duration events, while showing vulnerability to extreme scenarios, with performance declining to 0.75–0.80, highlighting the coupling effects between water depth and flow velocity in steep terrain. This research provides quantitative insights for flood risk management and for enhancing community resilience in mountainous regions, offering valuable guidance for infrastructure improvement, emergency response optimization, and sustainable community development. This study primarily focuses on physical resilience aspects, with socioeconomic and institutional dimensions representing important directions for future research.
1. Introduction
In recent years, with the intensification of global climate change, the frequency and intensity of extreme weather events have increased significantly [1,2,3]. In mountainous regions, owing to their unique topographical and geomorphic features, the damage caused by heavy rainfall-induced flash flooding is becoming increasingly severe [4,5,6]. The IPCC (2023) report projects that the number of people exposed to flood disaster risks globally will increase by 19.62 million between 2020 and 2040 [7]. Steep topography and complex channel systems in mountainous areas result in floods characterized by short runoff times, high velocity, and highly destructive power [1,2]. Furthermore, mountain communities are characteristically dispersed and inaccessible. These geographical constraints significantly impede disaster prevention and mitigation efforts. Such conditions pose severe threats to local residents’ lives and property. Additionally, the effectiveness of conventional disaster prevention and mitigation systems is inadequate.
The concept of resilience provides approaches to disaster prevention and mitigation in response to the escalating prevalence of mountain torrents. Resilience, as a comprehensive indicator of a system’s capacity to withstand, adapt to, and recover from floods, has become a central focus in both academic research and practical applications [8,9,10,11]. Two-dimensional (2D) hydrodynamic modeling enables the accurate simulation of flood evolution in complex mountainous terrain [12]. This modeling approach provides essential data for a comprehensive assessment of community resilience [13].
Various hydrodynamic models have demonstrated their advantages for different applications, including the SWAT (Soil and Water Assessment Tool) for watershed-scale modeling [14], the SWMM (Storm Water Management Model) for urban stormwater systems, the HEC-RAS (Hydrologic Engineering Center’s River Analysis System) for river hydraulics, MIKE FLOOD for integrated 1D-2D flood modeling, and TUFLOW (Two-dimensional Unsteady FLOW) for complex flood simulation. The SWMM has been extensively applied to complex hydraulic analysis of urban drainage systems with its robust pipe network simulation capability [15]. The HEC-RAS demonstrates superior performance in river development and floodplain simulation [16,17]. However, its inability to directly couple with rainfall processes limits its application in storm scenarios. MIKE FLOOD enables multi-scenario simulation through the integration of 1D/2D fluid dynamics models [18], but its application is constrained by extensive data requirements and technical expertise. Infoworks ICM excels in constructing high-resolution 2D hydrodynamic models while also providing comprehensive simulation capabilities for the rainfall-producing sink flow process. Having been extensively validated for urban flood simulation [19,20,21], it also holds considerable potential for application in mountain torrent simulations. Table 1 summarizes the key characteristics of different hydrodynamic models.

Table 1.
Model comparison.
The incorporation of resilience concepts into flood risk management has proven to be effective in enhancing community disaster preparedness [22]. Aerts et al. [23] simulated 549 storm surges using a coupled hurricane–hydrodynamics–flood model and further calculated census block-level damage to buildings and vehicles using flood depth–damage curves. Melendez and Gutierrez Soto [24] presented the PEOPLES framework for quantifying a community’s overall resilience to flooding in seven dimensions using Harlan County, Kentucky, as an example. Several studies have utilized population-based survey data to develop a framework for assessing community resilience, including additional social factors based on community participation and psychological support [25,26,27]. Abdel-Mooty, El-Dakhakhni, and Coulibaly [15] developed a two-step framework based on spatial analysis and machine learning to accurately categorize and predict the resilience of communities to flooding and their response to future flood hazards. Yuan et al. [28] employed social media and machine learning techniques to assess the impact of flooding on communities and to sense the social impact of emotional signals. However, there remains a significant gap in research that combines high-precision hydrodynamic simulation results with resilience assessment methods. This gap limits the accurate assessment and effective management of flash flood hazard risk.
By constructing extreme scenarios, stress tests can systematically assess the resilience of communities to disruptions of varying intensity. The methodology behind stress testing originated in the financial sector to assess institutional risk tolerance through the simulation of extreme market conditions [29,30]. This approach was subsequently extended to power systems, critical infrastructure, and other complex systems [11,31,32] to assess systemic stability and resilience under extreme conditions. In natural disaster research, stress testing manifests primarily through scenario simulations of extreme events, such as 100-year floods and extreme rainstorms [33,34]. However, there remains a relative paucity of research systematically applying stress testing to community resilience assessment. The innovative application of this methodology offers significant potential for advancing research perspectives on community resilience assessment in mountainous areas.
This study makes three main contributions: First, we propose a flood stress test methodology that accounts for the characteristics of mountainous terrain based on a high-resolution 2D model, enabling the systematic evaluation of communities’ stress-bearing capacity and functional failure thresholds under varying disturbance intensities. Second, we adapt established resilience assessment methods to mountainous terrain characteristics through (1) the incorporation of road networks as primary drainage pathways in resilience calculations; (2) the integration of topographic confluence effects and steep terrain flow dynamics; (3) the systematic consideration of the dual infrastructure–drainage function that characterizes mountain community systems; and (4) the application of multi-temporal stress scenarios that reflect the unique flash flood and persistent inundation patterns typical of mountainous environments. Third, this research provides quantitative insights for flood risk management and for enhancing community resilience in mountainous regions, offering valuable guidance for infrastructure improvement, emergency response optimization, and sustainable community development.
The remainder of this paper is organized as follows. Section 2 presents a comprehensive overview of the study area and data sources; Section 3 details the stress test methodology, scenario design, and resilience assessment framework; Section 4 validates the proposed methodology through a representative case study; and Section 5 presents the conclusions and directions for future research.
2. Materials
2.1. Overview of the Study Area
The study area encompasses 2671.49 km2, comprising the primary catchment areas in Western Beijing (Figure 1). The selected region enables the comprehensive simulation of flow-producing catchment processes in mountainous terrain under extreme rainfall conditions. The region has a predominantly mountainous topography, characterized by significant elevational gradients. Elevations decrease along a northwest–southeast gradient. The study area is intersected by the Yongding and Juma Rivers.
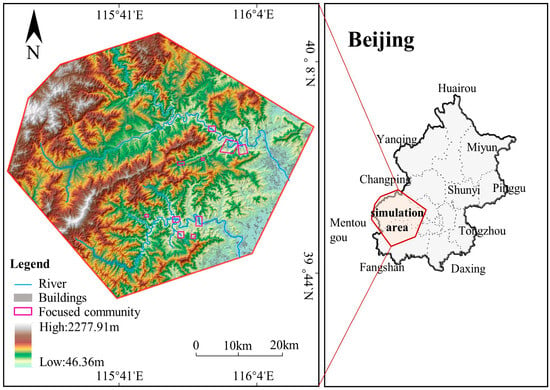
Figure 1.
Scope of study area.
The region is sparsely populated and exhibits a low degree of urbanization, characterized by scattered rural settlements. The area has a documented history of recurring flash floods, with the most recent event being an exceptional precipitation event on 23 July 2023, resulting in substantial regional damage [35]. The data sources and types used in this paper are shown in Table 2.
Table 2.
Data sources and types.
2.2. Digital Elevation Model
Topographical data are essential to determine flood flows and flooded areas. The digital elevation model (DEM) used two data sources. One had 12.5 m resolution and is publicly available [36], while the other had 2 m resolution, obtained from the Beijing Municipal Institute of Surveying and Mapping Design. Building height data were used for DEM correction. These models were combined and then resampled to achieve a final resolution of 4 m (Figure 1).
2.3. Land Use Data
The land use data were derived from China’s first 1 m resolution land cover map (SinoLC-1) [38]. A total of 90% of the study area consists of mountainous and forested regions, characterized by substantial vegetation cover. Only a minimal proportion of the area comprises urban built-up land, consisting of roads and buildings.
2.4. Rainfall and Water Depth Data
The July 2023 Haihe River basin flood (23·7 HR) severely impacted multiple regions in the Fangshan and Mentougou Districts. A monitoring network was deployed to collect meteorological data, measure water levels, and conduct video surveillance of the affected areas. The collected datasets serve as crucial inputs for both the parameterization and validation of the hydrodynamic model.
Based on installation specifications [40] and comprehensive field research, eleven weather station monitoring sites were identified. The locations of four water level stations were established based on field research and preliminary model calculations.
The monitoring network is illustrated in Figure 2. Voronoi diagrams were constructed based on the spatial distribution of meteorological stations. Rainfall values for each point in the catchment area are based on measurements from the rainfall stations within the Thiessen polygon.
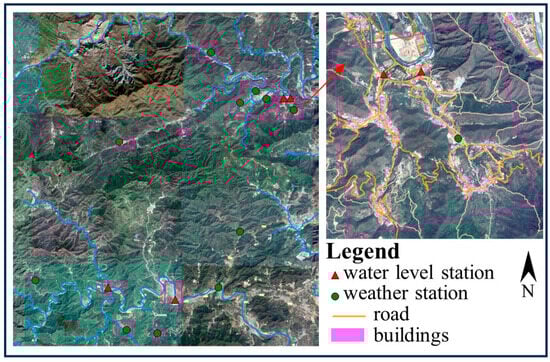
Figure 2.
Distribution of measuring devices.
3. Methodology
This study establishes an integrated methodological framework to evaluate flood resilience in mountain communities through stress testing. The framework combines hydrodynamic modeling with stress testing principles to systematically assess community flood response under various scenarios. Through a comprehensive technical approach incorporating multiple data sources and analytical methods, we aim to understand the flooding mechanisms in mountainous areas and evaluate community resilience. The detailed methodological components and their implementation are described in the following sections. The technical flowchart is shown in Figure 3.
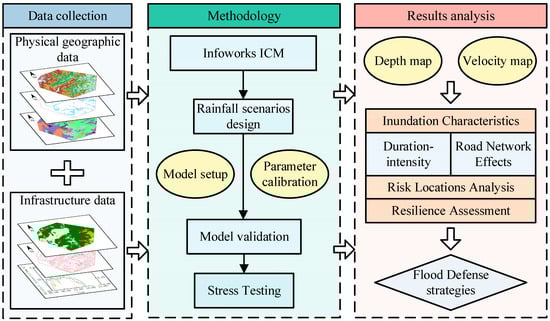
Figure 3.
Flowchart of the stress testing.
3.1. Stress Test
Stress testing is a quantitative risk analysis methodology. It evaluates system performance under extreme but plausible scenarios. In finance, stress testing evaluates system exposure to extreme events [41,42]. Stress testing methods are also used in the area of risk and reliability [43,44]. For community flood resilience, stress testing functions as a systematic methodology for assessing a community’s capacity to withstand, adapt to, and recover from flood events. The stress testing framework has four core components. These are scenario construction, impact modeling, resilience calculation, and strategy development. This approach helps us to understand how mountain communities respond to floods. It also identifies critical thresholds and system vulnerabilities.
3.2. Scenarios for Rainfall
Heavy rainfall phenomena encompass both short-duration extreme events and persistent precipitation patterns [45]. This study examines rainfall scenarios based on two primary parameters: duration and intensity. The selection of 15 rainfall scenarios was based on three criteria: (1) representation of different temporal scales (1 h, 2 h, and 24 h) to capture both flash flood and prolonged inundation events; (2) coverage of various return periods (10, 50, and 100 years) based on local precipitation statistics; and (3) inclusion of recent extreme events (23·7 HR and 7·20 ZZ) for validation against observed flood impacts. A total of fifteen rainfall scenarios were developed, as shown in Figure 4. Ten short-duration precipitation scenarios were developed using the Chicago rainfall pattern with specific parameters selected in accordance with local standards [46]. Five long-duration precipitation scenarios were constructed using standardized regional rainfall patterns and empirical data [46]. The extremes of the long-duration precipitation scenarios were based on the July 2023 Haihe River basin flood and the July 2021 Zhengzhou heavy rainstorm events (20·7 ZZ) [47].
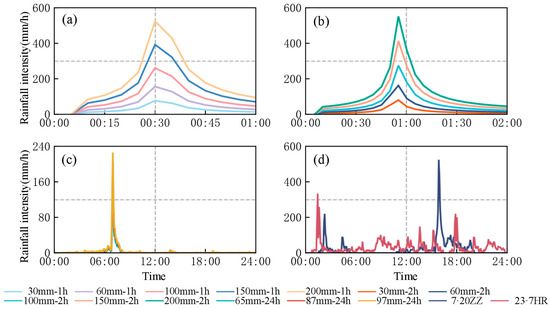
Figure 4.
Rainfall scenarios: (a) 1 h rainfall scenarios; (b) 2 h rainfall scenarios; (c) 24 h rainfall scenarios; (d) 23·7 HR and 20·7 ZZ scenarios.
The Chicago rainfall pattern represents a non-uniform design precipitation distribution [48]. The short-term precipitation distribution for a specified time period and return interval is derived from the storm intensity formula and peak coefficient [49]. The storm intensity relationship is expressed by Equation (1):
where represents the average storm intensity (mm/min), represents the rainfall with a return period of 1 year (mm), represents the rainfall variability parameter, represents the storm return period (years), represents the storm duration (min), and and are defined as the time parameter and storm attenuation index, respectively. In this study, the following parameters were used: = 16.28, = 0.96, = 11.591, and = 0.902 [46].
The Chicago rainfall process line formula is shown in Equations (2) and (3):
The variables utilized in the equation are defined as follows: denotes the instantaneous rainfall intensity (mm/min); denotes the time before peak (min); denotes the time after peak (min); , , , and are parameters of the storm intensity formula; and denotes the rain peak position coefficient. was assigned a value of 0.382 in this study [46].
The translation of rainfall scenarios into hydrodynamic model inputs involved several steps: (1) For Chicago rainfall patterns, the temporal distribution was calculated using Equations (1)–(3) and applied uniformly across all Thiessen polygons with intensity scaling based on the specified total rainfall amount. (2) For historical events (23·7 HR and 7·20 ZZ), the original temporal patterns from meteorological records were preserved, with spatial distribution determined by the relative rainfall measurements at different gauge stations, and intensity scaling applied to match the total accumulated rainfall at each location. (3) All scenarios used 5 min time steps for rainfall input to capture the rapid response characteristics of mountainous catchments. (4) No additional scaling factors were applied to the historical events beyond the spatial interpolation through Thiessen polygons. (5) The model boundary conditions were set as the exit at the catchment outlet.
3.3. Hydrodynamic Model
Mountainous regions are characterized by complex topographical features. The two-dimensional Finite Volume Method (FVM) is employed to solve shallow flow equations, enabling the effective simulation of rainfall-induced water flow across complex mountainous terrain. The governing shallow water equations are expressed as follows:
where and denote the bottom slope components in the x- and y-directions, respectively; and represent the frictional force components in the x- and y-directions; represents the flow rate per unit area (m3/s); and denotes the velocity component in the y-direction corresponding to flow rate (m/s).
3.4. Model Validation
We conducted validation using observational data to validate the model’s accuracy and relevance. The validation process involved comparing the measured depths at monitoring sites with the simulated model results. We evaluated the simulation results using the coefficient of determination (R2), root mean square error (RMSE), and Nash–Sutcliffe efficiency (NSE). The NSE formula is expressed as follows:
where is the observed depth at time (m), is the simulated depth at time (m), and is the mean observed depth (m).
3.5. Resilience Assessment
Inundation depth is a critical factor for determining flood vulnerability for pedestrians, vehicles, and single-story buildings. Critical inundation thresholds were established based on functionality impacts: (1) 0.15 m represents the minimum detectable inundation depth where surface water begins to accumulate; (2) 0.25 m constitutes the safe pedestrian passage threshold, beyond which walking becomes hazardous for adults; (3) 0.40 m represents the building flood warning level, where water may begin entering ground-floor structures and vehicle passage becomes unsafe for standard cars; and (4) 0.60 m marks the critical infrastructure failure threshold, where most ground-level facilities become non-operative and emergency vehicle access is severely compromised [50]. For village roads, depths of 0.27–0.4 m typically result in disrupted pedestrian access, unsafe conditions for motorcycles and small vehicles, and potential surface erosion damage. For buildings, depths in this range may cause water infiltration into foundations, damage to ground-level utilities, and accessibility issues for emergency services. An area is classified as inundated when the water depth exceeds 0.15 m. The InfoWorks ICM (2023.0) model simulation results were categorized into binary states: flooded and unflooded. System performance for each grid cell was quantified through the superposition of area and inundation state. The quantification of system performance and flood resilience is expressed in Equations (8)–(11) [47].
where represents the binary inundation state (0 for depth < , 1 for depth ≥ ), represents the system performance, represents the system resilience, represents the inundated area at time , represents the total study area, and represents the inundation threshold (0.15 m).
4. Case Study
For this study, we chose InfoWorks ICM to quantitatively analyze the flood hazards of Western Beijing under multiple rainfall scenarios.
Section 4 presents the case study results and is organized as follows: Section 4.1 de-scribes the parameter calibration process and model validation using observed data; Section 4.2 presents the stress test results under multiple rainfall scenarios, analyzing the effects of rainfall duration, intensity, and the role of road networks as drainage channels; Section 4.3 identifies and analyzes four major risk spots with their distinct characteristics; and Section 4.4 evaluates the system’s resilience performance across different scenarios.
4.1. Parameter Rate Setting and Model Validation
Three rainfall events (15, 16, and 17 August) were selected for parameter rate determination. Three additional rainfall events (26 August, 7 September, and 23·7 HR) were utilized for model validation. Figure 5 and Table 3 present the validation results of the model parameter rates.
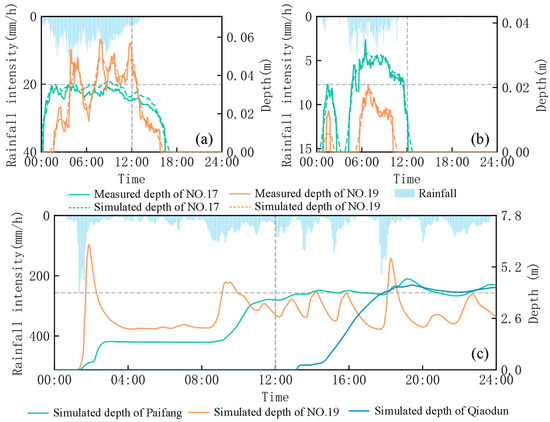
Figure 5.
Comparison between simulated and observed depth: (a) 0826; (b) 0907; (c) 7·23 HR.
Table 3.
Results of model validation.
The model achieved a Nash–Sutcliffe efficiency value greater than 0.9, demonstrating robust prediction accuracy. This accuracy makes it suitable for subsequent flood resilience analyses.
The model demonstrates robust adaptability to flood propagation across diverse terrain areas. In regions with significant topographical variation, the distribution of flood depths aligns with topographic features. The model accurately simulates the water flow aggregation in low-lying areas. The flooding primarily affected roads and buildings. The water depths in the affected areas varied significantly. By comparing relevant news reports during the disaster with subsequent academic studies, the findings from surveys on major disaster-stricken urban areas indicate that the depth and scope of the flood are consistent [51,52,53,54,55,56]. The flood channels near buildings intensified the impact, resulting in impassable roads and substantial structural damage. The simulation results, following parameter calibration, demonstrate strong agreement with the observed conditions and exhibit reliability (Figure 6). The hydrodynamic parameter settings associated with the model are presented in Table 4.
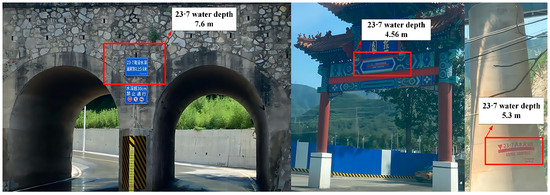
Figure 6.
Records of the flood scars after the Haihe River basin flood in July 2023.
Table 4.
The settings of the hydrodynamic parameters.
4.2. Stress Test Results
We conducted a stress test for the study area under the rainfall scenario using Infoworks ICM. In this subsection, we selected one of the focus areas to analyze the results of the stress test.
A community located on a particular hillside was chosen as the study area. The settlements are distributed along the ravine and proximate to the river, exhibiting a topographical gradient that descends from south to north. Intense precipitation events generate multiple confluences with high flow velocities. These hydrological pathways intersect the main built-up areas of the community, thereby creating significant flood risk. The distribution of flood inundation depths for the rainfall scenarios is shown in Figure 7, and the distribution of flood flow velocities for the three typical rainfall scenarios is shown in Figure 8.
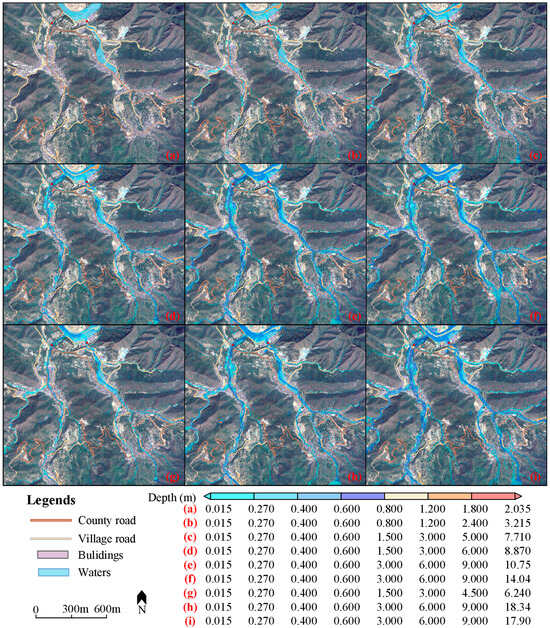
Figure 7.
Inundation depth maps: (a) 30 mm, 1 h; (b) 60 mm, 1 h; (c) 100 mm, 1 h; (d) 100 mm, 2 h; (e) 150 mm, 2 h; (f) 200 mm, 2 h; (g) 97 mm, 100 y, 24 h; (h) 23·7 HR; (i) 7·20 ZZ.
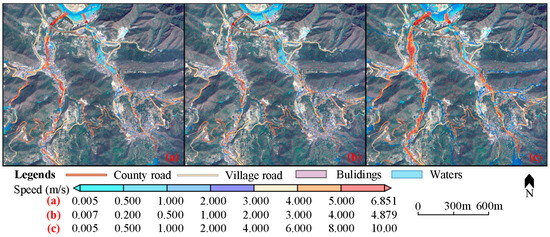
Figure 8.
Flood velocity maps: (a) 100 mm, 1 h; (b) 97 mm, 100 y, 24 h; (c) 23·7 HR.
4.2.1. Effect of Rainfall Duration on Inundation Characteristics
- (1)
- Short-Duration Rainfall Response Characteristics:
Low-intensity rainfall (30 mm, 10-year return period) was analyzed in the study area. Water levels remained within safe limits. The existing drainage system demonstrated effective protection against short-duration rainfall events.
Medium-intensity rainfall (60 mm, 100-year return period) was evaluated. Village roads experienced inundation depths of 0.27–0.4 m. These depths exceeded the safe passage threshold of 0.25 m. The central building area recorded inundation depths of 0.6–0.8 m. This distribution reflected the influence of topographic variation.
High-intensity rainfall events (≥100 mm) showed distinct patterns in mountainous areas. Confluence effects dominated these regions. Road channels formed clear flood pathways. Regional runoff accumulation mechanisms amplified the flood risk.
- (2)
- Long-Duration Rainfall Response Characteristics:
Standing water showed clear topographic dependence. Critical infrastructure nodes, particularly bridges and culverts, accumulated maximum depths of 0.6 m. Flow velocities increased from 3.0 to 3.8 m/s. This increase occurred as return periods increased from 50 to 100 years. All velocities exceeded the critical threshold of 2.0 m/s. Road system functionality experienced substantial degradation. These conditions highlighted the sustained impact of prolonged rainfall on infrastructure.
4.2.2. Relationship Between Rainfall Intensity and Inundation Depth
The results revealed a non-linear relationship between rainfall intensity and inundation depth. At a rainfall intensity of 60 mm/h, the average inundation depth in the built-up area was 0.27 m, which remained below the building flood warning level (0.4 m). However, some low-lying areas showed higher vulnerability. At a rainfall intensity of 100 mm/h, the road system exceeded the warning level (>0.6 m), with water levels reaching 3 m in the bridge area, creating a regional high-risk zone. Inundation depths in the densely built-up area remained between 0.27 and 0.6 m, demonstrating the area’s flood resistance capacity.
4.2.3. Diversionary Effects of Roads
A 1 h precipitation intensity of 60 mm was applied. The main road and village road developed flow channels with velocities of 2 m/s. This observation confirms that road systems transform into primary drainage channels during heavy rainfall. The precipitation intensity was increased to 100 mm per hour. Village roads experienced flow velocities of 4 m/s. Country road sections recorded velocities exceeding 5 m/s. High-risk areas formed at river confluences and inlet zones. These locations demonstrated significant interactions between regional waterways and road systems.
4.2.4. Depth–Flow Velocity Coupling Effects
A significant depth–flow velocity coupling amplification effect was found in the built-up area around the road. The combination of a high water level (>0.6 m) and high velocity (>4 m/s) significantly increases the hydrodynamic loads on buildings. This coupling effect is most obvious at the road–river confluence, which constitutes a key weak link in the regional flood defense system.
In conclusion, regional flooding characteristics are influenced by the complex interactions among topographical features, drainage networks, and road systems. Significant spatial heterogeneity exists, accompanied by a distinct threshold effect in the relationship between rainfall intensity and inundation characteristics. A rainfall intensity of 60 mm/h represents the critical threshold. The propensity of road networks to function as drainage channels during intense precipitation events warrants careful consideration in flood defense planning.
4.3. Risk Spot Analysis
Based on the simulation results, the risk points are primarily concentrated in topographic confluence areas, bridge culvert areas, and low-lying areas prone to waterlogging. The risk spots are shown in the figure below (Figure 9).
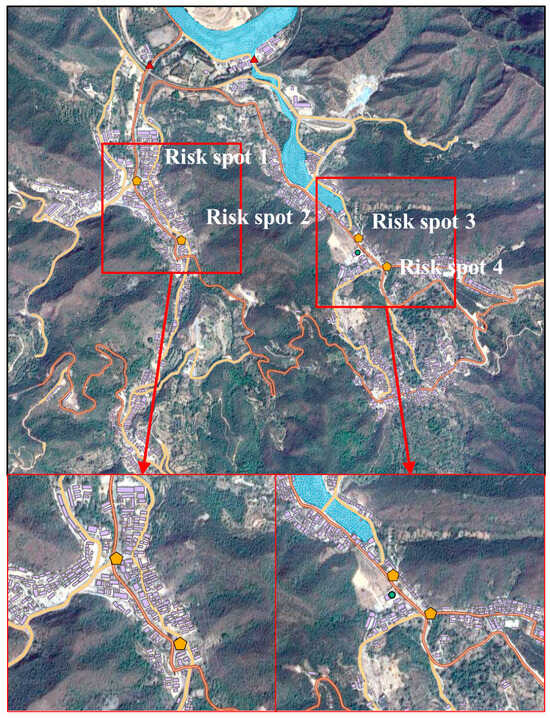
Figure 9.
Risk spots.
The four identified risk locations exhibit distinct waterlogging characteristics and temporal patterns. Risk point 1 reaches waterlogging depths of 1.8–2.0 m during short rainfall events. Its inundation periods last 4–6 h. Risk point 2 experiences the most severe waterlogging. Its maximum depth ranges from 1.2 to 1.5 m. During the 7·20 ZZ rainfall event, waterlogging persists for 12 h. Risk point 3 experiences moderate waterlogging of 0.8 m depth because its drainage is efficient. Water typically subsides within 3–4 h. Risk point 4 responds rapidly to rainfall. Its waterlogging depth reaches 1.0–1.5 m but subsides within 2–3 h. Rainfall duration affects waterlogging depth. Short rainfall events cause deeper waterlogging. Long rainfall events lead to repeated flooding. The changes in depth at each risk point under different rainfall scenarios are shown in Figure 10. Table 5 gives the duration and maximum depth of water accumulation at each risk point under different rainfall scenarios.
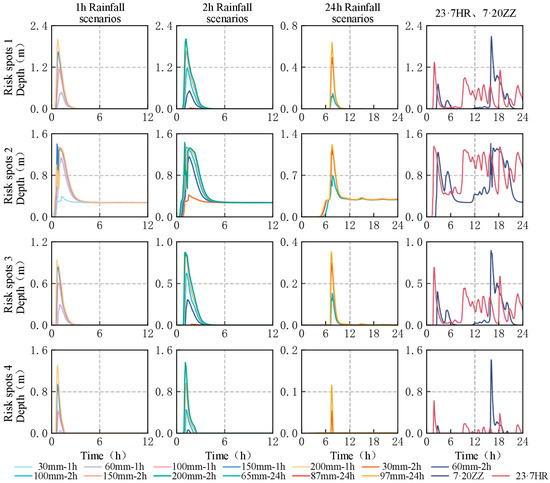
Figure 10.
Depth changes at each risk point under different rainfall scenarios.
Table 5.
The duration and maximum depth of waterlogging.
4.4. Resilience Assessment
Figure 11 illustrates the system’s resilience characteristics under varying rainfall scenarios. Under short rainfall durations (1 h, 2 h), the system performance decreased to 0.67–0.75, exhibiting a typical ‘V’ recovery curve, achieving >90% recovery within 3–6 h. The extended rainfall scenario (24 h) resulted in notable resilience, characterized by a minimal performance decline to 0.85 and an uninterrupted recovery process. This response indicates the system’s capacity to withstand prolonged disturbances. Under extreme scenarios (7·20 ZZ and 23·7 HR), the system exhibited frequent performance fluctuations, reaching minimum values of 0.75–0.80, with multiple perturbations during recovery, indicating system vulnerability to extreme events. The toughness assessment revealed substantial recovery and adaptation capabilities, enabling the system to maintain core functions and achieve effective recovery in most scenarios. Nevertheless, the system’s disturbance resistance requires further enhancement.
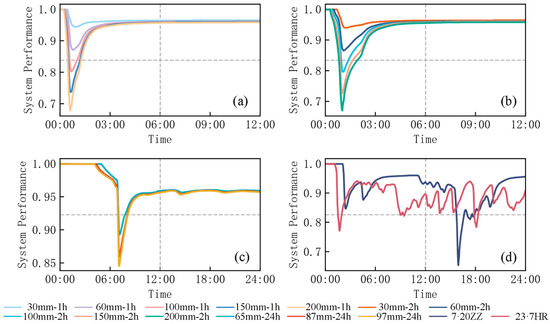
Figure 11.
The system performance: (a) 1 h rainfall scenarios; (b) 2 h rainfall scenarios; (c) 24 h rainfall scenarios; (d) 23·7 HR and 20·7 ZZ scenarios.
5. Conclusions
This study developed and validated a comprehensive framework for stress testing and evaluating flood resilience in mountain communities. The novelty of our stress testing framework lies in three integrated innovations specifically adapted for mountain community flood resilience: (1) multi-scale temporal stress scenarios that systematically combine short-duration extreme events (1–2 h) with long-duration persistent events (24 h) and real historical extremes, enabling the assessment of both flash flood and prolonged inundation stresses; (2) integrated infrastructure–drainage stress analysis that explicitly models roads’ dual role as critical infrastructure and emergency drainage channels; and (3) dynamic resilience quantification under multiple stressors that measures system performance recovery across a spectrum of 15 systematically designed stress conditions, enabling the identification of critical stress thresholds and recovery patterns specific to mountainous terrain characteristics.
Through the integration of high-resolution 2D hydrodynamic modeling, systematic stress testing, and resilience assessment, several key conclusions can be drawn.
First, the proposed InfoWorks ICM-based 2D hydrodynamic model demonstrates robust performance in simulating mountain flood processes, achieving Nash–Sutcliffe efficiency values exceeding 0.9. This validates its applicability for complex mountainous terrain flood simulation and provides a reliable foundation for stress testing.
Second, the stress testing methodology revealed complex flood response patterns across different rainfall scenarios. For short-duration events (1–2 h), the system exhibited clear threshold behavior, with 60 mm/h emerging as a critical intensity threshold that significantly impacts system performance. Long-duration rainfall (24 h) demonstrated sustained impacts on infrastructure and drainage systems, with cumulative effects becoming increasingly pronounced over time. Notably, road networks were found to transform into primary drainage channels during intense precipitation, with velocities exceeding 5 m/s in certain sections, creating significant hazard potential in these areas.
Thirdly, mountain community flood resilience assessment requires specialized approaches beyond conventional urban flood modeling. Key findings include the following: (1) road networks in mountain communities exhibit dual criticality as both transportation lifelines and emergency drainage channels, with failure at strategic locations causing system-wide connectivity loss; (2) confluence effects and high-velocity shallow flows (>2 m/s) create unique hazard patterns in steep terrain that differ significantly from urban flood risks; and (3) the absence of formal drainage infrastructure makes bridge and culvert locations critical control points with a disproportionate influence on community-wide resilience, where single-point failures can isolate entire settlement areas.
Eventually, further analysis identified several critical factors governing mountain community flood resilience. The interplay between topographical features and flow convergence patterns emerged as a fundamental driver of flood risk. Infrastructure placement and design, particularly at critical nodes, significantly influenced system performance. The capacity and response characteristics of drainage systems, combined with the coupling effect between water depth and flow velocity, were found to be crucial determinants of community flood resilience.
The following three measures are recommended to enhance flood resilience in mountainous communities: First, upgrade key nodes with terrain adaptation, adopt velocity–depth coupling design, and use modular drainage to enhance resilience. Second, build multi-tiered flow regulation systems combining nature-based solutions and engineered detention basins to ease steep slope convergence, reduce flow velocity, and restore ecology. Third, deploy real-time monitoring networks, integrate sensing and predictive analytics, and dynamically adjust drainage, allowing for a monitoring–warning–response closed loop to form.
These findings have significant implications for flood risk management and community resilience enhancement in mountainous regions. This study provides a quantitative basis for identifying and prioritizing infrastructure improvements, optimizing emergency response strategies, developing targeted flood mitigation measures, and informing community planning and development decisions.
However, several limitations should be noted. This study primarily focuses on the physical aspects of flood resilience, with limited coverage of socioeconomic and institutional dimensions, including human behavior patterns, evacuation efficiency, demographic vulnerability, and institutional capacity. Our risk hotspot identification relies mainly on hydrological characteristics, without yet incorporating demographic vulnerability or population exposure levels. Additionally, the Chicago rainfall method may not fully capture the spatial–temporal variability in mountainous precipitation systems influenced by orographic effects, and while the InfoWorks ICM model performs robustly, its urban-oriented design may imperfectly simulate complex flow processes in steep catchments (such as debris flow potential and variable infiltration across soil types). These limitations, in part, stem from the complexity of hydraulic calculations for critical infrastructure and constraints related to the propagation of computational errors. Nevertheless, the overall accuracy of the findings remains within an acceptable range, making them applicable to practical government efforts in disaster prevention and mitigation.
Future research directions should focus on incorporating climate change projections into the stress testing framework, expanding the assessment to include social and economic resilience indicators, developing real-time flood warning systems based on the identified risk patterns, investigating the cascading effects of flood impacts on critical infrastructure networks, exploring nature-based solutions for enhancing community flood resilience, integrating demographic data and social vulnerability indicators, incorporating radar-based precipitation data, and conducting multi-model comparisons to better quantify modeling uncertainties.
Author Contributions
Conceptualization, M.Y. and H.H.; methodology, M.Y. and H.H.; software, M.Y.; validation, F.Y., A.W. and X.S.; formal analysis, M.Y.; investigation, M.Y.; resources, M.Y. and Y.T.; data curation, M.Y.; writing—original draft preparation, M.Y.; writing—review and editing, M.Y. and H.H.; visualization, M.Y.; supervision, F.Y.; project administration, H.H.; funding acquisition, H.H. All authors have read and agreed to the published version of the manuscript.
Funding
This work was supported by the National Natural Science Foundation of China (Grant No. 72091512) and the Beijing Municipal Finance Project (No. 11000024210200087177-XM001).
Institutional Review Board Statement
Not applicable.
Informed Consent Statement
Not applicable.
Data Availability Statement
The original data presented in this study are partly derived from publicly available datasets, including the ALOS DEM (12.5 m resolution) provided by ASF/NASA [36], the Harmonized World Soil Database by FAO and IIASA [37], and the SinoLC-1 high-resolution land cover dataset [38], as well as the 3D-GloBFP building footprint dataset [39]. These data are openly accessible from the respective repositories. Additional topographic, river, and infrastructure data (2 m resolution DEM, road networks, and related mapping information) were obtained from the Beijing Municipal Institute of Surveying and Mapping Design, and restrictions apply to the availability of these datasets. They are available from the authors upon reasonable request and with the permission of the Institute. Meteorological and hydrological monitoring data (rainfall and water depth records) were collected using KantianTech instruments during field measurements. These raw datasets supporting the conclusions of this article will be made available by the authors upon request.
Conflicts of Interest
The authors declare no conflict of interest.
References
- Calel, R.; Stainforth, D.A. Little floods everywhere: What will climate change mean for you? Clim. Change 2024, 178, 1. [Google Scholar] [CrossRef]
- Dharmarathne, G.; Waduge, A.O.; Bogahawaththa, M.; Rathnayake, U.; Meddage, D.P.P. Adapting cities to the surge: A comprehensive review of climate-induced urban flooding. Results Eng. 2024, 22, 102123. [Google Scholar] [CrossRef]
- Sun, H.; Krysanova, V.; Gong, Y.; Gao, M.; Treu, S.; Chen, Z.; Jiang, T. The recent trends of runoff in China attributable to climate change. Clim. Change 2024, 177, 159. [Google Scholar] [CrossRef]
- Ripple, W.J.; Wolf, C.; Gregg, J.W.; Rockström, J.; Newsome, T.M.; Law, B.E.; Marques, L.; Lenton, T.M.; Xu, C.; Huq, S.; et al. The 2023 state of the climate report: Entering uncharted territory. BioScience 2023, 73, 841–850. [Google Scholar] [CrossRef]
- Borga, M.; Anagnostou, E.N.; Blöschl, G.; Creutin, J.D. Flash flood forecasting, warning and risk management: The HYDRATE project. Environ. Sci. Policy 2011, 14, 834–844. [Google Scholar] [CrossRef]
- Gourley, J.J.; Flamig, Z.L.; Vergara, H.; Kirstetter, P.-E.; Clark, R.A.; Argyle, E.; Arthur, A.; Martinaitis, S.; Terti, G.; Erlingis, J.M.; et al. The FLASH Project: Improving the Tools for Flash Flood Monitoring and Prediction across the United States. Bull. Am. Meteorol. Soc. 2017, 98, 361–372. [Google Scholar] [CrossRef]
- Lee, H.; Calvin, K.; Dasgupta, D.; Krinner, G.; Mukherji, A.; Thorne, P.; Trisos, C.; Romero, J.; Aldunce, P.; Barrett, K.; et al. Contribution of Working Groups I, II and III to the Sixth Assessment Report of the Intergovernmental Panel on Climate Change. In Climate Change 2023: Synthesis Report; IPCC: Geneva, Switzerland, 2023; Volume 50, pp. 35–115. [Google Scholar] [CrossRef]
- Holling, C.S. Resilience and Stability of Ecological Systems. Annu. Rev. Ecol. Evol. Syst. 1973, 4, 1–23. [Google Scholar] [CrossRef]
- Allen, C.R.; Angeler, D.G.; Cumming, G.S.; Folke, C.; Twidwell, D.; Uden, D.R. Quantifying spatial resilience. J. Appl. Ecol. 2016, 53, 625–635. [Google Scholar] [CrossRef]
- Ahmed, S.; Dey, K. Resilience modeling concepts in transportation systems: A comprehensive review based on mode, and modeling techniques. J. Infrastruct. Preserv. Resil. 2020, 1, 8. [Google Scholar] [CrossRef]
- He, R.; Tiong, R.L.K.; Yuan, Y.; Zhang, L. Enhancing resilience of urban underground space under floods: Current status and future directions. Tunn. Undergr. Space Technol. 2024, 147, 105674. [Google Scholar] [CrossRef]
- Huang, W.; Cao, Z.-X.; Qi, W.-J.; Pender, G.; Zhao, K. Full 2D hydrodynamic modelling of rainfall-induced flash floods. J. Mt. Sci. 2015, 12, 1203–1218. [Google Scholar] [CrossRef]
- Fernandez-Novoa, D.; Gonzalez-Cao, J.; Garcia-Feal, O. Enhancing Flood Risk Management: A Comprehensive Review on Flood Early Warning Systems with Emphasis on Numerical Modeling. Water 2024, 16, 1408. [Google Scholar] [CrossRef]
- Prasanchum, H.; Pimput, Y. Risk assessment of flash flood situation under land use change using daily SWAT streamflow simulation in Loei Basin, Northeastern, Thailand. IOP Conf. Ser. Earth Environ. Sci. 2023, 1151, 012015. [Google Scholar] [CrossRef]
- Abdel-Mooty, M.N.; El-Dakhakhni, W.; Coulibaly, P. Data-Driven Community Flood Resilience Prediction. Water 2022, 14, 2120. [Google Scholar] [CrossRef]
- Madi, H.; Bedjaoui, A.; Elhoussaoui, A.; Elbakai, L.O.; Bounaama, A. Flood Vulnerability Mapping and Risk Assessment Using Hydraulic Modeling and GIS in the Tamanrasset Valley Watershed, Algeria. J. Ecol. Eng. 2023, 24, 35–48. [Google Scholar] [CrossRef] [PubMed]
- Sajjad, A.; Lu, J.; Chen, X.; Yousaf, S.; Mazhar, N.; Shuja, S. Flood hazard assessment in Chenab River basin using hydraulic simulation modeling and remote sensing. Nat. Hazards 2024, 120, 7679–7700. [Google Scholar] [CrossRef]
- Zhang, J.; Wang, H.; Huang, J.; Sun, D.; Liu, G. Evaluation of Urban Flood Resilience Enhancement Strategies—A Case Study in Jingdezhen City under 20-Year Return Period Precipitation Scenario. ISPRS Int. J. Geo-Inf. 2022, 11, 285. [Google Scholar] [CrossRef]
- Wang, K.; Chen, J.; Hu, H.; Tang, Y.; Huang, J.; Wu, Y.; Lu, J.; Zhou, J. Urban Waterlogging Simulation and Disaster Risk Analysis Using InfoWorks Integrated Catchment Management: A Case Study from the Yushan Lake Area of Ma’anshan City in China. Water 2024, 16, 3383. [Google Scholar] [CrossRef]
- Wei, H.; Wu, H.; Zhang, L.; Liu, J. Urban flooding simulation and flood risk assessment based on the InfoWorks ICM model: A case study of the urban inland rivers in Zhengzhou, China. Water Sci. Technol. 2024, 90, 1338–1358. [Google Scholar] [CrossRef]
- Wei, H.; Zhang, L.; Liu, J. Hydrodynamic Modelling and Flood Risk Analysis of Urban Catchments under Multiple Scenarios: A Case Study of Dongfeng Canal District, Zhengzhou. Int. J. Environ. Res. Public Health 2022, 19, 14630. [Google Scholar] [CrossRef] [PubMed]
- Schelfaut, K.; Pannemans, B.; van der Craats, I.; Krywkow, J.; Mysiak, J.; Cools, J. Bringing flood resilience into practice: The FREEMAN project. Environ. Sci. Policy 2011, 14, 825–833. [Google Scholar] [CrossRef]
- Aerts, J.C.J.H.; Botzen, W.J.W.; Emanuel, K.; Lin, N.; de Moel, H.; Michel-Kerjan, E.O. Evaluating Flood Resilience Strategies for Coastal Megacities. Science 2014, 344, 473–475. [Google Scholar] [CrossRef]
- Melendez, A.; Gutierrez Soto, M. Flood Resilience Quantification Framework of Rural Communities: Case Study of Harlan County, Kentucky. Nat. Hazards Rev. 2024, 25, 05024009. [Google Scholar] [CrossRef]
- Dewa, O.; Makoka, D.; Ayo-Yusuf, O.A. Measuring community flood resilience and associated factors in rural Malawi. J. Flood Risk Manag. 2023, 16, e12874. [Google Scholar] [CrossRef]
- Rameli, N.L.; Majid, N.A.; Mohamed, A.F. Assessing Community Resilience to Flood Disasters: A Case Study of Temerloh, Pahang. Geographies 2024, 4, 583–595. [Google Scholar] [CrossRef]
- Xu, W.; Zhong, M.; Hong, Y.; Lin, K. Enhancing community resilience to urban floods with a network structuring model. Saf. Sci. 2020, 127, 104699. [Google Scholar] [CrossRef]
- Yuan, F.; Fan, C.; Farahmand, H.; Coleman, N.; Esmalian, A.; Lee, C.-C.; Patrascu, F.I.; Zhang, C.; Dong, S.; Mostafavi, A. Smart flood resilience: Harnessing community-scale big data for predictive flood risk monitoring, rapid impact assessment, and situational awareness. Environ. Res. Infrastruct. Sustain. 2022, 2, 025006. [Google Scholar] [CrossRef]
- Merton, R.C. On The Pricing of Corporate Debt: The Risk Structure of Interest Rates. J. Financ. 1974, 29, 449–470. [Google Scholar] [CrossRef]
- Wilson, T.C. Portfolio Credit Risk. Econ. Policy Rev. 1998, 4, 71–82. Available online: https://EconPapers.repec.org/RePEc:fip:fednep:y:1998:i:oct:p:71-82:n:v.4no.3 (accessed on 6 June 2025). [CrossRef]
- Venkateswaran, V.B.; Saini, D.K.; Sharma, M. Techno-economic hardening strategies to enhance distribution system resilience against earthquake. Reliab. Eng. Syst. Saf. 2021, 213, 107682. [Google Scholar] [CrossRef]
- Liu, W.; Song, Z. Review of studies on the resilience of urban critical infrastructure networks. Reliab. Eng. Syst. Saf. 2020, 193, 106617. [Google Scholar] [CrossRef]
- Moradi-Sepahvand, M.; Amraee, T.; Gougheri, S.S. Deep Learning Based Hurricane Resilient Coplanning of Transmission Lines, Battery Energy Storages, and Wind Farms. IEEE Trans. Ind. Inform. 2022, 18, 2120–2131. [Google Scholar] [CrossRef]
- Nasri, A.; Abdollahi, A.; Rashidinejad, M. Multi-stage and resilience-based distribution network expansion planning against hurricanes based on vulnerability and resiliency metrics. Int. J. Electr. Power Energy Syst. 2022, 136, 107640. [Google Scholar] [CrossRef]
- Jiao, Z.; Zhang, Z.; Wu, L. SAR-based dynamic information retrieving of the Beijing-Tianjin-Hebei flood-inundation happened in July 2023, North China. Geomat. Nat. Hazards Risk 2024, 15, 2366361. [Google Scholar] [CrossRef]
- ASF, NASA. ALOS PALSAR Radiometric Terrain Corrected Low Res; Includes Material ©JAXA/METI 2007; ASF, NASA: Fairbanks, AK, USA, 2015; Available online: https://docs.asf.alaska.edu/datasets/palsar/ (accessed on 6 June 2025).
- FAO; IIASA. Harmonized World Soil Database Version 2.0; FAO: Rome, Italy; IIASA: Laxenburg, Austria, 2023; 69p. [Google Scholar] [CrossRef]
- Li, Z.; Zhang, H.; Lu, F.; Xue, R.; Yang, G.; Zhang, L. Breaking the resolution barrier: A low-to-high network for large-scale high-resolution land-cover mapping using low-resolution labels. ISPRS J. Photogramm. Remote Sens. 2022, 192, 244–267. [Google Scholar] [CrossRef]
- Che, Y.; Li, X.; Liu, X.; Wang, Y.; Liao, W.; Zheng, X.; Zhang, X.; Xu, X.; Shi, Q.; Zhu, J.; et al. 3D-GloBFP: The first global three-dimensional building footprint dataset. Earth Syst. Sci. Data 2024, 16, 5357–5374. [Google Scholar] [CrossRef]
- China National Institute of Standardization. Specifications for Siting and Installation of Automatic Weather Station. 2022. Available online: https://www.cma.gov.cn/zfxxgk/gknr/flfgbz/bz/202209/t20220921_5098939.html (accessed on 6 June 2025).
- Berkowitz, J. A Coherent Framework for Stress-Testing; Finance and Economics Discussion Series (Topic); Board of Governors: Washington, DC, USA, 1999; pp. 5–15. [Google Scholar] [CrossRef]
- Kupiec, P.H. The New Basel Capital Accord: The Devil Is in the (Calibration) Details. IMF Work. Pap. 2001, 2001, A001. [Google Scholar] [CrossRef]
- Aydin, N.Y.; Duzgun, H.S.; Wenzel, F.; Heinimann, H.R. Integration of stress testing with graph theory to assess the resilience of urban road networks under seismic hazards. Nat. Hazards 2018, 91, 37–68. [Google Scholar] [CrossRef]
- Ma, Z.; Nie, S.; Liao, H. A load spectra design method for multi-stress accelerated testing. Proc. Inst. Mech. Eng. Part O J. Risk Reliab. 2021, 236, 1748006X2110620. [Google Scholar] [CrossRef]
- Chen, J.; Li, Y.; Zhang, C. The Effect of Design Rainfall Patterns on Urban Flooding Based on the Chicago Method. Int. J. Environ. Res. Public Health 2023, 20, 4245. [Google Scholar] [CrossRef]
- Beijing Municipal Commission of Urban Planning. Standard of Rainstorm Runoff Calculation for Urban Storm Drainage System Planning and Design. 2016. Available online: https://std.samr.gov.cn/db/search/stdDBDetailed?id=91D99E4D5F622E24E05397BE0A0A3A10 (accessed on 6 June 2025).
- Dai, X.; Huang, H.; Yu, F.; Wu, A.; Shi, D.; Zhang, P. Research on community resilience stress testing method under rainstorm waterlogging disaster. J. Tsinghua Univ. (Sci. Technol.) 2024, 64, 1587–1596. [Google Scholar] [CrossRef]
- Keifer, C.J.; Chu, H.H. Synthetic storm pattern for drainage design. J. Hydraul. Div. 1957, 83, 1325–1332. [Google Scholar] [CrossRef]
- Liao, D.; Zhu, H.; Zhou, J.; Wang, Y.; Sun, J. Study of the natural rainstorm moving regularity method for hyetograph design. Theor. Appl. Climatol. 2019, 138, 1311–1321. [Google Scholar] [CrossRef]
- Wang, L.; Pan, X.; Zhao, F.; Yang, S.; Li, Y.; Li, H.; Liu, Z.; Xu, M. Compilation and Application of Urban Waterlogging Risk Map in Beijing; Beijing Waterworks: Beijing, China, 2022; pp. 24–29+43. [Google Scholar] [CrossRef]
- Shen, M. During and After the Disaster! Multi-Image Comparison of Mentougou’s Recovery and Reconstruction. 2023. Available online: https://www.toutiao.com/article/7292271587213050406/ (accessed on 6 June 2025).
- Yang, L.; Ren, M. Mobile Communication Interrupted in 5 Towns of Mentougou District, Beijing; Power Supply Cut off in Some Areas–Emergency Repair Work Underway. 2023. Available online: https://www.toutiao.com/article/7262135087389753908/ (accessed on 6 June 2025).
- Xiangyu, H.; Tianqi, W.; Jun, C. Two Men Trekked 8 Hours Out of the Mountains and Guided Rescue Teams to Save 6 Stranded Villages: “I Just Did What I Should”. 2023. Available online: https://www.toutiao.com/article/7264567427269132835/ (accessed on 6 June 2025).
- Wang, Y.; Zhang, K.; Li, Z.; Tong, Y.; Di, S.; Zheng, F.; Li, Q. Identification and Analysis of Flood Submersion Range of the "23·7" Extreme Rainstorm in Beijing; Beijing Waterworks: Beijing, China, 2024; pp. 5–11. [Google Scholar] [CrossRef]
- Zhang, Y.; He, S.; Ma, J.; Sun, S.; Wang, Z.; Wu, J. Simulation of Flash Floods in Urban Small Watersheds Based on 1D and 2D Coupled Hydrodynamic Methods: A Case Study of the “23·7” Rainstorm Flash Flood in Mentougou, Beijing. South-to-North Water Transf. Water Sci. Technol. (Chin. Engl.) 2025, 23, 590–597. [Google Scholar] [CrossRef]
- Wang, Y.; Du, L.; Ji, M.; Gao, Q.; Zhang, X.; Liang, S.; Wang, M.; Han, C. Analysis of New Runoff Generation Mechanism of the “23·7” Extreme Flood in Yongding River Basin, Beijing. China Flood Drought Manag. 2025. [Google Scholar] [CrossRef]


Disclaimer/Publisher’s Note: The statements, opinions and data contained in all publications are solely those of the individual author(s) and contributor(s) and not of MDPI and/or the editor(s). MDPI and/or the editor(s) disclaim responsibility for any injury to people or property resulting from any ideas, methods, instructions or products referred to in the content. |
© 2025 by the authors. Licensee MDPI, Basel, Switzerland. This article is an open access article distributed under the terms and conditions of the Creative Commons Attribution (CC BY) license (https://creativecommons.org/licenses/by/4.0/).