Abstract
The escalating frequency and severity of natural disasters present significant challenges to the stability and sustainability of global financial systems, with the US stock market being especially vulnerable. This study examines sector-level exposure and contagion dynamics during climate-related disaster events, providing insights essential for sustainable investing and resilient financial planning. Using an advanced econometric framework—dynamic conditional correlation GARCH (DCC-GARCH) augmented with Generalized Hyperbolic Processes (GHPs) and an asymmetric specification (ADCC-GARCH)—we model daily stock returns for 20 publicly traded US companies across five sectors (insurance, energy, automotive, retail, and industrial) between 2017 and 2022. The results reveal considerable sectoral heterogeneity: insurance and energy sectors exhibit the highest vulnerability, with heavy-tailed return distributions and persistent volatility, whereas retail and selected industrial firms demonstrate resilience, including counter-cyclical behavior during crises. GHP-based models improve tail risk estimation by capturing return asymmetries, skewness, and leptokurtosis beyond Gaussian specifications. Moreover, the ADCC-GHP-GARCH framework shows that negative shocks induce more persistent correlation shifts than positive ones, highlighting asymmetric contagion effects during stress periods. The results present the insurance and energy sectors as the most exposed to extreme events, backed by the heavy-tailed return distributions and persistent volatility. In contrast, the retail and select industrial firms exhibit resilience and show stable, and in some cases, counter-cyclical, behavior in crises. The results from using a GHP indicate a slight improvement in model specification fit, capturing return asymmetries, skewness, and leptokurtosis indications, in comparison to standard Gaussian models. It was also shown with an ADCC-GHP-GARCH model that negative shocks result in a greater and more durable change in correlations than positive shocks, reinforcing the consideration of asymmetry contagion in times of stress. By integrating sector-specific financial responses into a climate-disaster framework, this research supports the design of targeted climate risk mitigation strategies, sustainable investment portfolios, and regulatory stress-testing approaches that account for volatility clustering and tail dependencies. The findings contribute to the literature on financial resilience by providing a robust statistical basis for assessing how extreme climate events impact asset values, thereby informing both policy and practice in advancing sustainable economic development.
1. Introduction
The number and intensity of natural disasters continues to increase with climate change, posing escalating threats to global economic stability, environmental resilience, and the long-term sustainability of financial systems. Climate-related disasters—driven by rising temperatures, sea-level rise, and extreme weather events such as hurricanes, wildfires, and floods—have disrupted economic activity, strained infrastructure, and triggered volatility in financial markets. As climate shocks propagate through the economy, the financial sector, particularly publicly listed firms, plays a dual role as both a potential absorber and transmitter of risk.
Firms are now confronted with the combined challenge of managing physical climate risks—stemming from damage to infrastructure, supply chain disruptions, and operational interruptions—and transition risks, arising from shifts in regulation, investor expectations, and market sentiment during the shift toward low-carbon economies. The degree of risk exposure depends on the sector in which a firm operates, the nature of its assets, its adaptive capacity, and its strategic alignment with sustainability objectives. This underscores the need for sector-specific assessments to inform climate risk management strategies that align with sustainable economic development goals.
This study builds upon a growing body of work examining the relationship between climate events and financial systems (e.g., Botzen [1], Noy [2]) but addresses a gap in the literature by adopting a distribution-flexible modeling framework. Few prior studies have employed the Generalized Hyperbolic Process (GHP) to capture asymmetries, tail dependencies, and non-Gaussian features in financial returns—elements critical for understanding the true scale of systemic climate-related risks. By integrating GHP into dynamic conditional correlation Generalized Autoregressive Conditional Heteroskedasticity (DCC-GARCH) and its asymmetric extension (ADCC-GARCH), we offer a novel methodological approach for measuring sector-specific vulnerability, resilience, and contagion during disaster events.
We investigate the impacts of natural disasters on the US stock market by analyzing daily returns of 20 publicly traded companies from five key sectors—insurance, energy, automotive, retail, and industrial—over the period 2017–2022. In doing so, we assess not only the immediate financial consequences of climate-related shocks but also how interdependencies and volatility spillovers across sectors influence the stability and sustainability of capital markets.
This paper makes four main contributions. First, it quantifies the influence of natural disasters on aggregate market behavior (S&P500 index) and firm-level returns. Second, it identifies which sectors are most susceptible to disaster-induced financial contagion and volatility. Third, it evaluates the incremental benefits of GHP-based specifications in correlation and volatility modeling compared to conventional Gaussian approaches. Fourth, it applies an asymmetric extension (ADCC-GARCH and ADCC-GHP-GARCH) to examine how negative shocks induce persistent correlation changes, shedding light on asymmetric contagion dynamics relevant for sustainable investment risk assessment.
Overall, this research provides a framework for assessing financial resilience to climate risk that integrates methodological innovation with sector-specific insights, contributing to the literature on sustainable investing and financial system stability under climate uncertainty. The findings have implications for designing targeted sectoral risk management strategies, informing regulatory stress-testing protocols, and supporting the transition to sustainable capital markets.
To guide this inquiry, we pose three research questions: (1) How do sectoral stock returns react to natural disasters in terms of volatility and correlation? (2) Which sectors exhibit the greatest vulnerability and tail-risk exposure? (3) Can advanced econometric methods (DCC-GARCH and its extensions) provide enhanced insights into the dynamics of financial contagion and sectoral resilience during such events? We address these questions using models that capture asymmetries, tail dependencies, and time-varying correlations—empirical features that are essential for sustainability-oriented financial risk analysis.
The paper is structured as follows: Section 2 reviews the literature on climate risk and financial market responses. Section 3 outlines the data and methodology, including the integration of GHP within the DCC-GARCH and ADCC frameworks. Section 4 presents empirical findings on sectoral dynamics, model performance, and conditional correlations. Section 5 discusses implications for sustainability, policy, and investment strategy, followed by concluding remarks and future research directions.
2. Literature Review
Climate change is a global and growing concern surrounding and influencing many aspects of life, from economic stability to the performance of enterprise. A proper reconciliation of natural disasters and stock market behavior are critical to understanding. Although earlier studies have examined the economic effects of natural disasters, the findings have been mixed due to different research methodologies and frameworks.
Research has indicated that natural disasters can affect stock market indices and the stocks of specific companies. Wang [3] pointed out links between natural disasters in Japan and the performance of insurance stocks between 1989 and 2011. Ewing, Hein, and Kruse [4] found Hurricane Florys to have a negative impact on insurance company stock prices, and they noted variation in prices throughout the event.
A considerable amount of research spanning a broader context has examined the economic effects of natural disasters. Botzen et al. [1] and Noy [2] established that there were significant effects on an economy as a whole, while Fang et al. [5] and Giraldo [6] pointed to connections between the value of assets and natural disasters. Collectively, the studies suggest not only a physical disturbance to companies as a result of climate change but also an indirect disturbance to companies through regulatory limitations and reputational risks [7,8].
Natural disasters have different economic effects, some of which are sector-specific. For instance, Bouwer [9] found that the same economic effects from an earthquake are not the same economic effects as those for extreme temperature events, landslides, floods, or storms. The sector-specific effects have been documented. Carleton and Hsiang [10] found that different natural disasters impact sectoral economic values differently, whereas Koerniadi et al. [11] reported the overall markets’ negative effects on the insurance, oil, and power production, and retail. Even recent studies are indicating the effect of a natural disaster can still be strong but is typically restricted to a portion of the sectors or markets by region. For example, Bourdeau-Brien and Kryzanowski [12] find that while natural disasters overall have little (i.e., statistically significant) impact on stock returns, the associated volatility for the affected areas is often amplified, especially for hurricanes and extreme temperature events. Similarly, Seetharam [13] found companies subject to the effect of disasters (earthquakes and floods) had observable negative stock market valuations and localized disinvestment based on investor aversion to investing in the recovery area.
Discrepancies in the industries’ reactions to different natural disasters are noteworthy. Malik et al. [14] noted the sectors of banking, electronics, and construction reacted differently to weather-related disasters than the telecommunication, medical equipment, and steel sectors. Additionally, Hepburn et al. [15] caution that stock markets are often considered subject to long-term risks, when analyzing climate change spillover impacts in financial markets and this is important as natural disasters impact regions affected in different ways.
To make an illustration of cyclones, they had varied backgrounds with extreme effects on stock performance. Hurricane Katrina, while it devastated in a way that can be expected in large natural disasters, had a relatively modest impact on stock markets. In contrast, almost out of the blue, was the 2011 flooding in Thailand, which had a larger economic impact than expected given the size of the economy [16]. Natural disaster stock market reactions shows the very complex economic implications of these events, which are less frequent than weather events.
Reported levels among sector impacts still diverge. Mei [17] points out that stock values for insurers in the US markets are considerably impacted using L affected depending on the type of catastrophe. Zhao et al. [18] also extended the investigation by noting that catastrophes can affect firm-level crash risk which may profile the corporate governance and investors in emerging markets.
Pagnottoni et al. [19] expanded the directionality by examining 100 countries and the ecology-based disaster events that garnered the most significant change in goose ponds worldwide under climatological and biological events. In accordance with Zhao et al. [18], it was assumed that the response in Europe stock indices appeared affectively greater where there was also a known geographic and institutional infirmity, with conjecture indicating trends for evolving vulnerabilities over the decades. Through the use of time series modeling, the author identified “modeled” post-disaster behaviors and markets. It was also revealed how improved predictions could profitably benefit from an assessment of economic shocks with their degree of severity [20].
Continued research, of critical interest, relates to the dynamic linkages associating climate events and financial markets using a complexity of econometric tools. Models such as Markov-Switching DCC-GARCH (MS-DCC-GARCH) encompass regimes representing changes in panel correlation dynamics. Balcilar et al. [21], with this type of MS-DCC-GARCH model of the carbon markets in relation to energy futures, would demonstrate that bi-directional intratertial linkages exist across sectors even in the event of the EU Allowance market. While models such as MS-DCCGARCH can represent both time-related time-varying conditional correlations and volatility, it is also essential that econometricians have context for the representation of the underlying distribution of financial returns during damaging times; for example, models should be based on what occurred post-disaster and the evaluation of standard distributional assumptions should be significant as well. As also emphasized by Balcilar et al. [21], if there are probabilities there are upper and lower tail probabilities; thus, it therefore seems reasonable to evaluate models that employ more efficient frameworks without normal distribution assumptions [20]. Consequently, GHPs and their respective generalized hyperbolic distributions (GHDs) are utilized as financial modeling tools that are better understood than previous models, with the competence to appreciate complexity characterizing phenomena such as the mapping of natural disasters onto financial market dynamics [22,23]. GHP and GHD mainly differ from previous models using Gaussian-based approaches by providing researchers with flexibility to model empirical characteristics (asymmetric, extreme kurtosis, and skewed) when there are empirical characteristics pertaining to processes poorly depicted by any Gaussian model [24,25]. Consequently, GHPs, and by extension GHDs, have emerged as important modeling tools in finance particularly for appreciating the complexity that typifies the dynamics of asset return conditional on extreme market occurrences. GHP provides the flexibility to model asymmetric distributions, fat tails, and leptokurtic behavior that are attractive substitutes to classical stochastic processes, primarily when trying to model the effects of natural disasters on financial market behaviors.
The GHD family has a number of important distributions such as the Normal Inverse Gaussian (NIG), Variance-Gamma, and Scaled t-distribution, each of which has demonstrated considerable effectiveness in modeling financial time series [26,27,28]. Measurable stochastic processes derived from GHG laws are now largely accepted for modeling the natural course of financial market dynamics over time [24,25,28,29].
Giving careful consideration to the capacities of GHPs in the modeling of turbulent dynamics, Eberlein and Kludge [30] noted GHPs’ capacity to sustain portfolios derived from extreme events; thus providing a cross-sectional glimpse of risk while perpetually crossing price turbulence through time. In their seminal work, Oliveira-Filho et al. focused on one key feature of GHP and found it consistently outperformed traditional models in describing the volatility dynamics around these significant market events [29]. This feature will be particularly relevant for disaster studies. During disasters (natural or otherwise), we often have the kind of sudden and extreme price movements that GHP is able to simulate in a useable manner.
While the DCC-GARCH model is widely used, alternatives such as Copula-GARCH, MS-DCC-GARCH, and t-GARCH have also been employed to capture time-varying dependencies and fat tails. However, these often assume symmetric distributions or fail to model skewness effectively. The generalized hyperbolic distribution offers superior flexibility by accommodating skewness, leptokurtosis, and asymmetry simultaneously, making it particularly suitable for modeling financial behavior under disaster-driven volatility. For instance, Kim (2022) [31] demonstrates that ARMA–GARCH with fractional GH innovations more accurately fits high-frequency return residuals than normal or non-fractional GH models [32]. A dynamic Copula-GARCH–GH approach has also been applied to option pricing in the Chinese market, yielding markedly different valuations under GH vs. Gaussian innovations [33]. More generally, GH models have been reviewed and shown to outperform symmetric alternatives in capturing skew and fat tails [34]. Additionally, Bianchi [35] found that multivariate GH models significantly improve CoVaR estimation compared to models with symmetric or t-distributed innovations [35].
While the present study relies on econometric models such as DCC-GARCH and its extensions to capture volatility and correlation structures in response to extreme events, recent advancements in deep learning offer alternative pathways for forecasting financial market behavior. For instance, Staffini (2022) [36] introduces a Deep Convolutional Generative Adversarial Network (DCGAN) for stock price forecasting, showing superior performance over traditional approaches like ARIMA and LSTM. This highlights the potential of adversarial learning to model complex, nonlinear market dynamics. Similarly, Hoseinzade and Haratizadeh [37] (2019) develop CNNpred, a convolutional neural network model that leverages a diverse array of financial indicators to predict stock market movements. Their approach aligns conceptually with the multi-sectoral framework employed in this paper, underscoring the importance of incorporating heterogeneous inputs to better capture market sensitivities. While deep learning models primarily focus on predictive accuracy, the GARCH-based approach retains advantages in interpretability and direct modeling of time-varying volatility and co-movement, suggesting that the two paradigms may be complementary in analyzing market reactions to disaster-driven shocks.
Luciano and Semeraro [38] used GHP to reference systemic risk, which could encapsulate the interconnectivity among financial entities; they discussed how they were able to grasp the contagion effects and the tail dependencies that are also involved. This work is directly transferable to other studies—or up to the entire sectors when looking at sectoral interconnections during disasters, as there are typically very similar major crises involving many of the same affected industries.
Eberlein, Özkan, and Papapantoleon [39] also employed various forms of GHP to model the tail dependencies associated with natural disasters, as they affect equity markets. This work concluded that a wider variety of stochastic processes are required in modeling the overall economic impact associated with these events.
GHP has even been successfully applied to explore the behavior of stock returns in international markets; if one were to apply the same process to disaster-related finances more broadly, this would support its inclusion going forward. Baciu [40] tested different GH distributions including Normal Inverse Gaussian and Variance-Gamma on Romanian stock data and concluded that the GHP distribution fit the data better than any competing model, and certainly better than any Gaussian or leptokurtics. Hai-yan [41] also used GHP to estimate VaR in the Chinese stock market and demonstrated a greater level of accuracy about tail risks than when using normal distributions.
Thus, using GHP in the framework of financial modeling provides an important impetus for including it in the study of natural disasters that affect the US stock market. If traditional models have limitations in their ability to represent market behavior, especially at times of extreme price activity, GHP can better represent the extreme and asymmetric conditions that are frequently present during these events. This paper also serves as an extension of prior work that advances the notion of GHP into the sectoral dynamics of natural disasters and provides a holistic perspective on how those natural disasters impact stock market trends and inter-sector relationships.
The psychological impacts of disasters on decision making by investors also warrant attention. For example, Bourdeau-Brien [42] demonstrated evidence of amplified regional risk aversion after a disaster which may relate to an absolute pricing-liquidity basis in municipal bond markets (dually, there could also be a spatial aspect to investors’ behavior in investing locally). Bharath and Cho [43] found that disaster survivors showed lower risk measures, that is, risk was flattened; even when they moved across the country, survivors made worse investment decisions because those people were not prepared to invest in riskier assets after the event.
In summary, while natural disasters and financial markets have long received quasi-obsessive attention from researchers, GHP has not received the same level of attention in terms of application. This paper attempts to remedy this by employing GHP in the analysis of sectoral effects linked to natural disasters and providing useful decisions for risk and risk management in policy directives.
3. Research Methods
In this paper, we utilize a multi-layer quantitative technique to analyze the economic effects of natural disasters on the US stock market using Generalized Hyperbolic Processes (GHPs) to present our findings. Combining GHP with the DCC-GARCH model, we provide a multi-dimensional view of asset price dynamics and inter-sector correlations for active co-movement under severe market-disrupting shocks.
The data used for analysis incorporates daily closing stock prices for each of the 20 firms from Yahoo Finance from 1 January 2017, to 1 January 2022. The firms represent a variety of sectors including insurance, energy, automotive, retail, and industry. The firms were selected to represent a mix of market leaders and major operators across the five specified sectors. Selection criteria included market capitalization, sector weighting in S&P indices, and public availability of return data. While Yahoo Finance was used for data collection, cross-checks against Bloomberg and adjustments for dividends and splits were applied. Days with missing data due to low liquidity or technical reasons were handled using linear interpolation, preserving continuity in volatility modeling.
We used the following natural disasters to assess the stock price impacts within that timeframe, Hurricane Harvey, the California Wildfires, Hurricane Florence, the Australian Bushfires, Hurricane Ida. Natural disasters were identified from NOAA and EM-DAT databases based on impact scale, duration, and economic damage. Events were included if they caused >USD 1 billion in insured losses and/or >50 fatalities. Severity was classified by economic cost (USD) and normalized by year. We use a [−5, +5] window to capture anticipatory trading and short-term post-event volatility.
The stock returns are calculated using the logarithmic difference of closing prices:
where is the return at time , is the closing price at time , and is the closing price at .
We denote the vector of returns as , with stocks across sectors: automotive, insurance, energy, retail, and industry. Natural disaster events are encoded as dummy variables in an event study framework, with windows around the occurrence date. These dummies enter as interaction terms with sector indicators for sector , producing structured heterogeneous effects:
The DCC-GARCH model, introduced by Engle [44], is used to analyze the dynamic correlation and volatility among the selected companies. This model comprises two steps: estimating univariate GARCH models for each stock return series and then estimating the time-varying conditional correlations.
Each stock return series is first modeled using a univariate ARMA (1,1) and GARCH (1,1) process. The model is specified as
Stacking the residuals and standardizing as , we form the conditional covariance matrix as where . The dynamic conditional correlation matrix evolves using the equation
where is the conditional covariance matrix, is the unconditional covariance matrix of the standardized residuals, are the standardized residuals, is the conditional correlation matrix, and and are parameters that capture the dynamics of the correlations.
To further account for potential asymmetric responses in correlation dynamics, where market downturns might impact correlations differently than upturns, an asymmetric DCC (ADCC) GARCH model is employed. This approach extends the standard DCC framework by introducing a specific term to capture the differential impact of negative shocks [45,46,47]. The conditional quasi-correlation matrix dynamics in the ADCC model are specified as
where captures the asymmetric effects, typically isolates negative shocks (e.g., ), and N is the unconditional expectation of .
In order to relax the hypothesis of normality of residuals, ϵt, a distribution from the GHP family is introduced. The generalized hyperbolic distribution has five parameters. If the random variable X follows a generalized hyperbolic distribution, one can write the following [45]:
where is a location parameter, serves for scaling, determines the shape, determines the skewness, and influences the kurtosis and characterizes the classification of the generalized hyperbolic distributions.
In this context, we extend the estimation of univariate GARCH using GH instead of the normal distribution, and then maximum likelihood estimation (MLE) has been applied to simultaneously calibrate the following: (i) the parameters of GARCH, (ii) the parameters of DCC-GARCH, (iii) the parameters of GHYP.
The DCC-GHP-GARCH model extends the conventional specification even further by the inclusion of the Generalized Hyperbolic Process that captures skewness, heavy tails, and tail dependence via parameters (λ, skew, and shape), hence providing upwardly flexible and realistic modeling of dynamic financial return processes.
The method for embedding GHP processes is as follows:
- The table of descriptive statistics, skewness, and the kurtosis of the returns together with the Jarque–Bera normality test statistics are presented in Table A1 from the Appendix. The returns exhibit heavy tails, and we reject the null hypothesis that the returns were normally distributed.
- Each return series is modeled using a univariate GARCH-GHP. After estimating the GARCH-GHP model, using the standardized residuals, we then construct the conditional correlation matrix using the extended DCC-GARCH framework.
- We compare the conditional correlation matrices from the two models (DCC-GARCH and DCC-GARCH-GHP) in order to identify sectors and companies that are similarly correlated.
- We measure the model’s performance through statistical criteria AIC (Akaike information criterion) and BIC (Bayesian information criterion).
GHP models are able to characterize asymmetry, leptokurtosis, and autocorrelation in financial time series and also offer greater flexibility than Gaussian models. Developing a GHP to represent prices and volatility post-natural disaster may help to accurately characterize the extreme behavior of financial data.
As an additional layer of validation and model robustness checking, we opt to evaluate backtesting results for Value-at-Risk [48]. This is a parametric method which can quantify the potential losses of a portfolio over a specific time period at a certain confidence interval (0.1, 1, or 5% and so on). Thus, a one-period estimation of VaR can be represented as
where represents the returns and represents the z-score for the confidence interval which can be set to any type of distribution, while corresponds to the standard deviation and V for the value of an asset or portfolio. Using the GARCH techniques, we can compute specialized VaR predictions using conditional standard deviation estimations.
For a solid comparison, the Kupiec test [49] will be our main choice. Often referred to as an unconditional coverage test, it evaluates whether the observed frequency of exceptions is consistent with the frequency predicted by the VaR model. An exception, or “failure,” occurs when the actual loss on a given day exceeds the VaR estimate.
Here, is expressed as the number of observed exceptions, is the total number of the observations in the backtesting period, and is the specific failure rate. This likelihood-ratio based test follows a chi-square distribution with one degree of freedom.
4. Results
4.1. DCC-GARCH Model with GHP
In this section, we present the empirical results of the application of the DCC-GARCH and DCC-GARCH model with GHP process to our data of twenty publicly listed companies that are impacted by natural disasters. We show the cross-industry impact—in other words, different sectors that are impacted—and we examine the sectors for a range of industries in the contexts of insurance, energy, automotive, retail, and industry overall. We shall reference the descriptive statistics table used for this paper in Appendix A.
The insurance sector (Figure 1) in our study included Allstate Corporation, Travelers Cos Inc., American International Group Inc., and Insurance Australia Group. Volatility in the price of the companies was not heavily affected, then there was a visibly significant disturbance after the major natural disasters. In the case of Hurricanes Harvey and Irma for example, Allstate lost USD 1 billion and achieved a performance for the third quarter of 84 cents per share. Travelers stock became 2.6 per cent lower before the event and they reported losses of USD 750 million in damages. American International Group had a 2.1 percent lower stock price after they announced possible losses of USD 3.1 billion in losses.
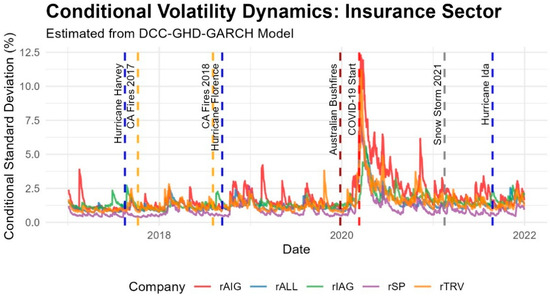
Figure 1.
Conditional standard deviation evolution in the insurance sector.
Therefore, the fires that burned through California in 2017 caused quite a bit of damage to insurance companies. The reported total losses, for example, for Allstate at USD 516 million, were related to fire losses. Travelers had a total of USD 525 million in losses with a 2.47 per cent decline. American International Group experienced USD 572 million in losses. The insurers were able to withstand this cost through higher premiums, even by investing in loss and increases realized from premiums. The wildfires the following years were expensive for Allstate, resulting in a 9 (11% loss) day drop in stock price. Travelers noticeably posted a 2% loss with USD 453 million in losses, while American International made moves to stabilize their wildfire protection unit.
Hurricane Florence in 2018 illustrated just how much prices are affected in insurance, in particular: Allstate (6.6% market share in North Carolina) were down close to 2%, Travelers down 1.7%, and American International down 3.3%. Hurricane Ida in 2021 and over USD 500 million of losses in business for Allstate and Travelers showed that they can be resilient using better underwriting by using advanced analytics and the right insurance as a transfer of risk (reinsurance).
When examining dynamic correlations (Figure 2), we observe a moderate coefficient (ranging from 0.4 to 0.6) maintained over time for geographically close entities, specifically US-based insurers (AIG, Allstate, and Travelers). During disasters, these companies tend to align in their responses, though not to an extreme degree, exhibiting a consistent trajectory over the years. In contrast, the Insurance Australia Group shows dynamic correlation coefficients that are close to zero. The absence of alignment between the US and Australian markets indicates that insurers located in the same area and facing environmental disasters do not pose a risk of spillover effects to other insurers in different geographical markets.
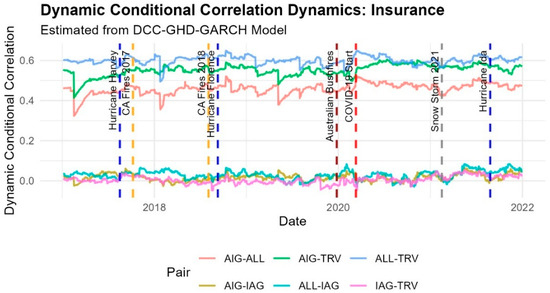
Figure 2.
Dynamic conditional correlation evolution in the insurance sector.
The oil and gas sector (Figure 3) includes Exxon Mobil, Shell, Valero, Phillips 66, and Marathon Petroleum. Climatic events, such as floods and hurricanes, cut off energy infrastructure to catastrophic proportions. Eighteen refineries in Texas shut down during Hurricane Harvey, resulting in a 20% reduction in US refining capacity. This has led to price increases and gasoline shortages across the country. Exxon Mobil’s results were down by USD 0.04 per share due to damage at their Baytown and Beaumont facilities. At Shell’s Deer Park Refinery, the damage closed both facilities down. Valero decided to shut down all their units in Texas and, surprisingly, Valero shares jumped up 15% after the storm. Both Phillips 66 and Marathon Petroleum experienced results ranging from USD 2 million (Phillips) to USD 850 million (Marathon). Compared to the California fires and Hurricane Florence, there was moderate disruption and enough disruption due to the COVID-19 pandemic that it continentally affected the entire sector. Marathon Petroleum had cycles of profitability during each period of disruption. Hurricane Ida impacted the capacity of the Marathon 578,000 bpd refinery. There were no notable fluctuations in oil prices. The February 2021 snowstorm generated some disruptions to supply which caused oil and natural gas prices to rise. Exxon ended depot operations in the Gulf Coast. It should also have been stated that Shell was going to take a USD 200 million knock in the first half of the year. Valero explained challenges to operations due to the storm. This illustrates the extent of vulnerability to severe weather in the sector.
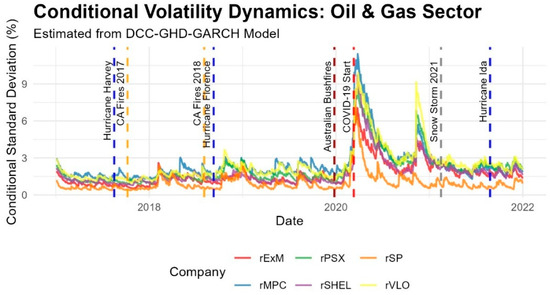
Figure 3.
Conditional standard deviation evolution in the oil and gas sector.
Regarding the oil and gas sector, we observe the strongest correlated market, with most asset pairs maintaining correlation coefficients between 0.5 and 0.8 (Figure 4), indicating moderate-to-strong correlations. Analyzing the impact of the COVID-19 pandemic, we can identify a rapid upward trend across all asset pairs, which reflects an immediate volatility clustering phenomenon. This phenomenon is also evident in several other instances along the time axis for all assets.
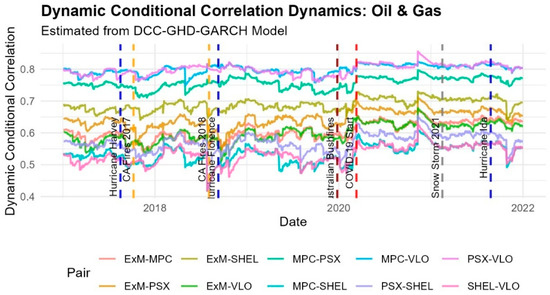
Figure 4.
Dynamic conditional correlation evolution in the oil and gas sector.
Continuing to the automotive sector, which is situated in Figure 5, we take a look at General Motors and Ford. The production of vehicles emits CO2 which increases climate change. Climate-related events (hurricanes) create opportunities for replacement where destroyed vehicles will create increased demand. After hurricanes, based on the acquirement of information, both Ford and General Motors experienced positives in their share prices; each increased +3.1 and 3.5 percent, respectively. In the case of Hurricane Florence, the sales decreased by 11%. Hurricane Ida created demand as customers received funds from financial assistance, as well as incentives.
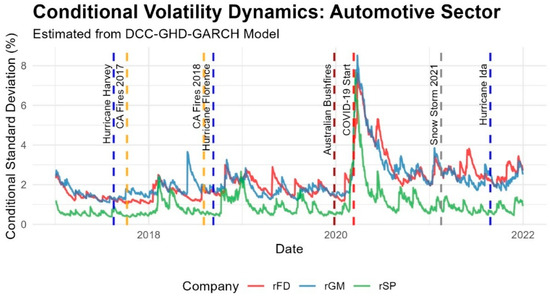
Figure 5.
Conditional standard deviation evolution in the automotive sector.
The February snowstorm had a substantial impact with many closed factories, and there have been price declines in both Ford and General Motors. The California fires also had the same visible effect with respect to price declines. Finally, through COVID-19, Ford had a profitability decrease of 15.6 percent but General Motors had a profitability increase through the sale of high-yielding margins, SUVs, and trucks.
The correlation between Ford (FD) and General Motors (GM) is moderately high and stable, generally fluctuating between 0.60 and 0.68 (Figure 6), with a single sharp drop to 0.52. The most significant distinction between these two assets is evident during the COVID-19 pandemic. Following the pandemic events, there was a period of high volatility clustering as the market digested news of supply chain disruptions and shifting consumer behavior. Even though these two companies faced uncertainty, their reactions to the pandemic differed in overall amplitude. In general, the automotive industry tends to move in unison but reacts differently to various events.
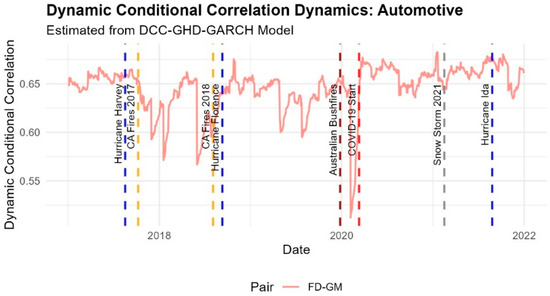
Figure 6.
Dynamic conditional correlation evolution in the automotive sector.
Natural disasters can bring about different physical risks around electrical installations and infrastructure; however, this sector (Figure 7) has companies across electric utility and generation industries such as Edison International and Vistra Corp. In the US, Taxas, Irving, as graphically identified in the time-bound components of stock trading, Edison International experienced a peak volatility spike producing a decline of USD 53.56 per share (−12.2%) during the California Fires in 2018. Vistra Corp also experienced volatility of −20.9%, due to the effects of gas shortages actualization from the February 2021 snowstorm and obstructed supply obligations. The lowest level of grievance was due to minor pricing in tropical cyclones, which did adversely affect energy supply and demand spikes because of heatwaves.
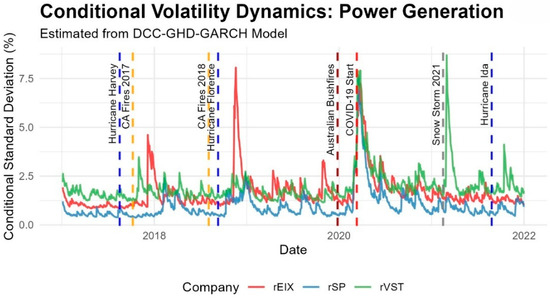
Figure 7.
Conditional standard deviation evolution in the energy sector.
Power generation sector players typically react differently and have little to no relation in terms of reactions after catastrophic events, with one exception during the start of the COVID-19 pandemic, which led Edison and Vistra to align with a correlation coefficient of 0.4 (Figure 8). A period of higher instability followed the pandemic, with a slightly higher correlation coefficient, but still not persistent enough.
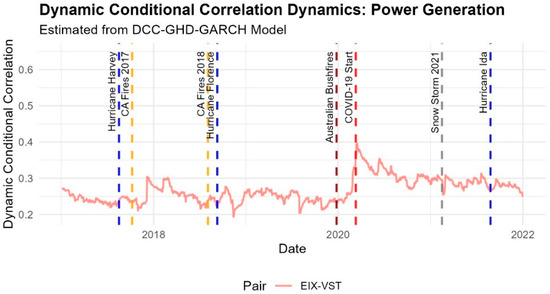
Figure 8.
Dynamic conditional correlation evolution in the energy sector.
The retail sector (Figure 9) comprises Walmart, Home Depot, Lowe’s Company, Lumber Liquidators, and Martin Marietta Materials. Generally, natural disasters increase sales in home improvement stores. In one case, Hurricane Harvey led to increased sales in Lowe’s and Home Depot and resulted in a 3.6% share price increase in Lumber Liquidators. Conversely, Hurricane Florence had the opposite effect prior to the event but caused a price increase followed by a decline for both Home Depot and Lowe’s Company. After Hurricane Ida passed, Walmart was forced to close over 100 locations but other companies in the same sector and price range reported an increase in prices. The presence of wildfires produced very low returns for Lumber Liquidators in the vicinity of the disturbance, while the snowstorm event that occurred in the February of 2021 caused significant disruptions from closures, which affected supply chain distribution for over 350 Walmart stores.
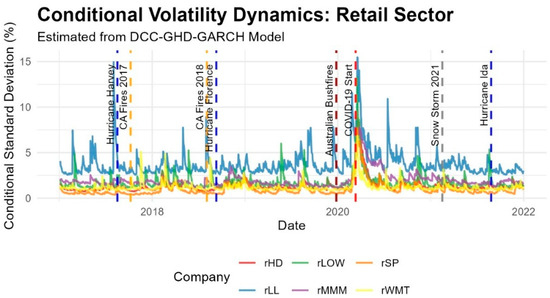
Figure 9.
Conditional standard deviation evolution in the retail sector.
The home improvement giants Home Depot (HD) and Lowe’s (LOW) exhibit a very high and stable correlation, which remains at around 0.7 for the entire observed period (Figure 10), reflecting their nearly identical business models. At the same time, their correlation with other retailers, such as Walmart (WMT), is significantly lower. During these disaster events, the correlation between the home improvement stores and other retailers often decreases, as consumer spending priorities shift. This phenomenon demonstrates how a shock can cause spillovers within a subsector while simultaneously leading to decoupling from the broader sector.
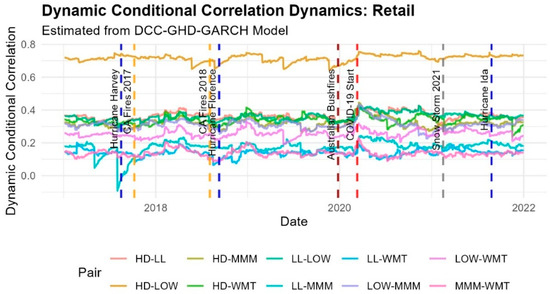
Figure 10.
Dynamic conditional correlation evolution in the retail sector.
The industry sector (Figure 11) consists of Generac Holdings and Bega Cheese Limited. Generac Holdings is particularly sensitive to changes in weather conditions, which is evidenced by a 6.6% stock price increase after Hurricane Harvey, as well as the North American snow storm in 2021. Specifically, stock prices became inflated as revenues increased by 17% once preparations for Hurricane Florence were underway. The prevailing snowstorm of February 2021 is commemorated as a time period when the amount of the share increased by nearly 10%, revealing a degree of trust by the investor in the home improvement stocks as well as the generator stocks. The 2019–2020 Australian fires provided strong evidence to the contrary; Bega Cheese Limited experienced large losses with a share drop of 8.5% due to their operational disruptions and drought impact on milk production. The industry’s response to climate change was evident, with varying impacts on each company. Although the least affected and most stable asset is Bega Cheese Limited, which maintains a more stable behavior, Generac Holdings tends to align with S&P500 in matters of volatility, especially at the start of COVID-19, which directly suggests that Generac Holdings is tightly integrated with the general market.
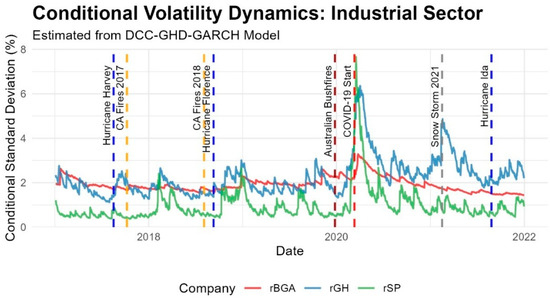
Figure 11.
Conditional standard deviation evolution in the industrial sector.
This pair serves as another illustration of insulation from shocks (Figure 12). The Australian Bushfires (2019–2020) were a major shock to Bega but had no effect on its correlation with Generac. Conversely, US hurricanes that drive demand for Generac’s products do not spill over to Bega.
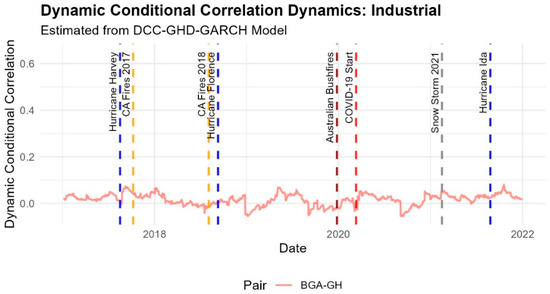
Figure 12.
Dynamic conditional correlation evolution in the industrial sector.
A general and evident variable in each one of the sectors is the shock brought by the start of the COVID-19 pandemic. The sectors which suffered the most were retail and insurance, with a relative conditional standard variance rising up to 15% (AIG) and 12.5% (LL). While this shock manifested as a sharp increase in volatility, the dynamic correlation analysis reveals a more complex reaction. For many sectors, such as automotive and insurance, the initial phase of the pandemic caused a significant drop in conditional correlations. This suggests that the systemic uncertainty led to an initial divergence in market reactions, where the established relationships between firms temporarily broke down before settling into a new period of volatility clustering.
4.2. Empirical Results of Traditional DCC-GARCH Model
In addition to the focus on specific correlation values noted above, Table 1 includes additional valuable information about underlying market dynamics that are incorporated in the DCC-GARCH model. The GARCH parameter estimates suggest high levels of persistence of volatility for most companies in the table, as indicated by β values exceeding 0.8. Furthermore, the DCC parameters (α = 0.008, β = 0.93) reflect a highly persistent conditional correlation process, suggesting that changes in asset co-movement decay rather slowly.

Table 1.
The empirical results of the DCC-GARCH model.
In the context of this volatility and correlation persistence, the DCC-GARCH model estimates suggest considerable levels of conditional correlation, particularly between companies within the same sector. Energy sector companies, for example, all show substantial conditional correlations between 0.55 and 0.8, likely attributable to common market characteristics and operational interdependence. Insurance sector conditional correlations among firms located in the US are moderate; however, the conditional correlation with Insurance Australia Group is negligible, possibly signaling a unique geographic market assumption. The retailers Home Depot and Lowe’s Company, within the home improvement sector, also show a high conditional correlation (0.73), indicating a similar market response potential following a natural disaster. The conditional correlations demonstrated in Table 1 emphasize the interconnected nature of companies within a given sector, and how they, in unison, respond to shocks in the external environment or among natural disasters.
In sum, the empirical results provide evidence that natural disasters impact stock prices to varying degrees across the diverse sectors. The DCC-GARCH model provided a viable alternative to estimate dynamic conditional correlations which further extends our knowledge of contagion within companies across sectors.
4.3. Empirical Results of GHP Process
The parameters for the generalized hyperbolic distribution estimated for the return series of the analyzed asset are shown in Table 2. The estimated parameters of the generalized hyperbolic distribution provide meaningful and actionable information about the dynamics of the returns for the analyzed assets. Most assets exhibit heavy tails, (λ < 0), suggesting that extreme returns, both positive and negative, could occur. For IAG, WMT, and BGA, this behavior is relatively more extreme compared to the other assets analyzed, which indicates that these companies exhibit greater exposure to extreme price movements. This reflects the increased susceptibility of these companies to market shocks, which increases the sensitivity of return behavior due to natural disasters. On the other hand, the assets PSX and GM displayed relatively less extreme tail behavior, indicating lower exposure to extreme price events compared to the other assets in the dataset.
Table 2.
The estimated parameters of the generalized hyperbolic distribution.
The scale parameter (α) indicates exposure to return variability across asset sectors. The companies GH (α = 0.407) and EXM (α = 0.368) have a relatively higher variability in returns, which suggests greater exposure to market variability. These values are expected for the energy and industrial sectors, which are more directly impacted by supply chain disruptions and property damage from natural disasters. Conversely, WMT (α = 0.034), HD (α = 0.034), and LOW (α = 0.017), which represent the retail sector, exhibit substantially lower variability. This evidence suggests that while these companies may have been impacted by disasters, it is possible their increased demand for essential needs would compensate for any price variability experienced due to disasters or other price shocks. The skewness parameter (β) indicates asymmetries in the return distribution for the analyzed assets. Most companies had negative skewness (β < 0), indicating a greater chance of experiencing extreme negative returns compared to extreme positive returns. To illustrate, TRV (β = −0.125) and HD (β = −0.104) are notably susceptible to downside risk. This is in accordance with the reaction of insurance and home improvement companies, which incur pressure from increased costs during disaster recovery. In contrast, FD (β = 0.163), GM (β = 0.073), and VST (β = 0.078) are positively skewed, signifying a greater likelihood of larger positive returns. These companies may reap the benefits of increased demand or operational efficiencies in the recovery period of the market or offset the impact of disasters. From the empirical findings, the results can be summarized as follows: (1) Insurance Sector (TRV, AIG, IAG): There are heavy tails and negative skewness, demonstrating the proclivity of insurance companies to catastrophic claims and liability during natural disasters. This is consistent with the extreme events where they bear the risk for. (2) Energy Sector (EXM, SHEL, VLO, PSX): There is a substantial tail and variance. Companies like EXM and SHEL demonstrate the risk from damage to infrastructure and interruptions in supply due to disasters; however, VST’s positive skewness shows the potential upside in the recovery phase of the market. (3) Retail Sector (WMT, HD, LOW): Retail companies exhibited heavy tails but low variance, as we had viewed before, suggesting their dual role as essential service providers during a disaster and stable providers during recovery. (4) Industrial Sector (MMM, GH, BGA): Industrial companies like GH and BGA also show high variance and heavy tails which reflect operational disruption risks and volatility in input pricing during extreme natural disasters. In evaluating the S&P500 index, evidence is present for moderate heavy tails (λ = −0.815) and negative skewness (β = −0.069), indicating the market’s susceptibility to extreme events while suggesting that risk is unequally distributed across sectors; sectors such as insurance and energy are more susceptible. Moderate variability (α = 0.149) in the S&P500 indicates a stabilizing effect for portfolios containing a diverse set of holdings.
The density plots in Figure A1 (Appendix A) suggest a variety of responses by sector and individual company, exhibiting asymmetric behavior and vulnerabilities in response to extreme market conditions that could be due to natural disaster events. In insurance and energy, it appears the respective companies exhibit heavy tails and negative skewness of return distributions, indicating that these sectors bear heightened exposure to extreme loss, i.e., insurance companies face catastrophic claims and energy contains a degree of operational disruption. Retail companies appear to be notably more stable, with returns clustering closely around zero and positive skewness in some cases, with incentives to attain demand in relation to economic recovery.
In comparing sectors, the S&P500 index provides a reflection of the broader market behavior, indicating less extreme volatility and moderate fat-tailing behavior relative to the sectors, likely due to the influence of the wider market effect of diversification of holdings.
Overall, the Asymmetric Generalized Hyperbolic (Asymm ghyp) distribution consistently exceeds the performance of the Gaussian distribution as a means of capturing fat tails and asymmetry of returns across all sectors. This underscores the efficacy of the presented method in characterizing extreme market events. The analysis has important implications for risk management and financial resilience planning, and these implications emphasize that it is critical to consider specific strategies at the sector level to mitigate financial risks and support recovery in the context of developing major climate-related disasters.
The QQ plot comparison of all 20 companies (Figure A2 and Figure A3 from Appendix A) provides important descriptive information about how the Asymmetric Generalized Hyperbolic (GHP) distribution compares to a Gaussian distribution for capturing the features of financial return data: (1) The GHP distribution fits the tails of the data much better than the Gaussian distribution for most of the companies, as evidenced by the stronger alignment of the red points (GHP) to the theoretical diagonal line in extreme quantiles. This fit strengthens the ability of the GHP distribution to capture extreme events and heavy tails, which are often characteristic of financial return series. (2) The primary quantiles fit, GHP and Gaussian, were comparable to each other for most companies as evidenced by the small deviation of the GHP fit for the middle quantile compared to the Gaussian fit. Again, the Gaussian fit will likely be insufficient in capturing some degree of asymmetry, but overall, the GHP fit again likely captures as much as possible. (3) The GHP distribution provides an improved fit for the asymmetry, ultimately supported by the deviations realized the middle-to-upper quantile GHP fit (i.e., indicating stronger positive asymmetry) compared to the Gaussian for companies such as MPC, PSX, and Shell. (4) It can clearly be observed that the energy and utility sectors’ companies (i.e., Shell, MPC) exhibit more complete deviations from Gaussian behavior, especially in the tails, again confirming the relevance of the GHP distribution from the financial perspective. (5) Overall, across all of the companies considered in this analysis, the GHP distribution provides a more robust fit for real-world financial data, and therefore in general a more applicable fit for the nuanced behavior of stock returns when presented with disasters, such as a natural disaster or market shock.
Descriptive comparisons of empirical centered moments are listed along with the generalized hyperbolic distribution equivalent moments in Table 3.
Table 3.
The empirical and the estimated centered moments of the returns.
In Table 3, empirical moments (which are moments calculated using historical observations) and estimated moments (which are moments calculated using a time series model) are shown for the returns of twenty companies and the S&P500 index. The estimates being discussed are closely associated with the Generalized Hyperbolic Process (GHP). In most cases of the empirical and estimated moments, the estimated means are very similar to the empirical means for the company returns. This finding suggests that the GHP model has performed well in estimating the central tendency of returns based on the prior part of the data. Slight differences between the means from the two (estimated and empirical) data sources were found for a few companies, such as VLO (Vistra Corp.), where the empirical mean return was much higher than the estimated mean. Most companies have estimated variances that closely reflect the empirical variance; however, the estimated variances are again a little lower than the empirical data for some companies, such as Shell and BGA. This finding suggests that the GHP model underestimated the variation or volatility for these companies. In looking at the asymmetry (skewness) values (where negative values represent left-tailed distributions and positive values reflect right-tailed distributions), the number of companies whose empirical skewness reflects higher asymmetry, either positive or negative, in their company distribution is larger than would be expected based on the estimated values. However, the findings reflected the flexibility of the GHP in capturing returns with asymmetry, but it also provided greater error for instances of exhibiting extreme left-tailed or right-tailed returns. Lastly, in terms of the distribution’s “peaked-ness” (kurtosis), or tail behavior, the kurtosis values between the empirical and estimated value is even greater for the two data sources for many companies. However, for all four of the metric comparisons, the S&P500 index closely aligns with the empirical values more significantly than in some cases for individual companies. With the S&P500, there is less of a difference between the empirical and estimated means, variance, skewness, and kurtosis, hence confirming the GHP captured the overall market’s behavior. In terms of accuracy for the model, on the accuracy side, for mean and variance, the GHP appropriately reflects the mean and variance, providing an accurate picture of the central tendency and volatility. For skewness and kurtosis, the model is able to reflect or capture asymmetry and tail behavior, but it depends on the type of company (normal vs. extreme), whereas the extreme companies mentioned (TRV and HD) provide greater instances of extreme events or asymmetry in company return distributions based on the empirical and estimated values, which the GHP was able to approximate but did not completely capture. Similarly, for the other companies (GH and MMM), the empirical and estimated values across all four characteristics provide alignment, thus showing that the model was especially effective for certain financial data.
4.4. Comparing the Empirical Results of DCC-GARCH and DCC-GHP-GARCH Models and the Results of ADCC-GARCH Models and ADCC-GHP-GARCH Models
The empirical estimates highlight the advantages of applying flexible distributional frameworks that can capture non-normal characteristics often exhibited in asset return data like leptokurtosis (heavy tails) and asymmetry as seen in Table 4. In addition to distributional characteristics, the empirical estimates show that conditional correlations are dynamic and evolve over the sample period. Although all specifications capture significant time-varying co-movements (the correlations are slow moving), the specific form appears to be sensitive to the distributional assumptions used. For instance, in shock-sensitive sectors like insurance, the simpler specifications of both models, which assume normality, might lead analysts to conclude that there are correlation “spikes” for short horizons, and then they stop co-moving in the longer term to something closer to zero. Meanwhile, models based on GHPs seem to better reflect the more persistent adjustment processes, allowing a more consistently positive level of correlations during turmoil, possibly due to the GHP’s ability to characterize negative correlations while adjusting for extreme returns.
Table 4.
The empirical results of the DCC-GHP-GARCH model.
Yet another example of this difference is observed in the joint estimation of GHPs’ lambda λ parameter when fitting within the DCC and ADCC structures. In the VLO case (GHP λ = −0.893, and DCC-GHP-GARCH λ = −2.37), λ always takes larger negative values when fit jointly than along with a simpler GHP. GARCH-GHD’s larger negative λ occurs due to the model structure; GARCH first partitions the conditional variance dynamics (volatility clustering), then the GHD parameterization is fit to the normalized residuals from the GARCH, rather than the raw return series. This approach enables the GHD parameters, especially λ, to optimally fit the distributional properties of the innovations to the volatility filtered innovations in joint estimation. Thus, abnormalities of the underlying innovations with respect to heavy tails are more likely in heavier tails than the raw returns; therefore, jointly estimated λ reflects their distributions more accurately, as reflected by their heavy tail properties.
When comparing the evolution of conditional correlation (Table 5), both models indicate substantial persistence in the dynamic conditional correlations (b > 0.9), although the DCC-GHP-GARCH model displays somewhat increased persistence in correlations, which suggests relatively slower declines in the impact of shocks and greater asset interdependence over time.
Table 5.
Conditional correlation dynamics in both models.
Concerning the dynamics of volatility (GARCH parameters), the following can be emphasized.
- ARCH (α): Both models identify statistically significant short-term volatility shocks across most firms; the DCC-GHP-GARCH model displayed marginally less sensitivity (lower values of α than illustrated in the traditional model).
- GARCH (β): In both models, there is the presence of a strongly persistent relationship (most β > 0.80). The β values were estimated to be higher in the simulated values based on the DCC-GARCH model for a few of the firms; however, the estimates were more consistent in the values of DCC-GHP-GARCH across the firms.
Overall, the traditional DCC-GARCH indicates slightly greater sensitivity for short-term shocks (higher α estimates in some cases), while the DCC-GHP-GARCH framework reflects a more consistent long-term volatility pattern with heavy-tailed innovations.
Beyond improving the overall market picture, the DCC-GH-DCC-GARCH framework provides insights, when looking at a sector as provided in Table 6. While it will be challenged by estimating the same inter-firm correlations, as seen with standard DCC-GARCH models, it also accommodates asymmetries and fat-tailed innovations. This wealth of information allows for differentiation across firms or sectors, e.g., sectors that are dynamic historically (energy), a sector’s structural dynamics (the passage of volatility shocks), and correlation in the system {insurers and retail (a system, based on estimation of units and firms, having correlated shocks)}. Understanding this alternative reality of volatility shocks improves the understanding of the probabilities of firms, or even sectors (system-level), based on estimates.
Table 6.
Sectorial insights’ comparison.
In Table 7, although there is a slight advantage in the evaluation of standard model selection metrics (AIC, BIC, Shibata, and Hannan–Quinn) in favor of the more parsimonious model (DCC-GARCH) based on the total amount of parameters (338), specified with normally distributed innovations, to consider only checking these model comparison criteria, which penalize more complex models, misses the strong theoretical underpinning and overall superior descriptive quality of the DCC-GHD-GARCH model (specified with 401 parameters)—which uses the generalized hyperbolic distribution specifically to represent the widely reported non-normal characterization of financial returns, i.e., skewness and heavy tails (leptokurtosis), that cannot be represented in a specification based on normality assumptions.
Table 7.
Comparison of DCC-GARCH and DCC-GHP-GARCH models based on information criteria.
Thus, estimating 63 additional parameters incurs a mild loss according to the information criteria. However, the DCC-GHD-GARCH model, in contrast, facilitates a simulation that may better reflect the true data-generating process. This enhanced reflection is not trivial, as reliability is something that can carry significant weight in practice. If these models are used in situations where it is important to accurately obtain the tail risk and return asymmetry—as is often the case in risk management, the determination of Value-at-Risk or Expected Shortfall, sophisticated portfolio optimization, option pricing, or derivative pricing—a more nuanced description afforded by GHD specifications may be worth the trade-off. In such circumstances, it may be fine to assume the DCC-GHD-GARCH model is providing an accurate representation of the empirical structures of financial returns which is why we want the mean and variance in these specifications, and, the model may yield useful information despite metrics favoring parsimony over other fitting criteria.
While information criteria like AIC and BIC, which evaluate in-sample fit, slightly favor the more parsimonious GARCH-Normal model, a model’s true utility in risk management is determined by its out-of-sample forecasting accuracy. To provide a definitive, practical comparison, we implemented a rigorous 99% Value-at-Risk (VaR) backtesting procedure. This test simulates a real-world risk management scenario by generating a series of one-day-ahead forecasts from a rolling estimation window, ensuring no look-ahead bias. The validity of each VaR model was then formally evaluated using Kupiec’s unconditional coverage test, which assesses whether the observed frequency of VaR breaches aligns with the theoretically expected 1% level.
The findings presented in Table 8 are decisively in favor of the GHP specification. The standard GARCH-Normal model consistently fails this practical test, producing a number of actual breaches that is frequently and significantly higher than expected. This demonstrates a dangerous and systematic underestimation of tail risk. In contrast, the VaR forecasts generated by the GARCH-GHP model are remarkably accurate. For most assets, the number of observed breaches is statistically consistent with the expected number for GHP specification, confirming the model’s validity and reliability.
Table 8.
The 99% Value-at-Risk backtesting for all assets.
In addition, the findings deliver some evidence for asymmetric effects within the correlation dynamics. The significance of the coefficients representing asymmetry (see Table 9 and Table 10) suggests that, depending on whether the assets have received some joint negative shock or a joint positive shock, the economic condition of the correlation will respond differently. The interaction of these statistically significant asymmetric effects, in addition to the clustering of volatility, indicates that even modestly asymmetric reactions to the respective shocks on their own could influence the correlation dynamics of the assets over time. This finding, and again the observed high persistence, suggests that within the periods of altered correlation, particularly within the wake of adverse events having partially altered the correlation behavior of the two assets, the periods of altered correlation, may exist in some quasi-phenomena that extend the duration of the changes. This is particularly so if the results are modeled in asymmetry or using a more flexible distribution like GHP that is more susceptible to mitigate the almost-zero correlation troughs that may be weighted by simpler-dimensional models. In addition to the complex correlation dynamics, the estimates strongly confirm both the clustering of volatility and a strong persistence in the conditional variances of the two assets, which is consistent with observed behavior in financial market time series.
Table 9.
The empirical results of the ADCC-GARCH model.
Table 10.
The empirical results of the ADCC-GHP-GARCH model.
It is significant to emphasize that when contrasting the asymmetrical effects present within each model, ADCC-GARCH and ADCC-GHP-GARCH, the latter accommodates heavy tails via significantly negative λ values in most cases across all companies, with a superior fit with respect to financial time series with extreme events; further, the presence of skewness and non-zero fat-tail shape parameters (e.g., rALL, rTRV, rSP) illustrates the model’s advantage in formally capturing return asymmetry and non-normality, which is otherwise neglected in standard ADCC-GARCH.
Despite both models containing an asymmetry term g, within the former model g = 0.003 within the GHP extension, capturing low and high persistence with b = 0.955 * and lower innovation with a = 0.006 **, whilst in the standard model g = 0.005 *, with b = 0.912 *** and a = 0.007 **. This conveys that negative shocks are captured more effectively, and persistently within the model with GHP, which is of greater importance in modeling crisis-contagion, or other effects associated with market panic. Although both models provide high persistence in GARCH (β > 0.8), the GHP-based model provides slightly more consistent and lower ARCH (α) effects, which exhibit less overreaction to recent shocks and allow for capturing better long-run volatility prediction. For assets that are skewed or heavy-tailed (e.g., rMMM, rLOW, rSP), the ADCC-GHP-GARCH model is able to represent the underlying dynamic more accurately per sector—which is particularly necessary for retail, industrial, and financial services, where extreme events and asymmetries are more common.
The ADCC-GHP-GARCH model demonstrates a significant improvement to the standard ADCC-GARCH on the basis of suggesting features that capture asymmetry, skewness, and tail risk, all factors that contribute to a better representation of dynamic correlation, specifically with respect to shock-load characterized in stress conditions.
5. Discussion
First, on the empirical front, the evidence of sectoral heterogeneity in disaster severity supports the growing consensus that climate risk is financially material yet unevenly distributed among industries. While earlier works such as Botzen [3] and Noy [4] established significant macroeconomic impacts of natural disasters, most studies employed Gaussian or other symmetric distributional assumptions, limiting their ability to fully capture tail dependencies and asymmetry in financial returns. Our findings extend this literature by revealing that the insurance and energy sectors are particularly exposed—due to cross-catastrophe liabilities and infrastructure vulnerability, respectively [3,10]—while also showing that sectors such as retail and certain industrials can exhibit counter-cyclical or resilience effects, an outcome less emphasized in the predominantly loss-focused literature. The post-disaster rise in co-movement across firms provides further evidence of the systemic importance of climate-related events, consistent with previous studies documenting contagion behavior across industries following exogenous shocks [25]. This reinforces the call for financial regulators to develop tailored sectoral stress-testing approaches that explicitly consider these sectoral and systemic transmission channels.
Second, the modeling advantage of Generalized Hyperbolic Processes (GHPs) reflects a broader methodological shift in financial econometrics towards non-Gaussian modeling. While the DCC-GARCH family remains popular and easily deployable, these models fail to capture the leptokurtosis and skewness characteristic of extreme events in non-conditional-dispersion settings [26,38]. The present study advances this stream by integrating the GHP into both DCC-GARCH and ADCC-GARCH frameworks, thereby modeling skewness, leptokurtosis, and asymmetric volatility responses more effectively, consistent with Eberlein and Klüppelberg [50] and Bianchi [35] who highlight the superiority of GH-based specifications for extreme-event modeling and systemic risk measurement. Furthermore, embedding these innovations in an ADCC framework demonstrates that negative shocks lead to more persistent correlations—a key manifestation of the asymmetric nature of financial contagion—while improving tail-risk prediction and accounting for volatility clustering typically associated with crises [40,51].
Third, our results diverge from prior evidence on contagion persistence. For example, Malik [52] and Seetharam [13] reported short-lived correlation spikes post-disaster, especially in insurance and energy. In contrast, by employing GHP innovations, we identify more persistent co-movement during turmoil, suggesting that volatility and correlation structures may take longer to revert in heavily exposed sectors. This persistence partially aligns with Balcilar et al. [53] who found prolonged inter-market linkages in regime-switching contexts, but our approach extends these insights by quantifying tail risk and asymmetry at the sector level. Such methodological refinement confirms certain sectoral vulnerabilities noted in earlier studies while uncovering stability pockets and asymmetrical gains in automotive and select retail subsectors—thereby contributing novel empirical evidence on climate-related financial resilience.
Fourth, the nuanced model evaluation using information criteria engages the broader debate over parsimony versus realism in financial modeling. While Akaike and Bayesian criteria penalize added complexity, the additional parameters in GHP-based specifications deliver meaningful gains in capturing tail risk and crisis dynamics. Balancing this trade-off is critical in high-stakes domains such as climate stress testing and regulatory capital allocation, where underestimating downside potential can have systemic consequences [54,55]. Notably, our findings indicate that the improved fit of conditional distribution tails—although penalized for complexity—offers a more cautious and robust approach than Gaussian-based simplifications, particularly for universal regulatory policy frameworks [56]. Robust Value-at-Risk backtesting further confirms that GHP-based specifications are consistently more adequate in estimating risk and capturing non-Gaussian patterns.
Finally, this research situates financial returns within a climate-disaster framework, contributing to the emerging literature on transition and physical climate risks in capital markets. Whereas much prior work has relied on macroeconomic aggregates or ESG indices [57], our firm-level and sector-level analysis enables more precise risk disclosures in line with TCFD guidance. Moreover, by linking sector-specific contagion signals with their amplification during disasters, our approach provides a methodological basis for embedded scenario-analysis frameworks applicable to central banks and financial regulators [58,59,60].
6. Conclusions
This article presents a rigorous and methodologically sophisticated examination of the effects of natural disasters on sector-specific dynamics in the US stock market. By combining DCC-GARCH models with Generalized Hyperbolic Processes (GHPs) and their asymmetric extensions (ADCC-GARCH and ADCC-GHP-GARCH), we capture the essential characteristics of financial return behavior during disaster events—that is, time-varying correlations, heavy tails, skewness, and volatility clustering.
The evidence revealed considerable heterogeneity among sectors in their response to natural disasters. The insurance and energy sectors are the most susceptible, displaying extremely fat-tailed return distributions; persistent volatility coupled with returns highly positively correlated with market stress. By comparison, retail and certain aspects of industrial firms exhibited more resistant behavior, for example, benefitting from shifts in demand or existing in sectors exposed to lower levels of infrastructure risk. Mixed results were evident among automotive firms due to a boost in demand for replacement services post-disaster being countervailed by ongoing supply chain disruptions.
Furthermore, the GHP model consistently outperformed other Gaussian-based specifications, indicating a better fit to basically extreme return characteristics and additionally providing better estimates of tail risk. The fact that ADCC frameworks can capture asymmetry suggests negative shocks will lead to more persistent and larger co-movement among sectoral returns—indicating that financial contagion is underestimated in symmetric frameworks.
These findings have important ramifications for investors, regulators, and policymakers. Sector-specific strategies are vital for mitigating the financial risks associated with climate change and extreme weather events. Investment portfolios and risk management systems need to consider dynamic, non-Gaussian features in order account for fat-tailed, asymmetric, and correlated financial shocks.
This study contributes to the literature on climate risk and financial resilience, by advancing a rigorously-developed econometric embedding that better reflects the real-world behavior of asset returns during disasters. Future research might apply this approach in the context of emerging and poorer economies, attach a forward-looking climate scenario to disaster events, or extend the relative measure of sectoral interactions to include ESG performance and climate adaptation at a firm level.
Author Contributions
Conceptualization, A.A.D. and E.M.M.; methodology, R.-S.C. and E.M.M.; software, A.A.D., E.M.M. and R.-S.C.; validation, A.A.D., E.M.M., R.-S.C., M.-S.F., and C.M.; formal analysis, A.A.D., E.M.M. and R.-S.C.; investigation, A.A.D.; resources, M.-S.F. and C.M.; data curation, R.-S.C.; writing—original draft preparation, A.A.D., E.M.M. and R.-S.C.; writing—review and editing, A.A.D., R.-S.C. and M.-S.F.; visualization, R.-S.C. and E.M.M.; supervision, A.A.D.; project administration, A.A.D.; funding acquisition, M.-S.F. All authors have read and agreed to the published version of the manuscript.
Funding
This research was funded by the EU’s NextGenerationEU instrument through Romania’s National Recovery and Resilience Plan, Pillar III—C9-I8, administered by the Ministry of Research, Innovation and Digitalization, under the project “Non-Gaussian self-similar processes: Enhancing mathematical tools and financial models for capturing complex market dynamics” (Contract No. 760243/28.12.2023; code CF 194/31.07.2023). The article processing charge (APC) was funded by the project “Promoting Excellence in Research through Interdisciplinarity, Digitalization, and the Integration of Open Science Principles to Enhance International Visibility (ASE-RISE),” CNFIS-FDI-2025-F-0457.
Institutional Review Board Statement
Not applicable.
Informed Consent Statement
Not applicable.
Data Availability Statement
Financial assets and S&P500 index data available at https://finance.yahoo.com/ (accessed on 10 July 2025). The whole dataset has been uploaded upon submission.
Acknowledgments
The authors gratefully acknowledge the Business Economics Data Science Lab (BEDSL) at the Bucharest University of Economic Studies for research infrastructure and support. The study was conducted within the BEDSL lab and in the framework of the PNRR project cited above.
Conflicts of Interest
The authors declare no conflicts of interest.
Abbreviations
| GARCH | General Autoregressive Conditional Heteroskedasticity |
| ARMA | Autoregressive Moving Average |
| DCC | Dynamic Conditional Correlation |
| ADCC | Asymmetric Dynamic Conditional Correlation |
| GHP | General Hyperbolic Process |
| GHD | General Hyperbolic Distribution |
| AGHD | Asymmetric General Hyperbolic Distribution |
| NIG | Normal Inverse Gaussian |
Appendix A

Figure A1.
The correlation matrix plot of sample returns.
Figure A1.
The correlation matrix plot of sample returns.


Figure A2.
The density plot of sample returns.
Figure A2.
The density plot of sample returns.


Figure A3.
Q-Q plots.
Figure A3.
Q-Q plots.


Table A1.
Summary statistics.
Table A1.
Summary statistics.
| Company | Variable | Min | 1st Q | Median | Average | 3rd Q | Max | Std. Dev. | Skewness | Kurtosis | Jarque-Berra | ADF | Ljung-Box | ARCH Effect |
|---|---|---|---|---|---|---|---|---|---|---|---|---|---|---|
| Sector 1: Insurance | ||||||||||||||
| Allstate Corporation | rALL | −14.08 | −0.55 | 0.13 | 0.05 | 0.70 | 10.07 | 1.58 | −0.81 | 13.23 | 9334.9 *** | −9.30 *** | 14.35 | 424.4 *** |
| Travelers Cos Inc. | rTRV | −20.80 | −0.60 | 0.12 | 0.04 | 0.78 | 13.29 | 1.71 | −1.82 | 27.43 | 40227 *** | −11.19 *** | 54.86 | 463.44 *** |
| American International Group | rAIG | −20.84 | −0.83 | 0.04 | 0.02 | 0.97 | 18.80 | 2.40 | −0.58 | 15.12 | 12086 *** | −9.71 *** | 0.002 *** | 432.76 *** |
| Insurance Australia Group | rIAG | −8.08 | −0.78 | 0.00 | −0.01 | 0.82 | 10.92 | 1.58 | −0.01 | 5.66 | 1683.5 *** | −11.11 *** | 2.35 *** | 249.58 *** |
| Sector 2: Energy Oil and Gas | ||||||||||||||
| EXXON Mobile | rExM | −12.22 | −0.90 | −0.02 | −0.01 | 0.81 | 12.69 | 1.92 | 0.16 | 7.85 | 3244.6 *** | −9.43 **** | 3.08** | 311.96 *** |
| Shell | rSHEL | −17.17 | −0.83 | 0.04 | 0.00 | 0.85 | 19.68 | 2.18 | −0.41 | 17.61 | 16337 *** | −10.98 *** | 0.1*** | 395.68 *** |
| Valer | rVLO | −19.22 | −1.05 | 0.04 | 0.04 | 1.13 | 31.20 | 2.80 | 0.99 | 18.98 | 19149 *** | −9.35 *** | 2.63 *** | 148.49 *** |
| Philips 66 | rPSX | −15.86 | −0.93 | 0.08 | 0.02 | 0.94 | 22.17 | 2.44 | 0.43 | 12.2 | 7864.2 *** | −9.02 *** | 7.76 | 252.07 *** |
| Marathon Petroleum | rMPC | −27.00 | −1.23 | 0.1 | 0.06 | 1.32 | 20.63 | 2.89 | −0.27 | 14.57 | 11188 *** | −8.98 *** | 2.61 *** | 367.78 *** |
| Sector 3: Automotive | ||||||||||||||
| General Motors | rGM | −17.32 | −1.06 | 0.06 | 0.07 | 1.06 | 19.94 | 2.41 | 0.21 | 9.75 | 5011 *** | −10.09 *** | 0.003 *** | 343.41 *** |
| Ford | rFD | −11.01 | −0.99 | 0.00 | 0.07 | 1.02 | 23.44 | 2.32 | 0.92 | 11.6 | 7244 *** | −9.66 *** | 0.00 *** | 169.73 *** |
| Sector 4: Energy and Energy Generation | ||||||||||||||
| Edison International | rEIX | −13.33 | −0.73 | 0.03 | 0.01 | 0.92 | 15.38 | 1.93 | −0.65 | 14.97 | 11869 *** | −10.38 *** | 3.24 *** | 272.5 *** |
| Vistra Corp | rVST | −24.20 | −0.98 | 0.06 | 0.06 | 1.08 | 13.08 | 2.20 | −1.27 | 18.95 | 19205 *** | −12.16 *** | 2.21 *** | 110.5 *** |
| Sector 5: Retail | ||||||||||||||
| Walmart | rWMT | −10.18 | −0.54 | 0.06 | 0.07 | 0.66 | 11.71 | 1.38 | 0.95 | 16.53 | 14541 *** | −10.48 *** | 18.66 | 169.32 *** |
| Lumber Liquidators | rLL | −31.01 | −1.63 | 0.00 | 0.09 | 1.93 | 35.94 | 4.08 | 0.55 | 12.88 | 8789 *** | −10.59 *** | 0.90 *** | 104.38 *** |
| Home Depot | rHD | −19.79 | −0.53 | 0.12 | 0.10 | 0.83 | 13.75 | 1.62 | −1.33 | 26.50 | 37293 *** | −10.81 *** | 26.24 | 431.07 *** |
| Lowe’s Company | rLOW | −24.76 | −0.67 | 0.15 | 0.12 | 1.01 | 14.01 | 2.02 | −1.37 | 25.34 | 34147 *** | −10.10 *** | 6.66 | 201.48 *** |
| Martin Marietta Materials | rMMM | −13.54 | −0.93 | 0.05 | 0.08 | 1.1 | 13.5 | 2.15 | 0.06 | 7.13 | 2669.9 *** | −11.06 *** | 5.79 * | 473.04 *** |
| Sector 6: Industry | ||||||||||||||
| Generac Holdings | rGH | −12.19 | −0.97 | 0.17 | 0.2 | 1.32 | 13.9 | 2.35 | −0.01 | 3.3 | 572.55 *** | −9.89 *** | 5.56 * | 237.64 *** |
| Bega Cheese Limited | rBGA | −12.80 | −0.91 | 0.00 | 0.04 | 0.97 | 15.18 | 1.96 | −0.01 | 8.6 | 3887.1 *** | −10.87 *** | 1.1 *** | 75.16 *** |
* p < 0.10, *** p < 0.01.
References
- Botzen, W.J.W.; Deschenes, O.; Sanders, M. The Economic Impacts of Natural Disasters: A Review of Models and Empirical Studies. Rev. Environ. Econ. Policy 2019, 13, 167–188. [Google Scholar] [CrossRef]
- Noy, I. The macroeconomic consequences of disasters. J. Dev. Econ. 2009, 88, 221–231. [Google Scholar] [CrossRef]
- Wang, L.; Kutan, A.M. The impact of natural disasters on stock markets: Evidence from Japan and the US. Comp. Econ. Stud. 2013, 55, 672–686. [Google Scholar] [CrossRef]
- Ewing, B.T.; Hein, S.E.; Kruse, J.B. Insurer stock price responses to Hurricane Floyd:n event study analysis using storm characteristics. Weather Forecast. 2006, 21, 395–407. [Google Scholar] [CrossRef]
- Fang, L.; Wu, J.; Miljkovic, T. Modeling Impact of Natural Hazard-Induced Disasters on Income Distribution in the United States. Int. J. Disaster Risk Sci. 2017, 8, 435–444. [Google Scholar] [CrossRef]
- Giraldo, E. Relationship Between Financial Markets and Natural Disasters in the US. Ph.D. Thesis, Rhode Island College, Providence, RI, USA, 2019. Available online: https://digitalcollections.ric.edu/record/6275?ln=en&v=pdf (accessed on 15 August 2025).
- Danni, T.U.; Finance, M. Do the stock markets price climate change risks? End-of-Study Res. Pap. 2009, 25, 2022. Available online: https://www.vernimmen.net/ftp/DoStockMktsPriceClimateChangeRisks_Danni_TU.pdf (accessed on 15 August 2025).
- Tyler, E.; Chivaka, R. The use of real options valuation methodology in enhancing the understanding of the impact of climate change on companies. Bus. Strategy Environ. 2011, 20, 55–70. [Google Scholar] [CrossRef]
- Bouwer, L.M. Have disaster losses increased due to anthropogenic climate change? Bull. Am. Meteorol. Soc. 2011, 92, 39–46. [Google Scholar] [CrossRef]
- Carleton, T.A.; Hsiang, S.M. Social and economic impacts of climate. Science 2016, 353, aad9837. [Google Scholar] [CrossRef] [PubMed]
- Koerniadi, H.; Krishnamurti, C.; Tourani-Rad, A. Natural disasters-blessings in disguise? Singap. Econ. Rev. 2016, 61, 1640004. [Google Scholar] [CrossRef]
- Bourdeau-Brien, M.; Kryzanowski, L. The impact of natural disasters on the stock returns and volatilities of local firms. Q. Rev. Econ. Financ. 2017, 63, 259–270. [Google Scholar] [CrossRef]
- Seetharam, I. Environmental Disasters and Stock Market Performance; Working Paper; Department of Economics, Stanford University: Stanford, CA, USA, 2017. [Google Scholar]
- Malik, I.A.; Faff, R.W.; Chan, K.F. Market response of US equities to domestic natural disasters: Industry-based evidence. Account. Financ. 2020, 60, 3875–3904. [Google Scholar] [CrossRef]
- Hepburn, C.; O’Callaghan, B.; Stern, N.; Stiglitz, J.; Zenghelis, D. Will COVID-19 fiscal recovery packages accelerate or retard progress on climate change? Oxf. Rev. Econ. Policy 2020, 36 (Suppl. 1), S359–S381. [Google Scholar] [CrossRef]
- Liu, H.; Ferreira, S.; Karali, B. Hurricanes as news? Assessing the impact of hurricanes on the stock market returns of energy companies. Int. J. Disaster Risk Reduct. 2021, 66, 102572. [Google Scholar] [CrossRef]
- Mei, L. Exploring the Relationship Between Natural Disasters and Insurance Stock Market. Adv. Econ. Manag. Political Sci. 2024, 98, 216–224. [Google Scholar] [CrossRef]
- Zhao, R.; Zhang, D.; Guo, M. Do natural disasters affect stock price crash risk? Evidence from emerging markets. J. Int. Financ. Mark. Inst. Money 2024, 93, 102001. [Google Scholar] [CrossRef]
- Pagnottoni, P.; Spelta, A.; Flori, A.; Pammolli, F. Climate change and financial stability: Natural disaster impacts on global stock markets. Phys. A Stat. Mech. Its Appl. 2022, 599, 127514. [Google Scholar] [CrossRef]
- Zhou, X. The Impact of Natural Disaster on US Stock Market Index: Using DID, ARMAX-GARCH, and Random Forest. Adv. Econ. Manag. Political Sci. 2023, 63, 101–116. [Google Scholar] [CrossRef]
- Balcılar, M.; Demirer, R.; Hammoudeh, S.; Nguyen, D.K. Risk spillovers across the energy and carbon markets and hedging strategies for carbon risk. Energy Econ. 2016, 54, 159–172. [Google Scholar] [CrossRef]
- Broadstock, D.C.; Cheng, L.T. Time-varying relation between black and green bond price benchmarks: Macroeconomic determinants for the first decade. Financ. Res. Lett. 2019, 29, 17–22. [Google Scholar] [CrossRef]
- Cepni, O.; Demirer, R.; Rognone, L. Hedging climate risks with green assets. Econ. Lett. 2022, 212, 110312. [Google Scholar] [CrossRef]
- Prause, K. The Generalized Hyperbolic Model: Estimation, Financial Derivatives, and Risk Measures. J. Empir. Financ. 1999, 6, 223–240. [Google Scholar]
- Bibby, B.M.; Sørensen, M. Hyperbolic Processes in Finance. In Handbook of Heavy Tailed Distributions in Finance; Elsevier: Amsterdam, The Netherlands, 2003; pp. 211–248. [Google Scholar]
- Eberlein, E.; Keller, U. Hyperbolic distributions in finance. Bernoulli 1995, 1, 281–299. [Google Scholar] [CrossRef]
- Prause, K. Modelling Financial Data Using Generalized Hyperbolic Distributions; FDM Preprint 48; University of Freiburg: Freiburg im Breisgau, Germany, 1997. [Google Scholar]
- Barndorff-Nielsen, O.E.; Shephard, N. Continuous Time Approach to Financial Volatility; Cambridge University Press: Cambridge, UK, 2005. [Google Scholar]
- Rydberg, T.H. Generalized Hyperbolic Diffusions with Applications towards Finance. Math. Financ. 1999, 9, 183–201. [Google Scholar] [CrossRef]
- Eberlein, E.; Kluge, W. Calibration of Lévy Term Structure Models. Financ. Stoch. 2004, 8, 391–410. [Google Scholar]
- Kim, S.I. ARMA–GARCH model with fractional generalized hyperbolic innovations. Financ. Innov. 2022, 8, 48. [Google Scholar] [CrossRef]
- Koliai, L. Extreme risk modeling: An EVT–pair-copulas approach for financial stress tests. J. Bank. Financ. 2016, 70, 1–22. [Google Scholar] [CrossRef]
- Guegan, D.; Zang, J. Pricing bivariate option under GARCH-GH model with dynamic copula: Application for Chinese market. In Copulae and Multivariate Probability Distributions in Finance; Routledge: Abingdon, UK, 2013; pp. 169–187. [Google Scholar]
- Jiang, X.; Nadarajah, S.; Hitchen, T. A review of generalized hyperbolic distributions. Comput. Econ. 2024, 64, 595–624. [Google Scholar] [CrossRef]
- Bianchi, M.L.; De Luca, G.; Rivieccio, G. CoVaR with volatility clustering, heavy tails and non-linear dependence. arXiv arXiv:2009.10764, 2020.
- Staffini, A. Stock Price Forecasting by a Deep Convolutional Generative Adversarial Network. Front. Artif. Intell. 2022, 5, 837596. [Google Scholar] [CrossRef]
- Hoseinzade, E.; Haratizadeh, S. CNNpred: CNN-based stock market prediction using a diverse set of variables. Expert Syst. Appl. 2019, 129, 273–285. [Google Scholar] [CrossRef]
- Luciano, E.; Semeraro, P. Multivariate Time Changes for Lévy Asset Models: Characterization and Calibration. J. Comput. Financ. 2010, 14, 3–32. [Google Scholar] [CrossRef]
- Eberlein, E.; Özkan, F.; Papapantoleon, A. The Impacts of Lévy Processes in Finance and Beyond. Quant. Financ. 2008, 8, 621–636. [Google Scholar]
- Baciu, O.A. Generalized hyperbolic distributions: Empirical evidence on Bucharest stock exchange. Rev. Financ. Bank. 2015, 7, 7–18. [Google Scholar]
- Hai-yan, G. The Application of Generalized Hyperbolic Distributions toRisk Measurement in Chinese Stock Market. Oper. Res. Manag. 2004, 4, 106–109+154. [Google Scholar]
- Bourdeau-Brien, M. Natural Disasters and Financial Markets. Ph.D. Thesis, Concordia University, Montreal, QC, Canada, 2017. [Google Scholar]
- Bharath, S.T.; Cho, D. Do Natural Disaster Experiences Limit Stock Market Participation? J. Financ. Quant. Anal. 2023, 58, 29–70. [Google Scholar] [CrossRef]
- Engle, R. Dynamic conditional correlation: A simple class of multivariate generalized autoregressive conditional heteroskedasticity models. J. Bus. Econ. Stat. 2002, 20, 339–350. [Google Scholar] [CrossRef]
- Necula, C. Modeling heavy-tailed stock index returns using the generalized hyperbolic distribution. Rom. J. Econ. Forecast. 2009, 10, 118–131. [Google Scholar]
- Cappiello, L.; Engle, R.F.; Sheppard, K. Asymmetric dynamics in the correlations of global equity and bond returns. J. Financ. Econom. 2006, 4, 537–572. [Google Scholar] [CrossRef]
- Hyde, S.; Bredin, D.; Nguyen, N. Correlation dynamics between Asia-Pacific, EU and US stock returns. In Asia-Pacific Financial Markets: Integration, Innovation and Challenges; Emerald Group Publishing Limited: Leeds, UK, 2007. [Google Scholar][Green Version]
- Jorion, P. Value at Risk: The New Benchmark for Managing Financial Risk; McGraw-Hill: Columbus, OH, USA, 2007. [Google Scholar]
- Kupiec, P.H. Techniques for verifying the accuracy of risk measurement models. J. Deriv. 1995, 3, 73–84. [Google Scholar] [CrossRef]
- Eberlein, E.; Klüppelberg, C. Generalized hyperbolic and inverse Gaussian distributions: Theory and applications. In Handbook of Heavy Tailed Distributions in Finance; Rachev, S., Ed.; Elsevier: Amsterdam, The Netherlands, 2005; pp. 105–144. [Google Scholar]
- Selmi, N. Measuring contagion between energy and stock market during financial crisis: Asymmetric dynamics in the correlations. J. Dev. Econ. Financ. 2022, 3, 375–396. [Google Scholar] [CrossRef]
- Malik, F.; Hammoudeh, S.; McAleer, M. The impact of natural disasters on the co-movement of stock returns: Evidence from developed and emerging markets. J. Int. Financ. Mark. Inst. Money 2021, 72, 101319. [Google Scholar] [CrossRef]
- Balcilar, M.; Gupta, R.; Miller, S.M. Regime switching model of US crude oil and stock market prices: 1900–2014. Energy Econ. 2015, 49, 317–327. [Google Scholar] [CrossRef]
- Bouri, E.; Jain, A.; Roubaud, D.; Kristoufek, L. Cryptocurrencies and equity markets in emerging markets: Tail dependence and causal relationships. Emerg. Mark. Rev. 2020, 45, 100719. [Google Scholar] [CrossRef]
- Alexander, D. Inflation Uncertainty, Asset Valuations, and the Credit Spreads Puzzle. Rev. Financ. Stud. 2008, 21, 2487–2534. [Google Scholar] [CrossRef]
- Danielsson, J.; Shin, H.S.; Zigrand, J.P. Risk Appetite and Endogenous Risk; Financial Markets Group, London School of Economics: London, UK, 2010. [Google Scholar]
- Battiston, S.; Mandel, A.; Monasterolo, I.; Schütze, F.; Visentin, G. A climate stress-test of the financial system. Nat. Clim. Change 2017, 7, 283–288. [Google Scholar] [CrossRef]
- Network for Greening the Financial System (NGFS). Scenarios in Action: A Progress Report on Global Supervisory and Central Bank Climate Scenario Exercises. 2022. Available online: https://www.ngfs.net/en/publications-and-statistics/publications/scenarios-action-progress-report-global-supervisory-and-central-bank-climate-scenario-exercises (accessed on 10 July 2025).
- Hapau, R.G. Capital Market Volatility During Crises: Oil Price Insights, VIX Index, and Gold Price Analysis. Manag. Mark. 2023, 18, 290–314. [Google Scholar] [CrossRef]
- Busu, C.; Busu, M.; Goia, S.; Nedelcu, C.A. Analysing the impact of the biomass sector on economic growth in Romania using econometric modelling. Manag. Mark. 2024, 19, 520–537. [Google Scholar] [CrossRef]


Disclaimer/Publisher’s Note: The statements, opinions and data contained in all publications are solely those of the individual author(s) and contributor(s) and not of MDPI and/or the editor(s). MDPI and/or the editor(s) disclaim responsibility for any injury to people or property resulting from any ideas, methods, instructions or products referred to in the content. |
© 2025 by the authors. Licensee MDPI, Basel, Switzerland. This article is an open access article distributed under the terms and conditions of the Creative Commons Attribution (CC BY) license (https://creativecommons.org/licenses/by/4.0/).