

Fintech and Corporate ESG Performance: An Empirical Analysis Based on the NEV Industry


Abstract
1. Introduction
2. Theoretical Analysis and Research Hypothesis
2.1. The Direct Impact of Fintech on the ESG Performance of NEV Enterprises
2.2. The Influence Mechanism of Fintech and ESG Performance of NEV Enterprises
3. Data and Variables
3.1. Indicator Construction
3.1.1. Explanatory Variable (Fintech)
3.1.2. Explained Variable: Environmental, Social, and Governance Performance of NEV Enterprises (ESG)
3.1.3. Mediating Variables
- Enterprise Environmental Information Disclosure Quality (EIDQ)
- 2.
- Financing constraints (SA)
3.1.4. Other Control Variables
- Enterprise Size (Size): Large-scale NEV enterprises possess significant advantages in production capacity. To achieve sustainable development, these enterprises often engage in scientific and technological innovations to enhance their competitiveness, thereby improving their ESG performance.
- Asset–Liability Ratio (LEV): The asset–liability ratio is a key indicator of a NEV company’s ability to secure external financing. A higher LEV indicates that these companies may face greater challenges in managing debt repayment. This financial pressure may affect various ESG dimensions, ultimately affecting their overall ESG performance. In this study, the leverage ratio is calculated by dividing total liabilities by total assets.
- Return on Assets (ROA): The profitability of NEV companies, as measured by the net profit margin on total assets, plays a key role in supporting their financial stability and project financing. Improved profitability can promote long-term sustainability and strengthen ESG performance. In this paper, ROA is presented as the ratio of net profit to total assets.
- Total Asset Turnover (ATO): The efficiency with which NEV companies use their total assets to generate revenue is an important factor in assessing their financial health and operational effectiveness. A higher total asset turnover indicates better financial soundness, which can lead to better ESG performance over time through sustainable investments. Total asset turnover is measured as the ratio of sales revenue to the company’s average total assets.
- Cash Flow Ratio (Cashflow): A higher liquidity level within a company signifies a stronger capacity to fulfill short-term debt obligations. Adequate cash flow not only supports long-term investments in ESG-related initiatives, such as renewable energy projects and environmental protection technologies, but also enhances the enterprise’s risk management capabilities. The cash flow ratio is measured as the ratio of net cash flow to total assets.
- Stock Proportion (INV): A high inventory ratio in new energy automobile enterprises may result in an excess of material products, consequently increasing resource consumption and environmental burden. On the other hand, efficient inventory management and control can help reduce waste and improve resource use, thereby improving the ESG performance of these companies. In this study, inventory is represented by the ratio of inventory to total assets.
- Fixed Assets Ratio (FIXED): A higher fixed assets ratio indicates that NEV enterprises are investing more in production equipment and other infrastructure for research and development (R&D) and production. Consequently, this increased investment in production capacity correlates with greater resource allocation efficiency and long-term stability, which, in turn, influences the ESG performance of NEV enterprises. In this paper, the fixed asset ratio is defined as the ratio of fixed assets to total assets.
- Operating Income Growth Rate (Growth): This metric reflects an enterprise’s market performance and competitiveness. A high growth rate signifies that NEV companies possess favorable development prospects in the market, which facilitates their investment in technological innovation and environmental management, thereby supporting their ESG initiatives. In this study, the growth rate is calculated by comparing the current year’s operating profit with the previous year’s total operating profit.
- Board Size (Board): An increased board size enhances the governance capacity of new energy automobile enterprises, thereby improving the transparency and accountability of these organizations, which subsequently influences their ESG performance. In this paper, board size is represented by the natural logarithm of the number of board members.
- Independent Director Proportion (Indep): Independent directors play a critical role in a company’s governance structure, offering objective oversight and responsible recommendations. As a result, a higher proportion of independent directors is associated with a more robust corporate governance framework, which promotes greater transparency and fairness in decision-making and operational management. This, in turn, contributes to improved ESG performance for the enterprise. In this study, the proportion of independent directors is represented by the ratio of the number of independent directors to the total number of directors on the board.
- Regional Financial Development Level (AreaFin): A well-developed financial system optimizes resource allocation, allowing funds to flow towards more innovative and socially responsible projects. This enables NEV enterprises to access more convenient financing channels, thereby enhancing their performance. This paper measures the regional financial development level using the ratio of the balance of deposits and loans held by urban financial institutions to the gross domestic product of the region.
- Regional Economic Development Level (Inpgdp): New energy automobile enterprises operating in regions with a high level of economic development are more likely to achieve profitability and receive robust support for their sustainable development strategies, which in turn enhances their ESG performance. This is based on per capita GDP and the exponential growth of the regional economic development level.
3.2. Model Building
3.3. Descriptive Statistics
4. Empirical Analysis and Findings
4.1. Analysis of Benchmark Regression Results
4.2. Robustness Test
5. Mechanism Analysis
5.1. Enterprise Environmental Information Disclosure Quality
5.2. Financing Constraints
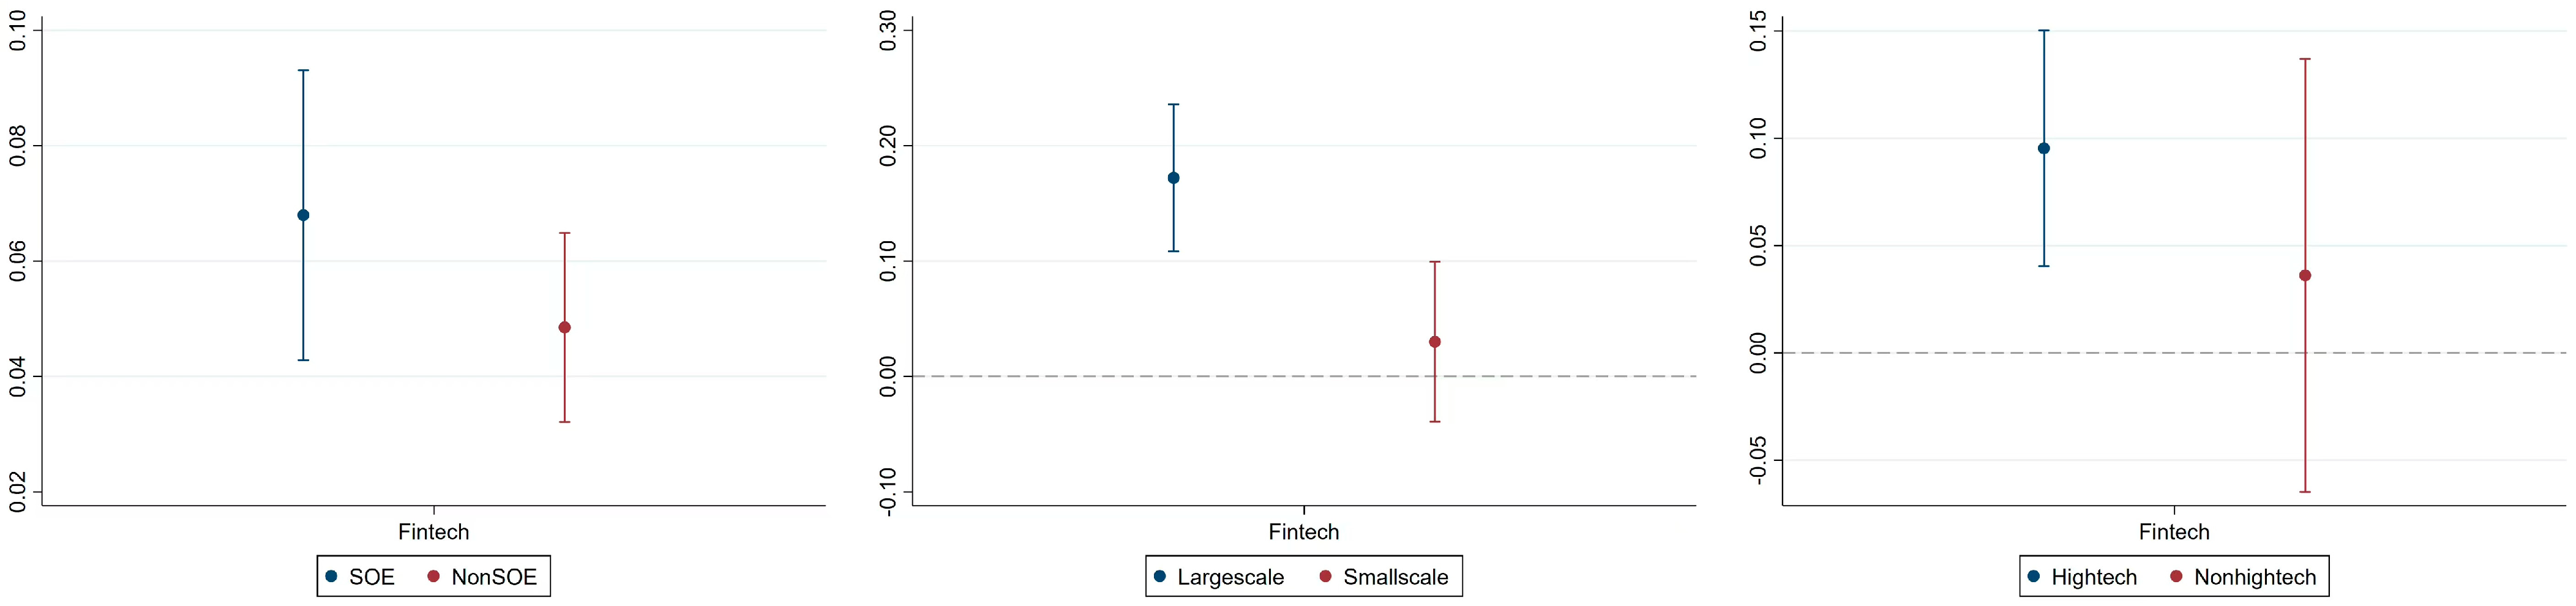
6. Heterogeneity Analysis
6.1. Heterogeneity of Corporate Property Rights
6.2. Company Size Heterogeneity
6.3. High-Tech Heterogeneity
7. Conclusions and Recommendations
7.1. Making Full Use of the Technological Advantages of Fintech
7.2. Strengthen Information Disclosure and Transparency
7.3. Strengthen Cross-Border Cooperation and Ecological Construction
7.4. Implement Differentiation Policy
Author Contributions
Funding
Data Availability Statement
Conflicts of Interest
References
- Choudhary, P.; Thenmozhi, M. Fintech and financial sector: ADO analysis and future research agenda. Int. Rev. Financ. Anal. 2024, 93, 103201. [Google Scholar] [CrossRef]
- Huang, D.Z.X. Environmental, social and governance factors and assessing firm value: Valuation, Signaling and stakeholder perspectives. Account. Financ. 2022, 62, 1983–2010. [Google Scholar] [CrossRef]
- Galeone, G.; Ranaldo, S.; Fusco, A. ESG and FinTech: Are they connected? Res. Int. Bus. Financ. 2024, 69, 102225. [Google Scholar] [CrossRef]
- Ding, J.; Li, L.; Zhao, J. How does fintech prompt corporations toward ESG sustainable development? Evidence from China. Energy Econs. 2024, 131, 107387. [Google Scholar] [CrossRef]
- Li, T.T.; Wang, K.; Sueyoshi, T.; Derek, D.W. ESG: Research progress and future prospects. Sustainability 2021, 13, 11663. [Google Scholar] [CrossRef]
- Zhong, Y.; Zhao, H.; Yin, T. Resource bundling: How does enterprise digital transformation affect enterprise ESG development? Sustainability 2023, 15, 1319. [Google Scholar] [CrossRef]
- Bahadır, O.; Akarsu, S. Does Company Information Environment Affect ESG–Financial Performance Relationship? Evidence from European Markets. Sustainability 2024, 16, 2701. [Google Scholar] [CrossRef]
- Xie, H.; Qin, Z.; Li, J. Entrepreneurship and Corporate ESG Performance—A Case Study of China’s A-Share Listed Companies. Sustainability 2024, 16, 7964. [Google Scholar] [CrossRef]
- Lei, X.; Yu, J. Striving for sustainable development: Green financial policy, institutional investors, and corporate ESG performance. Corp. Soc. Responsib. Environ. Manag. 2024, 31, 1177–1202. [Google Scholar] [CrossRef]
- Sabbaghi, O. The impact of news on the volatility of ESG firms. Glob. Financ. J. 2022, 51, 100570. [Google Scholar] [CrossRef]
- Goldstein, I.; Jiang, W.; Karolyi, G.A. To FinTech and beyond. Rev. Financ. Stud. 2019, 32, 1647–1661. [Google Scholar] [CrossRef]
- Thakor, A.V. Fintech and banking: What do we know? J. Financ. Intermed. 2020, 41, 100833. [Google Scholar] [CrossRef]
- Yu, J.; Chiriko, A.Y.; Kim, S.S.; Moon, H.G.; Choi, H.; Han, H. ESG management of hotel brands: A management strategy for benefits and performance. Int. J. Hosp. Manag. 2025, 125, 103998. [Google Scholar] [CrossRef]
- Soana, M.G. Does ESG contracting align or compete with stakeholder interests? J. Int. Financ. Mark. Inst. Money 2024, 96, 102058. [Google Scholar] [CrossRef]
- Liu, D. Can fintech promote SME innovation? Appl. Econ. Lett. 2024, 3, 1–6. [Google Scholar] [CrossRef]
- Chen, B.; Yang, X.; Ma, Z. Fintech and financial risks of systemically important commercial banks in China: An inverted U-shaped relationship. Sustainability 2022, 14, 5912. [Google Scholar] [CrossRef]
- Jin, X.; Qi, H.; Huang, X. Green financial regulation and corporate strategic ESG behavior: Evidence from China. Financ. Res. Lett. 2024, 65, 105581. [Google Scholar] [CrossRef]
- Zhang, M.Z.; Wang, X.P.; Yu, D.H. Government subsidies on new energy automobile enterprise innovation structure. Influ. China’s Popul. Resour. Environ. 2024, 7, 35–46. [Google Scholar]
- Erel, I.; Liebersohn, J. Can FinTech reduce disparities in access to finance? Evidence from the Paycheck Protection Program. J. Financ. Econ. 2022, 146, 90–118. [Google Scholar] [CrossRef]
- Yan, B.; Cheng, M.; Wang, N.H. ESG overflow, green supply chain transmission and the enterprise green innovation. J. Econ. Res. 2024, 59, 72–91. [Google Scholar]
- Gao, D.; Tan, L.; Duan, K. Forging a path to sustainability: The impact of Fintech on corporate ESG performance. Eur. J. Financ. 2024, 1–19. [Google Scholar] [CrossRef]
- Jiang, B. Does fintech promote the sustainable development of renewable energy enterprises? Environ. Sci. Pollut. Res. 2023, 30, 65141–65148. [Google Scholar] [CrossRef] [PubMed]
- Nikkel, B. Fintech Forensics: Criminal Investigation and Digital Evidence in Financial Technologies. Forensic Sci. Int. Digit. Investig. 2020, 33, 200908. [Google Scholar] [CrossRef]
- Chen, W.; Arn, G.; Song, H.; Xie, Y. The influences of digital finance on green technological innovation in China’s manufacturing sector: The threshold effects of ESG performance. J. Clean. Prod. 2024, 467, 142953. [Google Scholar] [CrossRef]
- Qi, Y.D.; Xiao, X. Enterprise management reform in the era of digital economy. Manag. World 2020, 36, 135–152+250. [Google Scholar]
- Lee, J.; Serafin, A.M.; Courteau, C. Corporate disclosure, ESG and green fintech in the energy industry. J. World Energy Law Bus. 2023, 16, 473–491. [Google Scholar] [CrossRef]
- Zhu, Y.; Lin, Y.; Tan, Y.; Liu, B.; Wang, H. The potential nexus between fintech and energy consumption: A new perspective on natural resource consumption. Resour. Policy 2024, 89, 104589. [Google Scholar] [CrossRef]
- Liu, Y.; Saleem, S.; Shabbir, R.; Shabbir, M.S.; Irshad, A.; Khan, S. The relationship between corporate social responsibility and financial performance: A moderate role of fintech technology. Environ. Sci. Pollut. Res. 2021, 28, 20174–20187. [Google Scholar] [CrossRef]
- Shi, Y.; Dong, X.; Zhang, Q.; Zhou, Z. FinTech, urban entrepreneurial activity, and social security levels: Evidence from China. Financ. Res. Lett. 2024, 61, 104986. [Google Scholar] [CrossRef]
- Kartal, M.T.; Taşkın, D.; Shahbaz, M.; Depren, S.K.; Pata, U.K. Effects of Environment, Social, and Governance (ESG) disclosures on ESG scores: Investigating the role of corporate governance for publicly traded Turkish companies. J. Environ. Manag. 2024, 368, 122205. [Google Scholar] [CrossRef]
- Rezaee, Z.; Tuo, L. Are the Quantity and Quality of Sustainability Disclosures Associated with the Innate and Discretionary Earnings Quality? J. Bus. Ethics 2019, 155, 763–786. [Google Scholar] [CrossRef]
- Wen, H.; Ho, K.C.; Gao, J.; Yu, L. The fundamental effects of ESG disclosure quality in boosting the growth of ESG investing. J. Int. Financ. Mark. Inst. Money 2022, 81, 101655. [Google Scholar] [CrossRef]
- Wang, S.; Chen, F.; Yang, X. Environmental, social and governance performance: Can and how it improve internationalization of Chinese A-share listed enterprises. Heliyon 2024, 10, e33492. [Google Scholar] [CrossRef] [PubMed]
- Gao, Y.; Jin, S. Corporate nature, financial technology, and corporate innovation in China. Sustainability 2022, 14, 7162. [Google Scholar] [CrossRef]
- Lv, Y.; Wang, F.; Liu, G.; Ren, R. The impact of environmental court construction on the quality of corporate environmental information disclosure. Int. Rev. Financ. Anal. 2024, 95, 103512. [Google Scholar] [CrossRef]
- Mo, J.; Nie, H.; Wang, W.; Liu, Y. Exploring pathway to achieving carbon neutrality in China under uncertainty. Comput. Ind. Eng. 2023, 185, 109689. [Google Scholar] [CrossRef]
- Trotta, A.; Rania, F.; Strano, E. Exploring the linkages between FinTech and ESG: A bibliometric perspective. Res. Int. Bus. Financ. 2024, 69, 102200. [Google Scholar] [CrossRef]
- Liu, Z.; Li, X. The impact of bank fintech on ESG greenwashing. Financ. Res. Lett. 2024, 62, 105199. [Google Scholar] [CrossRef]
- Cumming, D.; Meoli, M.; Rossi, A.; Vismara, S. ESG and crowdfunding platforms. J. Bus. Ventur. 2024, 39, 106362. [Google Scholar] [CrossRef]
- Zhang, M.; Tian, J.; Ni, H.; Fang, G. Exploring teacher leadership and the factors contributing to it: An empirical study on Chinese private higher education institutions. SAGE Open 2021, 11, 21582440211002175. [Google Scholar] [CrossRef]
- Du, P.; Huang, S.; Hong, Y.; Wu, W. Can FinTech improve corporate environmental, social, and governance performance?—A study based on the dual path of internal financing constraints and external fiscal incentives. Front. Environ. Sci. 2022, 10, 1061454. [Google Scholar] [CrossRef]
- Wang, D.; Peng, K.; Tang, K.; Wu, Y. Does FinTech development enhance corporate ESG performance? Evidence from an emerging market. Sustainability 2022, 14, 16597. [Google Scholar] [CrossRef]
- Xie, H.H.; Lv, X. Responsible International Investment: ESG and China’s OFDI. Econ. Res. J. 2022, 3, 83–99. [Google Scholar]
- Wang, M.B.; Ye, T.; Kong, D.M. Green manufacturing and corporate environmental information disclosure: A policy experiment based on the establishment of green factories in China. Econ. Res. J. 2024, 59, 116–134. [Google Scholar]
- Hadlock, C.J.; Pierce, J.R. New evidence on measuring financial constraints: Moving beyond the KZ index. Rev. Financ. Stud. 2010, 23, 1909–1940. [Google Scholar] [CrossRef]
- Goldsmith, P.; Sorkin, I.; Swift, H. Bartik instruments: What, when, why, and how. Am. Econ. Rev. 2020, 110, 2586–2624. [Google Scholar] [CrossRef]
- Xiao, S.; Zhao, S. Financial development, government ownership of banks and firm innovation. J. Int. Money Financ. 2012, 31, 880–906. [Google Scholar] [CrossRef]
- Zhang, J.; Qian, F. Digital economy enables common prosperity: Analysis of mediating and moderating effects based on green finance and environmental pollution. Front. Energy Res. 2023, 10, 1080230. [Google Scholar] [CrossRef]

| Variable Classification | Variable Names | Symbols | Definition |
|---|---|---|---|
| Variable explained | ESG performance | ESG | ESG ratings are assigned 1–9 points from C to AAA |
| Explanatory variables | Fintech | Fintech | Baidu news crawler results |
| Mechanism variable | Quality of corporate environmental information disclosure | EIDQ | EIDQ is assigned a value of 2,1,0 based on whether it can be monetized |
| Financing constraints | SA | SA Index | |
| Control variables | Size of enterprise | Size | Total assets of the business at the end of the period are taken in logarithm |
| Asset–liability ratio | LEV | The ratio of a company’s total liabilities to its total assets | |
| Net profit margin on total assets | ROA | The ratio of a firm’s net profit to total assets | |
| Total asset turnover | ATO | The ratio of sales revenue to average total assets | |
| Cash flow ratio | Cashflow | The ratio of net cash flow from operating activities to total assets during the period | |
| Percentage of inventories | INV | Inventory to total assets | |
| Ratio of fixed assets | FIXED | Fixed assets to total assets | |
| Growth rate of operating income | Growth | The ratio of the current year’s operating income growth to the total operating income from the previous year. | |
| Size of directors | Board | Take the logarithm of the number of corporate boards | |
| The proportion of independent directors | Indep | The proportion of independent directors in relation to the total number of directors in a company | |
| Level of regional financial development | Areafin | The ratio of the balance of deposits and loans of urban financial institutions to regional GDP | |
| Level of regional economic development | Inpgdp | Gross product per capita and take the logarithm |
| Variables | Sample Size | Mean | Standard Deviation | Minimum | Maximum |
|---|---|---|---|---|---|
| ESG | 3415 | 4.227 | 0.926 | 1.000 | 7.000 |
| Fintech | 3415 | 4.967 | 1.598 | 0.693 | 8.491 |
| Size | 3415 | 22.283 | 1.315 | 18.951 | 27.621 |
| LEV | 3415 | 0.441 | 0.188 | 0.010 | 1.461 |
| ROA | 3415 | 0.042 | 0.069 | −0.720 | 0.741 |
| ATO | 3415 | 0.062 | 0.270 | −10.960 | 1.751 |
| Cashflow | 3415 | 0.719 | 0.423 | 0.021 | 5.175 |
| INV | 3415 | 0.041 | 0.069 | −1.080 | 0.390 |
| FIXED | 3415 | 0.138 | 0.087 | 0.000 | 0.760 |
| Growth | 3415 | 0.198 | 0.111 | 0.000 | 0.832 |
| Board | 3415 | 0.557 | 10.605 | −0.959 | 429.036 |
| Indep | 3415 | 2.109 | 0.192 | 1.386 | 2.890 |
| AreaFin | 3415 | 37.260 | 5.254 | 16.670 | 66.670 |
| Inpgdp | 3415 | 3.776 | 1.463 | 0.813 | 12.508 |
| Variables of Interest | ESG (1) | ESG (2) | ESG (3) | ESG (4) | ESG (5) | E (6) | S (7) | G (8) |
|---|---|---|---|---|---|---|---|---|
| Fintech | 0.136 *** (14.10) | 0.129 *** (11.34) | 0.030 * (1.89) | 0.107 *** (4.20) | 0.079 *** (2.87) | 0.434 *** (3.10) | 1.920 *** (17.17) | 0.267 *** (3.35) |
| Size | 0.169 *** (7.90) | 0.237 *** (7.90) | 0.186 *** (9.14) | 0.271 *** (7.90) | 1.713 *** (6.90) | 0.827 *** (6.05) | 0.540 *** (5.55) | |
| LEV | −1.226 *** (−12.11) | −1.168 *** (0.130) | −1.198 *** (−10.03) | −1.168 *** (−8.46) | −4.378 *** (−3.99) | −1.327 (−1.32) | −11.750 *** (−16.38) | |
| ROA | 1.769 *** (5.91) | 0.130 (0.47) | 0.654 ** (2.45) | 0.163 (0.59) | −2.353 (−1.27) | 8.353 *** (3.53) | 14.416 *** (8.56) | |
| ATO | 0.037 (0.53) | 0.098 * (1.69) | 0.072 (1.26) | 0.091 (1.57) | 0.498 (0.97) | 1.418 *** (3.94) | 0.574 ** (2.24) | |
| Cashflow | 0.127 *** (3.50) | 0.217 *** (3.45) | 0.161 *** (3.28) | 0.202 *** (3.17) | 0.782 (0.49) | −2.426 (−1.09) | 0.435 (0.27) | |
| INV | 0.977 *** (5.53) | 0.784 *** (2.83) | 0.803 *** (3.51) | 0.712 ** (2.54) | 2.704 (1.20) | 4.507 *** (2.59) | 6.598 *** (5.32) | |
| FIXED | 0.226 (1.62) | 0.192 (0.90) | 0.178 (1.01) | 0.152 (0.71) | 1.087 (0.63) | −1.922 (−1.39) | 1.899 * (1.93) | |
| Board | 0.371 *** (3.88) | 0.093 (0.69) | 0.158 (1.39) | 0.078 (0.59) | −0.465 (−0.43) | −0.136 (−0.14) | 3.087 *** (4.57) | |
| Indep | 0.015 *** (4.36) | 0.005 (1.24) | 0.008 ** (2.17) | 0.005 (1.25) | −0.024 (−0.71) | −0.102 *** (−3.11) | 0.219 *** (9.41) | |
| AreaFin | 0.003 (0.26) | 0.034 (1.12) | 0.024 (1.32) | 0.086 ** (2.51) | 0.284 (1.12) | −0.320 * (−1.76) | 0.373 *** (2.89) | |
| Urban fixed effect | YES | YES | YES | YES | YES | YES | YES | YES |
| Time fixed effect | YES | YES | YES | YES | YES | YES | YES | YES |
| Constant | 3.552 *** (70.61) | −1.969 *** (−3.62) | 0.116 (0.12) | −0.977 (−1.24) | −2.828 ** (−1.96) | 18.090 *** (4.23) | 51.160 *** (9.53) | 48.309 *** (12.63) |
| R-squared | 0.055 | 0.177 | 0.068 | 0.134 | 0.142 | 0.181 | ||
| N | 3415 | 3415 | 3415 | 3415 | 3415 | 3415 | 3415 | 3415 |
| Variables | Instrumental Variable Method | Explanatory Variables Are Lagged One Period | Increase the Fixed Effects | Replacing the Explanatory Variables |
|---|---|---|---|---|
| ESG (5) | ESG (6) | ESG (7) | ESG (8) | |
| Fintech | 0.332 *** (3.82) | 0.175 *** (14.48) | 0.079 *** (2.87) | 7.390 *** (4.36) |
| Control variable | YES | YES | YES | YES |
| Urban fixed effect | YES | YES | YES | YES |
| Time fixed effect | YES | YES | YES | YES |
| N | 3096 | 3096 | 3415 | 3415 |
| Variables | EIDQ | ESG | SA | ESG |
|---|---|---|---|---|
| (1) | (9) | (2) | (10) | |
| Fintech | 2.082 *** (19.75) | 0.0705 *** (6.60) | −0.0607 *** (−18.58) | 0.152 *** (13.44) |
| SA | 0.367 *** (5.91) | |||
| EIDQ | 0.0283 *** (15.00) | |||
| Size | 3.120 *** (23.76) | 0.0809 *** (5.41) | 0.0146 ** (2.65) | 0.164 *** (11.98) |
| LEV | −3.142 ** (−3.59) | −1.137 *** (−11.30) | −0.138 *** (−5.21) | −1.175 *** (−11.62) |
| ROA | 5.393 * (2.19) | 1.616 *** (4.14) | 0.190 ** (2.97) | 1.699 *** (4.47) |
| ATO | 1.590 *** (4.80) | 0.0823 * (2.51) | 0.00752 (0.77) | 0.125 *** (3.76) |
| INV | 2.203 (1.46) | 0.915 *** (5.07) | −0.110 * (−2.34) | 1.018 *** (5.63) |
| Growth | −0.0216 (−1.49) | −0.00205 ** (−3.20) | 0.000146 (0.49) | −0.00272 *** (−9.30) |
| Board | 2.353 ** (2.61) | 0.305 ** (3.20) | 0.0371 (1.35) | 0.358 *** (3.63) |
| Indep | 0.0576 (1.89) | 0.0129 *** (4.00) | 0.00780 *** (7.78) | 0.0117 *** (3.47) |
| Inpgdp | −1.555 *** (−4.77) | 0.0990 ** (2.75) | 0.0253 * (2.53) | 0.0458 (1.23) |
| Urban fixed effect | YES | YES | YES | YES |
| Time fixed effect | YES | YES | YES | YES |
| N | 3415 | 3415 | 3415 | 3415 |
| R-squared | 0.35 | 0.23 | 0.15 | 0.19 |
| Variables | Non-State-Owned Enterprises | State-Owned Enterprises | Small-Scale Enterprises | Large-Scale Enterprise | Non-High-Tech Enterprises | High and New Technology Enterprises |
|---|---|---|---|---|---|---|
| (1) | (2) | (3) | (4) | (5) | (6) | |
| Fintech | 0.0349 (0.73) | 0.106 ** (3.14) | 0.0502 (1.18) | 0.160 *** (4.13) | 0.102 (1.54) | 0.112 *** (3.37) |
| Size | 0.184 ** (2.84) | 0.318 *** (8.60) | 0.279 *** (4.30) | 0.522 *** (8.49) | 0.167 * (2.44) | 0.308 *** (7.92) |
| LEV | 0.814 ** (−3.20) | 1.317 *** (−7.93) | 1.182 *** (−6.93) | 1.217 *** (−4.59) | 0.856 ** (−3.05) | 1.186 *** (−6.99) |
| ROA | 0.286 * (2.54) | 0.00664 (0.10) | −0.00274 (−0.02) | 0.0242 (0.31) | 1.120 * (2.54) | 0.0968 (1.59) |
| ATO | 0.322 *** (3.37) | 0.122 (1.40) | 0.448 *** (3.82) | 0.0372 (0.40) | −0.182 (−1.15) | 0.248 ** (3.24) |
| INV | −0.269 (−0.58) | 1.268 *** (3.49) | 0.0908 (0.19) | 1.024 ** (2.66) | −0.544 (−0.82) | 1.172 *** (3.62) |
| AreaFin | 0.0759 (1.14) | 0.0961 * (2.35) | 0.101 * (2.01) | 0.00621 (0.12) | 0.0327 (0.44) | 0.105 ** (2.59) |
| N | 873 | 2542 | 1708 | 1707 | 915 | 2500 |
| R-squared | 0.10 | 0.09 | 0.08 | 0.15 | 0.08 | 0.10 |
| Urban fixed effect | YES | YES | YES | YES | YES | YES |
| Time fixed effect | YES | YES | YES | YES | YES | YES |
Disclaimer/Publisher’s Note: The statements, opinions and data contained in all publications are solely those of the individual author(s) and contributor(s) and not of MDPI and/or the editor(s). MDPI and/or the editor(s) disclaim responsibility for any injury to people or property resulting from any ideas, methods, instructions or products referred to in the content. |
© 2025 by the authors. Licensee MDPI, Basel, Switzerland. This article is an open access article distributed under the terms and conditions of the Creative Commons Attribution (CC BY) license (https://creativecommons.org/licenses/by/4.0/).
Share and Cite
Huang, X.; Li, D.; Sun, M. Fintech and Corporate ESG Performance: An Empirical Analysis Based on the NEV Industry. Sustainability 2025, 17, 434. https://doi.org/10.3390/su17020434
Huang X, Li D, Sun M. Fintech and Corporate ESG Performance: An Empirical Analysis Based on the NEV Industry. Sustainability. 2025; 17(2):434. https://doi.org/10.3390/su17020434
Chicago/Turabian StyleHuang, Xinhao, Di Li, and Meng Sun. 2025. "Fintech and Corporate ESG Performance: An Empirical Analysis Based on the NEV Industry" Sustainability 17, no. 2: 434. https://doi.org/10.3390/su17020434
APA StyleHuang, X., Li, D., & Sun, M. (2025). Fintech and Corporate ESG Performance: An Empirical Analysis Based on the NEV Industry. Sustainability, 17(2), 434. https://doi.org/10.3390/su17020434