Article

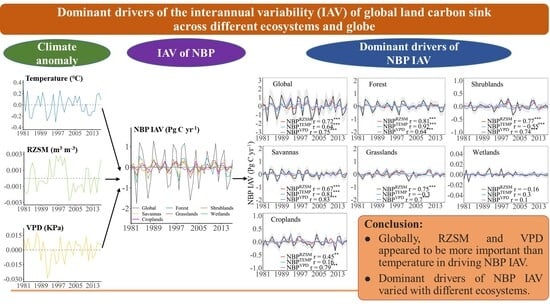
Partitioning Climatic Controls on Global Land Carbon Sink Variability: Temperature vs. Moisture Constraints Across Biomes

1
College of Tourism and Geographical Science, Leshan Normal University, Leshan 614000, China
2
College of Earth Science, Chengdu University of Technology, Chengdu 610059, China
3
State Key Laboratory of Geohazard Prevention and Geoenvironment Protection, Chengdu University of Technology, Chengdu 610059, China
*
Author to whom correspondence should be addressed.
Sustainability 2025, 17(21), 9377; https://doi.org/10.3390/su17219377
Submission received: 19 August 2025 / Revised: 19 September 2025 / Accepted: 24 September 2025 / Published: 22 October 2025
(This article belongs to the Section Sustainable Transportation)

Abstract

Terrestrial carbon sink has exhibited significant interannual variability (IAV) over the past five decades. However, the dominant regions and factors controlling the IAV of global land carbon sink remain controversial. Using six TRENDY models, we quantified regional contributions to the IAV of global land carbon sink from 1981 to 2017 and identified the dominant factors across different ecosystems and the globe. Results indicated that forests and savannas contributed most to global net biome productivity (NBP) IAV (27% and 29%, respectively). Further analyses revealed that root zone soil moisture (RZSM) and vapor pressure deficit (VPD) played a dominant role at the local and global scales, particularly in regions between 20° S and 40° S and 40° N–60° N. Across different ecosystems, the dominant drivers of NBP IAV varied greatly. More precisely, in tropical forests, NBP IAV was dominated by temperature variability, whereas in extra-tropical forests and croplands, VPD variability played a dominant role. Furthermore, in shrublands and grasslands, RZSM and VPD have comparable effects on NBP anomalies. Our findings provided robust evidence for an important joint control of RZSM and VPD in the IAV of land carbon sink, and reduced some of the uncertainty around the dominant drivers of temporal variability in NBP.

Graphical Abstract

1. Introduction

Global terrestrial ecosystems are a major carbon sink, absorbing between about 20% and 30% of anthropogenic CO2 emissions every year [1,2]. This carbon sink plays a critical role in slowing down global warming [3]. Over the past half century, global land carbon sink has increased, whereas it has also exhibited a larger interannual variability (IAV) than ocean carbon sink [4]. This large IAV of land carbon sink has caused the fluctuation of atmosphere CO2 growth rate (CGR) [5,6,7,8,9,10]. Therefore, understanding the IAV of the land carbon sink and clarifying its dominant drivers are beneficial to accurately predict annual variability in future atmospheric CO2 concentrations and understand the relationships between climate and the carbon cycle.
The IAV of land carbon sink has received more attention, while its dominant drivers still remain controversial. Some studies agreed that the IAV of global land carbon sink was dominated by temperature [10,11,12]. For example, Wang, Piao et al. [12] indicated that the sensitivity of CGR to the IAV of tropical temperature has increased by around two-fold in the past five decades. Whereas other studies argued that water availability, e.g., precipitation, terrestrial water storage (TWS) and soil moisture had a dominant role [13,14,15,16]. For instance, Wang, Bastos et al. [15] demonstrated that the IAV of global land carbon sink was dominated by TWS due to the compensatory responses existed in different seasons to temperature. Humphrey, Berg et al. [17] indicated that 90 per cent of the IAV in global land carbon sink was driven by soil moisture variability. Jung, Reichstein et al. [18] reported that the IAV of land carbon sink was mostly controlled by soil moisture at the local scale. However, previous studies have not thoroughly analyzed the differences in how soil moisture controls IAV of land carbon sink across ecosystems [16,17]. It is worth noting that root zone soil moisture (RZSM) has widespread impacts on vegetation production [19]. In addition, we found that RZSM has significantly decreased since 1980, especially in regions with large contributions to the IAV of global land carbon sink, such as the Amazon rainforest [20]. Thus, it is necessary to examine the contributions of RZSM to the IAV of global land carbon sink.
In addition to above proxies of water availability, vapor pressure deficit (VPD) has been recognized as an important limited factor of plant photosynthesis through its regulations on plant stomata [21,22]. Since 1980s, VPD has gradually increased under a warming climate [23]. Increased VPD, as a result, reduced global vegetation growth [24]. Moreover, the increase in VPD markedly affected vegetation productivity [25,26] and plant mortality [27,28], which may reduce the global land carbon sink. A recent study demonstrated that VPD variability has a strong correlation with fluctuations in CGR and carbon fluxes, e.g., NEP, [4,29].
However, a systematic inter-comparison of temperature, RZSM and VPD for the IAV of land carbon sink has been missing so far at regional and global scales. To fill these knowledge gaps, we used six model outputs from TRENDY v9 to address: (1) which ecosystems dominate the IAV of land carbon sink (hereafter referred to as NBP IAV) at the global scale; and (2) what kind of factors (e.g., temperature, root zone soil moisture and VPD) dominate the NBP IAV across different ecosystems and globe.

2. Materials and Methods

2.1. NBP and GPP Data

In this study, we used the model simulation results from dynamic global vegetation models (DGVMs) from the “Trends and drivers of the regional scale sources and sinks of carbon dioxide” (TRENDY) v9 project for the period of 1981–2017. The NBP and GPP data in the TRENDY v9 used in this study were based on simulations with ISAM, LPJ, LPJ-GUESS, LPX-Bern, ORCHIDEEv3 and VISIT. These models run at a spatial resolution of 0.5° × 0.5° (Table 1). Our analysis used the model outputs of NBP and GPP under the TRENDY “S2” experiment (which includes the effects of time-varying CO2 concentrations and climate changes) at the monthly scale. The TER (total ecosystem respiration) was derived using the carbon mass balance approach. We calculated yearly carbon fluxes (NBP, GPP and TER) for each model for further analysis. In this study, the multi-model ensemble mean of simulated NBP, GPP and TER from six DGVMs were used.

2.2. Soil Moisture Data

In this study, root zone soil moisture between 0 and 100 cm was selected. This was because the top meter (0–100 cm) of soil has frequently been taken as the “root zone” in large-scale modeling studies [35], and the highest density of plant root generally exists in this depth range [36]. A recent study indicated that the global mean root depth was 0.678 m, and the areas with depths of less than 100 cm accounted for 80% of global land areas [37].
Soil moisture was derived from the land component of ERA5 (ERA5-Land), which was based on the CHTESSEL model at 9 km horizontal resolution [38]. ERA5’s soil moisture datasets were well validated based on in situ observations [39,40,41]. Before further data analysis, all soil moisture datasets were resampled to 0.5° resolution by using the bilinear interpolation. The soil moisture over 0–7 cm, 7–28 cm, and 28–100 cm were weighted to obtain the RZSM (0–100 cm) with the weight 0.07 (7 cm/100 cm), 0.21 and 0.72 for the first, second and third layers, respectively [41,42]:
θ 0 100   cm   =   0.07 × θ 0 7 cm   +   0.21 × θ 7 28   cm   +   0.72 × θ 28 100   cm ,
where the θ0–100cm presents the soil moisture volume over 0–100 cm (m3 m−3); θ0–7cm, θ7–28cm, θ28–100cm present the soil moisture volume over 0–7 cm, 7–28 cm, and 28–100 cm (m3 m−3), respectively.

2.3. Temperature and VPD Data

Global mean air temperature, maximum air temperature, minimum air temperature, saturated vapor pressure (SVP) and actual vapor pressure (AVP) were derive from the Climate Research Unit gridded Time Series CRU TS v4.06 [43]. CRU TS provides monthly climate variables at a spatial resolution of 0.5° × 0.5° from 1980 to present.
VPD was calculated as [4]:
VPD   =   SVP     AVP ,
SVP = 0.5   × 0.611   ×   exp ( 17.3   ×   T m i n T m i n + 237.3 ) + 0.611   ×   exp ( 17.3   ×   T m a x T m a x + 237.3 ) ,
where SVP and AVP are the saturated vapor pressure and actual vapor pressure (KPa), respectively; Tmax and Tmin are the maximum air temperature and minimum air temperature (°C), respectively.

2.4. Land Cover Data

The global land cover map was derived from the MODIS land cover datasets (MCD12Q1) with a spatial resolution of 0.005°. Firstly, the land cover datasets were aggregated to 0.5° by 0.5° spatial resolution [44]. Secondly, land cover types were grouped into: (1) forests, including evergreen needleleaf forest, evergreen broadleaf forest, deciduous needleleaf forest, deciduous broadleaf forest and mixed forest; (2) shrublands, including closed shrublands and open shrublands; (3) savannas, including woody savannas and savannas; (4) grasslands; (5) wetlands; (6) croplands, including croplands and natural vegetation mosaic. Then, forests were further divided into tropical and extra-tropical forests based on Köppen–Geiger climate classification [45].
These datasets were summarized in Table S1.

2.5. Contribution Index

To clarify the dominant ecosystem of the IAV of global carbon sink, we calculated the relative contribution of grid cells to the global NBP IAV by using the contribution index method proposed by [46]. We further partition global NBP IAV among land cover classes (e.g., forests, shrublands, savannas, grasslands, wetlands, and croplands) based on the relative contribution of individual grid cells to global NBP IAV. The contribution index (fj) was defined as:
  f j   =   t x j t X t X t t X t ,
where xjt is the NBP anomaly (departure from a long-term trend) for j grid cell at time t (in years); Xt is the global NBP anomaly (Xt = ∑jxjt). Regions or grid cells with higher and positive values of fj are considered to have a large contribution to global NBP IAV, while regions or grid cells with low values of fj contribute less. This method was also used to partition the global NBP IAV among different carbon flux components, e.g., GPP and TER.

2.6. Anomalies Decomposition

To diagnose the contributions of different climatic drivers (e.g., temperature, RZSM and VPD) on NBP IAV, we decomposed NBP IAV into their addictive components forced by annual anomalies of temperature, RZSM and VPD [18]. Firstly, we obtained NBP IAV (shown as the △NBPs,y in Equation (5)) and IAV of climatic drivers by removing their trend over year for each grid cell using a least-squares linear fitting method. Secondly, we fitted a multiple linear regression model, constrained to have zero-intercept, to attribute the NBP variability to the respective variations in the climatic drivers. Then, the estimated NBP sensitivity to interannual variations in climatic drivers (for example a s R Z S M ) multiplied by the respective anomalies of those drivers (for example △RZSMs,y) quantifies the NBP anomaly component driven by each climatic drivers (for example △ N B P s , y R Z S M ). These individual components were subsequently synthesized into a reconstructed NBP anomaly (△ N B P s , y * in Equation (5)).
  NBP s , y = a s RZSM   ×   RZSM s , y + a s TEMP   ×   TEMP s , y + a s VPD   ×   VPD s , y + ε s , y NBP s , y * = NBP s , y RZSM + NBP s , y TEMP + NBP s , y VPD ,
where △NBPs,y presents the detrend annual anomaly of NBP; △RZSMs,y, △TEMPs,y and △VPDs,y are the detrended annual anomalies of RZSM, TEMP and VPD, respectively; △ N B P s , y R Z S M , △ N B P s , y T E M P and △ N B P s , y V P D are the individual RZSM-driven, temperature-driven, and VPD-driven NBP IAV, respectively; △ N B P s , y * presents the annual anomalies of NBP reconstructed by RZSM, TEMP and VPD; subscripts s and y are the index values of grid cells and years (from 1981 to 2017), respectively; a is the regression coefficient, which was assessed at the p < 0.05 level based on a two-sided t-test; εs,y is the residual error term.
Before further data analysis, all monthly datasets were aggregated to an annual scale. All data analyses introduced above were conducted in R [47].

3. Results

3.1. Trends and IAV of NBP Across Different Ecosystems and Globe

Increases in land NBP were observed during the period of 1981–2017. Globally, land NBP increased from −0.08 Pg C yr−1 (carbon source) in 1983 to 3.89 Pg C yr−1 in 2011 (carbon sink), at a mean rate of 0.04 Pg C yr−2 (p < 0.05, Figure 1a). Among different ecosystems, land NBP in both grasslands and savannas significantly increased by 0.01 Pg C yr−2, whereas the remaining ecosystems did not significantly increase (Figure 1a).
At the global scale, terrestrial land NBP showed a large IAV from 1981 to 2017, with a detrended NBP anomaly varied from −1.76–1.34 Pg C yr−1 (Figure 1b). Among different ecosystems, savannas and grasslands presented a relatively largest NBP IAV, with detrended NBP anomalies ranging between −1.00–0.79 Pg C yr−1 and −0.72–0.79 Pg C yr−1, respectively; followed by tropical forests (−0.68–0.52 Pg C yr−1), shrublands (−0.64–0.76 Pg C yr−1) and croplands (−0.58–0.56 Pg C yr−1). In contrast, extra-tropical forests and wetlands had the lowest detrended NBP anomaly varied between −0.19–0.16 Pg C yr−1 and −0.02–0.03 Pg C yr−1, respectively (Figure 1b).

3.2. Relative Contributions in Different Regions and Carbon Fluxes to Global NBP IAV

In the TRENDY model ensemble, the relative contributions of local NBP IAV into global NBP IAV presented a strong spatial pattern globally. The largest contribution values were mainly distributed in eastern of the United States of America (USA), tropical South America, southeastern Africa, and coastal Australia, >0.005%. On the contrary, relatively low contributions of less than −0.003% were generally observed in western America, southeastern South America and part of central Africa and central Asia (Figure 2a).
To identify the regions that dominated the IAV of global NBP, we divided the global land surface into seven main land cover classes (e.g., tropical forests, extra-tropical forests, shrublands, savannas, grasslands, wetlands and croplands) according to the MODIS land cover classification (MODIS MCD12Q1). Among the seven land cover classes, savannas and forests were found to account for the largest fraction, 29.40% and 26.50% (the sum of contributions of tropical forest and extra-tropical forests), of global NBP IAV, respectively; followed by grasslands (18.80%), croplands (17.60%) and shrublands (6.20%). By contrast, wetlands had the least contribution to global NBP IAV, with a contributed fraction less than 1% (Figure 2b).
Moreover, we found that the contribution of GPP (47%, sum of GPP contributions in each grid cells, Figure 3a) to global NBP IAV was slightly less than that of TER (53%, sum of the TER contributions in each grid cell, Figure 3b). Spatially, in the Southern Hemisphere (SH), NBP IAV was mostly contributed by GPP anomalies, especially in tropical South America, southeastern Africa and the coast of Australia. In the Northern Hemisphere (NH), NBP IAV was partially contributed by GPP anomalies that were distributed in southeastern USA, partial areas of Europe (e.g., Poland, Ukraine and Republic of Belarus), southern Russia, partial areas of India and Southeastern Asia (Figure 3a). Furthermore, another part of NBP IAV was contributed by TER anomalies that were observed in northeastern USA, southern Canada, West Siberian Plain, the East European Plain and southeastern China (Figure 3b).

3.3. NBP Anomalies in Related to Climate Variables

To investigate the relationships between climate variables and NBP IAV, partial correlations were conducted for each grid cell. Our results showed that detrended NBP was positively correlated with detrended RZSM over 78% of the areas (50% with significant correlation, Figure 4a). In addition, there was a negative correlation between detrended NBP and temperature in approximately 55% of land areas, particularly in Amazon basin (Figure 4b). Moreover, in 74% of land areas, detrended NBP was negatively correlated with detrended VPD (33% with a significant negative correlation). Areas over northern high latitudes exhibited a positive correlation between detrended NBP and VPD (Figure 4c).
To further reveal the dominant drivers of global land carbon sink, we attributed the factors contributing to NBP IAV by using the carbon flux anomaly decomposition approach described in Section 2.6. We first verified that NBP anomalies reconstructed with climatic factors could correctly produce the detrended NBP time series (evaluated by the correlations as shown in Figure S1). The correlation coefficients between the globally reconstructed NBP anomalies and original NBP anomalies were as high as 0.90 (p < 0.001), indicating that climatic variables had a good capacity for reconstructing NBP anomalies. Globally, the original NBP anomaly showed stronger correlations with the RZSM-driven (r = 0.72, p < 0.001) and VPD-driven (r = 0.75, p < 0.001) components compared to the temperature-driven (r = 0.64, p < 0.001) component (Figure 5a). This suggested that RZSM and VPD have a stronger influence on NBP variability than temperature.
In different ecosystems, the dominant drivers of NBP IAV greatly varied. In tropical forests, the correlation coefficient between NBPTEMP (r = 0.92, p < 0.001) and original NBP anomaly was obviously higher than that in NBPRZSM (r = 0.86, p < 0.001) and NBPVPD (r = 0.81, p < 0.001), indicating that NBP IAV was mainly driven by temperature variability rather than by RZSM or VPD variability (Figure 5b). However, in extra-tropical forests, VPD exerted a stronger control on NBP IAV than temperature and RZSM, with a correlation coefficient of 0.74 (p < 0.001, Figure 5c). In shrublands and grasslands, NBP IAV was mainly controlled by the fluctuations in RZSM and VPD (Figure 5d,f). But in savannas, NBP IAV was mainly driven by the fluctuations in temperature and VPD (Figure 5e). In addition, in cropland, the dominant factor for NBP IAV was VPD (r = 0.79, p < 0.001, Figure 5h), whereas in wetlands none of the climatic factors played a dominant role (p > 0.05, Figure 5g).

4. Discussion

4.1. Contributions of Regional Ecosystems to the IAV of Global Land Carbon Sink

In this study, we found that forests and savannas dominated the magnitude of global land carbon sink, accounting for 37% (0.82 Pg C yr−1) and 30% (0.67 Pg C yr−1) of the global NBP (2.21 Pg C yr−1) on average, respectively (Table S2). Meanwhile, forests and savannas also dominated the IAV of global land carbon sink (Figure 2b), particularly in tropical forests and tropical semi-arid ecosystems (Figure 2a and Figure S2). In these regions, the IAV of land carbon sink was strongly associated with GPP anomalies (Figure 3a and Figure S3), which was highly correlated with hydro-climatic extremes, e.g., drought, [26,48,49]. Especially in tropical water limited areas such as southern Africa and Australia, drought and drought-heat were significantly related to GPP losses, explaining 30–40% of the global GPP losses over the last three decades [50]. Moreover, El Niño resulted in severe drought and heatwaves in tropics, which negatively affected plant growth and thereby reduced land carbon sink in the tropics [48,49,51]. This was because the decline of GPP in the tropics caused by El Niño was much greater than the enhanced TER [48]. In contrast, in boreal forests, the IAV of land carbon sink was mainly determined by TER anomalies (Figure 3b and Figure S4), which mostly resulted from temperature rising and precipitation change through its impact on heterotrophic respiration Rh [52].
In addition to forest and savanna ecosystems, croplands and grasslands, from which the contributions to global NBP IAV were nearly equivalent (both around 18%, Figure 2b). Spatially, the contributions of croplands to the IAV of global land carbon sink were mainly located in the NH, e.g., central of the USA, India, southern Russia and Ukraine (Figure 2a). However, the contributions of grasslands to the IAV of global land carbon sink were mainly distributed in the SH, such as eastern and southern of the Brazil, eastern Australia and part of southeastern Africa. Moreover, we found that the IAV of land carbon sink in both croplands and grasslands was mainly induced by GPP anomalies (Figure 3). In terms of croplands, this may be due to the fact that the crop productivity was intensively disturbed by human land-use management, e.g., multiple cropping. Taking India as an example, the greening of vegetation mostly occurred in croplands (82%) that is, becoming more productivity [53], as a result changing in carbon uptake year to year.
Additionally, we found that the contributions of carbon flux components in different ecosystems to the IAV of global land carbon sink varied among TRENDY models (Figure S5). For example, the ISAM model showed that TER (78.4%, sum of TER contributions in all ecosystems) anomalies contributed four times as much as GPP anomalies (19.5%, sum of GPP contributions in all of ecosystems). However, in LPX-Bern, ORCHIDEEv3 and VISIT models, GPP anomalies dominated the global NBP IAV. These differences were highly related to the different processes included in dynamic global vegetation models GVMs [54]. For instance, Chen and Xing et al. [55,56] indicated that carbon fluxes (e.g., net primary productivity, soil respiration and ecosystem respiration) were significantly affected by N deposition. However, some DGVMs such as LPJ and VISIT have not taken the impacts of N deposition on carbon fluxes into consideration [54]. Thus, to reduce the uncertainties of contributions of carbon fluxes to the IAV of global land carbon sink at the ecosystem scale, more efforts are needed to optimize structure and parameters in DGVMs.

4.2. Climatic Drivers of the IAV of Global Land Carbon Sink

In recent years, many studies have highlighted the control of temperature on the IAV of land carbon sink [11,18], it is not surprising that we found global NBP IAV was significantly correlated with temperature. However, it is worth noting that RZSM and VPD had a stronger influence than temperature on the NBP IAV at the global scale (Figure 5), which was inconsistent with [18]. Such discrepancies implied that the influences of atmospheric dryness must be considered when estimating how the IAV of global carbon sink responds to climatic change. As shown in Figure S6, VPD IAV had a stronger negative correlation with NBP IAV than temperature and RZSM on the global scale.
Moreover, our results indicated that we should focus on the impact of VPD on the IAV of land carbon sink, particularly in regions between 40° N and 60° N and 20° S–40° S. At 20° S–40° S, we found that the IAV of land carbon sink was dominated by both VPD and RZSM (Figure S7). This was because in most areas at 20° S–40° S, such as southern Africa, there was a strong coupling between soil moisture and VPD [57]. As shown in Figure 4, at 20° S–40° S, NBP IAV was significantly negatively correlated with VPD variability but positively correlated with RZSM variability, implying that higher VPD and lower RZSM would result in a reduction in land carbon sink. On one hand, root zone soil moisture had direct effects on NBP through its impacts on photosynthesis because root zone soil moisture determines the amount of water that can be extracted by plant roots [58]. On the other hand, RZSM variability could enhance VPD variability through land-atmosphere interaction, thus leading to indirect effects on NBP [17]. By contrast, at 40° N–60° N, VPD exerted a stronger control on the IAV of land carbon sink than RZSM and temperature (Figure S7), which was observed in the relatively strong negative correlation between NBP IAV and VPD variability (Figure 4). The reason for this phenomenon was that the increase in temperature and the decrease in soil moisture jointly enhanced the effect of VPD on vegetation productivity [59].
Regionally, the dominant driver for the IAV of land carbon sink varied across different ecosystems. In tropical forests, NBP IAV was dominated by temperature fluctuation. This was because frequent warm extremes over the past 40 years significantly weakened the terrestrial carbon sequestration of tropical forests [60]. In particular, during El Niño events, warmer temperature and drought limited the photosynthetic uptake of tropical forests, leading to a decrease in aboveground biomass carbon [49,61] and a loss of GPP [51,62,63,64]. A second reason was that tropical forests accounted for the largest fraction of global Rh, and temperature fluctuation dominated the tropical forest Rh variability [65]. Warmer anomalies in tropical regions had a dual effect on increasing Rh and decreasing vegetation productivity. These concurrent responses amplified the influence of temperature on the IAV of land carbon sink [11]. Nevertheless, we cannot ignore the fact that RZSM and VPD significantly affected the IAV of land carbon sink because tropical forests like those in the Amazon basin were a hot spot of concurrent extreme VPD and soil moisture. Extremely low soil moisture and high VPD could result in markedly strong negative anomalies in land carbon sink [57]. Notably, we observed a significant decrease in RZSM in many tropical forests, e.g., the Amazon Basin and Congo Basin [20]. Generally, a decrease in soil moisture could lead to an increase in VPD, which would further constrain photosynthesis, reduce terrestrial carbon sink and increase atmospheric CGR.
In shrublands and grasslands, the influences of temperature variability were far less than that of RZSM variability and VPD variability on NBP IAV. This was mainly because a large fraction of water-limited areas were covered by shrublands and grasslands [66]. In water-limited areas, ecosystem productivity [26,67,68] and respiration [65] were more responsive to soil moisture. It is likely that soil moisture dominated the IAV of land carbon sink through its influence on photosynthesis, because soil moisture was the dominant driver of vegetation productivity [26,68]. Particularly in dryland ecosystems, sustained low soil moisture generally was accompanied by a warmer and drier atmosphere and a high VPD. In turn, high VPD could enhance evaporative demand, further accelerating the water loss of soil. These processes resulted in negative GPP anomalies [69]. In croplands, the impact of RZSM on NBP IAV was significantly weaker than that of VPD. This phenomenon can be attributed to two primary reasons. Firstly, the construction of water facilities and improvements in irrigation technology could potentially alleviate constraints on water availability for crop cultivation [70,71]. For instance, recent research demonstrated that mulched drip irrigations effectively replenished RZSM, promoting maize growth and enhancing water use efficiency, thereby indirectly sustaining higher carbon uptake capacity. Similarly, Martínez et al. found that irrigation led to higher water use efficiency and more stable carbon fluxes (e.g., GPP) in potato fields [72]. Collectively, these findings indicated that management practices like irrigation could maintain or even enhance ecosystem carbon sink function by mitigating water stress. Secondly, VPD exerted a strong regulation on plant stomata [21,22]. High VPD induced stomatal closure to reduce water loss, which directly limits CO2 uptake and reduces GPP and NBP. According to Novick, Ficklin et al. [73], VPD limits stomata more strongly than soil moisture in most ecosystems. Our results suggested that the divergent impacts of temperature, RZSM and VPD need to be considered in different ecosystems to more accurately assess climate effects on the IAV of land carbon sink.

4.3. Limitations

In this study, we calculated the relative contributions of different ecosystems to the IAV of global land carbon sink, and quantified the dominant drivers at regional and global scales. However, some limitations and uncertainties still remain. Firstly, in addition to temperature, RZSM and VPD, other environmental factors such as nitrogen deposition, CO2 concentration and disturbances (e.g., land-use) may affect the quantification of regional contributions to the IAV of global land carbon sink, which should be further investigated in the future. Secondly, the carbon fluxes used in this study were estimated by DGVMs from TRENDY v9. It is unknown whether the dominant drivers differ in different datasets produced by different approaches: process-based vegetation models, atmospheric inversions and data-driven models. In future, inter-comparison of the relationships between the IAV of global land carbon sink and temperature, RZSM and VPD by using above three approaches should be conducted. Thirdly, it is unknown whether the control of moisture varies along with the water availability variables used in the decomposition process. This work should be investigated in the future. This work would help improve the understanding of the impacts of climatic variability on the IAV of global land carbon sink and optimize structures and parameters for the different approaches.

5. Conclusions

The interannual variability of the global land carbon sink, a primary determinant of atmospheric CO2 concentration fluctuations, is largely regulated by various environmental factors. Thus, it is necessary to detect dominating factors affecting the IAV of global land carbon sink to improve forecast of future terrestrial carbon sink under climate change. Using global NBP datasets derived from TRENDY v9, this study revealed that moisture dominated the NBP IAV at the local and global scale rather than temperature. Furthermore, the dominant drivers greatly varied across different biomes. In water-limited ecosystems such as shrublands and grasslands, the NBP IAV was jointly controlled by RZSM and VPD. Sustained declines in RZSM may reduce carbon uptake in these ecosystems in future through positive feedback between land and atmosphere. In contrast, in humid tropical forests, temperature played a dominant role in driving the NBP IAV, primarily through its effects on GPP. These findings provided new insight into understanding the IAV of global land carbon sink, and highlighted the importance of RZSM, VPD and temperature to terrestrial carbon sink in understanding carbon-climate feedback and projecting future climate changes.

Supplementary Materials

The following supporting information can be downloaded at: https://www.mdpi.com/article/10.3390/su17219377/s1.

Author Contributions

X.L. designed the conceptualization, performed data analyses, and wrote the draft; S.L. and W.Y. helped to frame the study and data analysis; X.T. and Y.S. helped to data collection and contributed to the writing; all authors contributed to final preparation of the manuscript. All authors have read and agreed to the published version of the manuscript.

Funding

This research was funded by the Starting Funding of Leshan Normal University, grant number 205240011.

Institutional Review Board Statement

Not applicable.

Informed Consent Statement

Not applicable.

Data Availability Statement

Net biome productivity and gross primary productivity datasets from 1981 to 2017 are available at https://figshare.com/account/items/28233365/edit (accessed on 4 August 2020). Soil moisture datasets are available via https://www.ecmwf.int/en/forecasts/datasets/reanalysis-datasets/era5 (accessed on 16 December 2022). Temperature datasets can be obtained from https://crudata.uea.ac.uk/cru/data/hrg/ (accessed on 13 February 2021). MODIS datasets are available via https://modis.gsfc.nasa.gov/ (accessed on 13 February 2021).

Acknowledgments

This study was supported by the Starting Funding of Leshan Normal University. The authors thank Xiaolu Tang and Yuehong Shi for their kind help with data collection and R codes. We acknowledge producers of datasets used in this study.

Conflicts of Interest

The authors declare no conflicts of interest.

References

  1. Friedlingstein, P.; O’Sullivan, M.; Jones, M.W.; Andrew, R.M.; Hauck, J.; Olsen, A.; Peters, G.P.; Peters, W.; Pongratz, J.; Sitch, S.; et al. Global Carbon Budget 2020. Earth Syst. Sci. Data 2020, 12, 3269–3340. [Google Scholar] [CrossRef]
  2. Tang, X.; Zhao, X.; Bai, Y.; Tang, Z.; Wang, W.; Zhao, Y.; Wan, H.; Xie, Z.; Shi, X.; Wu, B.; et al. Carbon pools in China’s terrestrial ecosystems: New estimates based on an intensive field survey. Proc. Natl. Acad. Sci. USA 2018, 115, 4021–4026. [Google Scholar] [CrossRef]
  3. Keenan, T.F.; Prentice, I.C.; Canadell, J.G.; Williams, C.A.; Wang, H.; Raupach, M.; Collatz, G.J. Recent pause in the growth rate of atmospheric CO2 due to enhanced terrestrial carbon uptake. Nat. Commun. 2016, 7, 13428–13437. [Google Scholar] [CrossRef]
  4. He, B.; Chen, C.; Lin, S.; Yuan, W.; Chen, H.W.; Chen, D.; Zhang, Y.; Guo, L.; Zhao, X.; Liu, X.; et al. Worldwide impacts of atmospheric vapor pressure deficit on the interannual variability of terrestrial carbon sinks. Natl. Sci. Rev. 2021, 9, nwab150. [Google Scholar] [CrossRef]
  5. Piao, S.; Wang, X.; Wang, K.; Li, X.; Bastos, A.; Canadell, J.G.; Ciais, P.; Friedlingstein, P.; Sitch, S. Interannual variation of terrestrial carbon cycle: Issues and perspectives. Glob. Chang. Biol. 2020, 26, 300–318. [Google Scholar] [CrossRef] [PubMed]
  6. Bousquet, P.; Peylin, P.; Ciais, P.; Le Quéré, C.; Friedlingstein, P.; Tans, P.P. Regional changes in carbon dioxide fluxes of land and oceans since 1980. Science 2000, 290, 1342–1347. [Google Scholar] [CrossRef] [PubMed]
  7. Zeng, N.; Mariotti, A.; Wetzel, P. Terrestrial mechanisms of interannual CO2 variability. Glob. Biogeochem. Cycles 2005, 19, GB1016. [Google Scholar] [CrossRef]
  8. Wang, J.; Zeng, N.; Wang, M. Interannual variability of the atmospheric CO2 growth rate: Roles of precipitation and temperature. Biogeosciences 2016, 13, 2339–2352. [Google Scholar] [CrossRef]
  9. Braswell, B.H.; Schimel, D.S.; Linder, E.; Moore, B. The Response of Global Terrestrial Ecosystems to Interannual Temperature Variability. Science 1997, 278, 870–873. [Google Scholar] [CrossRef]
  10. Cox, P.M.; Pearson, D.; Booth, B.B.; Friedlingstein, P.; Huntingford, C.; Jones, C.D.; Luke, C.M. Sensitivity of tropical carbon to climate change constrained by carbon dioxide variability. Nature 2013, 494, 341–344. [Google Scholar] [CrossRef]
  11. Wang, W.; Ciais, P.; Nemani, R.R.; Canadell, J.G.; Piao, S.; Sitch, S.; White, M.A.; Hashimoto, H.; Milesi, C.; Myneni, R.B. Variations in atmospheric CO2 growth rates coupled with tropical temperature. Proc. Natl. Acad. Sci. USA 2013, 110, 13061–13066. [Google Scholar] [CrossRef]
  12. Wang, X.; Piao, S.; Ciais, P.; Friedlingstein, P.; Myneni, R.B.; Cox, P.; Heimann, M.; Miller, J.; Peng, S.; Wang, T.; et al. A two-fold increase of carbon cycle sensitivity to tropical temperature variations. Nature 2014, 506, 212–215. [Google Scholar] [CrossRef]
  13. Zhang, L.; Ren, X.; Wang, J.; He, H.; Wang, S.; Wang, M.; Piao, S.; Yan, H.; Ju, W.; Gu, F.; et al. Interannual variability of terrestrial net ecosystem productivity over China: Regional contributions and climate attribution. Environ. Res. Lett. 2019, 14, 014003. [Google Scholar] [CrossRef]
  14. Poulter, B.; Frank, D.; Ciais, P.; Myneni, R.B.; Andela, N.; Bi, J.; Broquet, G.; Canadell, J.G.; Chevallier, F.; Liu, Y.Y.; et al. Contribution of semi-arid ecosystems to interannual variability of the global carbon cycle. Nature 2014, 509, 600–603. [Google Scholar] [CrossRef]
  15. Wang, K.; Bastos, A.; Ciais, P.; Wang, X.; Rodenbeck, C.; Gentine, P.; Chevallier, F.; Humphrey, V.W.; Huntingford, C.; O’Sullivan, M.; et al. Regional and seasonal partitioning of water and temperature controls on global land carbon uptake variability. Nat. Commun. 2022, 13, 3469–3470. [Google Scholar] [CrossRef]
  16. Green, J.K.; Seneviratne, S.I.; Berg, A.M.; Findell, K.L.; Hagemann, S.; Lawrence, D.M.; Gentine, P. Large influence of soil moisture on long-term terrestrial carbon uptake. Nature 2019, 565, 476–479. [Google Scholar] [CrossRef]
  17. Humphrey, V.; Berg, A.; Ciais, P.; Gentine, P.; Jung, M.; Reichstein, M.; Seneviratne, S.I.; Frankenberg, C. Soil moisture-atmosphere feedback dominates land carbon uptake variability. Nature 2021, 592, 65–69. [Google Scholar] [CrossRef]
  18. Jung, M.; Reichstein, M.; Schwalm, C.R.; Huntingford, C.; Sitch, S.; Ahlstrom, A.; Arneth, A.; Camps-Valls, G.; Ciais, P.; Friedlingstein, P.; et al. Compensatory water effects link yearly global land CO2 sink changes to temperature. Nature 2017, 541, 516–520. [Google Scholar] [CrossRef] [PubMed]
  19. Li, W.; Migliavacca, M.; Forkel, M.; Walther, S.; Reichstein, M.; Orth, R. Revisiting Global Vegetation Controls Using Multi-Layer Soil Moisture. Geophys. Res. Lett. 2021, 48, e2021GL092856. [Google Scholar] [CrossRef]
  20. Luo, X.; Li, S.; Yang, W.; Liu, L.; Shi, Y.; Lai, Y.; Yu, P.; Yang, Z.; Luo, K.; Zhou, T.; et al. Spatio-temporal changes in global root zone soil moisture from 1981 to 2017. J. Hydrol. 2023, 626, 130297–130309. [Google Scholar] [CrossRef]
  21. Grossiord, C.; Buckley, T.N.; Cernusak, L.A.; Novick, K.A.; Poulter, B.; Siegwolf, R.T.W.; Sperry, J.S.; McDowell, N.G. Plant responses to rising vapor pressure deficit. New Phytol. 2020, 226, 1550–1566. [Google Scholar] [CrossRef]
  22. Ding, J.; Jiao, X.; Bai, P.; Hu, Y.; Zhang, J.; Li, J. Effect of vapor pressure deficit on the photosynthesis, growth, and nutrient absorption of tomato seedlings. Sci. Hortic. 2022, 293, 110736–110744. [Google Scholar] [CrossRef]
  23. Fang, Z.; Zhang, W.; Brandt, M.; Abdi, A.M.; Fensholt, R. Globally Increasing Atmospheric Aridity Over the 21st Century. Earth’s Future 2022, 10, e2022EF003019. [Google Scholar] [CrossRef]
  24. Yuan, W.; Zheng, Y.; Piao, S.; Ciais, P.; Lombardozzi, D.; Wang, Y.; Ryu, Y.; Chen, G.; Dong, W.; Hu, Z.; et al. Increased atmospheric vapor pressure deficit reduces global vegetation growth. Sci. Adv. 2019, 5, eaax1396. [Google Scholar] [CrossRef]
  25. Song, Y.; Jiao, W.; Wang, J.; Wang, L. Increased Global Vegetation Productivity Despite Rising Atmospheric Dryness Over the Last Two Decades. Earth’s Future 2022, 10, e2021EF002634. [Google Scholar] [CrossRef]
  26. Liu, L.; Gudmundsson, L.; Hauser, M.; Qin, D.; Li, S.; Seneviratne, S.I. Soil moisture dominates dryness stress on ecosystem production globally. Nat. Commun. 2020, 11, 4892. [Google Scholar] [CrossRef]
  27. Park Williams, A.; Allen, C.D.; Macalady, A.K.; Griffin, D.; Woodhouse, C.A.; Meko, D.M.; Swetnam, T.W.; Rauscher, S.A.; Seager, R.; Grissino-Mayer, H.D.; et al. Temperature as a potent driver of regional forest drought stress and tree mortality. Nat. Clim. Change 2013, 3, 292–297. [Google Scholar] [CrossRef]
  28. Will, R.E.; Wilson, S.M.; Zou, C.B.; Hennessey, T.C. Increased vapor pressure deficit due to higher temperature leads to greater transpiration and faster mortality during drought for tree seedlings common to the forest-grassland ecotone. New Phytol. 2013, 200, 366–374. [Google Scholar] [CrossRef] [PubMed]
  29. Meiyappan, P.; Jain, A.K.; House, J.I. Increased influence of nitrogen limitation on CO2 emissions from future land use and land use change. Glob. Biogeochem. Cycles 2015, 29, 1524–1548. [Google Scholar] [CrossRef]
  30. Sitch, S.; Smith, B.; Prentice, I.C.; Arneth, A.; Bondeau, A.; Cramer, W.; Kaplan, J.O.; Levis, S.; Lucht, W.; Sykes, M.T.; et al. Evaluation of ecosystem dynamics, plant geography and terrestrial carbon cycling in the LPJ dynamic global vegetation model. Glob. Change Biol. 2003, 9, 161–185. [Google Scholar] [CrossRef]
  31. Smith, B.; Wårlind, D.; Arneth, A.; Hickler, T.; Leadley, P.; Siltberg, J.; Zaehle, S. Implications of incorporating N cycling and N limitations on primary production in an individual-based dynamic vegetation model. Biogeosciences 2014, 11, 2027–2054. [Google Scholar] [CrossRef]
  32. Lienert, S.; Joos, F. A Bayesian ensemble data assimilation to constrain model parameters and land-use carbon emissions. Biogeosciences 2018, 15, 2909–2930. [Google Scholar] [CrossRef]
  33. Vuichard, N.; Messina, P.; Luyssaert, S.; Guenet, B.; Zaehle, S.; Ghattas, J.; Bastrikov, V.; Peylin, P. Accounting for carbon and nitrogen interactions in the global terrestrial ecosystem model ORCHIDEE (trunk version, rev 4999): Multi-scale evaluation of gross primary production. Geosci. Model Dev. 2019, 12, 4751–4779. [Google Scholar] [CrossRef]
  34. Kato, E.; Kinoshita, T.; Ito, A.; Kawamiya, M.; Yamagata, Y. Evaluation of spatially explicit emission scenario of land-use change and biomass burning using a process-based biogeochemical model. J. Land Use Sci. 2013, 8, 104–122. [Google Scholar] [CrossRef]
  35. Wagner, W.; Lemoine, G.; Rott, H. A Method for Estimating Soil Moisture from ERS Scatterometer and Soil Data. Remote Sens. Environ. 1999, 70, 191–207. [Google Scholar] [CrossRef]
  36. Jackson, R.; Jg, C.; Ehleringer, J.; Mooney, H.; Sala, O.; Schulze, E. A Global Analysis of Root Distributions for Terrestrial Biomes. Oecologia 1996, 108, 389–411. [Google Scholar] [CrossRef]
  37. Yang, Y.; Donohue, R.J.; McVicar, T.R. Global estimation of effective plant rooting depth: Implications for hydrological modeling. Water Resour. Res. 2016, 52, 8260–8276. [Google Scholar] [CrossRef]
  38. Muñoz-Sabater, J.; Dutra, E.; Agustí-Panareda, A.; Albergel, C.; Arduini, G.; Balsamo, G.; Boussetta, S.; Choulga, M.; Harrigan, S.; Hersbach, H.; et al. ERA5-Land: A state-of-the-art global reanalysis dataset for land applications. Earth Syst. Sci. Data 2021, 13, 4349–4383. [Google Scholar] [CrossRef]
  39. Li, M.; Wu, P.; Ma, Z. A comprehensive evaluation of soil moisture and soil temperature from third-generation atmospheric and land reanalysis data sets. Int. J. Climatol. 2020, 40, 5744–5766. [Google Scholar] [CrossRef]
  40. Li, M.; Wu, P.; Ma, Z.; Lv, M.; Yang, Q. Changes in Soil Moisture Persistence in China over the Past 40 Years under a Warming Climate. J. Clim. 2020, 33, 9531–9550. [Google Scholar] [CrossRef]
  41. Xu, L.; Chen, N.; Zhang, X.; Moradkhani, H.; Zhang, C.; Hu, C. In-situ and triple-collocation based evaluations of eight global root zone soil moisture products. Remote Sens. Environ. 2021, 254, 112248–112264. [Google Scholar] [CrossRef]
  42. Reichle, R.H.; Draper, C.S.; Liu, Q.; Girotto, M.; Mahanama, S.P.P.; Koster, R.D.; De Lannoy, G.J.M. Assessment of MERRA-2 Land Surface Hydrology Estimates. J. Clim. 2017, 30, 2937–2960. [Google Scholar] [CrossRef]
  43. Harris, I.; Osborn, T.J.; Jones, P.; Lister, D. Version 4 of the CRU TS monthly high-resolution gridded multivariate climate dataset. Sci. Data 2020, 7, 109. [Google Scholar] [CrossRef] [PubMed]
  44. Hijmans, R.J. Raster: Geographic Data Analysis and Modeling. 2020. Available online: http://CRAN.R-project.org/package=raster (accessed on 19 September 2025).
  45. Beck, H.E.; Zimmermann, N.E.; McVicar, T.R.; Vergopolan, N.; Berg, A.; Wood, E.F. Present and future Koppen-Geiger climate classification maps at 1-km resolution. Sci. Data 2018, 5, 180214. [Google Scholar] [CrossRef]
  46. Ahlstrom, A.; Raupach, M.R.; Schurgers, G.; Smith, B.; Arneth, A.; Jung, M.; Reichstein, M.; Canadell, J.G.; Friedlingstein, P.; Jain, A.K.; et al. The dominant role of semi-arid ecosystems in the trend and variability of the land CO(2) sink. Science 2015, 348, 895–899. [Google Scholar] [CrossRef]
  47. R Core Team. R: A Language and Environment for Statistical Computing; R Foundation for Statistical Computing: Vienna, Austria, 2018. [Google Scholar]
  48. Gui, Y.; Wang, K.; Jin, Z.; Wang, H.; Deng, H.; Li, X.; Tian, X.; Wang, T.; Chen, W.; Wang, T.; et al. The decline in tropical land carbon sink drives high atmospheric CO2 growth rate in 2023. Natl. Sci. Rev. 2024, 11, nwae365. [Google Scholar] [CrossRef]
  49. Wigneron, J.-P.; Fan, L.; Ciais, P.; Bastos, A.; Brandt, M.; Chave, J.; Saatchi, S.; Baccini, A.; Fensholt, R. Tropical forests did not recover from the strong 2015–2016 El Niño event. Sci. Adv. 2020, 6, eaay4603. [Google Scholar] [CrossRef]
  50. Li, J.; Bevacqua, E.; Wang, Z.; Sitch, S.; Arora, V.; Arneth, A.; Jain, A.K.; Goll, D.; Tian, H.; Zscheischler, J. Hydroclimatic extremes contribute to asymmetric trends in ecosystem productivity loss. Commun. Earth Environ. 2023, 4, 197–206. [Google Scholar] [CrossRef]
  51. Liu, J.; Bowman, K.W.; Schimel, D.S.; Parazoo, N.C.; Jiang, Z.; Lee, M.; Bloom, A.A.; Wunch, D.; Frankenberg, C.; Sun, Y.; et al. Contrasting carbon cycle responses of the tropical continents to the 2015-2016 El Nino. Science 2017, 358, eaam5690. [Google Scholar] [CrossRef]
  52. Tang, X.; Fan, S.; Du, M.; Zhang, W.; Gao, S.; Liu, S.; Chen, G.; Yu, Z.; Yang, W. Spatial and temporal patterns of global soil heterotrophic respiration in terrestrial ecosystems. Earth Syst. Sci. Data 2020, 12, 1037–1051. [Google Scholar] [CrossRef]
  53. Chen, C.; Park, T.; Wang, X.; Piao, S.; Xu, B.; Chaturvedi, R.K.; Fuchs, R.; Brovkin, V.; Ciais, P.; Fensholt, R.; et al. China and India lead in greening of the world through land-use management. Nat. Sustain. 2019, 2, 122–129. [Google Scholar] [CrossRef]
  54. Friedlingstein, P.; O’Sullivan, M.; Jones, M.W.; Andrew, R.M.; Gregor, L.; Hauck, J.; Le Quéré, C.; Luijkx, I.T.; Olsen, A.; Peters, G.P.; et al. Global Carbon Budget 2022. Earth Syst. Sci. Data 2022, 14, 4811–4900. [Google Scholar] [CrossRef]
  55. Chen, H.; Li, D.; Gurmesa, G.A.; Yu, G.; Li, L.; Zhang, W.; Fang, H.; Mo, J. Effects of nitrogen deposition on carbon cycle in terrestrial ecosystems of China: A meta-analysis. Environ. Pollut. 2015, 206, 352–360. [Google Scholar] [CrossRef] [PubMed]
  56. Xing, A.; Du, E.; Shen, H.; Xu, L.; de Vries, W.; Zhao, M.; Liu, X.; Fang, J. Nonlinear responses of ecosystem carbon fluxes to nitrogen deposition in an old-growth boreal forest. Ecol. Lett. 2022, 25, 77–88. [Google Scholar] [CrossRef]
  57. Zhou, S.; Zhang, Y.; Williams, A.P.; Gentine, P. Projected increases in intensity, frequency, and terrestrial carbon costs of compound drought and aridity events. Sci. Adv. 2019, 5, eaau5740. [Google Scholar] [CrossRef] [PubMed]
  58. Yan, X.; Li, J.; Smith, A.R.; Yang, D.; Ma, T.; Su, Y.; Shao, J. Evaluation of machine learning methods and multi-source remote sensing data combinations to construct forest above-ground biomass models. Int. J. Digit. Earth 2023, 16, 4471–4491. [Google Scholar] [CrossRef]
  59. Zhong, Z.; He, B.; Wang, Y.-P.; Chen, H.W.; Chen, D.; Fu, Y.H.; Chen, Y.; Guo, L.; Deng, Y.; Huang, L.; et al. Disentangling the effects of vapor pressure deficit on northern terrestrial vegetation productivity. Sci. Adv. 2023, 9, eadf3166. [Google Scholar] [CrossRef]
  60. Yuan, X.; Chen, X.; Ochege, F.U.; Hamdi, R.; Tabari, H.; Li, B.; He, B.; Zhang, C.; De Maeyer, P.; Luo, G. Weakening of global terrestrial carbon sequestration capacity under increasing intensity of warm extremes. Nat. Ecol. Evol. 2025, 9, 124–133. [Google Scholar] [CrossRef]
  61. Yang, H.; Ciais, P.; Wigneron, J.-P.; Chave, J.; Cartus, O.; Chen, X.; Fan, L.; Green, J.K.; Huang, Y.; Joetzjer, E.; et al. Climatic and biotic factors influencing regional declines and recovery of tropical forest biomass from the 2015/16 El Niño. Proc. Natl. Acad. Sci. USA 2022, 119, e2101388119. [Google Scholar] [CrossRef]
  62. Yan, H.; Wang, S.-Q.; Huete, A.; Shugart, H.H. Effects of Light Component and Water Stress on Photosynthesis of Amazon Rainforests During the 2015/2016 El Niño Drought. J. Geophys. Res. Biogeosciences 2019, 124, 1574–1590. [Google Scholar] [CrossRef]
  63. van Schaik, E.; Killaars, L.; Smith, N.E.; Koren, G.; van Beek, L.P.H.; Peters, W.; van der Laan-Luijkx, I.T. Changes in surface hydrology, soil moisture and gross primary production in the Amazon during the 2015/2016 El Nino. Philos. Trans. R. Soc. B Biol. Sci. 2018, 373, 20180084. [Google Scholar] [CrossRef]
  64. Koren, G.; van Schaik, E.; Araujo, A.C.; Boersma, K.F.; Gartner, A.; Killaars, L.; Kooreman, M.L.; Kruijt, B.; van der Laan-Luijkx, I.T.; von Randow, C.; et al. Widespread reduction in sun-induced fluorescence from the Amazon during the 2015/2016 El Nino. Philos. Trans. R. Soc. B Biol. Sci. 2018, 373, 20170408. [Google Scholar] [CrossRef] [PubMed]
  65. Yao, Y.; Ciais, P.; Viovy, N.; Li, W.; Cresto-Aleina, F.; Yang, H.; Joetzjer, E.; Bond-Lamberty, B. A Data-Driven Global Soil Heterotrophic Respiration Dataset and the Drivers of Its Inter-Annual Variability. Glob. Biogeochem. Cycles 2021, 35, e2020GB006918. [Google Scholar] [CrossRef]
  66. Feng, S.; Fu, Q. Expansion of global drylands under a warming climate. Atmos. Chem. Phys. 2013, 13, 10081–10094. [Google Scholar] [CrossRef]
  67. Dang, C.; Shao, Z.; Huang, X.; Qian, J.; Cheng, G.; Ding, Q.; Fan, Y. Assessment of the importance of increasing temperature and decreasing soil moisture on global ecosystem productivity using solar-induced chlorophyll fluorescence. Glob. Change Biol. 2021, 28, 2066–2080. [Google Scholar] [CrossRef]
  68. Kannenberg, S.A.; Anderegg, W.R.L.; Barnes, M.L.; Dannenberg, M.P.; Knapp, A.K. Dominant role of soil moisture in mediating carbon and water fluxes in dryland ecosystems. Nat. Geosci. 2024, 17, 38–43. [Google Scholar] [CrossRef]
  69. Song, J.; Zhou, S.; Yu, B.; Li, Y.; Liu, Y.; Yao, Y.; Wang, S.; Fu, B. Serious underestimation of reduced carbon uptake due to vegetation compound droughts. NPJ Clim. Atmos. Sci. 2024, 7, 23–33. [Google Scholar] [CrossRef]
  70. Song, L.; Guanter, L.; Guan, K.; You, L.; Huete, A.; Ju, W.; Zhang, Y. Satellite sun-induced chlorophyll fluorescence detects early response of winter wheat to heat stress in the Indian Indo-Gangetic Plains. Glob. Chang. Biol. 2018, 24, 4023–4037. [Google Scholar] [CrossRef]
  71. Xu, H.J.; Wang, X.P.; Zhao, C.Y.; Yang, X.M. Assessing the response of vegetation photosynthesis to meteorological drought across northern China. Land Degrad. Dev. 2020, 32, 20–34. [Google Scholar] [CrossRef]
  72. Martínez-Maldonado, F.E.; Castaño-Marín, A.M.; Góez-Vinasco, G.A.; Marin, F.R. Carbon and water vapor exchanges coupling for different irrigated and rainfed conditions on Andean potato agroecosystems. Theor. Appl. Climatol. 2024, 155, 7609–7628. [Google Scholar] [CrossRef]
  73. Novick, K.A.; Ficklin, D.L.; Stoy, P.C.; Williams, C.A.; Bohrer, G.; Oishi, A.C.; Papuga, S.A.; Blanken, P.D.; Noormets, A.; Sulman, B.N.; et al. The increasing importance of atmospheric demand for ecosystem water and carbon fluxes. Nat. Clim. Change 2016, 6, 1023–1027. [Google Scholar] [CrossRef]
Figure 1. The long term trend (a) and interannual variability (b) of NBP across the globe and ecosystems using the TRENDY multiple-ensemble mean. * presents statistically significant coefficients at p < 0.05.
Sustainability 17 09377 g001
Figure 2. Regional contributions to global land NBP IAV over 1981–2017 in the TRENDY model ensemble mean. (a) Spatial pattern of local contributions to global NBP IAV. (b) Relative contributions of the different ecosystems to global NBP IAV.
Sustainability 17 09377 g002
Figure 3. Relative contributions of anomalies in (a) GPP and (b) TER to the global NBP IAV in the TRENDY model ensemble mean.
Sustainability 17 09377 g003
Figure 4. Spatial patterns of partial correlations between detrended NBP and (a) detrended RZSM, (b) detrended temperature, and (c) detrended VPD, respectively. The insets show the fractions of insignificant negative correlations (Neg, p > 0.05), significant negative correlations (Neg*, p < 0.05), non-significant positive correlations (Pos, p > 0.05), non-significant positive correlations (Pos*, p < 0.05), respectively.
Sustainability 17 09377 g004
Figure 5. Environmental controls on NBP IAV across the globe and different ecosystems using the TRENDY ensemble mean. Correlation coefficients between NBP IAV and NBP anomalies driven by a given factor are labeled in each panel. Asterisks present the significance of the correlation coefficient (*: p < 0.05; **: p < 0.01; ***: p < 0.001).
Sustainability 17 09377 g005
Table 1. Overview of the TRENDY v9 DGVM output provided and used in this study, including their spatial and temporal resolutions as well as relevant processes.
ModelSpatial
Resolution
Temporal
Resolution
C-NFire Simulation
and/or Suppression
Climate and
Variability
CO2
Fertilization
Reference
ISAM0.5° × 0.5°MonthlyYesNoYesYes[29]
LPJ0.5° × 0.5°MonthlyNoYesYesYes[30]
LPJ-GUESS0.5° × 0.5°YearlyYesYesYesYes[31]
LPX-Bern0.5° × 0.5°MonthlyYesYesYesYes[32]
ORCHIDEEv30.5° × 0.5°MonthlyYesNoYesYes[33]
VISIT0.5° × 0.5°MonthlyNoNoYesYes[34]
Disclaimer/Publisher’s Note: The statements, opinions and data contained in all publications are solely those of the individual author(s) and contributor(s) and not of MDPI and/or the editor(s). MDPI and/or the editor(s) disclaim responsibility for any injury to people or property resulting from any ideas, methods, instructions or products referred to in the content.

