Article

Deposit–Refund System as a Strategy to Drive Sustainable Energy Transition on the Example of Poland

Faculty of Security, Logistics and Management, Military University of Technology, 00-908 Warsaw, Poland
*
Author to whom correspondence should be addressed.
Sustainability 2025, 17(3), 1030; https://doi.org/10.3390/su17031030
Submission received: 19 December 2024 / Revised: 9 January 2025 / Accepted: 24 January 2025 / Published: 27 January 2025

Abstract

:
This article discusses key aspects of deposit–refund system design in Poland, highlighting the importance of energy-sustainable collection logistics. The main role in this system is played by the operator responsible for collecting and transporting packaging to metering centers and recycling plants. The research focused on the optimal placement of logistics facilities to minimize energy expenditures, using the balanced center of gravity method. It took into account the distribution of collection points and the intensity of material flows to develop an efficient and environmentally friendly reverse logistics model. The most important results of the research are the development of a model for the layout of logistics facilities that minimizes energy consumption, the identification of key factors such as the location of collection points and material flows, the development of a methodology for green logistics, and practical recommendations for system designers. The proposed solutions, although innovative in Poland, are universal in nature and can be applied in other countries. The article makes an important contribution to the development of sustainable bail logistics and promotes a balanced energy transition.

1. Introduction

In the context of sustainable development, it is critical that countries introduce energy-balanced initiatives [1,2,3]. This means that projects and solutions implemented at the local, regional or national level should be designed so that their implementation does not generate additional energy inputs that could increase emissions or burden energy systems [4]. It is crucial that the development of infrastructure and the implementation of new technologies take place in a way that minimizes the negative impact on the environment and contributes to actual improvements, rather than being the invention of pseudo-environmentalists [5,6]. In doing so, it is important to see the problem as a whole. Creating energy-balanced initiatives requires meticulous analysis of their effectiveness and potential consequences [7]. Such projects should be evaluated in terms of their entire life cycle, allowing not only a comprehensive assessment, but also identifying areas that threaten the sustainability of a given project as a whole and minimizing energy losses overall [8,9]. A particularly important area where energy-balanced initiatives play a key role is waste management [10,11]. Waste is one of the biggest challenges of modern societies, both environmentally and energetically. Implementing solutions for waste reduction, recycling, and energy recovery is not only good for the environment, but also helps manage energy resources efficiently. Therefore, technologies are being developed to transform waste, allowing energy recovery in the form of heat or electricity. This has the added benefit of reducing the load on traditional energy systems. Thus, this is an all-around beneficial approach, but it requires proper integration of many elements of the system in terms of production, infrastructure, or technology, but also a strategic approach to resource management and development planning [12,13]. Nevertheless, the element and promotion of responsible consumer habits is also important, thus ensuring sustainable and widely accepted procedures. Education and transparent communication of the benefits of environmental technologies can increase support for their creation and expansion, which is why environmental awareness programs that promote segregation and reduction of waste generation are extremely important, and although they will not be the subject of this analysis, it is necessary to mention their important function.
From the article’s point of view, a key challenge in this context is to ensure synergy between regulations, technologies, and existing infrastructure so that the waste management process is energy efficient and cost effective. This requires precise logistical planning, which includes the transportation of waste, its proper segregation, and the construction of proper schedules respecting the principles of a circular economy [14,15,16].
In this article, such a comprehensive analysis will be presented using the example of the deposit–refund system, which is currently one of the challenges facing Poland’s energy economy in the context of waste management. The introduction of an effective deposit–refund system is undoubtedly an opportunity to increase recycling rates and thus reduce the amount of waste going to landfills. This mechanism, based on encouraging consumers to return packaging such as plastic bottles, glass bottles, and cans, has the potential not only to reduce negative environmental impacts, but also to promote a circular economy through the reuse of raw materials. One of the challenges in implementing a deposit–refund system is creating an infrastructure to efficiently receive and process returned packaging. This requires investment in appropriate collection machines, sorting plants, and processing facilities capable of efficiently recovering recyclables. At the same time, it is necessary to ensure the consistency of the system nationwide, so that consumers can easily access return points regardless of where they live, and so that the process is uniform and transparent.
It is also extremely important to secure the logistics of this system and create solutions for receiving deposited waste in an energy-balanced manner. According to the system planned in Poland—discussed in detail later in this article—a key role in this regard will be that of the deposit–refund system operator, who will be responsible, among other things, for collecting packaging and packaging waste, and transporting it to metering centers and then to recovery and recycling facilities. Thus, it will be the entity responsible for the overall operation of the system. Therefore, already at the stage preceding the implementation of the provisions of the law implementing the new solutions in Poland, it is worth analyzing and evaluating the concept of a deposit–refund system in Poland from the perspective of a selected company, aspiring to the role of such an operator. The main research problem posed in this study is therefore the question of how to deploy logistics facilities to optimize logistics processes in the newly created deposit–refund system in Poland in order to minimize energy expenditures for such a solution.
The main research hypothesis of the study is the assumption that it is possible to optimize the deposit–refund system already at the stage of its creation, through the use of appropriate methods for optimizing logistics processes that take into account the distribution of main facilities in the network.
The following specific hypotheses were also formulated:
  • The application of the balanced center of gravity method (using rectangular, Euclidean and network metrics) enables the development of an effective reverse logistics model.
  • Optimal placement of logistics centers in the deposit–refund system can reduce energy expenditures and transportation costs.
  • A deposit–refund logistics model elaborated for Poland can be successfully adapted to other countries with a similar level of economic development.
To verify the above assumptions, the balanced center of gravity method was used. This allowed the determination of optimal locations for logistics facilities that minimize the total energy expenditure associated with transporting and operating the deposit–refund system.
Thanks to the balanced center of gravity method used, it was possible to take into account both the geographic distribution of packaging collection points and the intensity of material flows, which contributed to the development of an efficient and environmentally friendly reverse logistics model. The following should be mentioned as the main scientific contributions resulting from the aforementioned research:
  • Development and presentation of a model for the distribution of logistics facilities for the newly created deposit–refund system in Poland, developed using the balanced center of gravity method, taking into account the minimization of energy inputs.
  • Identification of key factors affecting the energy efficiency of the deposit–refund system, such as the geographic distribution of collection points and the intensity of material flows.
  • Development of optimization methodologies in the context of green logistics with an emphasis on sustainability and environmental concerns.
  • Proposing practical recommendations for decision-makers and designers of the deposit–refund system in Poland, allowing the effective planning of infrastructure and logistics operations.
It is worth noting that the considerations presented in the article are novel on a national scale. They concern a country where the deposit–refund system has not been used before. Nevertheless, the proposed solutions are universal and can be used in any location. Moreover, the importance of the subject matter taken up has already been emphasized in [11], where the authors discussed the assumptions of the implementation of the deposit–refund system in Poland, the barriers and inaccuracies in the process of its implementation, as well as the benefits for Poland that may result from its introduction. This has prepared a backgrounder for the research presented in this article (in the Energies journal).
Creating energy-balanced initiatives is a major challenge that contributes to reducing environmental burdens, supports the Sustainable Development Goals, and gives countries the tools to effectively address negative impacts on climate change. These topics in this article are included in several sections. After an introduction to the subject matter of the study, a literature review was conducted on issues related to the idea of a deposit–refund system, the benefits and challenges of its implementation, as well as methods for optimizing logistics processes, with a particular focus on solutions that support the minimization of costs and energy inputs. Reference was also made briefly to deposit–refund systems operating in other countries. The assumptions of the study and the theoretical basis of the mathematical method used are then presented. The subsequent section delineates the optimal locations for metering centers and discusses key findings and recommendations from the study.

2. Literature Review and Key Concepts

Efficient waste-to-energy conversion is a multidimensional process that requires the interaction of technology, infrastructure, and people [1,17]. Only an integrated approach that encompasses all of these elements will allow this technology to realize its full potential, yielding long-term environmental, social, and economic benefits, which is a major challenge. In the course of analyzing the world literature, it can be assumed that the introduction of the deposit–refund system in Poland will result in a change in the morphology of recyclables [11,18,19]. To a large extent, waste that is segregated in households and then disposed of in individual waste garbage cans will change its destination. Most cans of up to one liter and PET bottles of up to three liters will be returned to bottle machines or in stores, in special collection bags [20,21,22]. Subsequently, this will result in the sorting plants for recyclables that are operating so far having to be upgraded for residual waste from the collection of recyclables, taking into account waste collected under the deposit–refund system. The frequency of waste collection will also change. Currently, the vast majority of the public—despite their knowledge that individual packages (for example, glass) are subject to a deposit charge—do not return these packages to stores and do not collect any deposits. There will also be a noticeable decrease in the amount of garbage in public spaces not dumped in city waste garbage cans or recycling garbage cans. It is also likely that the operation of the deposit–refund system will have a positive effect in public places, especially those serving recreation, such as parks, squares, and outdoor gyms, and waste in the form of glass, plastic bottles, and beverage cans will also disappear. The introduction of a deposit–refund system is also an additional source of income for waste collectors, which will have a positive effect, since the waste will eventually be recycled.
The basis for the introduction and operation of the deposit–refund system in Poland is the Law of 13 July 2023, amending the Law on Packaging and Packaging Waste Management and other laws, known as the Deposit Law [23]. The need for improvements in this area stems from regulations in EU legislation, specifically the SUP (Single-Use Plastic) Directive [24], which aims to reduce the harmful effects of plastic products on the environment. The effective date of the deposit–refund system in Poland will be October 2025. Its scope will include both disposable and reusable beverage packaging. The need for a deposit–refund system is mainly due to the following [25,26]:
  • achieving the required level of recycling of packaging waste;
  • achieving the required level of separate collection of packaging and packaging waste;
  • achieving the required levels of recycled plastic share by weight in single-use bottles of up to three liters:
    -
    from 2025—25% recycled plastic for PET bottles,
    -
    from 2030—30% of recycled plastics;
  • reducing the number of caps as separate waste:
    -
    obligation to permanently fix plastic caps and lids with a capacity of up to three liters;
  • reducing the problem of public space pollution.
Table 1 shows the minimum levels of separate collection of packaging and packaging waste.
The effectiveness of the changes brought by the deposit–refund system has already been observed in other countries. A special reference for Poland is other European countries, due to their comparable culture of waste segregation. Currently, about 138 million people in Europe use the deposit–refund system [11]. Increasing awareness of environmental protection using the deposit–refund system is being implemented in fifteen European countries, achieving packaging collections of more than 90% [28]. Examples of European countries where a deposit–refund system has been introduced are Sweden (1984), Iceland (1989), Finland (1996), Norway (1999), Denmark (2002), Germany (2003), Estonia (2005), Netherlands (2005), Croatia (2006), Lithuania (2016), Latvia (2022), Slovakia (2022), Malta (2023), Romania (2023), and Hungary (2024) [29]. The deposit–refund system is an integral part of sustainable development policy, and its implementation, as the experience of many countries has shown, contributes directly to increasing the efficiency of the recovery of recyclables [30]. Other countries considering introducing a deposit–refund system include Austria, Belgium, Spain, and Portugal. All deposit–refund systems in Europe aim to increase recycling rates and reduce packaging waste, especially plastic, glass, and metal, and this is a common element stemming from European environmental directives [31,32]. The system is based on an additional fee that the consumer pays when purchasing a product in a package covered by the system. When an empty package is returned to a designated point (e.g., a vending machine or a store), the deposit is refunded to the consumer. In most countries, the system covers beverage packaging, such as PET bottles, aluminum cans, and glass bottles [33,34]. Some countries also include other types of packaging, but EU requirements include these three types as standard. The system runs based on a return infrastructure. Particularly preferred is the use of deposit vending machines, which allow the quick and automatic return of packages and their sorting [30]. Such points can be located in a variety of common locations like stores, gas stations, shopping malls, etc. Some systems use advanced barcode and material recognition, while others rely on simpler methods. The amount of packaging fees (deposits) is also a country-specific issue, which is undoubtedly a factor in the rate of returns. Determining the amount of such a fee is an interesting issue—a higher fee more significantly motivates towards returning packaging, but can be a burden on consumers and discourage purchases. In some countries, systems include only plastic and metal (e.g., Finland), while others add glass packaging (e.g., Germany, Norway) [35].
Some key aspects of successful implementation of a deposit–refund system to generate high rates of return are the availability and universality of the infrastructure, as well as the readiness and reliability of its components [36,37]. But this requires a balanced approach that takes into account both consumer convenience and economic and environmental efficiency. On the one hand, a large number of return points, such as deposit vending machines, significantly facilitate the return of packages and increase consumer participation in the system. On the other hand, each additional point generates operational costs for its maintenance, technical service, and collection of packaging by professional processing companies.
In regions with widely dispersed populations, such as rural areas, the cost of transporting packaging from return points to recycling centers can be high, both financially and in terms of harmful emissions. In extreme cases, this can lead to a situation where the environmental and economic benefits of the deposit–refund system are partially neutralized by the increased emissions associated with transportation. Therefore, it is crucial to design the turnaround infrastructure intelligently. It is possible, for example, to integrate return points with already existing logistics networks or use distribution centers. In smaller towns, mobile collection points can be organized that periodically reach more remote locations, or deposit–refund systems integrated with local forms of waste collection. Technologies such as barcode-based or material-based package recognition can allow simplification of logistics and reduction of operating costs. It is also important to take into account the differences in population density and trade patterns—while vending machines in cities can be distributed densely, central collection points may be a better option in rural areas.
In large metropolitan areas, a key challenge is to optimally plan both the depositing infrastructure and the logistics of receiving and transporting packaging to processing centers. Population density and traffic intensity in cities require a precisely planned system that minimizes operating costs and reduces transportation emissions while maximizing consumer convenience. The placement of deposit vending machines should take into account key high-traffic points, such as supermarkets, shopping malls, and gas stations, as well as locations near transportation hubs. Introducing more and smaller return points can further increase the system’s accessibility for residents, especially in densely built-up areas. Vending machines must be emptied regularly, requiring a smoothly functioning collection scheme that minimizes disruption to city traffic and vehicle downtime. Equally important is the scheduling of deliveries to processing centers, which avoids overloading the infrastructure and excessive storage of waste in a single place [38]. Properly planned infrastructure architecture and optimization of logistics processes are the foundation for the success of such programs [38]. The Law on Packaging and Packaging Waste Management, dated 13 July 2023, distinguishes the following entities participating in the deposit–refund system:
  • Entities introducing packaged beverages.
  • Entities directly introducing packaged beverages.
  • Retail outlets, wholesalers, and other collection points.
  • Store customers.
  • Deposit–refund system operator.
Particularly important in this regard are the locations of operator-owned metering centers, a key component of the system due to the fact that material collected from stores and prepared for recycling is stored there.
The issue of the optimization of logistics facilities has been studied extensively in the literature, as effective management of such facilities is crucial to improving efficiency and reducing costs in supply chains [14,39,40,41]. Authors undertaking research in this area use a variety of optimization methods. Basically, they can be divided into several main categories. The first are classical methods such as linear programming, nonlinear programming, or dynamic programming, which involve modeling and solving optimization problems such as resource allocation, optimal routing, or inventory management [42,43]. For more complex problems, genetic algorithms, ant algorithms, simulated annealing, or particle swarm optimization are used, which work especially well for discrete optimization and large-scale problems [44,45,46]. Modeling the behavior of logistics systems and testing different scenarios, on the other hand, is made possible by simulation methods, which often allows better decisions to be made at both the strategic and lower levels [47,48,49,50]. For large data sets and numerous variables, artificial intelligence and machine learning methods [51,52,53] are proving to be an effective solution. Their ability to quickly process information and detect patterns supports accurate real-time decision-making [54,55]. In the presented study, the optimization method used to determine the best location of a logistics facility (in this case, a metering center) is the balanced center of gravity method. It is used to determine the strategic location of a single logistics facility and works especially well when a company is building a logistics network and needs to decide where to locate production facilities, warehouses, or stores. Research on the optimization of logistics facilities is constantly evolving as a result of rapidly changing market, technological, and environmental requirements, so researchers in this field are making important contributions to improving the operation of modern logistics systems, which this article is also a part of.

3. Materials and Methods

This article undertakes the development of a model for the deployment of logistics facilities for the newly created deposit–refund system in Poland, proposing an effective solution that takes into account the minimization of energy expenditures. The structure of retail in Poland was analyzed, taking into account the number of branches of each retail chain, their market share, and available logistics facilities (number and distribution centers) [56]. On this basis, the logistics facilities of the largest retail chains in Poland, i.e., Biedronka, Eurocash, Lidl, Netto, and Żabka [57] stores, were selected for further study. An analysis of the location of the facilities of the deposit–refund system operator, who will be responsible for collecting waste, transporting it to the metering centers, and further to the sorting plant, was also carried out (Figure 1).
Based on this, three main areas have been selected for consideration for the construction of the deposit–refund system operator’s metering centers, i.e., around the following cities: Szczecin, Warsaw, Lodz, Gliwice, Poznan, and Gdynia (Figure 2).
For three of the selected areas, we proceeded to determine the optimal location of the metering centers, using the “center of gravity” balanced heuristic method. It involves minimizing the sum of the distances between the location under study and the objects associated with it [58]. The classic version deals with linear distances derived from geographic location, not real distance traveled. Hence the need for the additional use of a specific metric: rectangular or Euclidean, allowing for the approximation of the studied empirical values to the theoretical ones. The purpose of the method is to determine the location of the logistics facility for which the global sum of transportation costs in the logistics network will assume the minimum value, as well as the minimum level of energy expenditures incurred.
The following assumptions and variables can be made in the mathematical model:
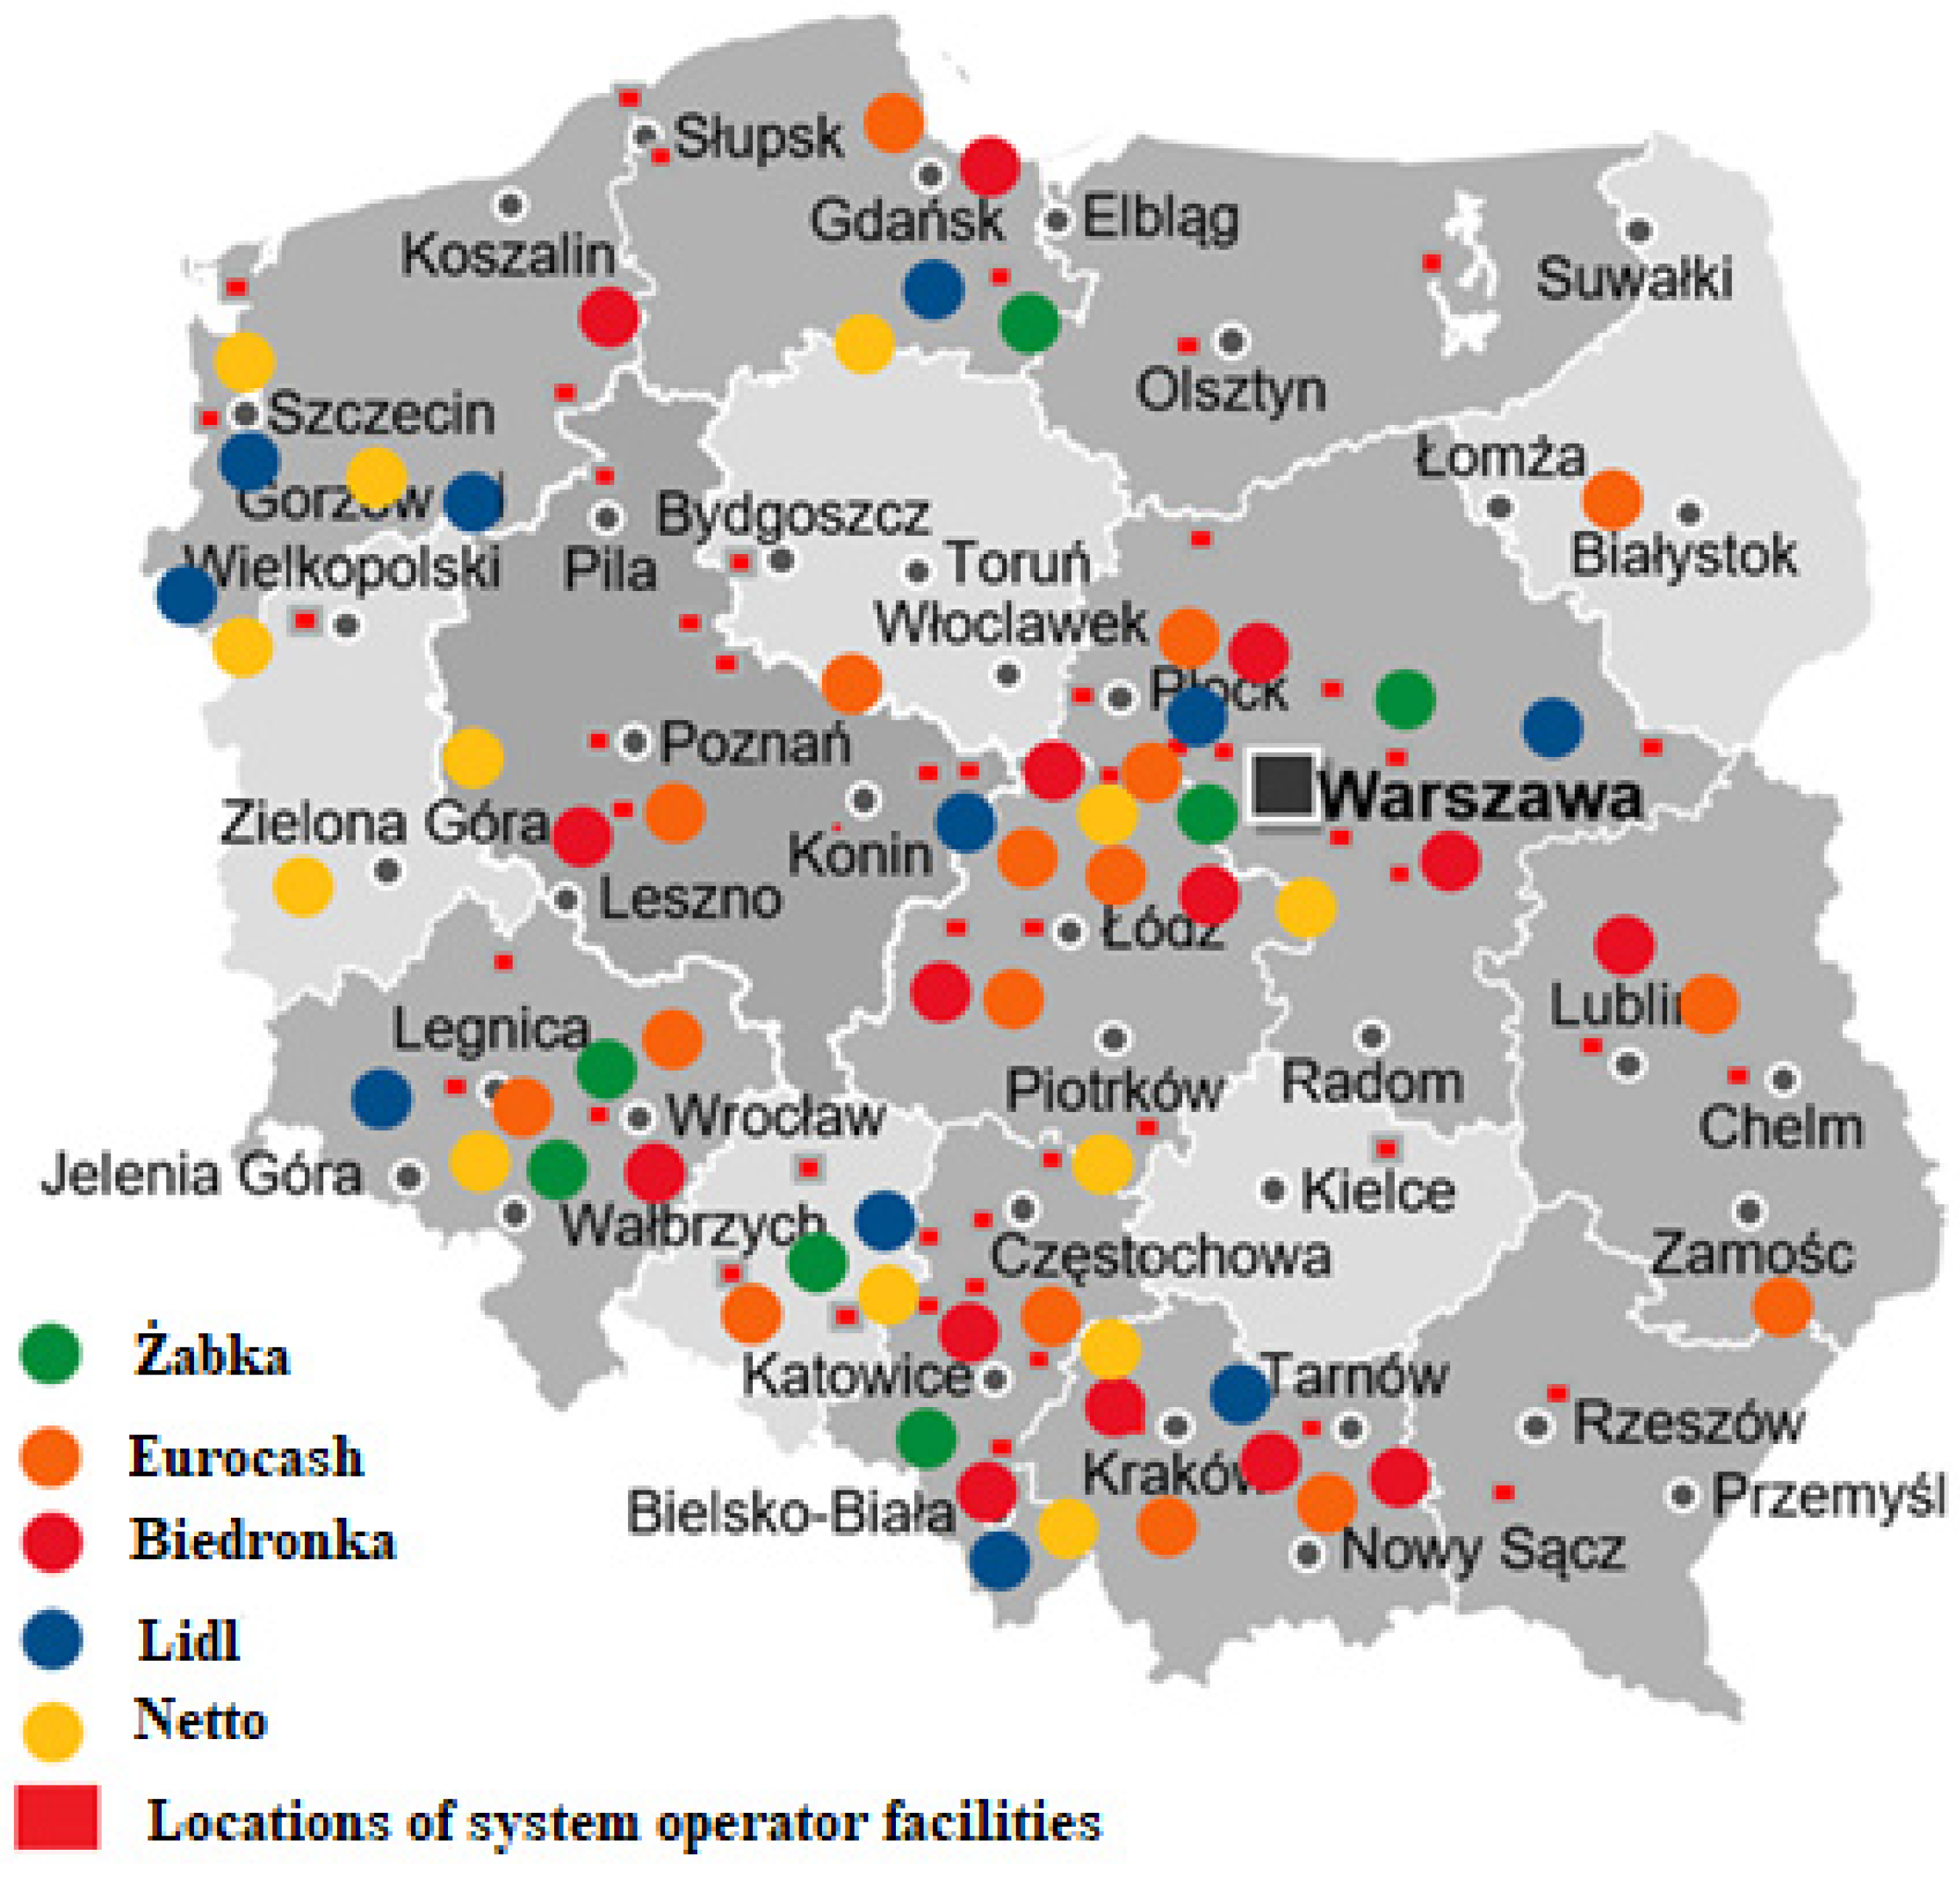
  • Locations of waste supplier distribution centers: A   i ( x i A ,   y i A ) and forecast delivery volumes to the planned metering center a i ,   i = 1 ,   ,   m .
  • Location of the deposit–refund system operator’s sorting facility: B j ( x j B ,   y j B ) and forecast capacity of facilities b j ,   j = 1 ,   ,   n .
  • Unit, calculated cost of carriage. The rate for routes from the i-th delivery points to the warehouse is denoted by k A , while the rate for routes from the warehouse to the j-th sales points is denoted by k B (e.g., for transporting 1 ton per 1 km).
  • Volume of waste stream size v i .
In the first step, the balanced center of gravity method calculated the initial values of location coordinates according to the following relationships:
x 0 = i = 1 m a i k i A x i A + j = 1 n b j k j B x j B i = 1 m a i k i A + j = 1 n b j k j B
y 0 = i = 1 m a i k i A y i A + j = 1 n b j k j B y j B i = 1 m a i k i A + j = 1 n b j k j B
where:
x 0 , y 0 —coordinate position of the metering center M;
a i , b j —transport volume from suppliers to M and from M to recipients;
k i A , k j B —unit cost of transportation from suppliers to M and from M to recipients;
x i A , y i A —coordinates of supplier locations;
x j B , y j B —coordinates of the location of the recipients.
On the other hand, rectangular, Euclidean, and network (which reflects transport routes and considers real transport infrastructures) were used to further analyze location selection and calculate distances in the transportation network, according to the following relationships.
  • The distance in the rectangular metric was calculated using the following formula:
    d i j P = x i x j + y i y j
  • The distance in the Euclidean metric was calculated from the following formula:
    d i j E = x i x j 2 + y i y j 2
  • The distance in the network metric was calculated based on the length of the road between facilities (according to the actual shape of the transportation infrastructure) l i j .
Location data of distribution centers, selected retail chains, and waste sorting plants of the deposit–refund system operator were used to calculate weighted coordinates.

4. Results

4.1. Waste Value Stream Assumptions in the Logistics Network
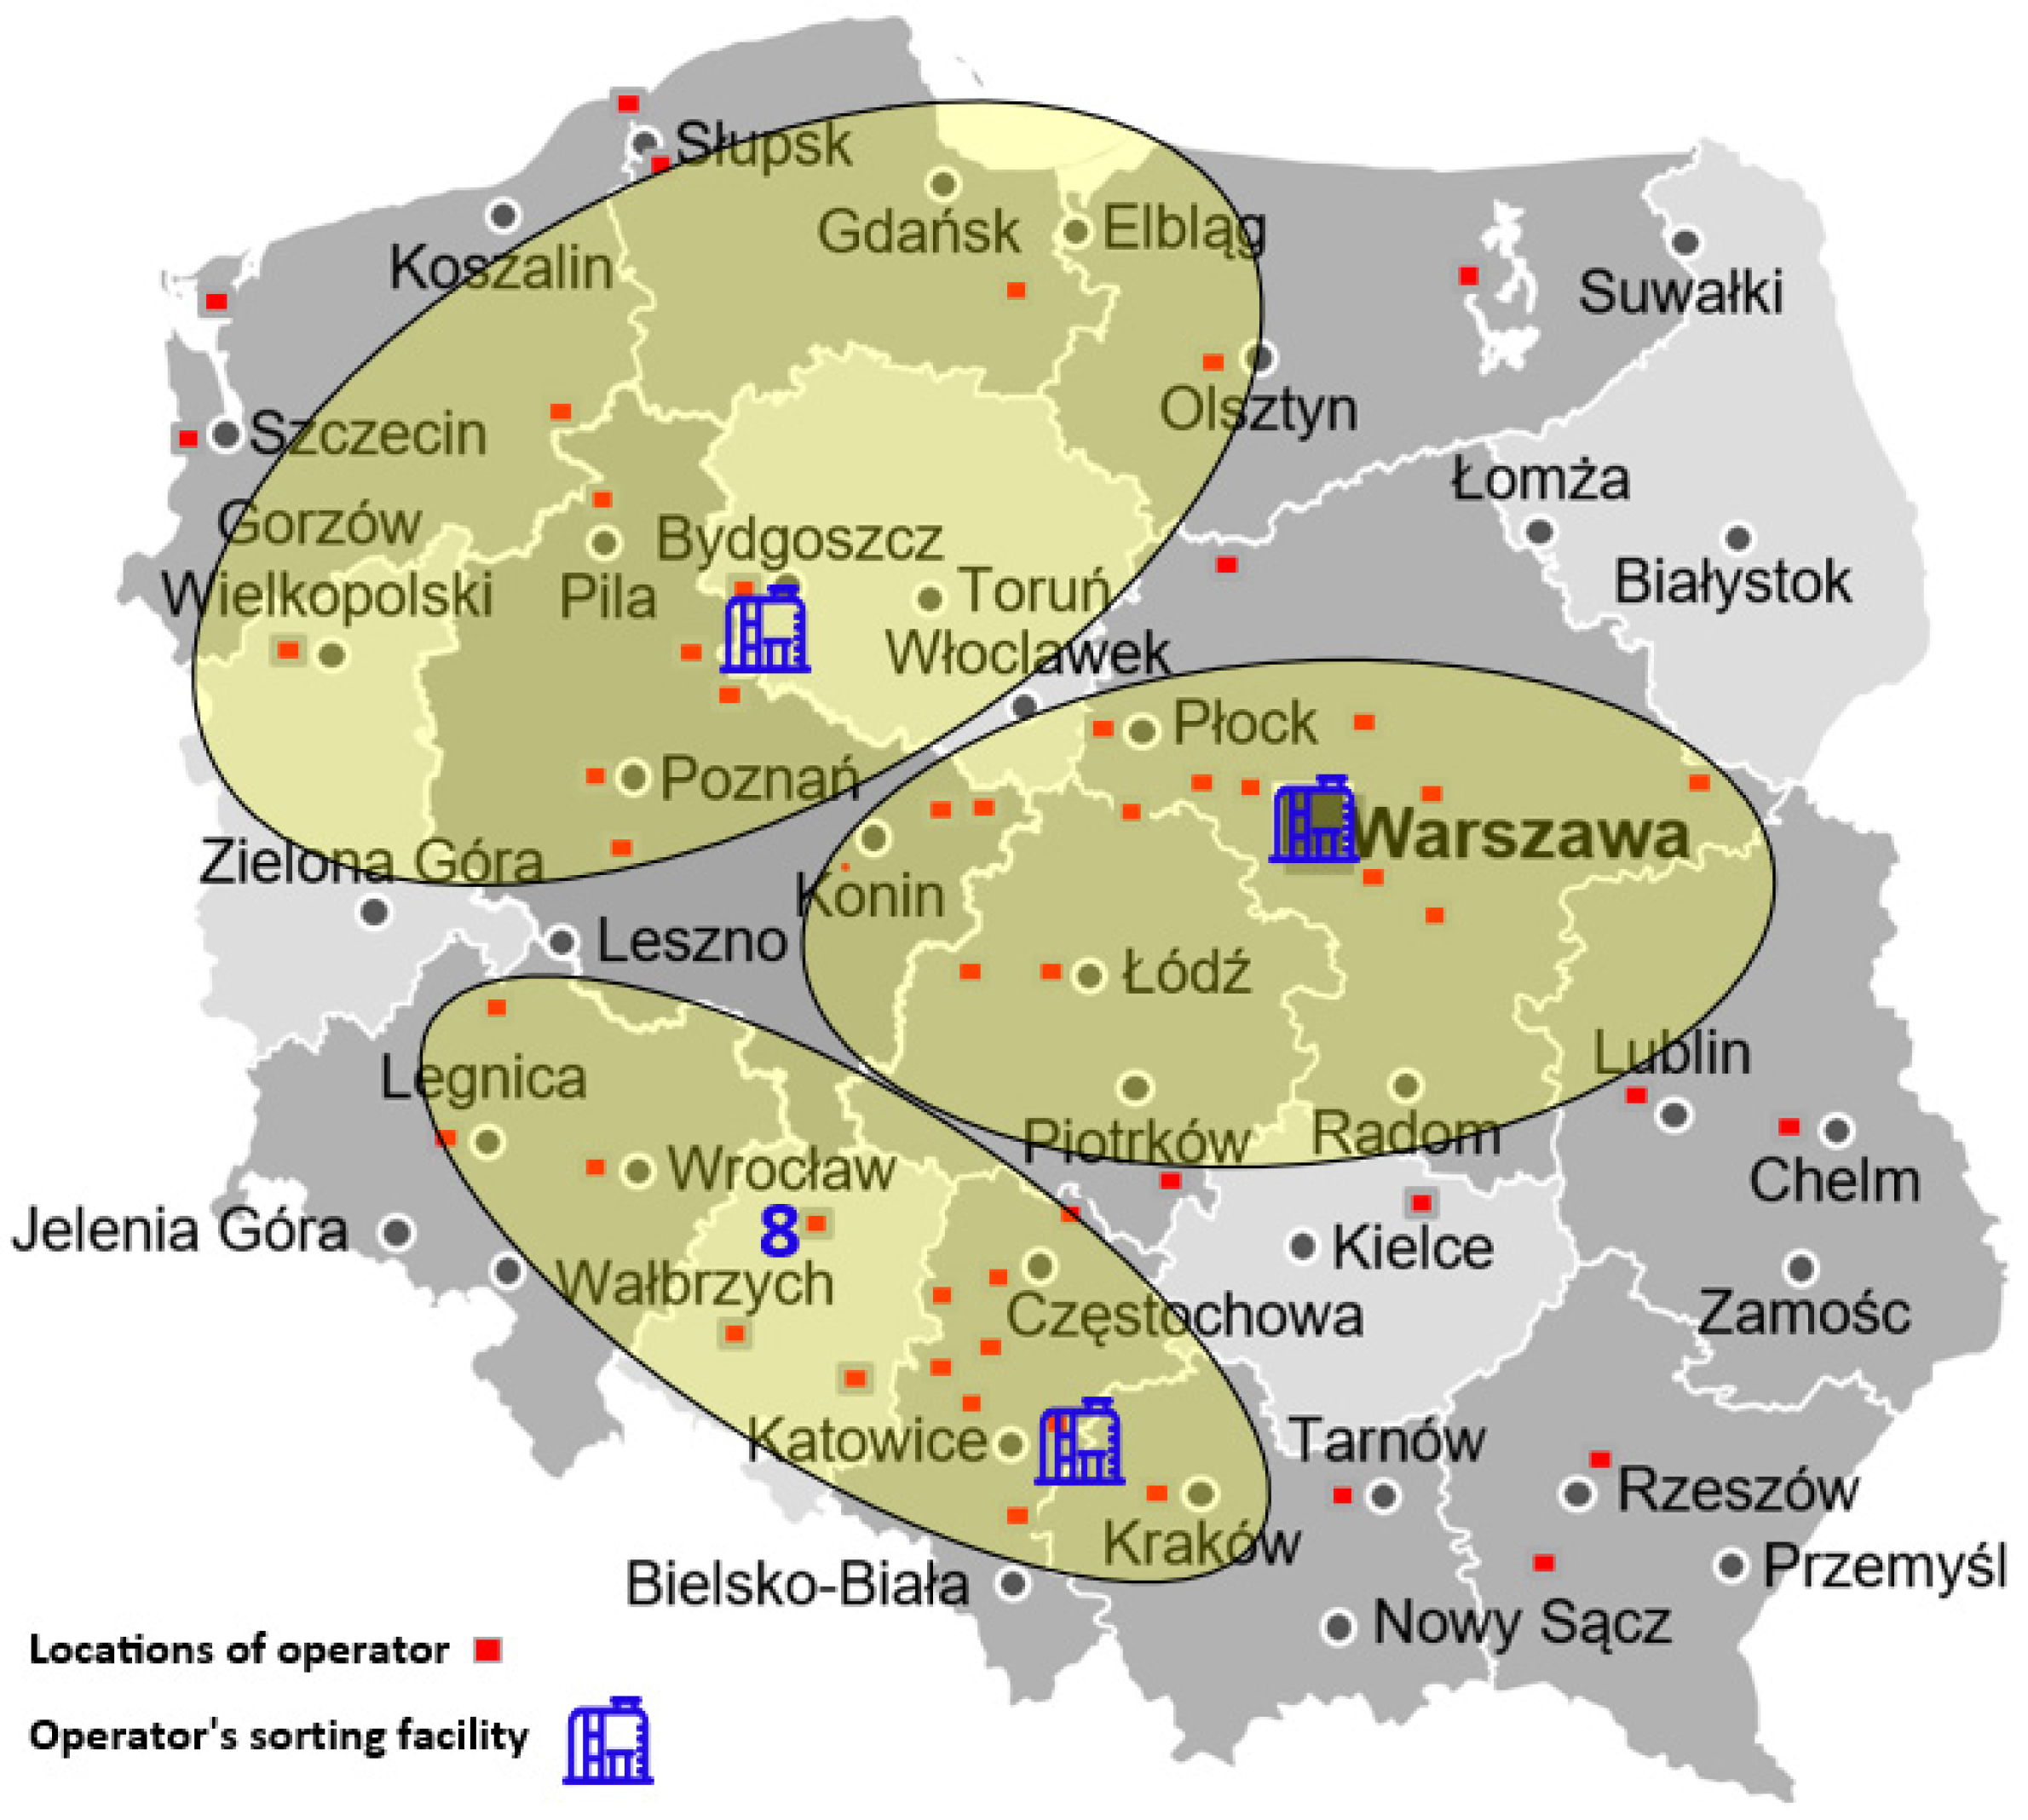
In order to determine the location of the metering centers, calculations were made for the construction of three such facilities for central Poland, southwestern Poland and northwestern Poland, respectively. The location and number of distribution centers in the network, transportation costs (including energy inputs), and the location of end users, i.e., sorting/recycling plants, were identified as decision criteria.
It was assumed that as part of the transportation of supplies from distribution centers to stores, on the return trip of the means of transport, the transportation of waste packaging from manual collection will be carried out in the form prepared for transport, that is, in the form of sealed bags, secured by a seal with a barcode to be read at the metering center. It was assumed that at least one shipment per day (about 22 deliveries per month) would be made from each warehouse. Based on historical data, it was assumed that a single pickup transports approx. 35,000 packages of various types, with an average weight of 1 ton. This made it possible to calculate the volume of the waste value stream in the network, as presented in Table 2.
Based on the data in Table 2, using the balanced center of gravity method, the preliminary locations of the metering centers in the three selected zones (for which both global costs in the network and energy inputs are minimal) were determined and further analyzed in the paper. The results obtained allow minimizing costs based solely on geographic location, thus, in the following section two metrics are used: Euclidean and rectangular metrics, in order to obtain results close to the real state. Based on Formulas (1) and (2), the following locations were obtained.
  • For central Poland ( x C ,   y c ) :
    x C g = 20.60
    y C g = 52.16
  • For southwestern Poland ( x S ,   y S ) :
    x S g = 18.42
    y S g = 50.51
  • For northwestern Poland ( x N ,   y N ) :
    x N g = 17.46
    y N g = 53.20

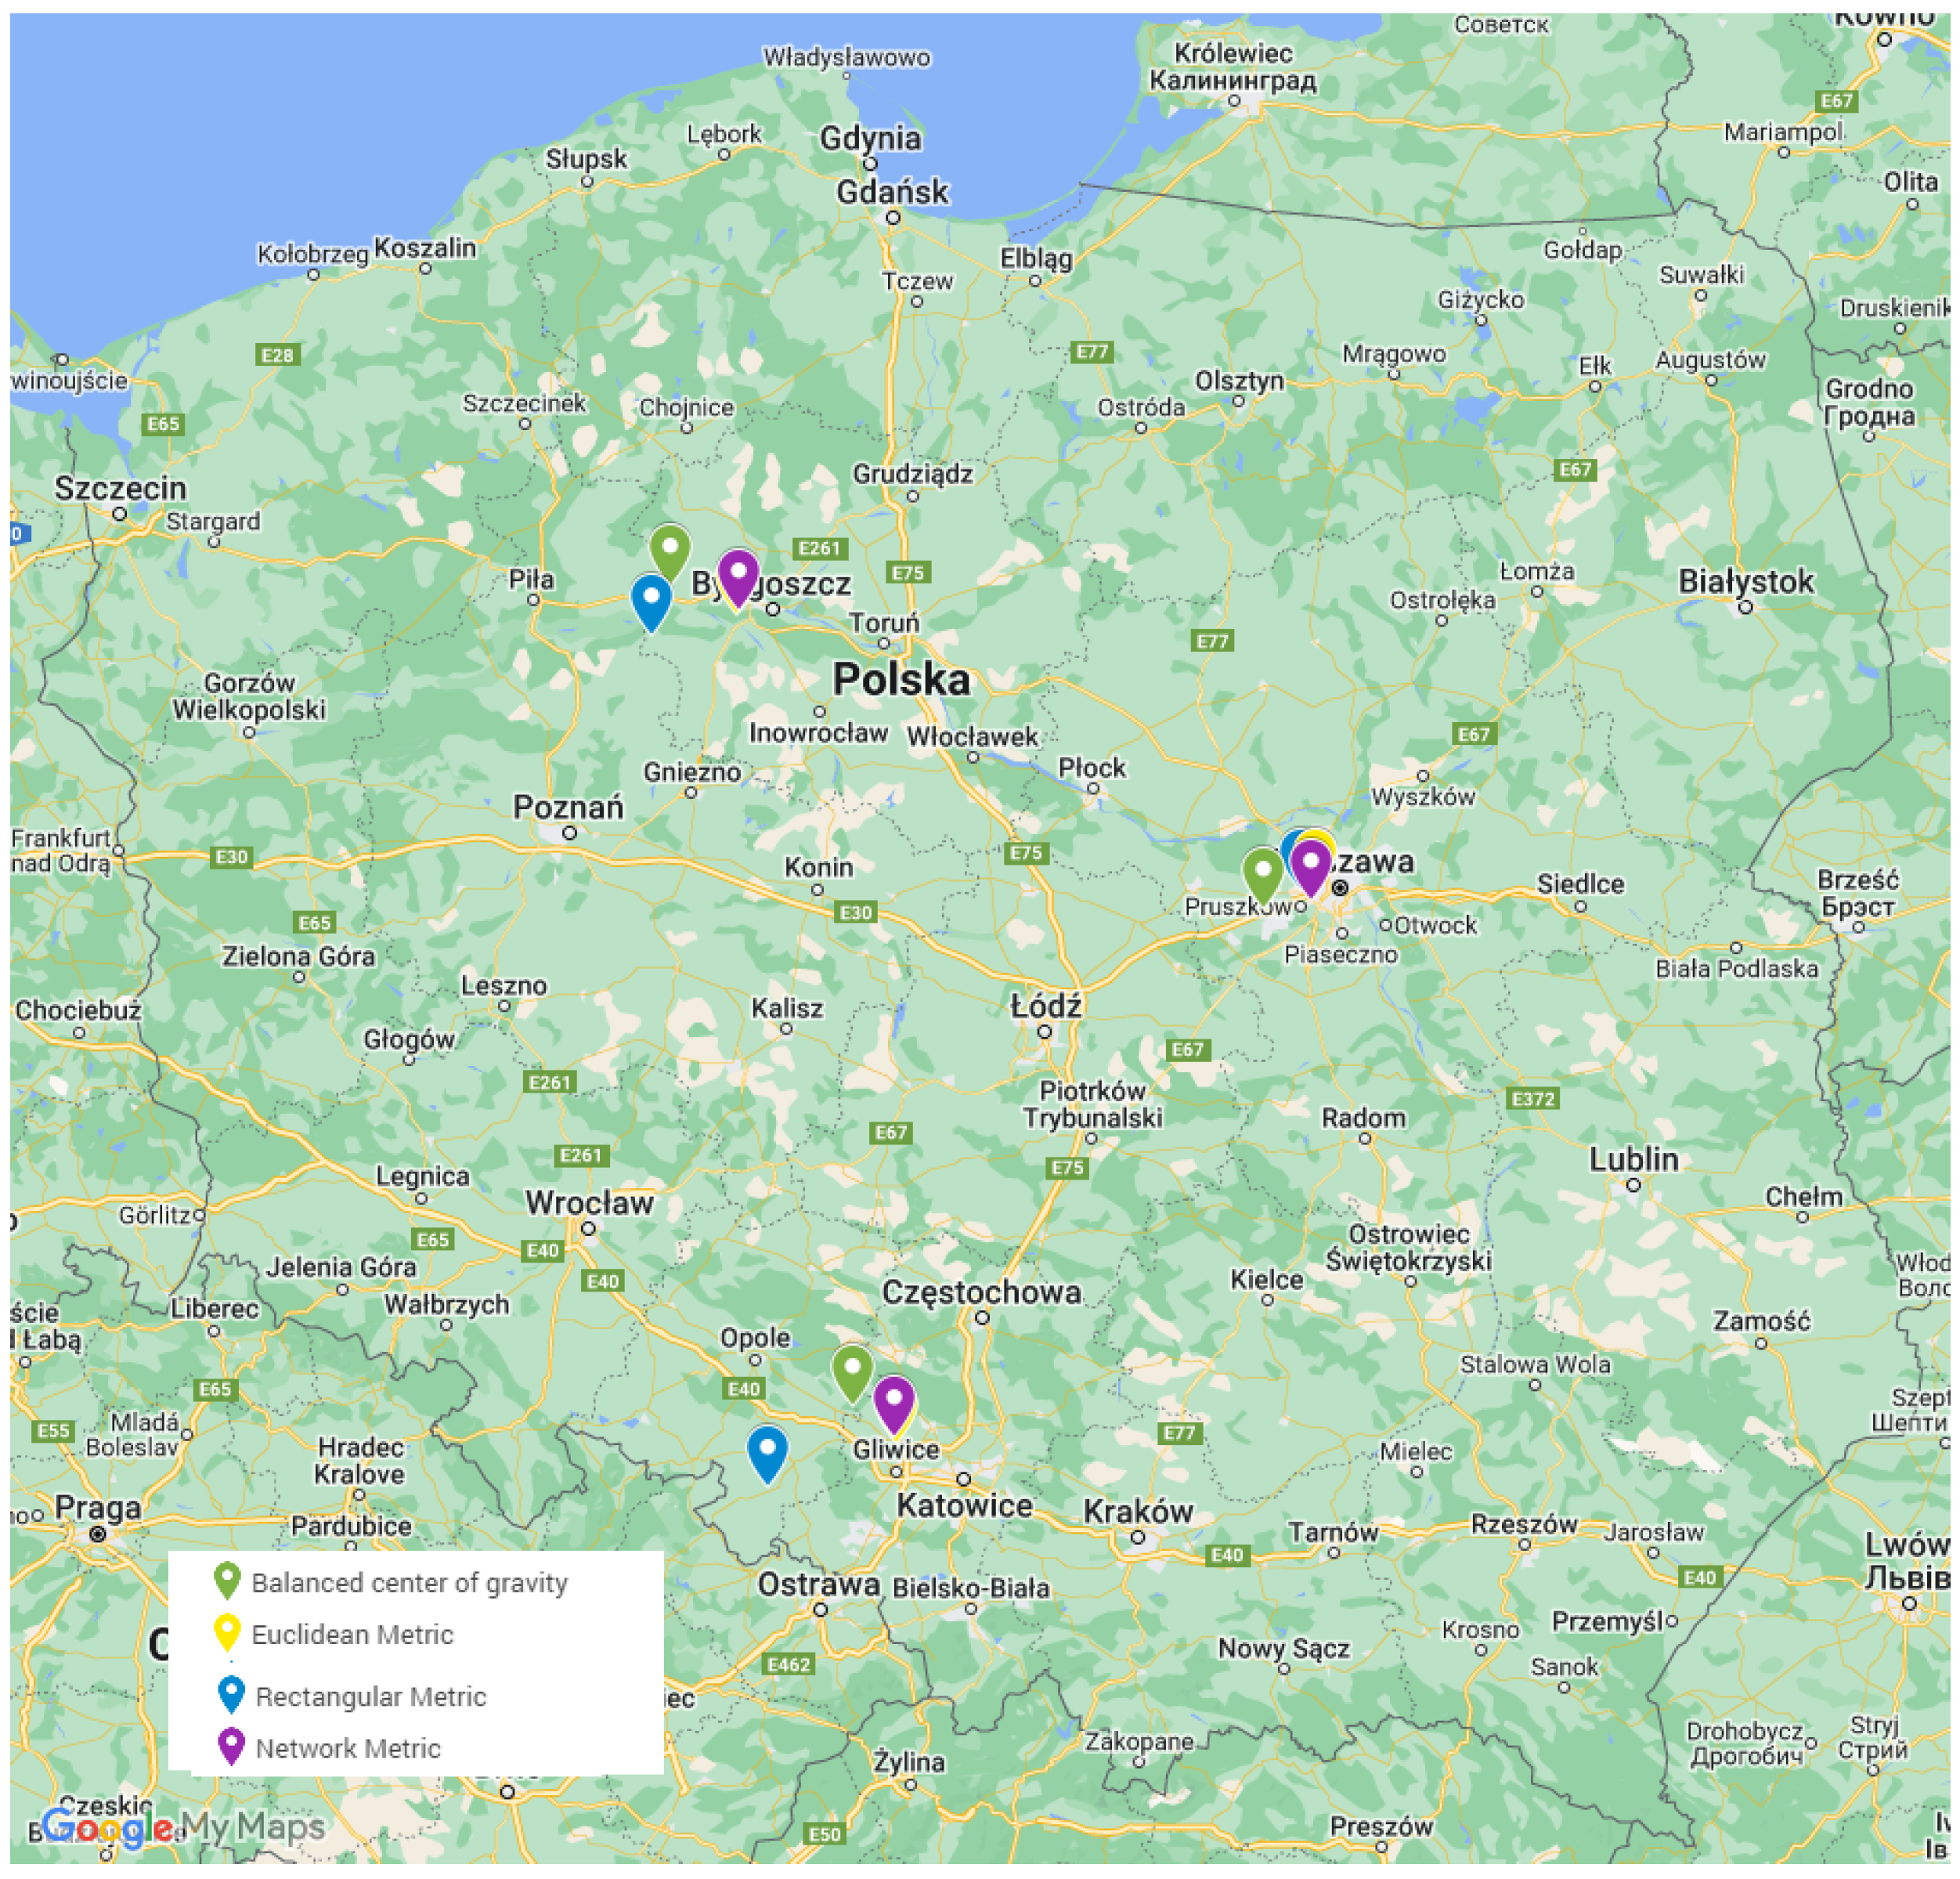
4.2. Determination of the Location of Metering Centers Using the Balanced Center of Gravity Method Based on the Euclidean Metric

In the subsequent step, using the Euclidean metric, distances in km in the logistics network were calculated. Distances were calculated using Formula (4), based on the geographic coordinates of locations selected using the balanced center of gravity method. For the purpose of the study, it was assumed that one geographic degree assumes a distance of 111.1967 km on the Earth’s surface, both along the equator and meridian. Then, using Formulas (5) and (6), the adjusted values of the coordinates of the desired location (minimizing costs in the logistics network) were calculated.
x 1 = v i · x i d j 0 v i d j 0
y 1 = v i · y i d j 0 v i d j 0
Based on this, points with the following coordinates were determined.
  • For central Poland:
    x C E = 20.87
    y C E = 52.22
  • For southwestern Poland:
    x S E = 18.65
    y S E = 50.39
  • For northwestern Poland:
    x N E = 17.81
    y N E = 53.11
Table 3 shows the results of the auxiliary calculations obtained.

4.3. Determination of the Location of Metering Centers Using the Balanced Center of Gravity Method Based on the Rectangular Metric

The rectangular metric was used to determine the optimal location of metering centers. The locations of suppliers and recipients listed for central Poland, along with the assigned waste volume stream, were ordered in ascending order with respect to x and y geographic coordinates, and a series of cumulative waste volume values were created (Table 4 and Table 5).
The value of V 0 was then calculated according to the following relationships:
V 0 = 0.5 · V
V = 1 i v i
In order to determine the x 0 coordinate, the value x i that satisfied the condition v r V 0 was selected from a series of cumulative values. The value of vr whose cumulative value is closest to and less than V 0 is selected. The calculated value V 0 = 506 , so a point with longitude coordinate x i = 21.07 , was indicated as the starting location.
An analogous analysis was performed for the latitude coordinate y i . It was calculated that y 0 = 52.23 .
In order to increase the accuracy of the obtained result, the obtained location was interpolated according to Formulas (9) and (10). The distance between the objects (xi, yi) and (x0, y0) was calculated using Formula (3).
x 1 = x 0 + V 0 V i V i + 1 V i · x i + 1 x i
y 1 = y 0 + V 0 V i V i + 1 V i · y i + 1 y i
The following results were obtained:
x C P = 20.80
y C P = 52.22
Based on the above, using Formula No. 3 to calculate the distance, the value of the number of kilometers in the transportation network (for the adopted location) was calculated. For the purpose of the study, it was again assumed that one geographical degree assumes a distance of 111.1967 km on the Earth’s surface. The results of the calculations are presented in Table 6.
Analogous calculations were carried out for the region of southwestern and northwestern Poland, obtaining the following results, regarding the values of metering center coordinates and distances in the logistics network.
  • For southwestern Poland:
    x S P = 17.97
    y S P = 50.24
    S u m = 1268.51   k m
  • For northwestern Poland:
    x S P = 17.36
    y S P = 53.04
    S u m = 1317.42   k m

4.4. Determination of the Location of Metering Centers Using the Balanced Center of Gravity Method Based on the Network Metric (According to the Actual Shape of the Transportation Infrastructure)

In the subsequent step, using the network metric, distances in km in the logistics network were calculated. Distances were calculated based on actual transportation routes between logistics facilities in the transportation network and locations selected using the balanced center of gravity method. Then, using Formulas (11) and (12), the adjusted values of the coordinates of the desired location (minimizing costs in the logistics network) were calculated.
x 1 = v i · x i l i v i l i
y 1 = v · y i l i v i l i
Based on this, points with the following coordinates were determined.
  • For central Poland:
    x C E = 20.85
    y C E = 52.19
  • For southwestern Poland:
    x S E = 18.64
    y S E = 50.41
  • For northwestern Poland:
    x N E = 17.82
    y N E = 53.12
The results of calculations are presented in Table 7.

5. Discussion

The premise behind the implementation of the deposit–refund system in Poland is to bring about an increase in recycling efficiency and a reduction in waste, supporting a circular economy. However, proper implementation also comes with a number of challenges associated with it, and one of the most important challenges is the construction of infrastructure for packaging collection (both vending machines as well as collection points and metering centers). This is a key element that determines the success of the entire system and the achievement of the set environmental and economic goals. It is extremely important that the proposed solutions are energy balanced so that they do not generate additional burdens. Therefore, the article presents a model for the distribution of logistics facilities included in the deposit–refund system, assuming the minimization of energy consumption throughout the system. For this purpose, the balanced center of gravity method was used, which was developed by using two metrics: Euclidean and rectangular. Based on an analysis of historical data on the volume of waste transported in the logistics network and the structure of the retail market in Poland, three key geographic areas have been identified where metering centers should be established to ensure the proper functioning of the deposit–refund system in Poland. Then, for each area, the determination of the optimal location of facilities was made, as presented in Figure 3, while detailed results are shown in Table 8.
The proposed model for the distribution of logistics facilities within the deposit–refund system network takes into account a number of key factors, such as the available logistics infrastructure, the locations of distribution centers of the major retail chains in Poland and their sales policies (which affect the manner in which packaging is received), as well as the location of sorting facilities and the facilities of the potential logistics operator assigned to carry out tasks in the system. This has made it possible to identify locations that can minimize the distance of waste transportation in the network, thereby reducing the energy needs of the solution and the effects of negative environmental impacts. The indicated locations are in the vicinity of Poland’s largest cities, i.e., Warsaw (the country’s capital), Bydgoszcz, and Katowice, providing adequate access to road and energy infrastructure and construction space, which is an important element in the construction of a counting center for the deposit–refund system.

6. Conclusions

States taking steps leading to the implementation of solutions to support a circular economy is a very important issue today. It is extremely important that the solutions being developed are energy balanced, so that they do not generate a heavy load that could limit the positive effects of the improvements being implemented. One example of such a solution is the construction of a deposit–refund system in Poland. To ensure its efficiency, both environmentally and energetically, it is important to develop an appropriate model for securing the logistics of the system. Therefore, the purpose of the article was to develop a model for the distribution of logistics facilities in the network of the deposit–refund system in such a way as to optimize logistics processes, minimizing negative environmental impacts and minimizing energy expenditures.
The conducted study confirmed, thus proving the main research hypothesis, that the optimization of the deposit–refund system at the design stage is possible by using a methodology that takes into account the distribution of the main logistics facilities in the network. By analyzing material flows and using mathematical methods, such as the balanced center of gravity method (using appropriate metrics), it was possible to design a system that minimizes energy expenditures and maximizes the efficiency of logistics processes. The results indicate that the implementation of such assumptions from the outset provides significantly better system functionality compared to the traditional approach.
The study also confirmed the accuracy of the formulated specific hypotheses. The authors proved that the balanced center of gravity method (with the use of appropriate metrics) made it possible to develop an effective reverse logistics model. Taking into account the distribution of collection points and the distances between them made it possible to precisely determine the optimal locations for logistics centers. The result was a reduction in the total length of transportation routes and a reduction in the energy and financial costs of the system. The results of the study indicate that the developed deposit–refund logistics model is characterized by universality and can be successfully adapted to other countries with a similar level of economic development. The model takes into account key factors such as the distribution of collection points and material flows. Due to its flexible nature and scalability, the methodology can be adapted to specific local conditions in different countries, confirming its international potential.
The proper functioning of the deposit–refund system is only possible with an effectively functioning logistics facility, implemented by a designated logistics operator. The model was developed based on historical data on the volume of waste transported, as well as on a detailed analysis of the structure of the retail market in Poland. Using the balanced center of gravity method, the optimal locations of facilities (metering centers) were determined. This has made it possible to develop an efficient and environmentally friendly reverse logistics model that is universal and can also be used to implement a similar solution in other countries. The model developed is just a preliminary analysis of the location and is a starting point for further research into the creation of a system that is not yet in place in Poland; therefore, more in-depth research will be necessary.
Nevertheless, already at this stage, further implications of the obtained results can be formulated, which include significant benefits both on an environmental and economic level. Reduction of energy consumption in take-back logistics and optimization in the area of packaging transport contributes to the reduction of harmful emissions and supports the achievement of ecological goals both for Poland and the entire European Union. In addition, a well thought-out and designed logistics system from the outset can reduce overall operating costs, which in the long run can increase the profitability of the deposit–refund system and make it more attractive to stakeholders. Another important aspect is the adaptability of the developed model to other waste streams, which further increases its application potential and indicates the utilitarian nature of the solutions proposed in the article.
In the context of further findings, in-depth analyses of the impact of fluctuations in material flow intensity and seasonality on the functioning of the entire system are particularly important. At this stage, such analysis is very difficult, but it is possible to develop appropriate simulators, which may be the subject of further consideration. It is also worth exploring the possibility of integrating the deposit–refund system with other forms of circular economy, such as municipal waste collection or sharing logistics infrastructure with other sectors. A key step should be the development of detailed guidelines for implementing the system, taking into account Poland’s geographic and demographic diversity, as well as consultation with local authorities and communities.
According to the authors, further research should also address the evaluation of the impact of consumer education and information campaigns on the efficiency of the deposit–refund system, as public awareness is an extremely important success factor in this case. Consideration should also be given to the application of modern technologies such as artificial intelligence and the Internet of Things to dynamically monitor and manage logistics flows. Integration of these technologies can not only increase efficiency, but also provide valuable data for further analysis and improvement of the system.
Thus, further research should take into account market dynamics, analysis of the variability of waste streams over time and their seasonality, as well as the potential increase or decrease in consumption of various types of packaging. In addition, changes in the structure of the retail market, expansion of retail chains, or changes in consumer preferences can be taken into account. All of this information can support the energy-sustainable operation of the various components of the deposit–refund system’s infrastructure and ensure its ongoing optimization, which will be necessary once the system is operational in the country.

Author Contributions

Conceptualization, A.B. and M.G.; methodology, A.B.; software, M.G.; validation, A.B.; formal analysis, A.B. and M.G.; investigation, A.B.; resources, M.G.; data curation, M.G.; writing—original draft preparation, A.B. and M.G.; writing—review and editing, A.B. and M.G.; visualization, M.G.; supervision, A.B.; project administration, M.G.; funding acquisition, A.B. All authors have read and agreed to the published version of the manuscript.

Funding

This research received no external funding.

Institutional Review Board Statement

Not applicable.

Informed Consent Statement

Not applicable.

Data Availability Statement

The data presented in this study are available on request from the corresponding authors.

Conflicts of Interest

The authors declare no conflicts of interest.

References

  1. Bórawski, P.; Wyszomierski, R.; Bełdycka-Bórawska, A.; Mickiewicz, B.; Kalinowska, B.; Dunn, J.W.; Rokicki, T. Development of Renewable Energy Sources in the European Union in the Context of Sustainable Development Policy. Energies 2022, 15, 1545. [Google Scholar] [CrossRef]
  2. Fatimah, Y.A.; Govindan, K.; Murniningsih, R.; Setiawan, A. Industry 4.0 based sustainable circular economy approach for smart waste management system to achieve sustainable development goals: A case study of Indonesia. J. Clean. Prod. 2020, 269, 122263. [Google Scholar] [CrossRef]
  3. Fan, Z.; Luo, Y.; Liang, N.; Li, S. A Novel Sustainable Reverse Logistics Network Design for Electric Vehicle Batteries Considering Multi-Kind and Multi-Technology. Sustainability 2023, 15, 10128. [Google Scholar] [CrossRef]
  4. Al-Thani, H.; Koç, M.; Isaifan, R.J.; Bicer, Y. A Review of the Integrated Renewable Energy Systems for Sustainable Urban Mobility. Sustainability 2022, 14, 10517. [Google Scholar] [CrossRef]
  5. Bataille, C.G. Physical and policy pathways to net-zero emissions industry. Wiley Interdiscip. Rev. Clim. Chang. 2020, 11, e633. [Google Scholar] [CrossRef]
  6. Vågerö, O.; Zeyringer, M. Can we optimise for justice? Reviewing the inclusion of energy justice in energy system optimisation models. Energy Res. Soc. Sci. 2023, 95, 102913. [Google Scholar] [CrossRef]
  7. Yu, J.; Hao, S.; Han, J. Optimizing Virtual Energy Hub’s for Enhanced Market Participation and Operational Resilience. Eksploat. Niezawodn.–Maint. Reliab. 2025, 27, 193171. [Google Scholar] [CrossRef]
  8. Frampton, D.M.F.; Haque, N.; Verrelli, D.I.; Dumsday, G.J.; Lee-Chang, K.J. Process Design Guided by Life Cycle Assessment to Reduce Greenhouse Gas-Related Environmental Impacts of Food Processing. Sustainability 2021, 13, 6864. [Google Scholar] [CrossRef]
  9. Gholami, M.; Karimi Ghaleh Jough, F.; Gholami, A. Streamlining Smart Grids Reliability Assessment: An Innovative Mapping Approach. Eksploat. Niezawodn.–Maint. Reliab. 2025, 27, 195258. [Google Scholar] [CrossRef]
  10. Coronado, M.; Kadoch, B.; Contreras, J.; Kristjanpoller, F. Reliability and availability modelling of a retrofitted Diesel-based cogeneration system for heat and hot water demand of an isolated Antarctic base. Eksploat. Niezawodn.–Maint. Reliab. 2023, 25, 169779. [Google Scholar] [CrossRef]
  11. Zarębski, A.; Zarębska, J.; Marosek, K. Implementation of the Deposit System in Poland as a Tool for Implementing the Circular Economy. Energies 2024, 17, 5489. [Google Scholar] [CrossRef]
  12. Borucka, A.; Kozłowski, E.; Antosz, K.; Parczewski, R. A New Approach to Production Process Capability Assessment for Non-Normal Data. Appl. Sci. 2023, 13, 6721. [Google Scholar] [CrossRef]
  13. Borucka, A.; Grzelak, M. Application of Logistic Regression for Production Machinery Efficiency Evaluation. Appl. Sci. 2019, 9, 4770. [Google Scholar] [CrossRef]
  14. Ma, R.; Zhao, Y.; Li, J. Enhancing Distribution System Flexibility through Network Restructuring and Optimal Planning of Distributed Energy Resources. Eksploat. Niezawodn.–Maint. Reliab. 2025, 27, 19065. [Google Scholar] [CrossRef]
  15. Szymańska, E.J.; Mroczek, R.; Drożdż, J. A Closed-Loop Economy in the Meat Industry for Generating Alternative Energy from Biogas Plants. Energies 2024, 17, 6172. [Google Scholar] [CrossRef]
  16. Liu, Y. Enhancing Flexibility and Reliability in Smart Distribution Networks: A Self-Healing Approach. Eksploat. Niezawodn.–Maint. Reliab. 2025, 27, 195269. [Google Scholar] [CrossRef]
  17. Bibri, S.E. The eco-city and its core environmental dimension of sustainability: Green energy technologies and their integration with data-driven smart solutions. Energy Inf. 2020, 3, 4. [Google Scholar] [CrossRef]
  18. Krzywda, D. Closing the loop-packaging waste management and the deposit system in Poland. Pol. J. Manag. Stud. 2022, 26, 233–247. [Google Scholar] [CrossRef]
  19. Broniewicz, E.; Larsson, A.; Piontek, W.; Sidorczuk-Pietraszko, E. Economic effects of introducing a deposit-return system for packaging in Poland. Econ. Environ. 2023, 86, 169–185. [Google Scholar] [CrossRef]
  20. Zhou, K.; Liu, Q.; Feng, J.; Chang, T.; Liu, J. Comprehensive environmental performance of bottle-to-bottle recycling of PET bottles based on deposit-refund system in China. Waste Manag. 2023, 172, 90–100. [Google Scholar] [CrossRef]
  21. Bobek-Nagy, J.; Kurdi, R.; Kovács, A.; Simon-Stőger, L.; Szigeti, M.; Varga, C. How introduction of deposit-refund system (DRS) changes recycling of non-drinking bottle PET wastes. Express Polym. Lett. 2023, 17, 1166–1179. [Google Scholar] [CrossRef]
  22. Martinho, G.; Santos, P.; Alves, A.; Ramos, M. Indicators and characteristics of PET packaging collected in a Deposit and Refund System pilot project. Heliyon 2024, 10, e25182. [Google Scholar] [CrossRef] [PubMed]
  23. Ustawa z dnia 13 lipca 2023 r. o zmianie ustawy o gospodarce opakowaniami i odpadami opakowaniowymi oraz innych ustaw (Dz.U. z 2023 r. poz. 1852) zwana ustawą kaucyjną. Available online: https://isap.sejm.gov.pl/isap.nsf/DocDetails.xsp?id=WDU20230001852 (accessed on 9 December 2024).
  24. Document 32019L0904; Directive (EU) 2019/904 of the European Parliament and of the Council of 5 June 2019 on the Reduction of the Impact of Certain Plastic Products on the Environment. EU: New York, NY, USA, 2019.
  25. Schnurr, R.E.; Alboiu, V.; Chaudhary, M.; Corbett, R.A.; Quanz, M.E.; Sankar, K.; Srain, H.S.; Thavarajah, V.; Xanthos, D.; Walker, T.R. Reducing marine pollution from single-use plastics (SUPs): A review. Mar. Pollut. Bull. 2018, 137, 157–171. [Google Scholar] [CrossRef]
  26. Chen, Y.; Awasthi, A.K.; Wei, F.; Tan, Q.; Li, J. Single-use plastics: Production, usage, disposal, and adverse impacts. Sci. Total Environ. 2021, 752, 141772. [Google Scholar] [CrossRef]
  27. System kaucyjny w Polsce ogłoszony w Dzienniku Ustaw. Available online: https://rekopol.pl/newsletter/system-kaucyjny-w-polsce-ogloszony-w-dzienniku-ustaw/ (accessed on 10 December 2024).
  28. Agnusdei, G.P.; Gnoni, M.G.; Sgarbossa, F. Are deposit-refund systems effective in managing glass packaging? State of the art and future directions in Europe. Sci. Total Environ. 2022, 851, 158256. [Google Scholar] [CrossRef]
  29. System kaucyjny w Europie. Available online: https://kaucyjny.pl/przyklady-z-zagranicy/ (accessed on 10 December 2024).
  30. Zhou, G.; Gu, Y.; Wu, Y.; Gong, Y.; Mu, X.; Han, H.; Chang, T. A systematic review of the deposit-refund system for beverage packaging: Operating mode, key parameter and development trend. J. Clean. Prod. 2020, 251, 119660. [Google Scholar] [CrossRef]
  31. Kozar, Ł.J. The financial sector and sustainable development-a review of selected environmental practices implemented in financial institutions operating in Poland between 2016 and 2020. Finans. Prawo Finans. 2022, 1, 143–157. [Google Scholar] [CrossRef]
  32. Dmitrieva, D.; Romasheva, N. Sustainable development of oil and gas potential of the Arctic and its shelf zone: The role of innovations. J. Mar. Sci. Eng. 2020, 8, 1003. [Google Scholar] [CrossRef]
  33. Zabaniotou, A. Redesigning a bioenergy sector in EU in the transition to circular waste-based Bioeconomy-A multidisciplinary review. J. Clean. Prod. 2018, 177, 197–206. [Google Scholar] [CrossRef]
  34. Vukovic, N.; Makogon, E. Waste-to-Energy Generation: Complex Efficiency Analysis of Modern Technologies. Sustainability 2022, 14, 13814. [Google Scholar] [CrossRef]
  35. Reijonen, H.; Bellman, S.; Murphy, J.; Kokkonen, H. Factors related to recycling plastic packaging in Finland’s new waste management scheme. Waste Manag. 2021, 131, 88–97. [Google Scholar] [CrossRef] [PubMed]
  36. Kozłowski, E.; Borucka, A.; Oleszczuk, P.; Leszczyński, N. Evaluation of readiness of the technical system using the semi-Markov model with selected sojourn time distributions. Eksploat. Niezawodn.–Maint. Reliab. 2024, 26, 191545. [Google Scholar] [CrossRef]
  37. Oszczypała, M.; Ziółkowski, J.; Małachowski, J. Semi-Markov approach for reliability modelling of light utility vehicles. Eksploat. Niezawodn.–Maint. Reliab. 2023, 25, 161859. [Google Scholar] [CrossRef]
  38. Borucka, A.; Kozłowski, E.; Parczewski, R.; Antosz, K.; Gil, L.; Pieniak, D. Supply Sequence Modelling Using Hidden Markov Models. Appl. Sci. 2023, 13, 231. [Google Scholar] [CrossRef]
  39. Marchi, B.; Zanoni, S. Supply Chain Management for Improved Energy Efficiency: Review and Opportunities. Energies 2017, 10, 1618. [Google Scholar] [CrossRef]
  40. Park, A.; Li, H. The Effect of Blockchain Technology on Supply Chain Sustainability Performances. Sustainability 2021, 13, 1726. [Google Scholar] [CrossRef]
  41. Xie, P.; Li, C. Dynamic Modeling and Optimization of Energy Storage in Peer-to-Peer Energy Trading Systems. Eksploat. Niezawodn.–Maint. Reliab. 2025, 27, 195761. [Google Scholar] [CrossRef]
  42. Silva, C.; Ribeiro, R.; Gomes, P. Algorithmic Optimization Techniques for Operations Research Problems. In Data Analytics in System Engineering: Proceedings of the Computational Methods in Systems and Software; Springer: Cham, Switzerland, 2023; pp. 331–339. [Google Scholar] [CrossRef]
  43. Rahmaniperchkolaei, B.; Taeeb, Z.; Shahriari, M.; Lotfi, F.H.; Saati, S. Applied optimization problems. In Decision-Making Models; Academic Press: Washington, DC, USA, 2024; pp. 237–299. [Google Scholar] [CrossRef]
  44. Soleimani, H.; Kannan, G. A hybrid particle swarm optimization and genetic algorithm for closed-loop supply chain network design in large-scale networks. Appl. Math. Model. 2015, 39, 3990–4012. [Google Scholar] [CrossRef]
  45. Zhang, Y.; Wang, S.; Ji, G. A comprehensive survey on particle swarm optimization algorithm and its applications. Math. Probl. Eng. 2015, 2015, 931256. [Google Scholar] [CrossRef]
  46. Gad, A.G. Particle swarm optimization algorithm and its applications: A systematic review. Arch. Comput. Methods Eng. 2022, 29, 2531–2561. [Google Scholar] [CrossRef]
  47. Tako, A.A.; Robinson, S. The application of discrete event simulation and system dynamics in the logistics and supply chain context. Decis. Support Syst. 2012, 52, 802–815. [Google Scholar] [CrossRef]
  48. Gyulai, D.; Bergmann, J.; Lengyel, A.; Kádár, B.; Czirkó, D. Simulation-based digital twin of a complex shop-floor logistics system. In Proceedings of the 2020 Winter Simulation Conference (WSC), Orlando, FL, USA, 14–18 December 2020; IEEE: New York, NY, USA, 2020; pp. 1849–1860. [Google Scholar] [CrossRef]
  49. Frej, D.; Jaśkiewicz, M. Comparison of Volunteers’ Head Displacement with Computer Simulation—Crash Test with Low Speed of 20 km/h. Sensors 2022, 22, 9720. [Google Scholar] [CrossRef] [PubMed]
  50. Coelho, F.; Relvas, S.; Barbosa-Póvoa, A.P. Simulation-based decision support tool for in-house logistics: The basis for a digital twin. Comput. Ind. Eng. 2021, 153, 107094. [Google Scholar] [CrossRef]
  51. Li, X.; Song, K.; Shi, J. Degradation generation and prediction based on machine learning methods: A comparative study. Eksploat. Niezawodn.–Maint. Reliab. 2025, 27, 192168. [Google Scholar] [CrossRef]
  52. Azzedine, A.; Nouri, F.Z.; Bouhouche, S. A new hybrid approach based on probability distribution and an improved machine learning for multivariate risk assessment. Diagnostyka 2024, 25, 2024213. [Google Scholar] [CrossRef]
  53. Kozłowski, M.; Racewicz, S.; Wierzbicki, S. Image Analysis in Autonomous Vehicles: A Review of the Latest AI Solutions and Their Comparison. Appl. Sci. 2024, 14, 8150. [Google Scholar] [CrossRef]
  54. Rane, N.L.; Desai, P.; Rane, J.; Paramesha, M. Artificial intelligence, machine learning, and deep learning for sustainable and resilient supply chain and logistics management. In Trustworthy Artificial Intelligence in Industry and Society; Deep Science Publishing: London, UK, 2024; pp. 156–184. [Google Scholar] [CrossRef]
  55. Abdullah, A.G.; Ibrahim, M.A.; Ibrahim, W.K. Detection and identification of fault in transmission lines based on ANN. Diagnostyka 2024, 25, 2024206. [Google Scholar] [CrossRef]
  56. Retail Market 2021. Structure, Number of Establishments, Trends. Available online: https://foodfakty.pl/rynek-detaliczny-2021-struktura-liczebnosc-placowek-trendy-wyniki-badania-liczebnosci-i-struktury-handlu-w-czerwcu-2021-wg-nielseniq (accessed on 11 December 2024).
  57. Gawałkiewicz, M. Implementation of the Deposit-Refund System in Poland Using Remondis as an Example. Bachelor’s Thesis, Warszawa, Poland, 2024. [Google Scholar]
  58. Krawczyk, S. Quantitative Methods in Logistics (Enterprises); t. II; C.H. BECK: Warszawa, Poland, 2021. [Google Scholar]
Figure 1. Location map of distribution centers of selected retail chains [57].
Sustainability 17 01030 g001
Figure 2. Location map of selected areas of metering centers [57].
Sustainability 17 01030 g002
Figure 3. Map of recommended locations of metering centers.
Sustainability 17 01030 g003
Table 1. Minimum levels of separate collection of packaging and packaging waste [27].
ItemType of PackagingLevels of Separate Collection of Packaging and Packaging Waste in % by Year
20252026202720282029 and Beyond
1Disposable plastic beverage bottles up to and including 3 L with plastic caps and lids, excluding glass or metal beverage bottles with plastic caps and lids7781848790
2Metal cans with a capacity of up to 1 L7781848790
3Reusable glass bottles with a capacity of up to one and a half liters7781848790
Table 2. Waste stream values in the logistics network with geographic coordinates [57].
Name of LocalityNumber of Distribution CentersWaste Weight [t] per MonthLongitude xLatitude y
Suppliers
Central Poland
Płock511019.7052.55
Konin48818.2552.23
Warszawa817621.0752.23
Lublin24422.5751.25
Łódź48819.4651.77
Southwestern Poland
Legnica36616.1651.21
Kraków511019.9450.06
Wrocław36617.0451.11
Częstochowa715419.1150.81
Wałbrzych36616.2850.77
Northwestern Poland
Elbląg511019.4054.16
Szczecin613214.5553.43
Poznań48816.9352.41
Gorzów
Wielkopolski
24415.2452.73
Toruń36618.6053.01
Recipients
Sorting plant Warsaw150621.0952.18
Sorting plant Gliwice146218.6750.29
Sorting plant Bydgoszcz144018.0053.12
Table 3. Results of distance calculations in the logistics network.
Name of LocalityWaste Weight [t] per Monthxy(xi − x1)2(y1 − yi)2dj1dj1 [km]
Central Poland
Płock11019.7052.551.360.101.21134.41
Konin8818.2552.236.830.002.61290.61
Warszawa17621.0752.230.040.000.2122.89
Lublin4422.5751.252.910.951.96218.21
Łódź8819.4651.771.980.211.48164.57
Sorting plant Warsaw50621.0952.180.040.000.2122.89
Total:853.59
Southwestern Poland
Legnica6616.1651.216.190.682.62291.29
Kraków11019.9450.061.660.101.33147.83
Wrocław6617.0451.112.600.521.77196.36
Częstochowa15419.1150.810.220.180.6370.23
Wałbrzych6616.2850.775.590.142.40266.35
Sorting plant Gliwice46218.6750.290.000.010.0910.37
Total:982.42
Northwestern Poland
Elbląg11019.4054.162.541.101.91212.09
Szczecin13214.5553.4310.620.103.27364.13
Poznań8816.9352.410.780.491.13125.20
Gorzów
Wielkopolski
4415.2452.736.600.142.60288.84
Toruń6618.6053.010.630.010.8089.08
Sorting plant Bydgoszcz44018.0053.120.040.000.1921.22
Total:1100.55
Table 4. Auxiliary data for calculating the coordinates of x 0 in the rectangular metric.
No.Location of the Facilityxivivr
1Konin18.258888.00
2Łódź 19.4688176.00
3Płock19.70110286.00
4Warszawa21.07176462.00
5Sorting plant Warsaw21.09506968.00
6Lublin22.57441012.00
Bold indicates which city was selected as the starting point of reference during the calculation.
Table 5. Auxiliary data for calculating the coordinates of y 0 in the rectangular metric.
No.Location of the Facilityxivivr
1Lublin51.254444.00
2Łódź 51.7788132.00
3Konin52.2388220.00
4Warszawa52.23176396.00
5Warszawa52.18506902.00
6Płock52.551101012.00
Bold indicates which city was selected as the starting point of reference during the calculation.
Table 6. Distances in transport network using the rectangular metric after interpolation.
No.Location of the Facilityxiyi|x1 − xj||y1 − yj|di [Degrees].di [km].
1Płock19.7052.551.370.321.70188.49
2Konin18.2552.232.820.012.83314.41
3Warszawa21.0752.230.000.010.011.34
4Lublin22.5751.251.500.972.47274.66
5Łódź 19.4651.771.620.452.07230.13
6Warszawa21.0952.180.010.040.055.76
Total:1014.79
Table 7. Distances in transport network using the network metric.
Name of LocalityWaste Weight [t] per Monthxylj [km]
Central Poland
Płock11019.7052.5584.30
Konin8818.2552.23197.00
Warszawa17621.0752.2344.30
Lublin4422.5751.25208.00
Łódź8819.4651.v77111.00
Sortownia Warszawa50621.0952.v1847.00
Suma691.60
Southwestern Poland
Legnica6616.1651.21210.00
Kraków11019.9450.06149.00
Wrocław6617.0451.11148.00
Częstochowa15419.1150.8171.60
Wałbrzych6616.2850.77218.00
Sortownia Gliwice46218.6750.2943.40
Suma840.00
Northwestern Poland
Elbląg11019.4054.16260.00
Szczecin13214.5553.43224.00
Poznań8816.9352.41145.00
Gorzów
Wielkopolski
4415.2452.73176.00
Toruń6618.6053.0198.00
Sortownia Bydgoszcz44018.0053.1243.50
Suma946.50
Table 8. Geographical coordinates of the proposed locations.
AreaGravity MethodEuclidean MetricRectangular MetricNetwork Metric
xyxyxyxy
Central Poland20.6052.1620.8752.2220.8052.2220.8552.19
Southwestern Poland18.4250.5118.6550.3917.9750.2418.6450.41
Northwestern Poland17.4653.2017.8153.1117.3653.0417.8253.12
Disclaimer/Publisher’s Note: The statements, opinions and data contained in all publications are solely those of the individual author(s) and contributor(s) and not of MDPI and/or the editor(s). MDPI and/or the editor(s) disclaim responsibility for any injury to people or property resulting from any ideas, methods, instructions or products referred to in the content.

