Abstract
The European Directive in force on port reception facilities for waste from ships applicable to both ports and ships has the aim of protecting the marine environment. To promote this goal, the directive imposes on every member state the availability of port reception facilities adequate in meeting the needs of the ships normally using the ports without causing undue delay in their operations. As an effective tool to discourage the discharges of waste at sea, the new policy requires ports to implement a cost recovery system for the waste reception service through mandatory fees to be paid by ships irrespective of the volume of waste delivered at port. In the context of the obligations that European ports must fulfill according to the new policy on waste from ships, the present study analyzes the Spanish ports’ database. The research relates traffic characterization with the economic results of the waste reception service in each port authority to ensure that the effective reception costs are covered. The findings will enable building a robust port fee system adapted to the ship typology with the aim of mitigating economic imbalances and ensuring that ships contribute to the port reception facilities’ costs according to their characteristics.
1. Introduction
The current maritime policy aims to ensure a high level of safety and environmental protection given that accidentally or deliberately discharging waste from a ship can damage ocean habitats, contaminate food chains or harm marine life. The target can be achieved among other tools through international conventions such as the MARPOL convention for the Prevention of Pollution from Ships adopted in 1973 by the International Maritime Organization (IMO). It provides for general prohibitions on discharges from ships at sea and plays a crucial role in the protecting marine environment [1,2,3]. The MARPOL convention includes regulations aimed at preventing and minimizing pollution from ships and currently includes six technical Annexes with different types of waste and cargo residues. However, it remains necessary to constantly adapt the MARPOL convention to new developments [4].
Under the IMO’s remittance, decisions made by the Marine Environment Protection Committee (hereinafter, MEPC) are another relevant instrument to preserve the marine environment [5,6]. The current global trend of maritime decarbonization is also driven by policies such as the IMO 2020 [7] and the European Union (hereinafter, EU) Fit for 55 regulation package [8,9,10,11].
Also in the EU context, Directive 2005/35/EC on ship-source pollution [12], currently under review [13], created rules on the imposition of penalties in the event of discharges of oil or other polluting substances from ships sailing in European waters. But despite these regulatory efforts, discharges of waste at sea still occur, causing substantial environmental, social and economic costs [14].
With the aim of reconciling the protection of the marine environment with an efficient operation in maritime transport, in 2000, the EU implemented a directive [15] that was not fully effective due to some inconsistencies with the MARPOL convention framework. This directive has been replaced by Directive 2019/883 on port reception facilities for the delivery of waste from ships [16] (hereinafter, DPRF), that member states (hereinafter, MS) had to transpose into national laws and enforce no later than 2021.
The DPRF, in a similar way to the older Spanish port law, does provide a powerful incentive to encourage the delivery of waste by ships calling in EU ports. This incentive is the set of rules for the legally named in Spain “fixed fee” that is parallel to the “cost recovery system” (hereinafter, CRS) according to the European directive. A fee system with the same principles as that established in Spanish ports since 2011 must be now implemented by each EU port setting up fixed fees to be paid by ships, irrespective of the delivery of waste to a port reception facility (hereinafter, PRF). This payment allows shipping the delivery of waste without any additional direct fees for solid waste plus a percentage of at least 30 per cent for oil waste. However, the concept of the mandatory indirect fee (hereinafter, IFF) is still relatively unknown to a ship’s master and crew calling in EU ports due to the triangular fee system where the ship pays the port whether or not it delivers waste and it is the port that pays the PRF operator based on the particular delivery of waste that the ship has made.
The European Sea Ports Organization (hereinafter, ESPO) and the European Sustainable Shipping Forum (hereinafter, ESSF) subgroup on Waste from Ships [17], constituted by the EU Commission to discuss the DPRF issues, agree that on a yearly basis the CRS should be balanced, but many MSs have concerns about how to obtain it [18], also considering that that fees to be paid by ships should be proportionate to the PRF costs as the regulation in force on port services [19] determines.
Table 1 shows the concepts that the IFF should cover as a minimum: 100 per cent of the total direct costs for deliveries of MARPOL convention Annex V and 30 per cent of the total direct costs for deliveries of the other MARPOL convention Annexes. Cargo residues (Annex I, II or V) and Annex VI waste are not covered by the IFF; therefore, ships must pay an additional fee to the PRF operator, different from the IFF to be paid to port authorities [16].

Table 1.
Deliveries of waste covered by paying IFF according to DPRF in EU ports.
The setting of a CRS according to the DPRF by each MS has the goal of ensuring an appropriate waste reception and treatment with adequate PRFs, avoiding an imbalance between revenues from the IFF paid by ships and the effective costs of treatment that must be paid directly by ports to PRFs. The DPRF [16] expressly allows the application of differentiated fixed fees to ships depending on the category, type and size of the ship.
Focusing on the amount of waste discharged by different types of ships, some researchers have investigated the relation between “solid waste” and “cruise ships”, concluding that it is a niche to be explored, investigated, studied and analyzed in the hopes of making educated decisions about future regulations on this issue [20], but there is a small number of articles about waste management practices aboard cruise vessels [21]. The disposal of cruise ships’ solid waste, such as plastic, paper, wood, boards, food, cans, bottles and glass, puts great environmental pressure on the local area and even causes great damage to the local natural environment [22]. A large cruise ship carries over 6000 passengers and 1500 crew members, and therefore the amount of waste generated is also considerable, in contrast to cargo ships which are usually manned with fewer than 30 crew members [23]. The cruise sector has been significantly increasing the tourism, shipping and port industry, evidencing relevant economic, social and environmental impacts. Empirical studies [24] focused on the waste management process within the cruise industry point out that port users still do not use advanced and specific information systems and, also, they do not share information, data and practices; this can be considered as an interesting research starting point in order to find new and more intriguing aspects to investigate.
Regarding passenger ferries, which are vessels usually engaged in scheduled traffic with frequent and regular port calls, some studies [25] try to sensitize to the need to continuously monitor waste quantities generated with respect to the capacity of PRFs. Researchers have also empirically studied ferry passengers’ perceptions and behaviors towards general waste management and recycling [26], addressing limitations for reflection in future research, such as the lack of comprehensive data from different stakeholders involved in the port waste reception service (hereinafter, WRS), including transport associations, ferry operators, ferry terminal operators, policymakers, environmentalists and public authorities, to obtain wider perspectives for deeper analyses.
The main variable used to determine the fee for the delivery of oily waste is the ship size, while the definition of the fee for the delivery of solid waste should be based on the number of people on board, but investigating and verifying these basic principles for any composition of ship traffic that ports receive is needed [21,27], pointing out the differences between ferry or cruise passenger traffic, and within the latter, considering mainly the impact on home ports [28].
In the context of the obligations that ports must assume to comply with the EU policy on waste from ships, the present study analyzes an extensive database from Spanish ports that allows to relate objectively the traffic characterization with the costs from the port WRS. Rules and data from the Spanish fee system are analyzed in depth to draw conclusions and proposals to apply in Spanish ports and can also be implemented for any EU port. The findings will enable the building of a fee system to apply at ports adapted to the scheduled vessel traffic with the aim of mitigating imbalances on ports’ financial statements and ensure that ships contribute to the WRS and PRFs’ costs.
2. Materials and Methods
Since 2011, the 46 Spanish commercial ports that are grouped on 28 port authorities have imposed on ships a common fixed fee to discourage the discharges of waste at sea [29], with the same principle as that imposed by the recent DPRF. As a quality validator for operating PRFs and according to IMO data [30], in 2023, no Spanish ports received any notification of alleged inadequacies of PRFs.
The principles for fee calculations are the same in every Spanish port, with a basis on Gross Tonnage and the number of passengers and crew [29], but each port has its own traffic characterization. Those common rules applied in the 46 Spanish commercial ports are crucial in investigating the main causes of economic imbalances.
According to the EU policy, when calling at port, any ship must pay an IFF irrespective of the amount of the delivered waste. Similarly to this basic principle, Spanish ports apply the same rule to ships to discourage discharges of waste to the sea. The fee is paid to the port and calculated both depending on ships’ Gross Tonnage (hereinafter, GT) and the number of passengers and crew on board, if it is a passenger ship. The mandatory payment of this fee gives the ship the right to deliver in the existent PRF at port 100 per cent of its oil waste (MARPOL Annex I) and 100 per cent of its solid waste (MARPOL Annex V). Paying just once, the delivery of waste can be made for the next seven days from the ship call. This fee includes the reception of solid hazardous waste (such as cooking oil or e-waste) if verified that this type of waste comes from operational activity of the ship.
The Spanish IFF is made up of two amounts, named R1 and R2, that must be calculated separately per ship. R1 is related to the GT, and R2 depends on the number of passengers and crew on board, applying only to passenger ships. Thus, R1 applies to any vessel but R2 applies exclusively to passenger ships, in addition to R1. A passenger ship must pay the R1 amount plus the R2 amount; a non-passenger ship pays only the R1 amount depending on the GT but without distinguishing between the different types of cargo vessels. At present, in the Spanish CRS, R1 is bigger for non-passenger ships, as is shown in Table 2, which includes the amounts of the two fee components R1 and R2 in the Spanish CRS.
Table 2.
Basic amounts to apply to the coefficient by GT sections (R1) and passengers (R2).
Calculating the part of the fee that comes from component R2 is easily inferable: it is needed to apply the present R2 basic amount (EUR 0.25) to the total number of passengers or crew declared in the call by passenger ships.
The coefficient to be applied to the R1 basic amount linked to the vessel’s GT and currently set at EUR 75 (passenger ships) or EUR 80 (non-passenger ships) must be calculated according to four GT sections provided for in the Spanish fee system. The four GT sections table, shown as Table 3, is applicable in the 46 ports by the 28 port authorities to 100% of the vessels. It allows the calculation of the R1 part of the fee by multiplying the coefficient obtained according to the right side of Table 3 to the R1 basic amount (EUR 75 or EUR 80) after associating the ship size with one of the four GT sections.
Table 3.
Calculation of the coefficient to be applied to the R1 basic amount, per GT section.
Some examples of calculation of R1 related to the GT and the R2 amount related to the number of passengers and crew on board to obtain the IFF to be paid by a ship are given as follows:
- A 24,000 GT passenger ship with 150 passengers and 45 crew members is associated to the GT section of 2501 GT − 25,000 GT (Table 3). This ship must pay the following to the port:R1 = (6 × 0.0001 × 24,000 GT) × EUR 75 (R1 basic amount for passenger ships) = EUR 1080R2 = (150 passengers + 45 crew members) × EUR 0.25 (R2 basic amount) = EUR 48.75R1 + R2 = EUR 1080 + EUR 48.75 = EUR 1128.75 = Total IFF
- For a 95,000 GT container ship, there is no R2. The IFF to be paid by the ship to the port is as follows:R1 = (1.2 × 0.0001 × 95,000) + 12 = 23.4, then 23.4 × EUR 80 (R1 basic amount) = EUR 1872 = Total IFF
Applying the same methodology, it follows that any ship with more than 100,000 GT would pay the same IFF, that it is to say, EUR 1920, given that it is considered that the increase in Gross Tonnage from 100,000 units does not significantly affect the volume of waste delivered, a rule that is consistent with the argument that large cargo vessels that are usually manned with a small crew barely discharge solid waste if we compare the waste unloaded with the ship’s GT.
The key decision to reduce costs for a cruise company choosing one or another Spanish port of call is not needed since the system is common for all Spanish ports, where the calculating rules are the same with the sole exception of the decision that port authorities may take to apply corrective coefficients to remedy the deficit that has been occurring in previous years, as will be seen in the Results section.
Regarding the impact of the waste reception costs, a database search was carried out for scientific articles discussing the general concern about waste from ships and the specific issue using the phrase “cruise ships and solid waste” [20,21,22,23,24,25,26,27,28].
The Transparency Portal of the Spanish Government publishes information related to annual accounts and audit reports from public companies, as well as economic and budgetary information [31]. Port authorities are obliged by the Spanish Law of Transparency to annually publish their accounts. The descriptive statistic method was used to calculate financial deficits and surpluses obtained in this port service in 2022 and 2023, per port, by comparing revenues from IFFs with payments to providers of the service [31]. As an essential step in the research, the distortion correction coefficients that the Spanish legal framework allows port authorities to use were individually identified and removed. These correction coefficients are set by some port authorities to balance totally or partially the economic system, increasing the IFF by a maximum percentage of 1.30 over the standard IFF [32]. After this adjustment, real revenues from fees paid by ships in Spanish ports were obtained. This allows calculating the true and effective imbalances in the WRS.
The observational study of statistics in Spanish ports holding the first positions in different traffic types will lead to drawing conclusions, relating the real imbalances in 2022 and 2023 (that is, the distortion-free results calculated in the previous stage) with each port authority traffic mix in the same period. The most recent statistics published at the date of the study [33] for each type of cargo and passenger traffic in each Spanish port authority were analyzed and sorted. For solid bulk, liquid bulk, general cargo, containers, roll-on/roll-off (hereinafter, RORO, related to ships where cargo is driven onboard in trucks) and fishing, a classification has been made by the port authority using the operated tons [33,34]. For passenger traffic (cruise and ferry), the classification has been made by the port authority using the number of cruise and ferry passengers.
This research also used the ratio of crew members per passenger [35], the evolution of waste discharges [36] and data from the Spanish Registry of Port Services Providers [37] to analyze the number of PRF operators that provide the WRS in the Spanish port system.
In order to delve deeper into the problem of waste generated by cruise ships and the differences between home port and transit, the contributions of home port and transit cruise passengers were calculated in the main ports with cruise traffic [38,39,40,41]. The average ferry passengers and the distances of the ferry routes starting from or arriving to Spanish ports were measured to relate real imbalances in ferry ports with journeys to North Africa or inter-island in the Balearic and Canary Islands.
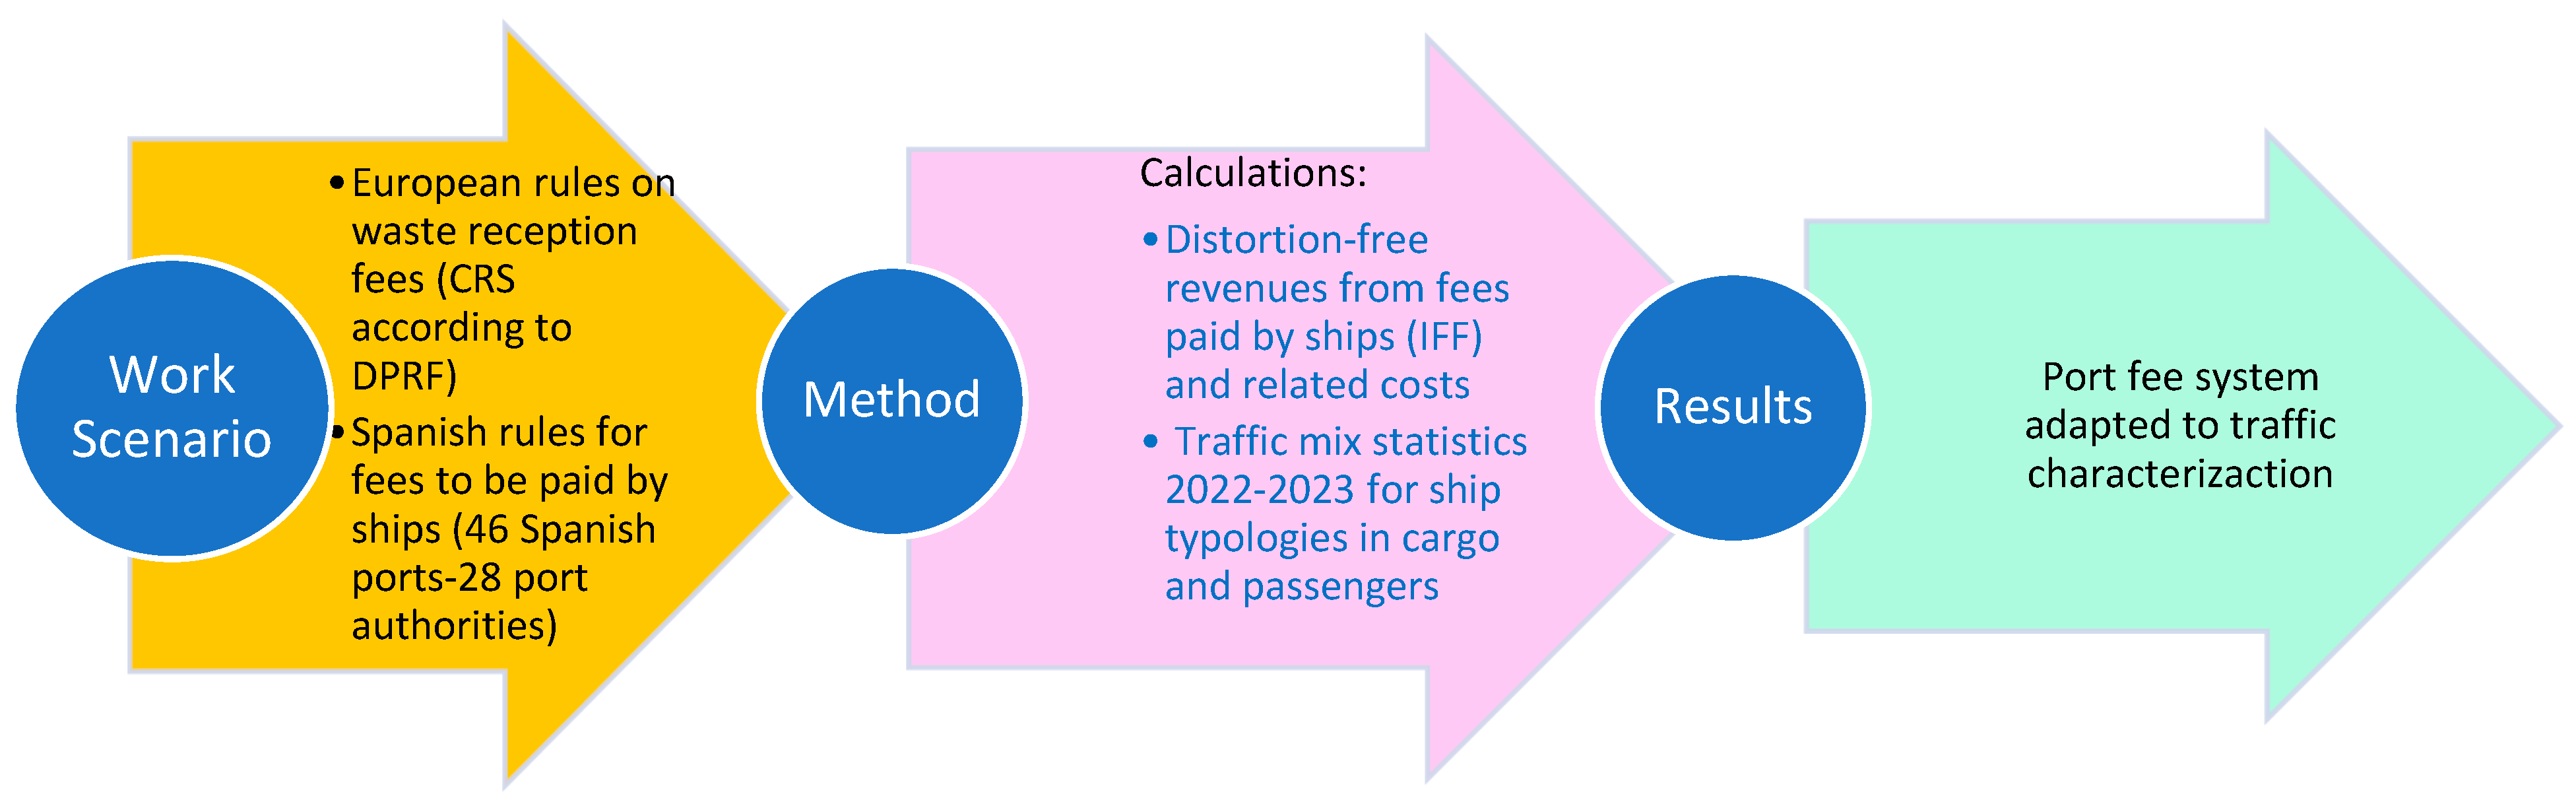
The following Figure 1 expresses the main concepts that were used and the sequential scheme of analysis.
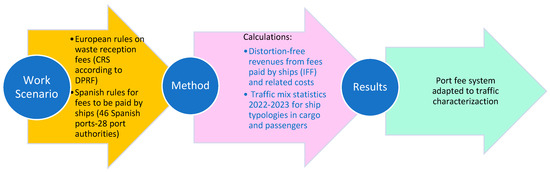
Figure 1.
Research methodology.
3. Results
3.1. Exploring Imbalances in the Port WRS and the Cost Recovery System
Table 4 shows data extracted per port authority [31] with annual revenues from IFFs paid by ships and reception costs paid to PRF operators. It also includes a prior calculation of WRS results, with Melilla as an exception since the service is not provided in that port due to lack of demand.
Table 4.
Fees paid by ships, reception costs and public results from the CRS in Spanish ports in 2022–2023.
The real port revenues from IFFs removing any distortion are shown in Table 5, where the real deficit and surplus by the port authority is also calculated. The Melilla port does not present financial data because there are no providers in this port, and exceptional deliveries of waste from ships are carried out by the port authority with its own equipment.
Table 5.
Distortion-free results from the CRS in Spanish ports in 2022–2023.
Table 6 shows that most ferry passengers in Spanish ports travel from Algeciras to North Africa or in inter-island routes in the Balearic Islands on journeys lasting no more than 2 h. However, in the case of Barcelona, the routes to Italian or North African ports are longer and take more than 12 h of navigation, even reaching 24 h to ports such as Nador (North Africa).
Table 6.
Ferry routes from/to the Spanish ports with main imbalances in the WRS.
Table 7 shows the totals, the means and the specific traffic data in the five port authorities with the greatest economic imbalances from the WRS after removing distortions in the assessment. The ranking position in 2022 and 2023 in container, RORO, ferry and cruise traffic is included among the port authorities that group the 46 Spanish commercial ports, excluding Melilla since there are no PRFs and the WRS is not provided there.
Table 7.
Ranking of Spanish ports operating container, RORO, cruise and ferry traffic (2022–2023).
3.2. Average Cost of Reception and Treatment in Spanish Ports
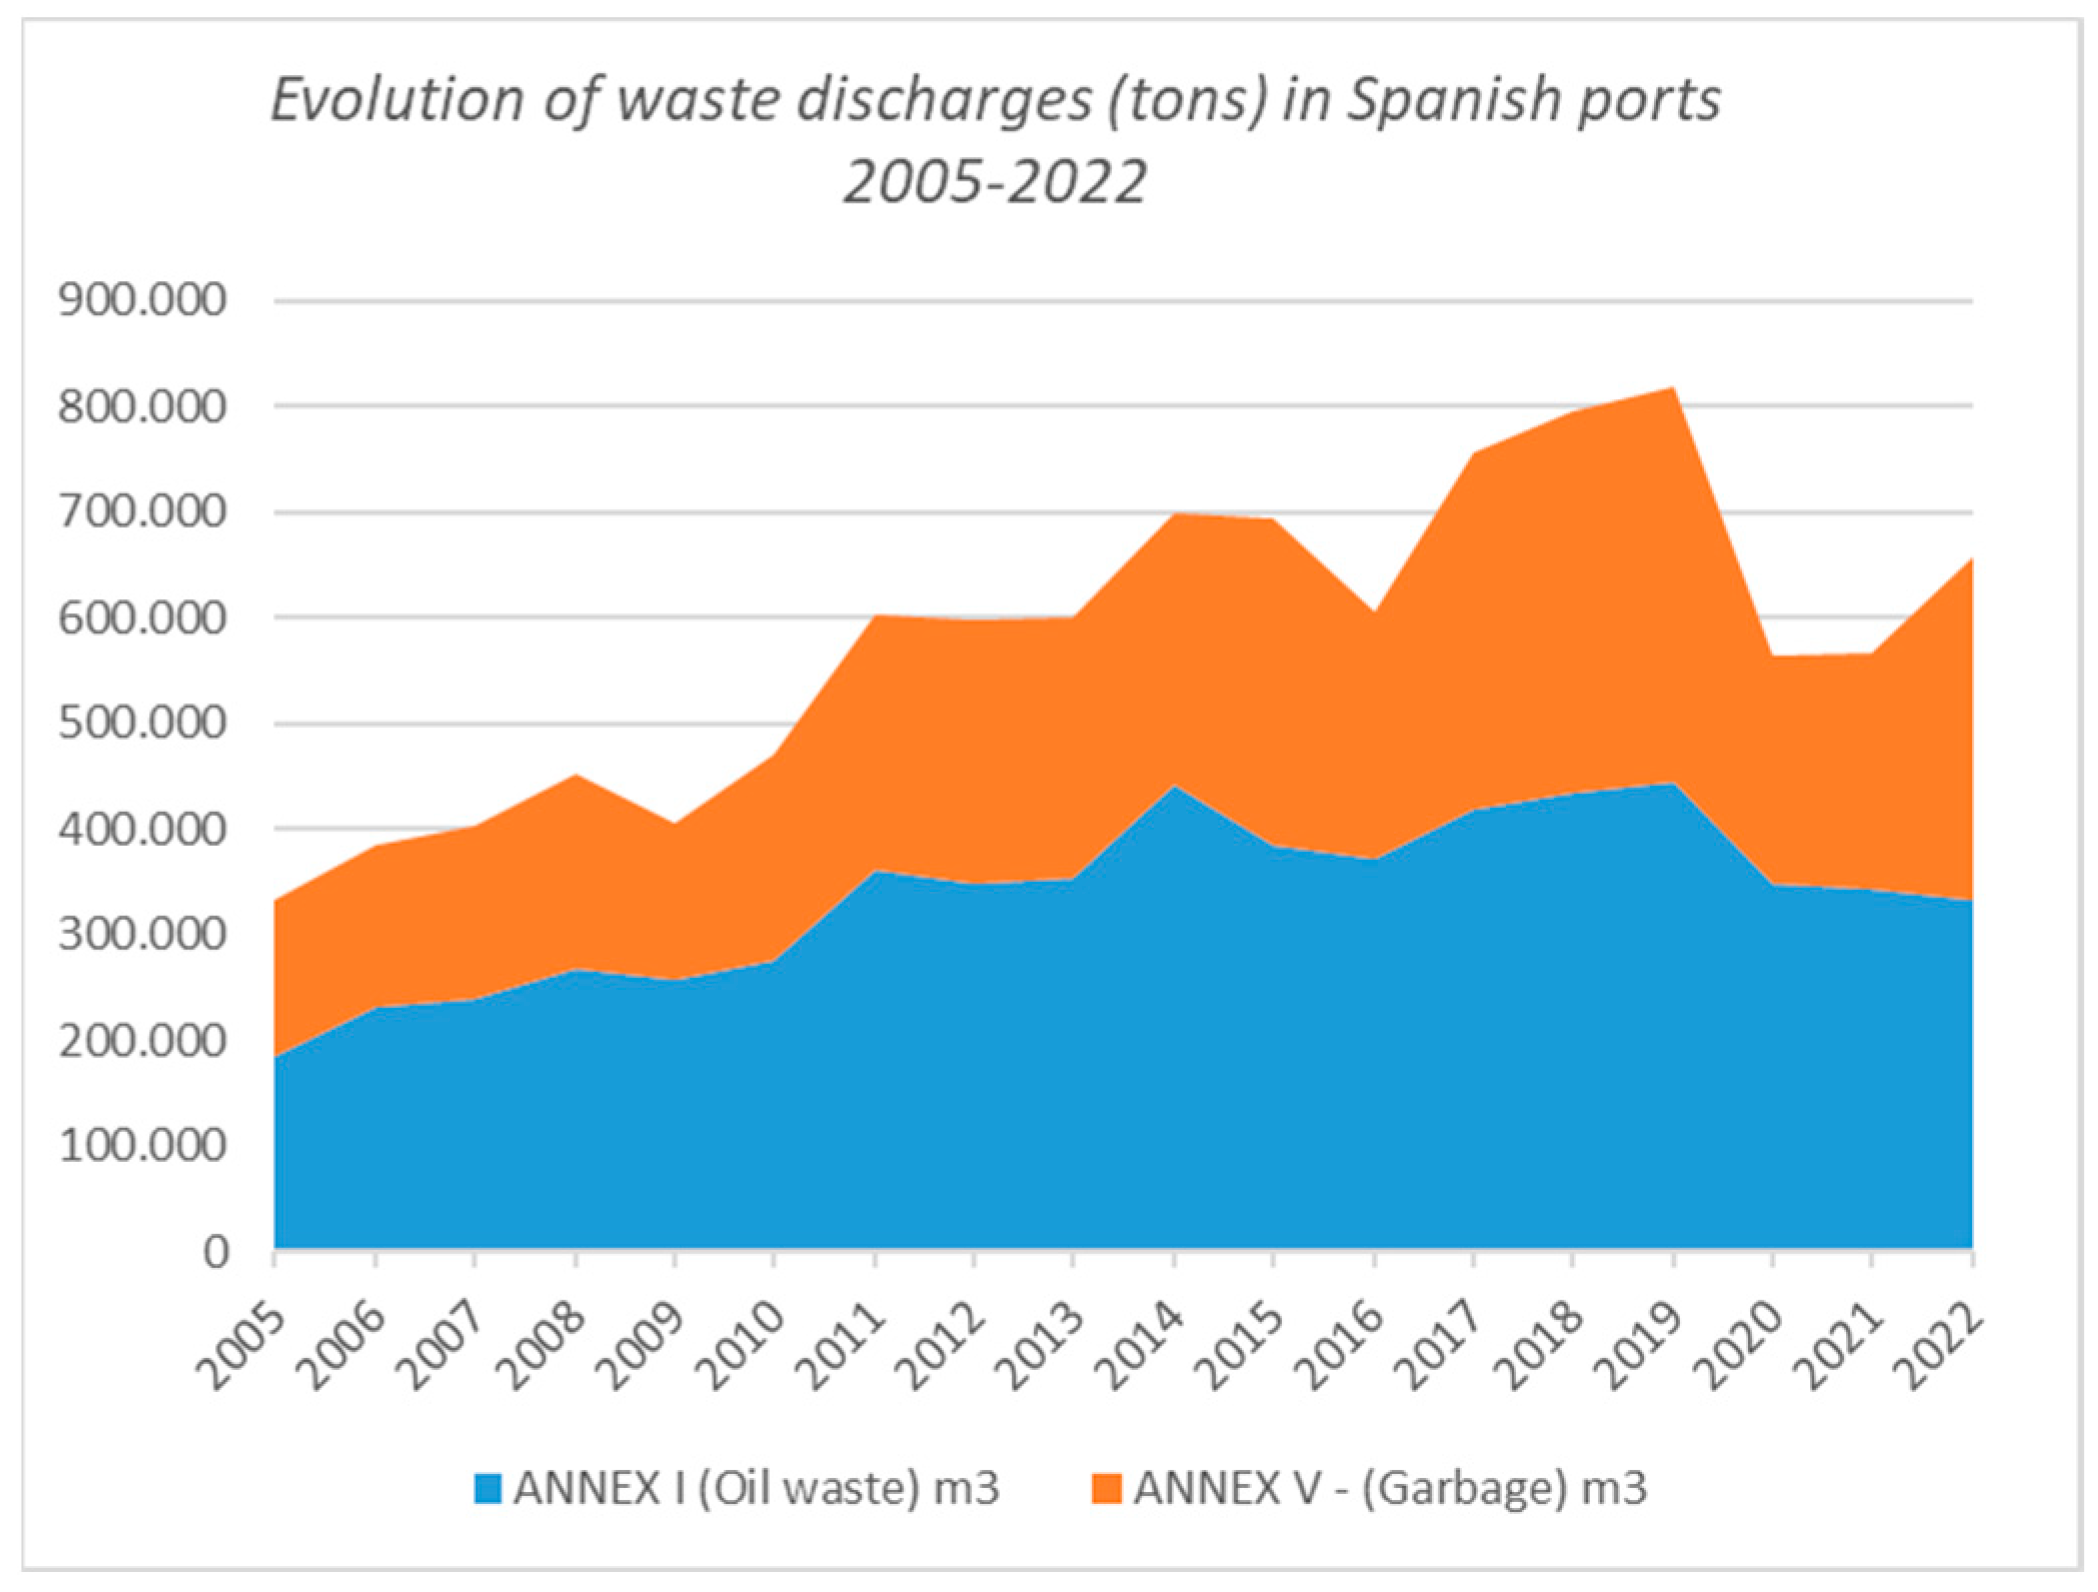
As for the average cost of reception and treatment paid by Spanish ports to PRFs in the WRS, Figure 2 shows the volumes of waste delivered from 2005 to 2022.

Figure 2.
Evolution of waste discharges in Spanish ports in the period 2005–2022.
Since the direct costs of waste treatment in Spanish ports were, in 2022, according to the previous section, EUR 36,018,462, and the total volume of waste discharged for MARPOL Annex I and Annex V covered by the IFF in this port system was 547,592 cubic meters, the resulting average cost of reception and treatment paid by ports to PRF operators is EUR 65.78 per cubic meter.
4. Discussion
The scientific rigor expected to obtain conclusive results in the WRS per port authority must consider that there is a biased effect on information about the service from Table 4 that demands to be corrected to obtain effective results (Table 5). The biased effect is due to the use by some port authorities of correction coefficients applicable to the fees [32] according to a procedure that is legally allowed by Spanish port law to mitigate port deficits in the CRS [29]. To remove any distortion in the research about the causes of imbalances, it is needed to correct any impact caused by these correction coefficients.
The data without distortions in Table 5 anticipate some phenomena in the WRS provision linked to the traffic and type of vessels extracted from real statistics that were analyzed and compared per traffic typology and port authority.
According to the findings shown in Table 5, and as developed in the ranking positions in the four different traffic types in Table 7, at the extremes of the real WRS surpluses, there are the ports with the highest volumes of tons operated by container and RORO ships and with the highest number of ferry passengers in the Spanish port system in short routes (Bahía de Algeciras, Valencia and Baleares). Container and RORO cargo handled a mean 95.39 per cent of the total general cargo tons and 41.12 of the total cargo operated in the Spanish port system in 2023; that was 543,307,746 tons [33].
On the other hand, at the extremes of the real WRS deficits, there are the ports with the highest number of ferry passengers in long routes (as seen in Table 6) and the highest number of cruise passengers, especially in those where the contribution of passengers in the home port is greater, such as the Barcelona port.
Addressing ferry passenger traffic, these passengers travel in routes that only exceed 100 nautical miles in the routes between Barcelona and Balearic, Italian or North African ports, and some scarce routes between Valencia and North Africa and the Canary Islands south of the Iberian Peninsula.
Except for the Barcelona port and as detailed in Table 6, most ferry passengers in Spanish ports travel from Algeciras to North Africa or on inter-island routes in the Balearic Islands on journeys of less than two hours where the generation of solid waste per passenger is in most cases insignificant, but the WRS fee that ships have to pay per passenger is the same for all routes and types of passenger traffic, causing a surplus on short journeys.
Regarding cruise traffic, the Barcelona port is the first port regarding the number of passengers via cruise ship (3,568,901 passengers in 2023) that traveled with Barcelona as the home port at 53.43 per cent [38]. Thus, 1,906,857 passengers began or ended their cruise routes in Barcelona in 2023. The economic impact of cruise activity in Barcelona, especially as a home port, is outstanding in the WRS: Barcelona had a relevant deficit in 2022, although smaller in 2023, despite being the third port in tons operated by container ships and the fourth in RORO traffic. Barcelona is the first Mediterranean port in Spain both in terms of supplying ships with goods and in the supply of fuel to ships [33], which expresses its importance as a home port for large cruise ships and also includes the discharge of waste as a basic operational activity during the call.
The two port authorities in the Canary Islands present, similarly to Barcelona, a real deficit in the WRS. These are the Las Palmas port authority [39] (which includes the Arrecife, Puerto Rosario, La Hondura and Las Palmas ports) and, to a lesser extent, the Santa Cruz de Tenerife port authority [40] (with the Santa Cruz de Tenerife, Los Cristianos, San Sebastián de la Gomera, Santa Cruz de la Palma and la Estaca ports), being Spain’s third and fourth port authorities in number of cruise passengers, respectively.
The Baleares port authority (with the Palma, Alcudia, Mao, Eivissa and la Savina ports) holds the second place in number of cruise passengers, but not with a Balearic port as the origin or destination due to that cruise passengers in these islands are only 31.25 per cent of the time beginning or ending their routes in Baleares, that is, 787,294 passengers [41]. Furthermore, a deficit in the Balearic Islands from cruise activity (that is mostly in transit, triggering lower costs than cruise passengers in home ports) would be largely offset by the ferry passenger and RORO cargo traffic, where this port authority has a comfortable first position in the number of ferry passengers (7,372,113 passengers) and RORO tons in 2022 and 2023 (13.39 and 13.97 million tons), also being the first as to RORO intermodal transport units and the first with respect to the contribution of RORO traffic to general cargo.
Since the results show that the surpluses are related to the ports with a greater GT from container, RORO and ferry passenger traffic in short routes (Algeciras, Valencia and Baleares), to balance the fee system, it is necessary to consider a decrease in the WRS first-fee component based on GT (named R1) for container and RORO cargo ships, simultaneously solving the surplus from the second-fee component (named R2) based on the number of passengers and crew from ferry passenger traffic in short routes and the deficit from cruise traffic, especially in home ports. The high ratio of crew members per passenger in cruise ships (0.40 crew members per passenger) is an added element that increases waste discharges, boosting deficits in the WRS for cruise traffic.
Based on the previous section, to minimize the economic imbalances in individual ports, in any global port system, a CRS with a broader typology of fees must be considered for the calculation of the mandatory rates to be paid by ships to ports according to the EU policy on WRS.
The proposed typologies implemented in Table 8 are settled on the GT and number of passengers and crew basic amounts (R1 and R2, respectively), to which the same calculation rules currently applicable in Spanish ports are suitable to be applied. The total amount to be paid by a ship to the port depending on its typology is the result of adding the R1 fee component plus the R2 fee component.
Table 8.
Proposed WRS fee system by ship categories.
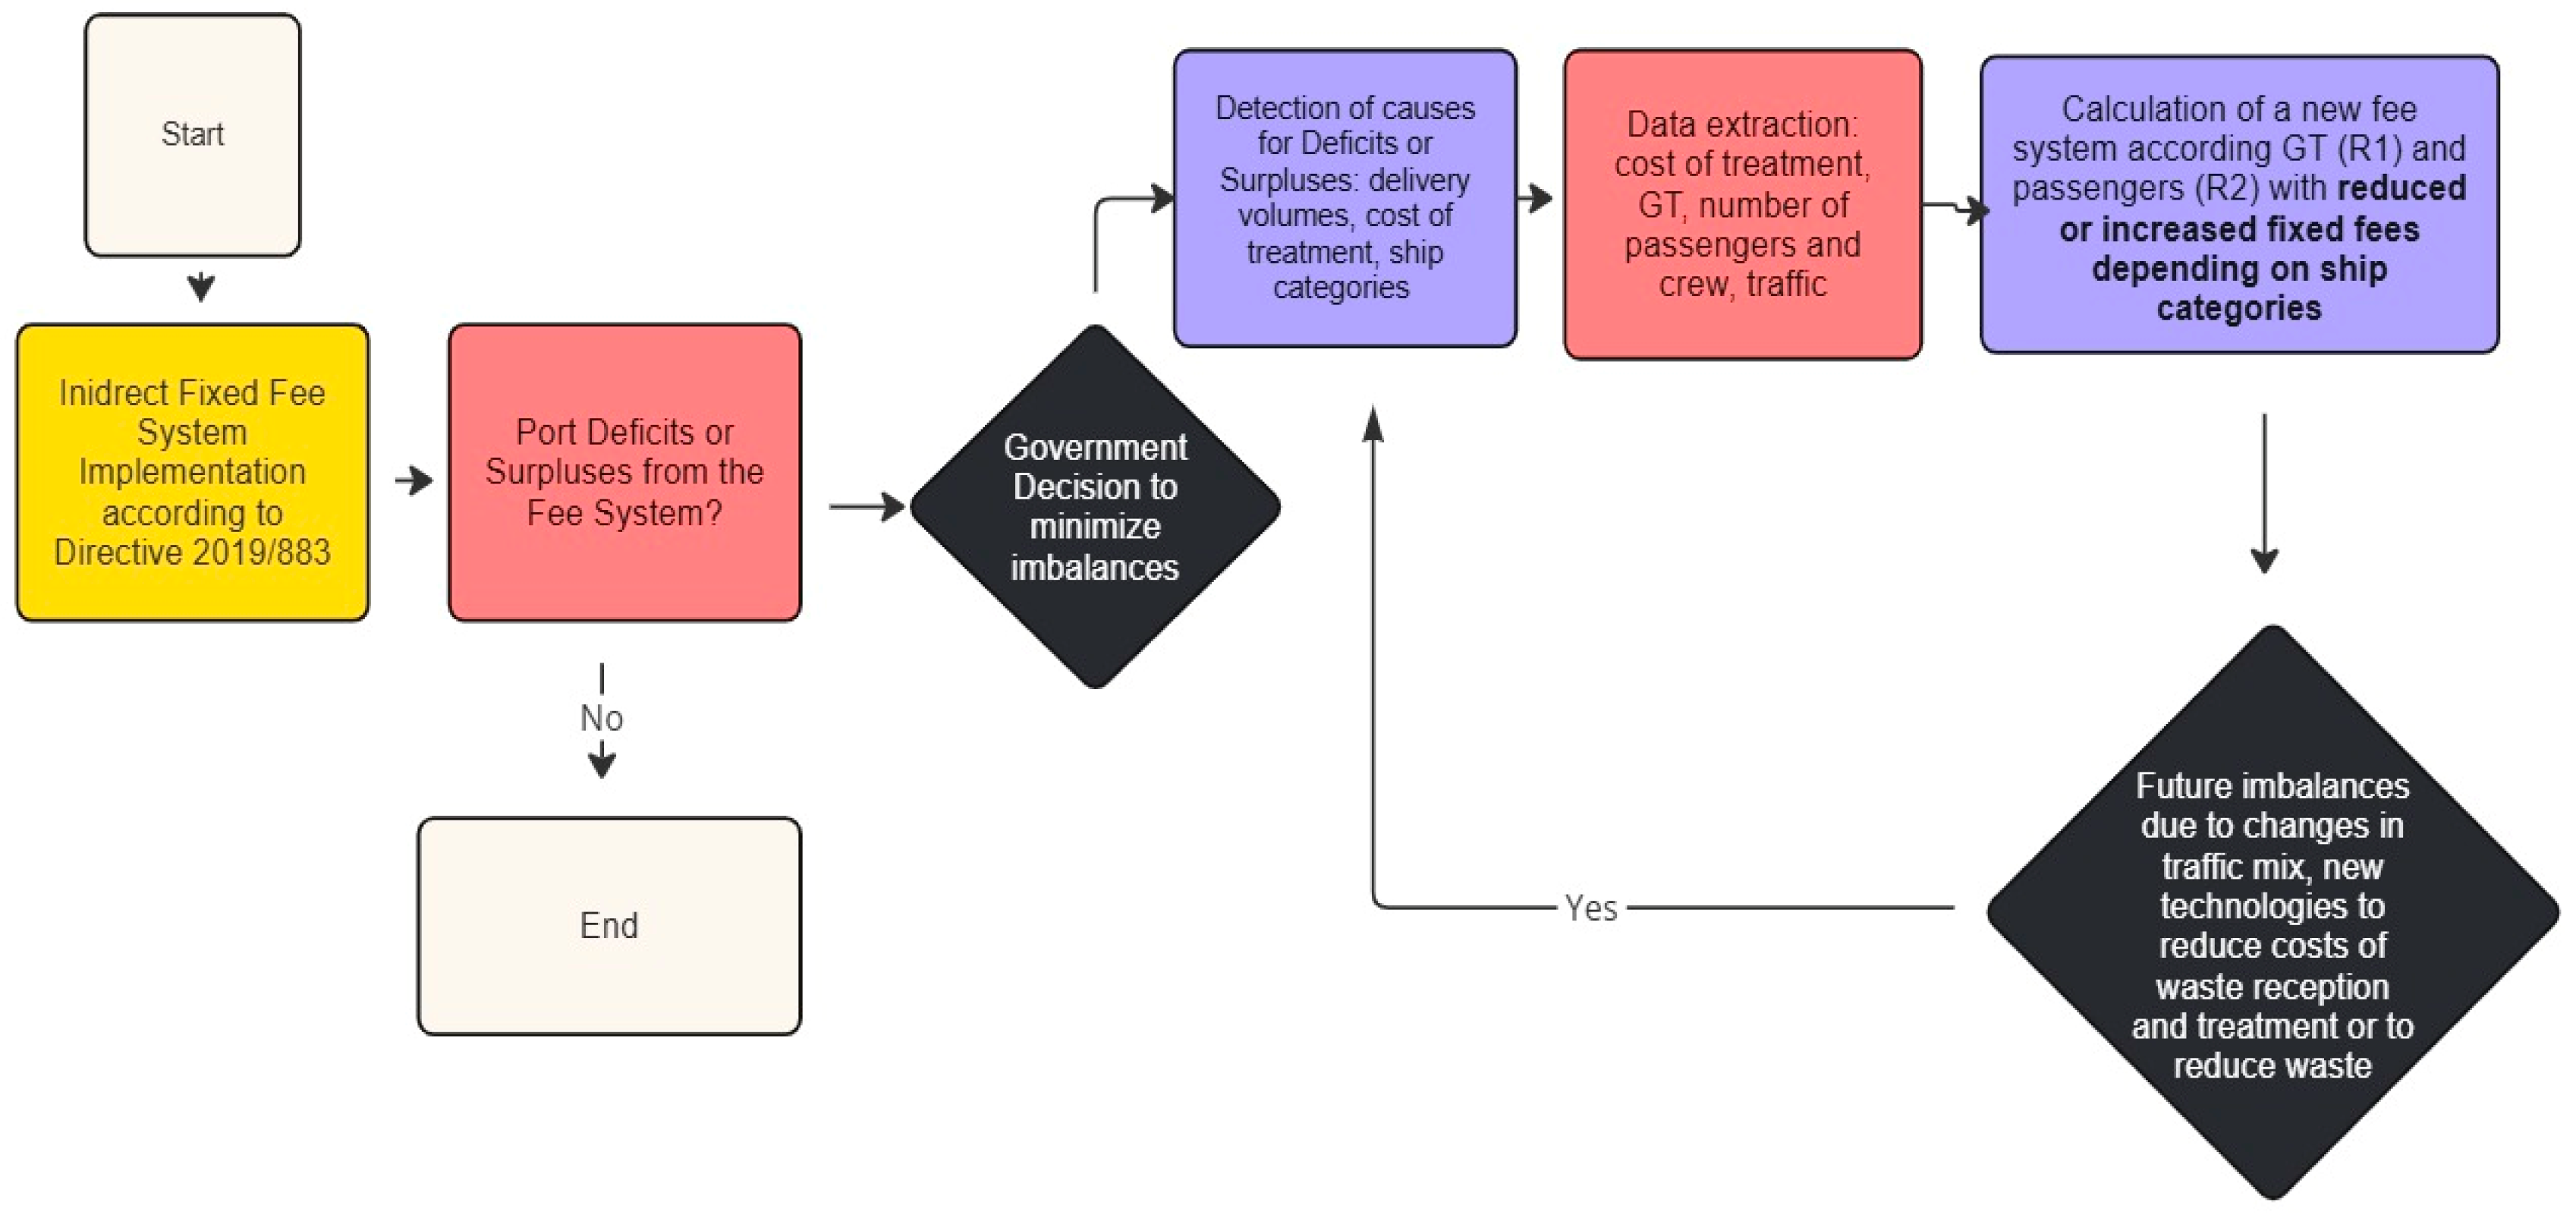
The flowchart in Figure 3 expresses the process that would allow the WRS fees to be periodically adapted to changes in the traffic mix, the ship waste deliveries, the cost structure or new technologies applicable to the WRS.

Figure 3.
Process flowchart to implement a fee system without imbalances.
In 2023, there were 115 companies operating the WRS service in the 46 commercial ports in Spain competing for the service. Waste volumes covered by the mandatory fees paid by ships to ports led to calculating the average cost of the WRS service per cubic meter in 2022 in Spanish ports. The resulting cost obtained was EUR 65.78 per cubic meter of MARPOL Annex I and Annex V discharged in 2022. Regarding oil waste from MARPOL Annex I, fluctuations in the price of fuel affect the cost of reception and treatment, given that the decantation processes developed for oil waste partially allows the resulting product to be reused as fuel. On the other hand, the costs of reception and treatment per solid waste unit from MARPOL Annex V are more stable. The calculation of this average cost will allow the potential application of the findings in ports where the average cost per cubic meter in the WRS is higher or lower than the average cost of reception in the Spanish port system.
A small surplus in the WRS could be considered in the CRS with the aim of covering possible indirect costs from the service, the risk of waste spills in the port area or investments to improve it, such as technological systems, statistical analysis or costs to monitor the PRF activity, but the CRS’s goal should not be to generate a financial surplus to the port. Conversely, a WRS deficit can threaten the economic sustainability of the port or the port system.
The outlook of the Spanish government to establish sustainable fees viable to the port authorities and ship operators includes a review of the current CRS in accordance with the DPRF, which is expected to be implemented in 2026.
5. Conclusions
According to the European DPRF, ports must ensure PRFs with the capacity to receive the types and quantities of waste from ships normally using the port to avoid discharges at sea, taking into account the operational needs of the port users. In line with this requirement, the DPRF obliges the vessels to pay a fee irrespective of the volume of waste that they deliver with the aim of recovering the effective cost paid by ports to the PRF operators to provide a quality WRS.
The DPRF expressly admits the possibility of applying different fees depending on the type of ship but does not provide instructions on how to design a fee system adapted to the characteristics of maritime traffic and ship deliveries.
The current CRS applied in Spanish ports fulfills the essential principles of the DPRF and has been applied to port authorities and ships since 2011, but it requires adjustment to minimize port authorities’ imbalances calculated without distortions to match with the traffic characterization.
The fee system that makes the WRS sustainable for the port keeps the basis on the Gross Tonnage of ships and the number of passengers and crew on board as an objective, which are suitable and available criteria, but any CRS according to the DPRF should be proportional to the effective reception costs by vessel category. The study of recent traffic data for a wide group of 46 ports grouped in 28 port authorities with common fee calculation rules combined with the analysis of the WRS results allows conclusions to be drawn separating container, RORO and ferry passenger traffic in short routes, that discharge a smaller volume of solid waste, from cruise ships, especially those operating in home ports, that generate greater volumes of operational waste at the expense of the economic sustainability of the EU port of call.
Author Contributions
Conceptualization, A.C.; Methodology, V.M.V.; Validation, A.C. and N.G.C.; Formal analysis, V.M.V. and N.G.C.; Investigation, V.M.V.; Data curation, N.G.C.; Writing—original draft, V.M.V.; Writing—review & editing, V.M.V. and N.G.C.; Visualization, A.C.; Supervision, A.C.; Project administration, N.G.C. All authors have read and agreed to the published version of the manuscript.
Funding
This research received no external funding.
Institutional Review Board Statement
Not applicable.
Informed Consent Statement
Not applicable.
Data Availability Statement
The original contributions presented in this study are included in the article. Further inquiries can be directed to the corresponding author.
Conflicts of Interest
The authors declare no conflicts of interest.
Abbreviations
| CRS | Cost Recovery System for the WRS by the DPRF |
| DPRF | Directive (EU) 2019/883 on PRF for the delivery of waste from ships |
| ESPO | European Sea Ports Organisation |
| ESSF | European Sustainable Shipping Forum |
| EU | European Union |
| GT | Gross Tonnage of ships |
| IFF | Indirect fixed fee introduced by Directive (EU) 2019/883 on PRFs |
| IMO | International Maritime Organization |
| MEPC | Marine Environment Protection Committee |
| MS | Member State |
| PRF | Port reception facilities |
| WRS | Waste reception service |
References
- Hussain, N.; Khan, A.; Memon, S. Addressing Marine Pollution: An Analysis of MARPOL 73/78 Regulations and Global Implementation Efforts. J. Soc. Sci. Rev. 2023, 3, 572–589. [Google Scholar] [CrossRef]
- Coleman Daukorude, S. Decarbonization of Shipping: An African Union Perspective. Master’s Thesis, World Maritime University, Malmö, Sweden, 2023. [Google Scholar]
- Yang, Z.; Lau, Y.Y.; Lei, Z. Analysis of pollution prevention performance of vessels in Southeast Asia: Implications towards vessel emission control and reduction. Ocean. Coast. Manag. 2024, 248, 106942. [Google Scholar] [CrossRef]
- Ehlers, P. A Success Story? Fifty Years of MARPOL. Int. J. Mar. Coast. Law. 2024, 1, 1–56. [Google Scholar] [CrossRef]
- International Maritime Organization. Index of IMO Resolutions. The IMO Register. 2023. Available online: https://www.imo.org/en/KnowledgeCentre/IndexofIMOResolutions/Pages/Default.aspx (accessed on 11 December 2023).
- International Maritime Organization. 2024. Available online: https://www.imo.org/en/MediaCentre/MeetingSummaries/Pages/MEPC-default.aspx (accessed on 13 December 2023).
- International Maritime Organization. 2024. Available online: https://www.imo.org/en/MediaCentre/PressBriefings/Pages/34-IMO-2020-sulphur-limit-.aspx (accessed on 20 December 2023).
- European Commission. Eur-Lex. Regulation (EU) 2023/957 of the European Parliament and of the Council of 10 May 2023 amending Regulation (EU) 2015/757 in Order to Provide for the Inclusion of Maritime Transport Activities in the EU Emissions Trading System and for the Monitoring, Reporting and Verification of Emissions of Additional Greenhouse Gases and Emissions from Additional Ship Types. 2024. Available online: https://eur-lex.europa.eu/legal-content/EN/TXT/?uri=CELEX%3A32023R0957 (accessed on 12 December 2023).
- European Commission. Eur-Lex. Directive (EU) 2023/959 of the European Parliament and of the Council of 10 May 2023 amending Directive 2003/87/EC Establishing a System for Greenhouse gas Emission Allowance Trading Within the Union and Decision (EU) 2015/1814 Concerning the Establishment and Operation of a Market Stability Reserve for the Union Greenhouse Gas Emission Trading System. 2024. Available online: https://eur-lex.europa.eu/legal-content/EN/TXT/?uri=CELEX%3A32023L0959 (accessed on 18 December 2023).
- European Commission. Eur-Lex. Regulation (EU) 2023/1804 of the European Parliament and of the Council of 13 September 2023 on the Deployment of Alternative Fuels Infrastructure, and Repealing Directive 2014/94/EU. 2024. Available online: https://eur-lex.europa.eu/legal-content/EN/TXT/?uri=CELEX%3A32023R1804 (accessed on 18 December 2023).
- European Commission. Eur-Lex. Regulation (EU) 2023/1805 of the European Parliament and of the Council of 13 September 2023 on the use of Renewable and Low-Carbon Fuels in Maritime Transport, and Amending Directive 2009/16/EC. 2024. Available online: https://eur-lex.europa.eu/legal-content/EN/TXT/?uri=CELEX%3A32023R1805 (accessed on 5 February 2024).
- European Directive 2005/35/EC of the European Parliament and of the Council of 7 September 2005 on Ship-Source Pollution and on the Introduction of Penalties for Infringements. Available online: https://eur-lex.europa.eu/legal-content/EN/TXT/?uri=CELEX:32005L0035 (accessed on 10 February 2024).
- EU Monitor. Amendment of Directive 2005/35/EC on Ship Source Pollution. 2023. Available online: https://www.eumonitor.eu/9353000/1/j4nvhdfdk3hydzq_j9vvik7m1c3gyxp/vm3kjzp3oryz (accessed on 10 February 2024).
- Argüello, G. Environmentally sound Management of Ship Wastes: Challenges and opportunities for European ports. J. Shipp. Trade 2020, 5, 12. [Google Scholar] [CrossRef]
- European Commission. Eur-Lex. Directive 2000/59/EC of the European Parliament and of the Council of 27 November 2000 on Port Reception Facilities for Ship-Generated Waste and Cargo Residues. 2023. Available online: https://eur-lex.europa.eu/eli/dir/2000/59/oj (accessed on 25 September 2024).
- European Commission. Eur-Lex. Directive (EU) 2019/883 of the European Parliament and of the Council of 17 April 2019 on Port Reception Facilities for the Delivery of Waste from Ships, Amending DIRECTIVE 2010/65/EU and Repealing Directive 2000/59/EC. 2023. Available online: https://eur-lex.europa.eu/legal-content/EN/NIM/?uri=celex:32019L0883 (accessed on 25 October 2024).
- European Sea Ports Organization. The ESPO Register. 2023. Available online: https://www.espo.be/ (accessed on 25 October 2024).
- European Commission. Legislation. Feedback from: European Sea Ports Organization (ESPO). 2023. Available online: https://ec.europa.eu/info/law/better-regulation/have-your-say/initiatives/12185-Sustainable-management-of-onboard-ship-waste-EU-incentive-scheme/F2749101_en (accessed on 10 October 2023).
- Regulation (EU) 2017/352 of the European Parliament and of the Council of 15 February 2017 establishing a framework for the provision of port services and common rules on the financial transparency of ports (Text with EEA relevance). 2023. Available online: https://eur-lex.europa.eu/legal-content/EN/TXT/?uri=CELEX%3A32017R0352 (accessed on 10 October 2023).
- Dixon, D.; Hughes, G. Coastal Cruise Ship Waste Management. Mar. Technol. SNAME News 2000, 37, 216–222. [Google Scholar] [CrossRef]
- Sanches, V.L.; Aguiar, M.R.D.C.M.; de Freitas, M.A.V.; Pacheco, E.B.A.V. Management of cruise ship-generated solid waste: A review. Mar. Pollut. Bull. 2020, 151, 110785. [Google Scholar] [CrossRef]
- Chou, M.T.; Huang, C.J.; Hsu, C.T.; Kang, C.K.T. Environmental, economic, and social impacts of cruise development. Mar. Pollut. Bull. 2024, 209, 117279. [Google Scholar] [CrossRef]
- Wang, S.; Zhen, L.; Zhuge, D. Dynamic programming algorithms for selection of waste disposal ports in cruise shipping. Transp. Res. Part B Methodol. 2018, 108, 235–248. [Google Scholar] [CrossRef]
- Di Vaio, A.; Varriale, L.; Trujillo, L. Management Control Systems in port waste management: Evidence from Italy. Util. Policy 2019, 56, 127–135. [Google Scholar] [CrossRef]
- Deja, A.; Kabulak, P.; Kaup, M. Analysis of waste collected from passenger-cargo ferries at the port of Świnoujście. Int. Multidiscip. Sci. GeoConference SGEM 2018, 18, 1079–1086. [Google Scholar]
- Lau, Y.Y.; Kawasaki, T.; Guan, J.; Not, C. An investigation into the attitude and behaviours of ferry passenger towards general waste management. Ocean Coast. Manag. 2021, 213, 105879. [Google Scholar] [CrossRef]
- Perez, I.; González, M.M.; Jiménez, J.L. Size matters? Evaluating the drivers of waste from ships at ports in Europe. Transp. Res. Part D Transp. Environ. 2017, 57, 403–412. [Google Scholar] [CrossRef]
- Butt, N. The impact of cruise ship generated waste on home ports and ports of call: A study of Southampton. Mar. Policy 2007, 31, 591–598. [Google Scholar] [CrossRef]
- Spanish Ministry of Development. Real Decreto Legislativo 2/2011, de 5 de Septiembre, por el que se Aprueba el Texto Refundido de la Ley de Puertos del Estado y de la Marina Mercante. 2011. Available online: https://webaccounts.imo.org/Common/WebLogin.aspx?App=GISISPublic&ReturnUrl=https%3a%2f%2fgisis.imo.org%2fPublic%2fShared%2fPublic%2fLogin.aspx&error_message=interaction_required (accessed on 5 August 2024).
- International Maritime Organization. The GISIS Register. 2023. Available online: https://gisis.imo.org/Members/Default.aspx (accessed on 11 November 2023).
- Spanish Government. Cuentas Anuales e Informes de Auditoria—Información Económico-Presupuestaria—Publicidad Activa—Portal de la Transparencia de la Administración del Estado. España. 2023. Available online: https://transparencia.gob.es/transparencia/transparencia_Home/index/PublicidadActiva/Presupuestaria/Cuentas-anuales-informes-auditoria.html (accessed on 1 August 2024).
- Spanish Government. Ley 22/2021, de 28 de Diciembre, de Presupuestos Generales del Estado para el Año 2022. 2021. Available online: https://www.boe.es/buscar/act.php?id=BOE-A-2021-21653 (accessed on 8 August 2024).
- Spanish Ministry of Transport and Sustainable Mobility. Ports of Spain. Statistics. 2024. Available online: https://www.puertos.es/es-es/estadisticas/Paginas/estadistica_mensual.aspx (accessed on 5 August 2024).
- Spanish Ministry of Transport and Sustainable Mobility. Ports of Spain. Rest of Statistics. 2024. Available online: https://www.puertos.es/en/data/statistics/monthly (accessed on 3 October 2023).
- Permanent Observatory of the Spanish Port Services Market. Available online: https://observatorio.puertos.es/paginas/index.aspx (accessed on 1 September 2024).
- Spanish Ministry for the Ecological Transition and Demographic Challenge. Estrategias Marinas de España. 2023. Available online: https://www.miteco.gob.es/en/costas/temas/proteccion-medio-marino/estrategias-marinas/eemm_eemmespana.html (accessed on 10 October 2023).
- Spanish Ministry of Transport and Sustainable Mobility. Ports of Spain. General Registry of Service Providers. Available online: https://www.puertos.es/servicios/comunidad-portuaria/registro-general-de-empresas-prestadoras-de-servicios (accessed on 10 October 2024).
- Previsión de Cruceros. Available online: https://www.portdebarcelona.cat/es/negocio-y-servicios/cruceros/prevision-de-cruceros (accessed on 3 October 2023).
- Available online: https://www.palmasport.es/es/datos-estadisticos-pasajeros/ (accessed on 3 October 2023).
- Previsiones de Cruceros. Available online: https://www.puertosdetenerife.org/cruceros-previstos/ (accessed on 3 October 2023).
- Estadísticas APB. Available online: https://www.portsdebalears.com/es/estadisticas (accessed on 3 October 2023).
Disclaimer/Publisher’s Note: The statements, opinions and data contained in all publications are solely those of the individual author(s) and contributor(s) and not of MDPI and/or the editor(s). MDPI and/or the editor(s) disclaim responsibility for any injury to people or property resulting from any ideas, methods, instructions or products referred to in the content. |
© 2025 by the authors. Licensee MDPI, Basel, Switzerland. This article is an open access article distributed under the terms and conditions of the Creative Commons Attribution (CC BY) license (https://creativecommons.org/licenses/by/4.0/).