Abstract
Hydrogen energy’s economic efficiency is the key for China to obtain the goal of “carbon neutrality” by 2060. Different from the bottom-up methods and learning rate methods, this study estimates the hydrogen prices in China and typical regions by 2060 from the perspectives of economics and machine learning. The main factors influencing hydrogen price are determined from the perspectives of economics: hydrogen production, demand, and cost. A novel model is established based on combined machine learning models to predict hydrogen price. The hydrogen production is predicted based on the trained BP neural network model optimized by particle swarm optimization considering the uses of hydrogen. The hydrogen prices prediction model is built by applying a least squares support vector machine optimized by Bayesian optimization considering the hydrogen production, hydrogen demand, natural gas price, coal price, electricity price, and green hydrogen share. Moreover, the hydrogen prices in typical regions in China are compared with the average prices. The results show that the hydrogen price is estimated to decrease below CNY 12/kg and the hydrogen price in Northwest China will be lower than CNY 7.5/kg due to low electricity cost by 2060.
1. Introduction
Environmental issues and the energy crisis raised much concern in recent years. However, fossil fuels account for the majority of the global energy system. The transportation sector accounts for more than 20% of global CO2 emissions [1]. In recent years, China has been continuing to advance the achievement of the goal of “carbon peak” and “carbon neutrality” [2,3]. To attain these objectives, developing “green” vehicles to reduce CO2 emissions is crucial. The fuel cell vehicle (FCV) offers the benefits of zero emissions and rapid refilling. Moreover, the fuel cell can attain a greater thermodynamic efficiency compared to heat engines. So, China’s hydrogen energy and fuel cell vehicle industry has begun to develop rapidly under the promotion of domestic and foreign industrial situations and all parties. Hydrogen is relatively easy to produce [4,5] and it can be stored extensively for an extended duration. Furthermore, there are no direct carbon emissions during its conversion into electricity or thermal energy [6,7]. Therefore, hydrogen will be the key to the decarbonization of China and the global energy systems in the future [8,9,10,11].
A few years ago, the National Development and Reform Commission (NDRC) People’s Republic of China released a strategy for the development of hydrogen energy covering the period from 2021 to 2035, detailing the objectives of hydrogen energy development. Recently, many countries elevated hydrogen energy to a national strategic priority and developed particular policies [12]. By 2060, China will be the largest hydrogen market under the goal of “carbon neutrality”. The annual demand for hydrogen will grow up to over 100 million tons, four times that of 2020, and the proportion of final energy consumption will reach 20%. However, technological and economic challenges have become pain points in the development of the industry [13,14], which greatly limit the growth of the hydrogen economy [11,15]. From the technical aspects, hydrogen is easy to leak, and is flammable and explosive. Moreover, the density of hydrogen is low, making its storage and transportation challenging. From the economic aspects, the development of the hydrogen industry still needs financial and policy support to obtain a wide deployment. The cost of production, storage, and transportation is too high. For example, the hydrogen prices in USA, China, Japan, and Germany in 2019 are CNY 106.35/kg, CNY 60~70/kg, CNY 70/kg, and CNY 74.4/kg, respectively. The fuel cost per kilometer using hydrogen is much higher than that using gasoline and diesel. Therefore, the economic research of hydrogen price estimation is essential [16,17,18,19,20,21,22,23].
The hydrogen price is directly affected by the hydrogen cost and the hydrogen production cost is highly correlated with production technologies [24,25]. Lee et al. discussed various economic parameters that affect the levelized cost of hydrogen (LCOH) produced by alkaline water electrolysis (AWE), indicating that the unit electricity price is the most effective economic factor in determining LCOH [26]. Gerloff analyzed the impact of electricity prices on LCOH. The results show that the green hydrogen in 2030 and 2050 can be expected if electricity prices are below EUR 30/MWh and the LCOH decreases below EUR 2.88/kg [27]. Povacz et al. examined the levelized production cost for an electrolysis hydrogen production factory. The findings indicate that the cost is predominantly influenced by the capacity factor of the renewable electricity source and the total full load hours of the electrolyser [28]. Davis et al. considered mixing hydrogen with natural gas to reduce greenhouse gas emissions and compared various hydrogen production technologies in a cost analysis. Autothermal reforming with carbon capture technology can produce low-carbon and low-cost hydrogen [29]. Dodds made long-term cost estimation for various hydrogen production technologies. The levelized cost of hydrogen was applied and the potential impact of carbon taxes was considered. The results show that the best hydrogen production technology depends on technological advances, the availability and price of raw materials, and the required hydrogen purity [30].
Lux and Pfluger assessed the economic potential of hydrogen production and developed an electricity-based hydrogen supply curve for Europe by 2050. The results show that the marginal hydrogen production costs are over EUR 110/MWh under the European Commission’s long-term strategic vision [31]. Miyagawa and Goto summarized the existing studies on the estimation of hydrogen production cost. A total of 174 samples were collected from the publications from 1979 to 2020 and the samples were assessed by the non-parametric testing [32]. Brändle et al. estimated the cost of hydrogen produced from different sources by 2050, such as renewable energy (wind energy and solar energy) and fossil fuels (natural gas). The findings indicate that natural gas reforming plus carbon capture and storage will emerge as the most economical method to produce hydrogen with low carbon emissions from 2020 to 2030. If capital costs drop substantially, producing hydrogen from renewable energy will achieve a good economical standing from 2030 to 2050 and a minimum cost of USD 1.5/kg by 2050 [6]. Lane et al. built a model to forecate the market share of hydrogen produced from renewable energy for the period 2025–2050. The model was built based on the learning curve methodology. The findings indicate that there are three factors influencing hydrogen market by 2050, including electricity cost, biomass cost, and gasifier cost [33]. Lemus and Duart predicted the hydrogen cost in the future, taking into account the carbon emission taxations. The findings suggest that biomass and biofuels are the alternative energy sources nearest to parity in the energy system [34]. George et al. performed a comprehensive cost study for Germany until 2050. The findings indicate that blue hydrogen is poised to become the most economical alternative [15]. Frieden and Leker selected 832 articles on the hydrogen cost research between 2004 and 2024. By 2050, the costs of hydrogen produced by electrolysis is expected to fall to USD 2.93/kg and the hydrogen cost in Asia (USD 1.95/kg) is lowest [35].
Regarding regional varitions, Zhang et al. assessed the levelized hydrogen production cost in different provinces of China. The carbon emissions cost was considered. The results demonstrate that the levelized cost of hydrogen ranges from USD 3.506 to 6.785/kg [36]. Bolz et al.’s analysis shows a substantial correlation between the national level and the adoption of the hydrogen economy [37]. From the quantitative review of Frieden and Leker [35], it can be found that the methods applied for the hydrogen cost prediction mainly include the bottom-up method and learning rate method. The bottom-up method is applied to translate technical parameters underlying the product and production process into technology cost and the learning rate indicates the reduction rate in the forecast item for each doubling of the learning factor [38]. However, there are few studies on the prediction of hydrogen prices based on historical data and the influencing factors of hydrogen price using machine learning methods. Moreover, the regional variations are less considered, considering that China’s hydrogen energy and fuel cell industries developed relatively late, and the data sample size that can be used for prediction is small. For the machine learning on a small sample size, Hong et al. analyzed the factors associated with college students’ addiction based on a machine learning model [39]. Liu et al. developed an artificial neural network (ANN) model by applying Gaussian negative log-likelihood (GLL) functions as the training loss [40]. Gogas et al. pointed out that algorithms such as support vector machines (SVM) and random forests allowed the application of machine learning to relatively small data sets [41]. Kokol et al. reviewed the machine learning on small sample sizes. The problems of forecasting and prediction are included in the most affected areas. The results show that the small data sample challenge can be solved with deep learning and SVM [42].
In this study, a novel model is built to estimate hydrogen price in China by 2060 based on combined machine learning models. The hydrogen prices prediction model is built from the perspectives of economics and machine learning. The hydrogen production, hydrogen demand, and hydrogen cost are considered. First, the costs of main hydrogen production technologies in China are introduced. Second, the factors affecting hydrogen production are analyzed considering the use of hydrogen, including the number of FCV, synthetic ammonia production, methanol production, gasoline production, and diesel production. The hydrogen production is predicted by the trained BP neural network. The particle swarm optimization (PSO) algorithm is applied to search the best hyperparameters of the BP neural network. Finally, the hydrogen price prediction model is established considering that the hydrogen price is mainly determined by the hydrogen production, hydrogen demand, and hydrogen cost. The hydrogen price by 2060 is predicted by the trained least squares support vector machine (LSSVM) optimized by Bayesian optimization (BO).
2. Costs of Technologies
According to the different production processes and raw materials, hydrogen production is categorized into gray hydrogen, blue hydrogen, and green hydrogen. Grey hydrogen is produced from fossil fuels, resulting in significant carbon emissions. Blue hydrogen is produced from fossil fuels and carbon emissions are reduced through carbon capture technology. Green hydrogen is produced from renewable energy sources and there are no carbon emissions during the whole process. Green hydrogen mainly comes from water electrolysis. The sources of electricity include grid power, nuclear power, hydropower, wind power, and photovoltaic power. In China, the hydrogen from fossil energy and industrial by-product accounts for about 98.5% of the total hydrogen production in recent years. China’s hydrogen production technology is developing from hydrogen production from fossil energy to hydrogen production from green electricity. The green hydrogen is considered to be the most promising hydrogen supply method, and the green hydrogen is expected to account for 70% of the total hydrogen production by 2060.
2.1. Steam Methane Reforming (SMR)
The hydrogen production technology using natural gas as raw material has low water consumption, low CO2 emissions, high hydrogen yield, and a relatively small impact on the environment. Among the natural gas hydrogen production methods, SMR is a hydrogen production route commonly used globally. The carbon emission intensity refers to the amount of carbon emissions emitted per kilogram of hydrogen produced and is used to measure the carbon emissions levels of different hydrogen production processes over its whole lifetime. The carbon emission intensity of SMR is about 4.80 kg CO2/kg H2. The hydrogen production using SMR needs to go through three steps, including reforming, shift conversion gas purification, and methanation. The cost of SMR includes fixed costs, operation costs, and maintenance costs. The operation costs include natural gas cost, electricity cost, circulating water cost, desalination water cost, and purification cost. Obviously, the cost of SMR is strongly affected by the price of natural gas. The estimated hydrogen production cost is CNY 2.24/Nm3.
2.2. Coal
Coke oven gas refers to a flammable gas associated with tar and coke produced after high-temperature distillation of coal in the coking process of coking coal. As China is a major coke producer, coke oven gas resources are relatively rich. The average annual production of coke oven gas in China is about 90 billion Nm3, containing about 7.21 million tons of hydrogen. There are two methods of hydrogen utilization of coke oven gas, one is to purify hydrogen directly from coke oven gas, and the other is to convert CO and CH4 into H2 first, and then purify hydrogen. Compared with hydrogen production by conversion, the cost of hydrogen production by purification is lower, and it has a price advantage. The carbon emission intensity of hydrogen production from coal is about 20 kg CO2/kg H2, which is much higher than SMR. The cost of purifying coke oven gas to the hydrogen standard for vehicle fuel cells is about CNY 0.4~0.7/Nm3. According to the estimation of The International Energy Agency (IEA), the minimum cost of carbon capture and storage (CCS) is around EUR 40/Tm based on current technology.
2.3. Water Electrolysis
The technology of hydrogen production by water electrolysis has a history of more than 80 years with simple equipment, is pollution-free, and is high-purity. However, the energy consumption and hydrogen production cost are high. The hydrogen production process of water electrolysis can be divided into alkaline water electrolysis (AWE), proton exchange membrane electrolysis (PEM), anion exchange membrane electrolysis (AEM), and solid oxide electrolysis cell electrolysis (SOEC). At present, the AWE technology is relatively mature. Moreover, the current density of the electrolyser of the PEM is usually four times that of the AWE, and it is one of the most promising electrolytic hydrogen production technologies. The carbon emission intensity is zero for the green hydrogen production. The cost of hydrogen production by water electrolysis includes fixed costs, operation costs, and maintenance costs. The operation costs include electricity cost and water cost. The estimated hydrogen production cost is CNY 2.95/Nm3.
3. Methods and Data
3.1. Methods
The goal of this study is to predict hydrogen prices by 2060 when the goal of “carbon neutrality” is achieved. Firstly, the factors that influence the hydrogen price are selected. Obviously, the hydrogen price is directly affected by the hydrogen cost. According to supply and demand economics, certain basic principles hold true: when supply goes up, prices go down, and when supply goes down, prices go up; when demand goes up, prices go up, and when demand goes down, prices fall [43]. The scale-up will be the biggest driver of cost reduction [44]. So, the hydrogen production, hydrogen demand, and hydrogen cost are selected as the factors. The influencing factors are considered as features and the historical hydrogen prices are regarded as outputs. The overall methodology is to predict hydrogen prices based on trained machine learning models. Considering that the cost of raw materials accounts for the vast majority of the cost of hydrogen production, we assume no carbon price on all uncaptured emissions from hydrogen production. Furthermore, we assume aggressive deployment of renewable energy in the power sector, with green hydrogen accounting for 70% by 2060.
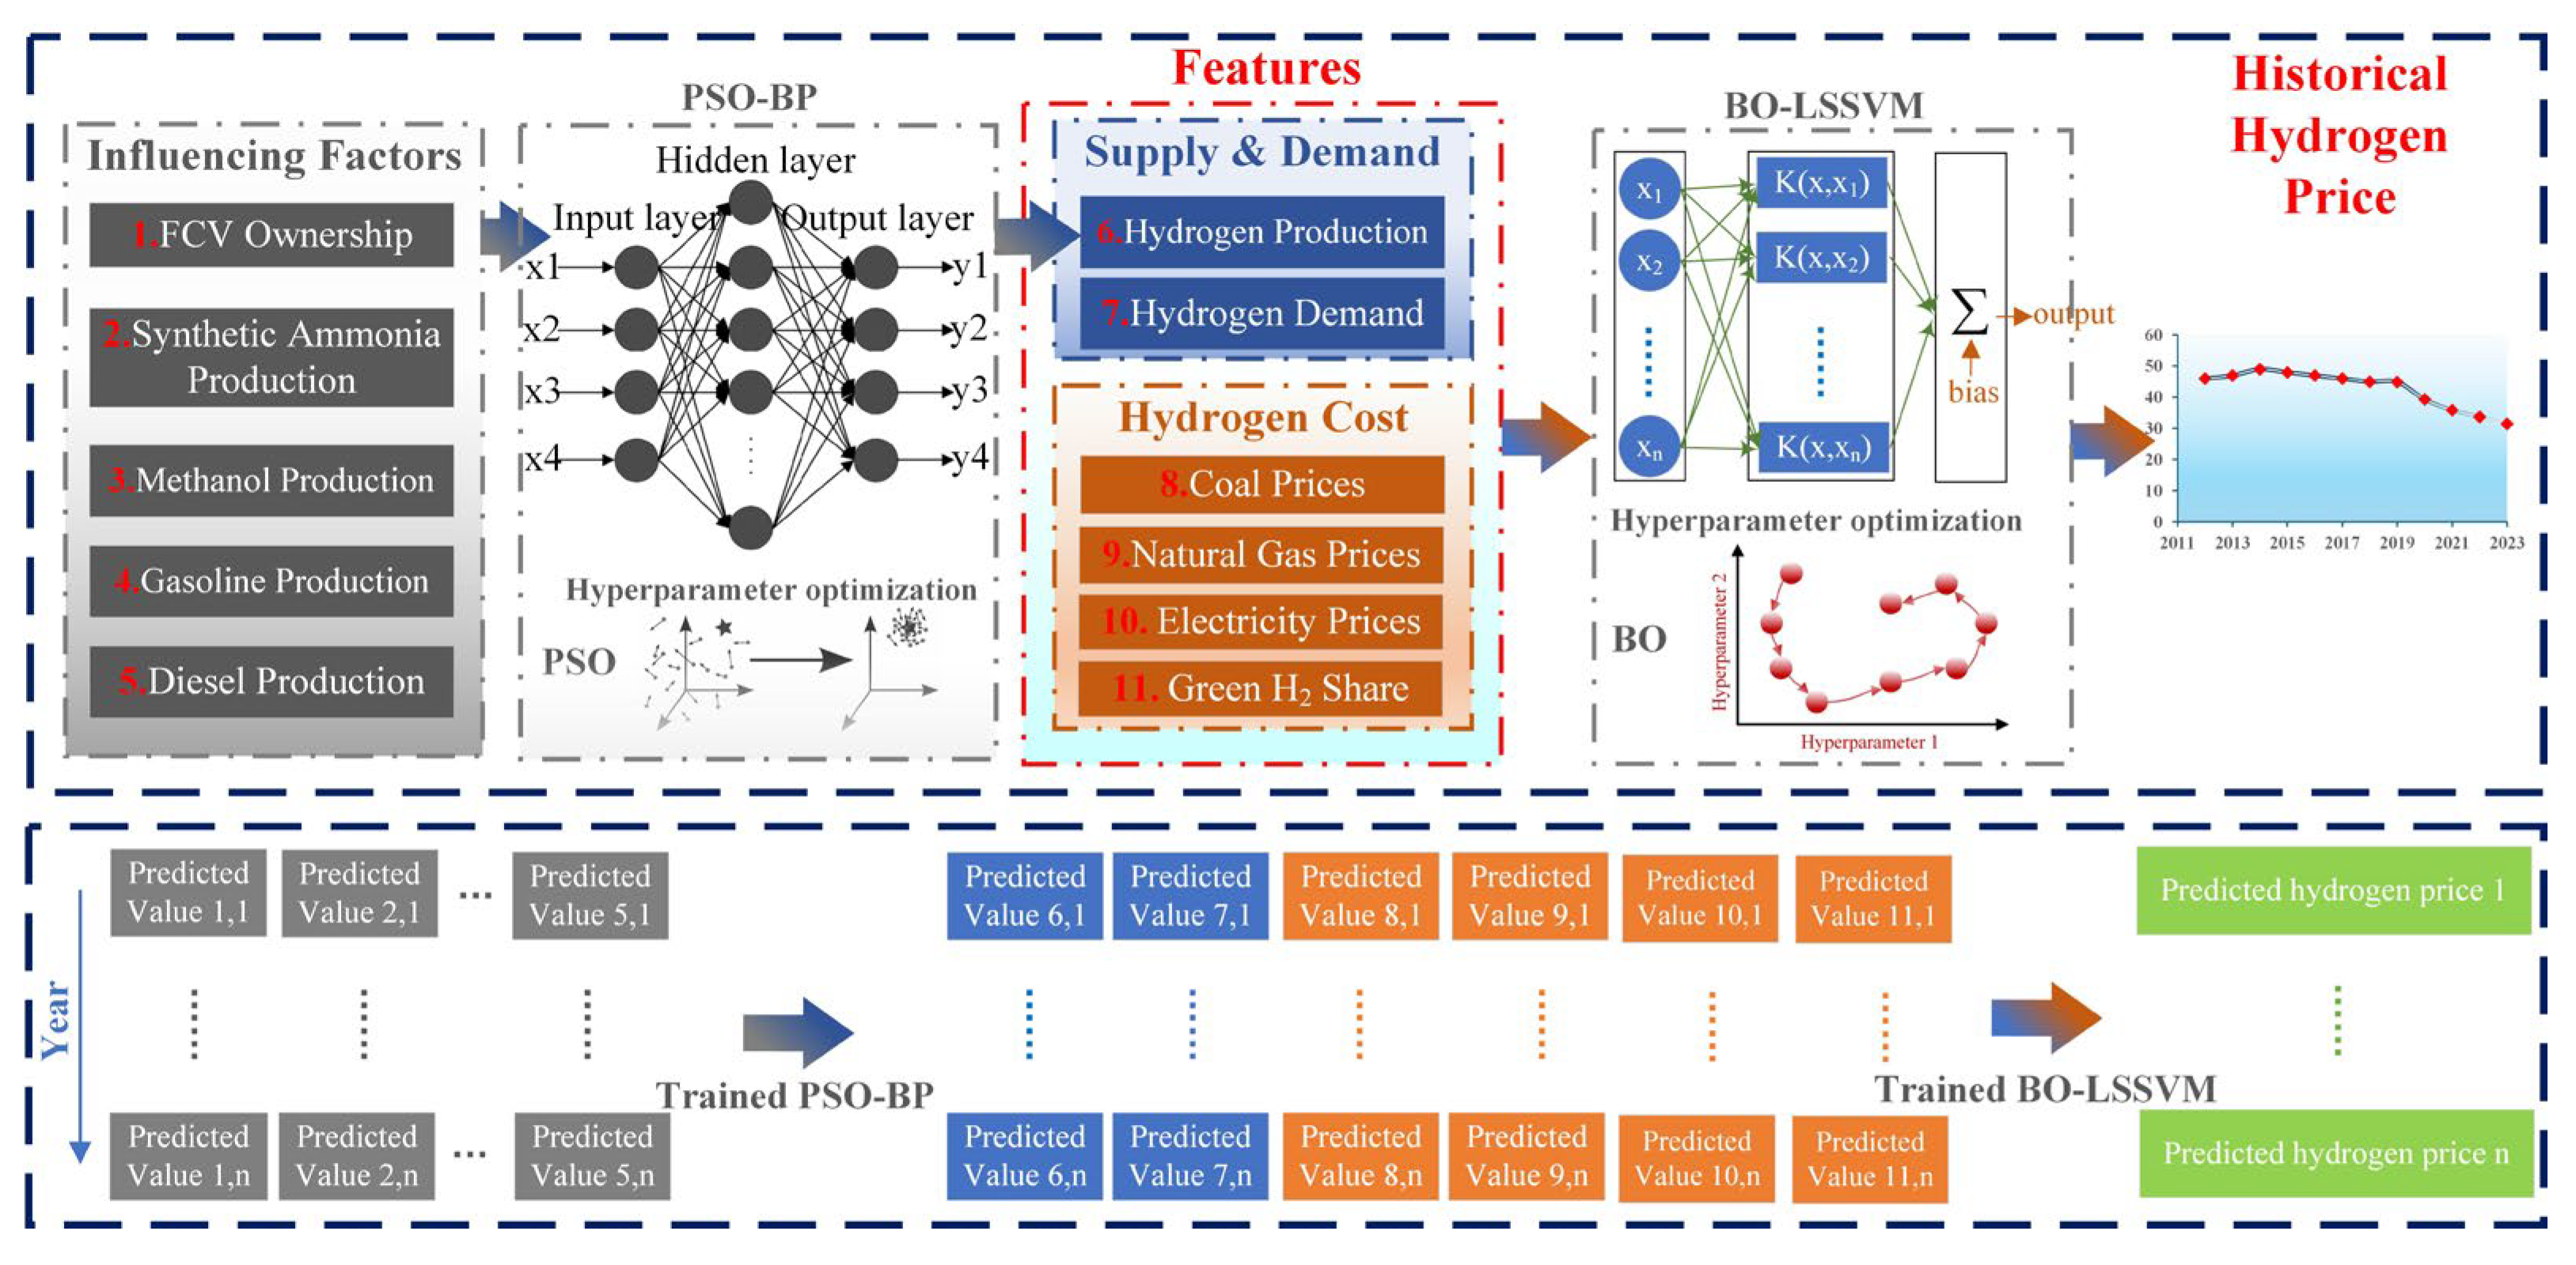
In addition to being used directly as fuel for FCV, hydrogen is also used to produce synthetic ammonia (27%), methanol (11%), gasoline, and diesel (33%). Therefore, the hydrogen production is mainly influenced by FCV ownership, synthetic ammonia production, methanol production, gasoline production, and diesel production. These factors are selected as features. Considering the strong nonlinear modeling ability and good generalization performance of the BP neural network, the BP neural network model optimized by the particle swarm optimization (PSO) is trained and tested to predict the hydrogen production. At present, the hydrogen from fossil energy and industrial by-product accounts for about 98.5% of the total hydrogen production in China. However, the green hydrogen is expected to account for 70% of the total hydrogen production by 2060. So, the prices of natural gas, coal, electricity, and the green hydrogen production share are selected as the features, combined with hydrogen production and hydrogen demand, to form the features of the hydrogen price prediction model. According to the review of Kokol et al. [42], the support vector machine (SVM) algorithm and its variants show good performance for small size samples. Compared with SVM, the least squares support vector machine (LSSVM) uses the least squares loss function to optimize the model to obtain more stability and less impact on outliers. The hydrogen price by 2060 is predicted by the trained LSSVM optimized by Bayesian optimization (BO). The flow chart of the overall methodology is shown in Figure 1.

Figure 1.
The flow chart of the overall methodology.
3.1.1. PSO-BP
The information in the BP neural network is propagated forward and the network is trained by adjusting weights to minimize the loss function. The outputs of the hidden and output layer nodes are written as shown below:
where is the activation function of the hidden layer, is the output of the i-th node in the input layer, is the weight between the i-th node in the input layer and the j-th node in the hidden layer, is the threshold of the jth node in the hidden layer, represents the output layer node activation function, is the weight between the j-th node in the hidden layer and the k-th node in the output layer, and represents the threshold value on the kth node of the output layer.
The expression of the neural network calculation error is shown as follows:
where is the error of the k-th node in the output layer.
The hyperparameters of the BP neural network need to be optimized to enhance the prediction accuracy. In recent years, swarm intelligence optimization algorithms have shown the potential to resolve optimization issues. Among them, the particle swarm optimization (PSO) is applied to search for the best solution in a multidimensional search space. It has the advantages of few parameters, effective global search, and fast convergence speed. The steps of using the PSO algorithm to optimize the BP neural network model are as follows:
- Define the fitness function: the prediction accuracy is selected as the fitness function.
- Define parameter space: The BP neural network hyperparameters and ranges are determined. Usually, BP neural network hyperparameters include weights and biases.
- Initialize the particle swarm: a group of particles is created, each particle represents a hyperparameter combination of a BP neural network, and the particle position (hyperparameter value) and speed are initialized.
- Iterative optimization: The number of iterations is set. In each iteration, the position and velocity of the particle are updated and the fitness value is calculated.
- Set stopping criteria: the stopping criteria are set, such as a maximum number of iterations.
- Select the particle: after the optimization is completed, the particle with the best fitness is selected from the swarm, and its position is the desired BP neural network parameter.
3.1.2. BO-LSSVM
The support vector machine (SVM) algorithm has the problem that needs to solve the quadratic programming. Suykens et al. [45] proposed the least squares support vector machine (LSSVM) to improve the computational efficiency. LSSVM is an advanced variant of SVM. LSSVM mainly uses the least squares optimization technique in the loss function, transforming the training process into a linear relationship to provide a more flexible modeling method. LSSVM retains the advantages of SVM using nonlinear kernel functions to fit complex nonlinear relationships flexibly. Moreover, LSSVM can obtain a stronger prediction capability. The regression model of LSSVM using the nonlinear mapping function is displayed as follows:
where W represents the weight of the input, b is the bias.
The purpose is to reduce the error between the model output and the actual output. Thus, the LSSVM optimization problem can be expressed as shown below:
where is the regularization parameter.
The radial basis function (RBF) is usually selected as the nonlinear kernel function. The expression is written as follows:
where is the parameter of the kernel function.
The accuracy of LSSVM mainly depends on the selection of two hyperparameters (regularization parameter and RBF kernel function parameter). The regularization parameter is mainly used to adjust the complexity of the model to balance the fitting ability on the training set and the generalization ability on the test set. The kernel function parameter is mainly used to process nonlinear relationships in the training set.
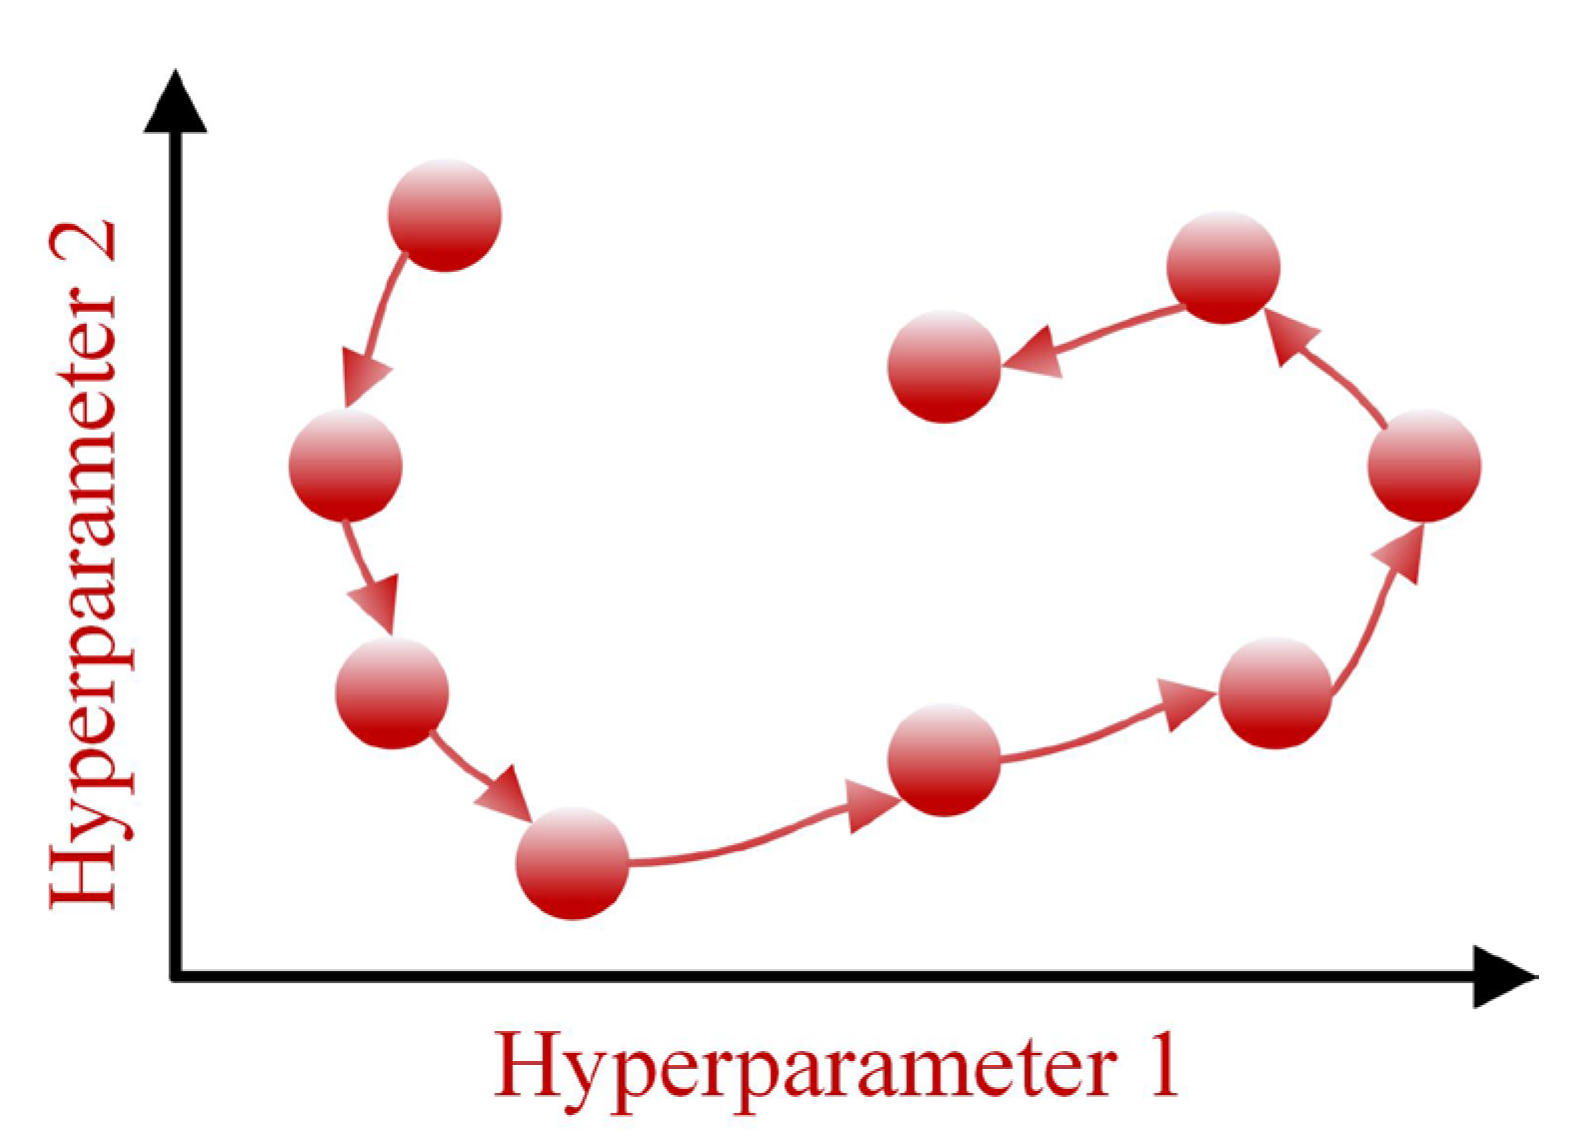
The prediction performance is strongly influenced by the hyperparameters of LSSVM. So, it is necessary to select the optimal combinations of hyperparameters. Bayesian optimization (BO) is a global optimization method that selects the next test point in the search space and observes the results while retaining the optimal solution. Subsequently, Bayesian statistical inference is used to update the estimation of the objective function, allowing BO to efficiently find the global optimal solution in a complex, high-dimensional search space. The search process of BO is shown in Figure 2.

Figure 2.
The search process of BO algorithm.
The BO algorithm includes Gaussian processes (GPs) and an acquisition function. The GPs are realized by the mean and covariance, which are written as shown below:
where is the mean, is the variance, is the predicted point, is the kernel function, and is the Gram matrix of .
The PI function is selected as the acquisition function, and the equation is shown below:
where is the current optimal function value, is the balance parameter, and is the Gaussian generation model.
In the BO-LSSVM algorithm, BO is used to automatically select the hyperparameters of LSSVM. The objective function is the regression performance index of LSSVM. The optimal hyperparameter combination is selected through cross-validation to obtain the optimal performance on the data set. The hyperparameter search range is 0.01~10,000. The procedure of BO-LSSVM is shown as follows:
- Define the objective function: The prediction accuracy is selected as the objective function. The objective function takes the hyperparameters of the LSSVM as input and returns the corresponding performance metric.
- Select the hyperparameters: the regularization parameter and RBF kernel function parameter are selected as the hyperparameters to optimize in this article.
- Initialize the Bayesian optimization process: The GPs are chosen for the objective function and a small number of random samples of hyperparameters are initialized to evaluate the objective function. The samples are served as the starting point for the optimization.
- Evaluate the initial samples: the LSSVM model is trained using the selected hyperparameters from the initial samples, and the performance of LSSVM is evaluated on the validation set.
- Update the Gaussian process model: the GPs model is updated by applying the observed hyperparameters.
- Optimize the acquisition function: the acquisition function is defined and optimized to find the next set of hyperparameters.
- Evaluate the new hyperparameters: the LSSVM model is trained using the new hyperparameters and evaluated on the test set.
- Iterate: the number of iterations is set as the stopping criterion, and steps 5 to 7 are repeated until the stopping criterion is met.
- Select the optimal hyperparameters: the optimal hyperparameters are selected after the optimization process is complete.
- Train the model and evaluate the performance: the LSSVM model is trained with the optimal hyperparameters and the performance of LSSVM is evaluated on the test set.
3.1.3. Model Evaluation
To evaluate the performance of the hydrogen price prediction model, correlation coefficient (R2), mean bias error (MBE), mean absolute error (MAE), and root mean square error (RMSE) are selected as the indicators. R2 is used to measure the goodness of fit. A negative MBE value indicates underestimation, and a positive value indicates overestimation. When MAE is close to 0, it means the model regression is optimal. RMSE can reflect the distribution of prediction errors. The expressions of the indicators are shown below:
where n is the number of sample points in the data set, is the true value of the sample, is the predicted value, and is the sample mean.
3.2. Data
The research on hydrogen and fuel cells in China is mainly concentrated in academia and laboratories. After 2012, the government issued relevant policies and the hydrogen energy industry began to develop rapidly [46]. Therefore, the sample data in this article are from 2012 to 2023, and the prediction period is from 2024 to 2060 (“carbon neutrality”).
First, the hydrogen production is predicted. The data involved include FCV ownership, synthetic ammonia production, methanol production, gasoline production, and diesel production. The data on FCV ownership come from the China Association of Automobile Manufacturers. The data on synthetic ammonia production, gasoline production, and diesel production are from statistical yearbook of China, and the methanol production data are from a business consulting company called ICAN. The number of FCV is estimated by the polynomial model. The synthetic ammonia production, methanol production, gasoline production, and diesel production from 2012 to 2023 are shown in Table A2 in Appendix A. The synthetic ammonia production and methanol production are estimated by the GM(1,1) model. The gasoline production is determined at an annual growth rate of 2% and the diesel production is determined according to an annual reduction rate of 2%.
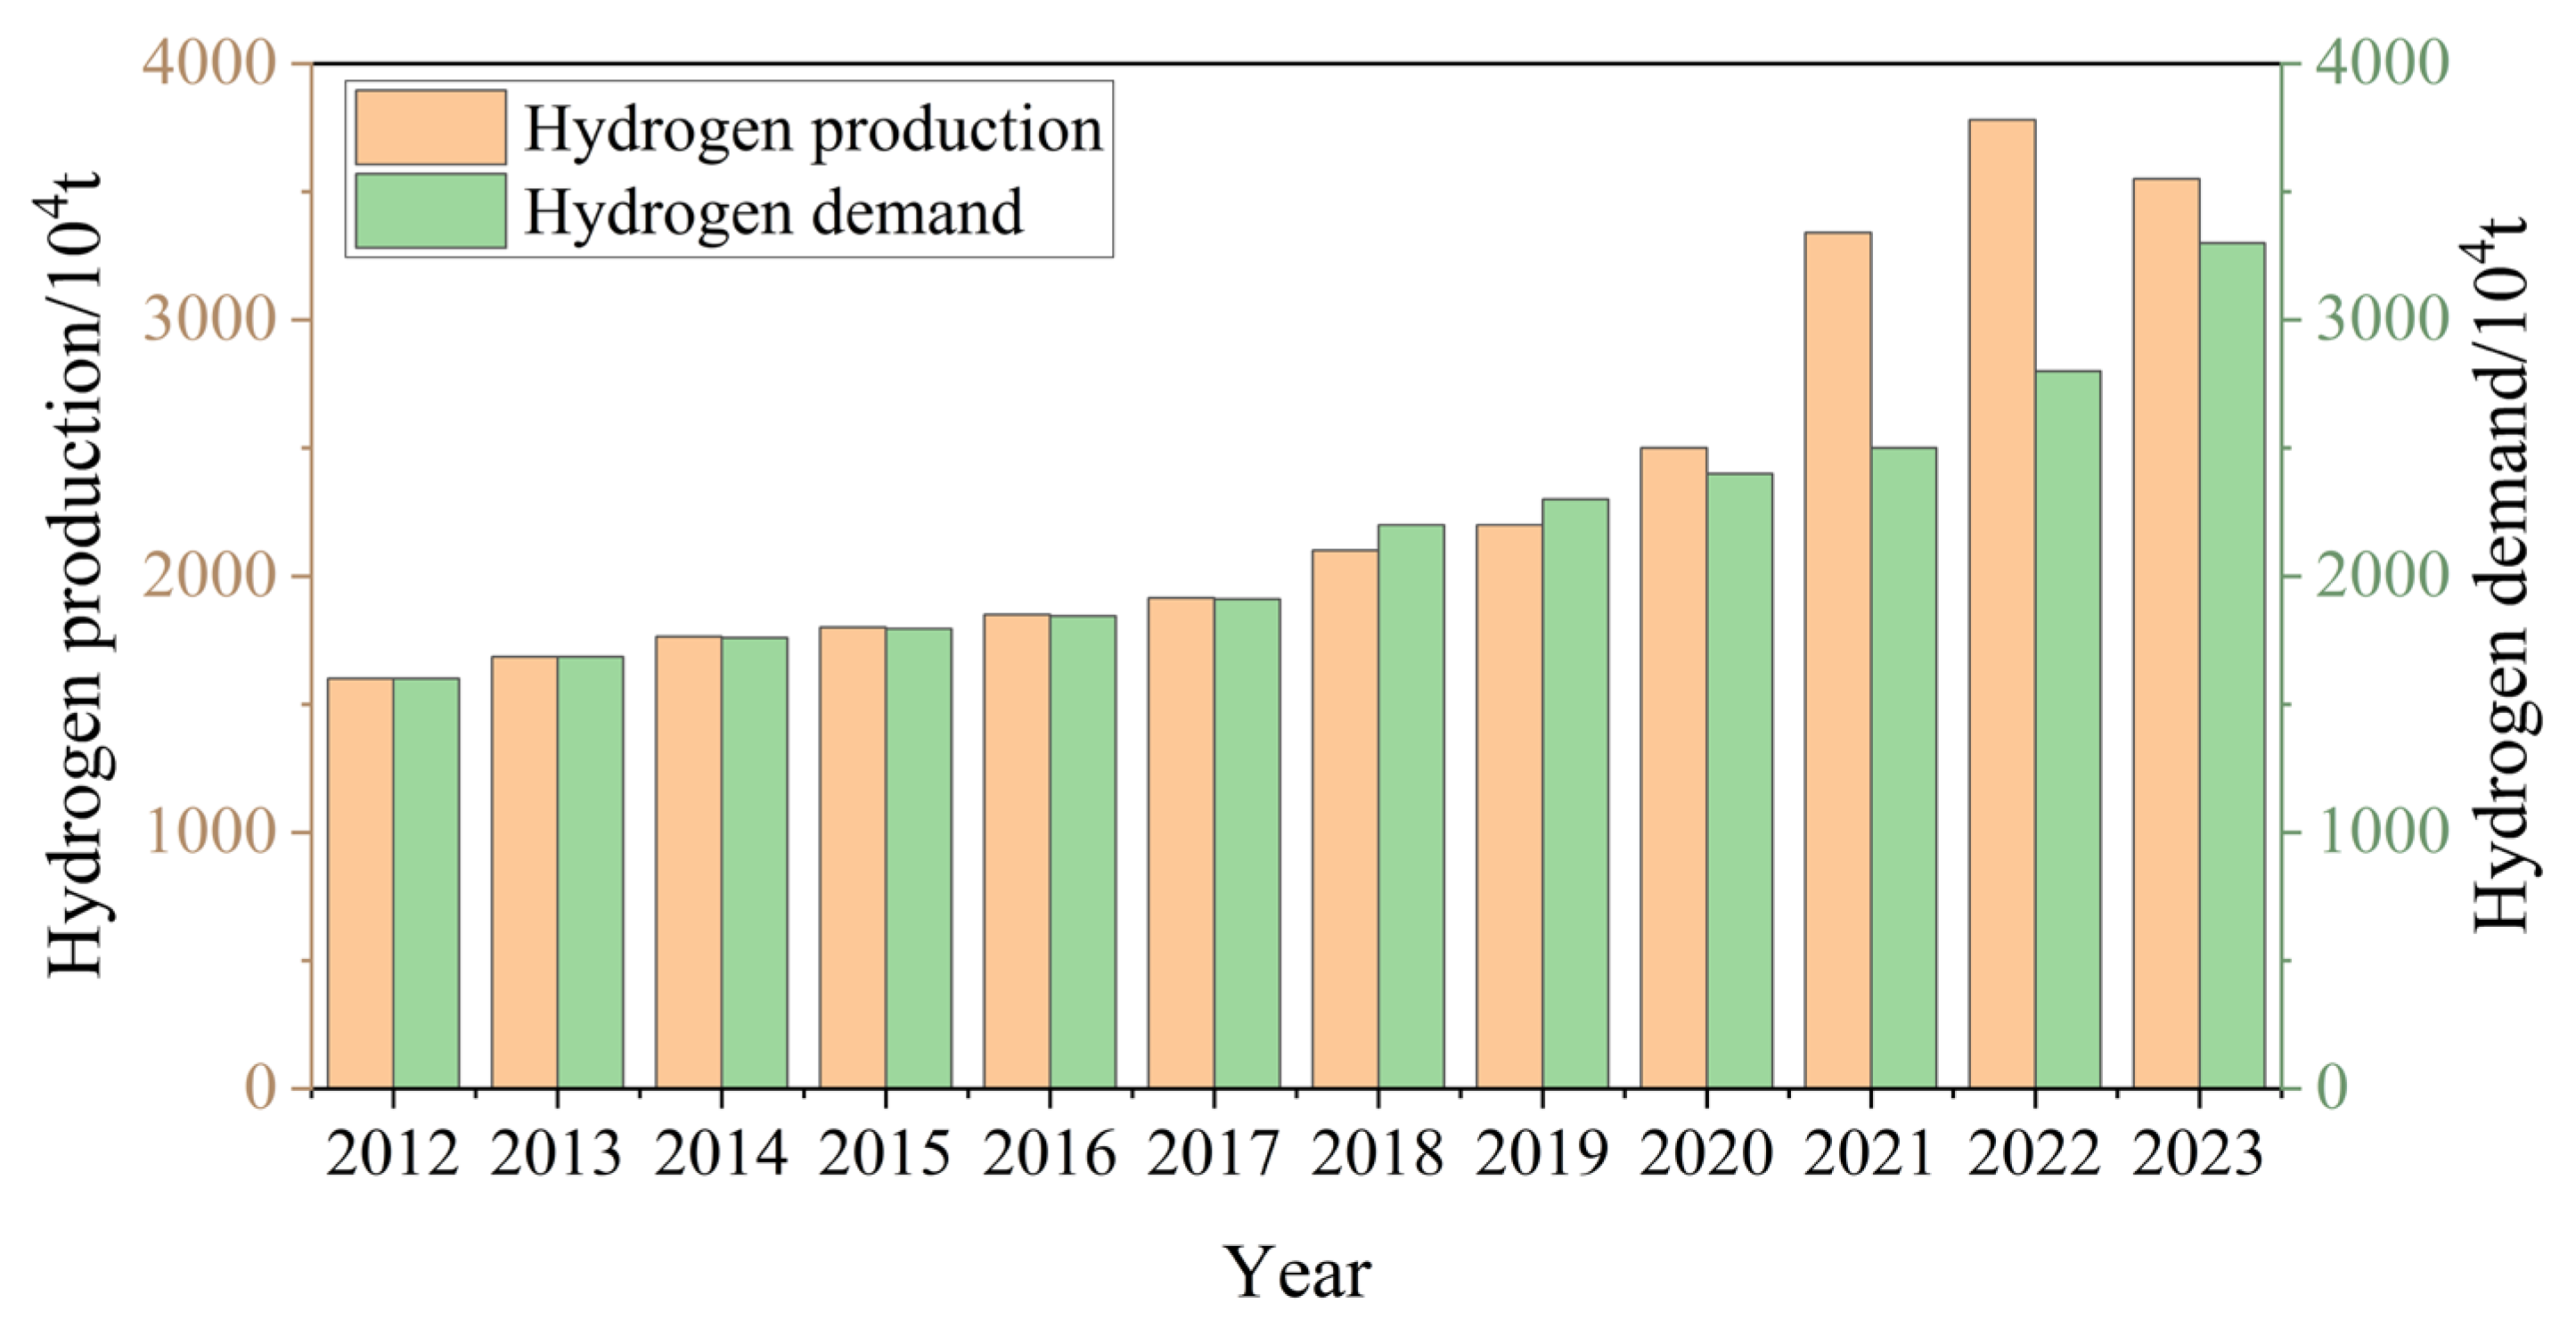
Next, the hydrogen production and hydrogen demand are compared in Figure 3. As we can see, the hydrogen production exceeded hydrogen demand in recent years, which is beneficial to reduce the hydrogen price. According to the estimation from the China Hydrogen Alliance, the hydrogen demand in China will be 3715 × 104 t by 2030 under the goal of “carbon peak” and over 100 million tons by 2060 under the goal of “carbon neutrality”.
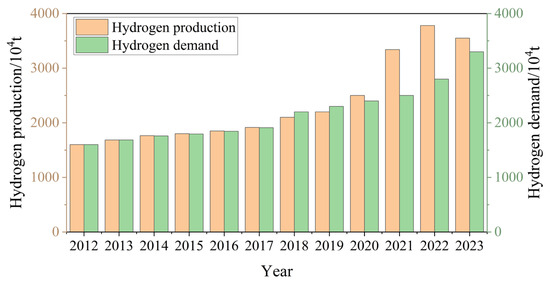
Figure 3.
The hydrogen production and demand in China from 2012 to 2023.
Finally, the data of the factors affecting hydrogen costs, such as coal prices, natural gas prices, electricity prices, and green hydrogen share are collected. The natural gas price and coal price are derived from the market prices of important means of production in circulation published by the China Statistics Information Service Center (CSISC). The electricity prices are from national and provincial development and reform commissions. According to historical data, hydrogen prices show a downward trend. The hydrogen price was slightly over CNY 30/kg in 2023.
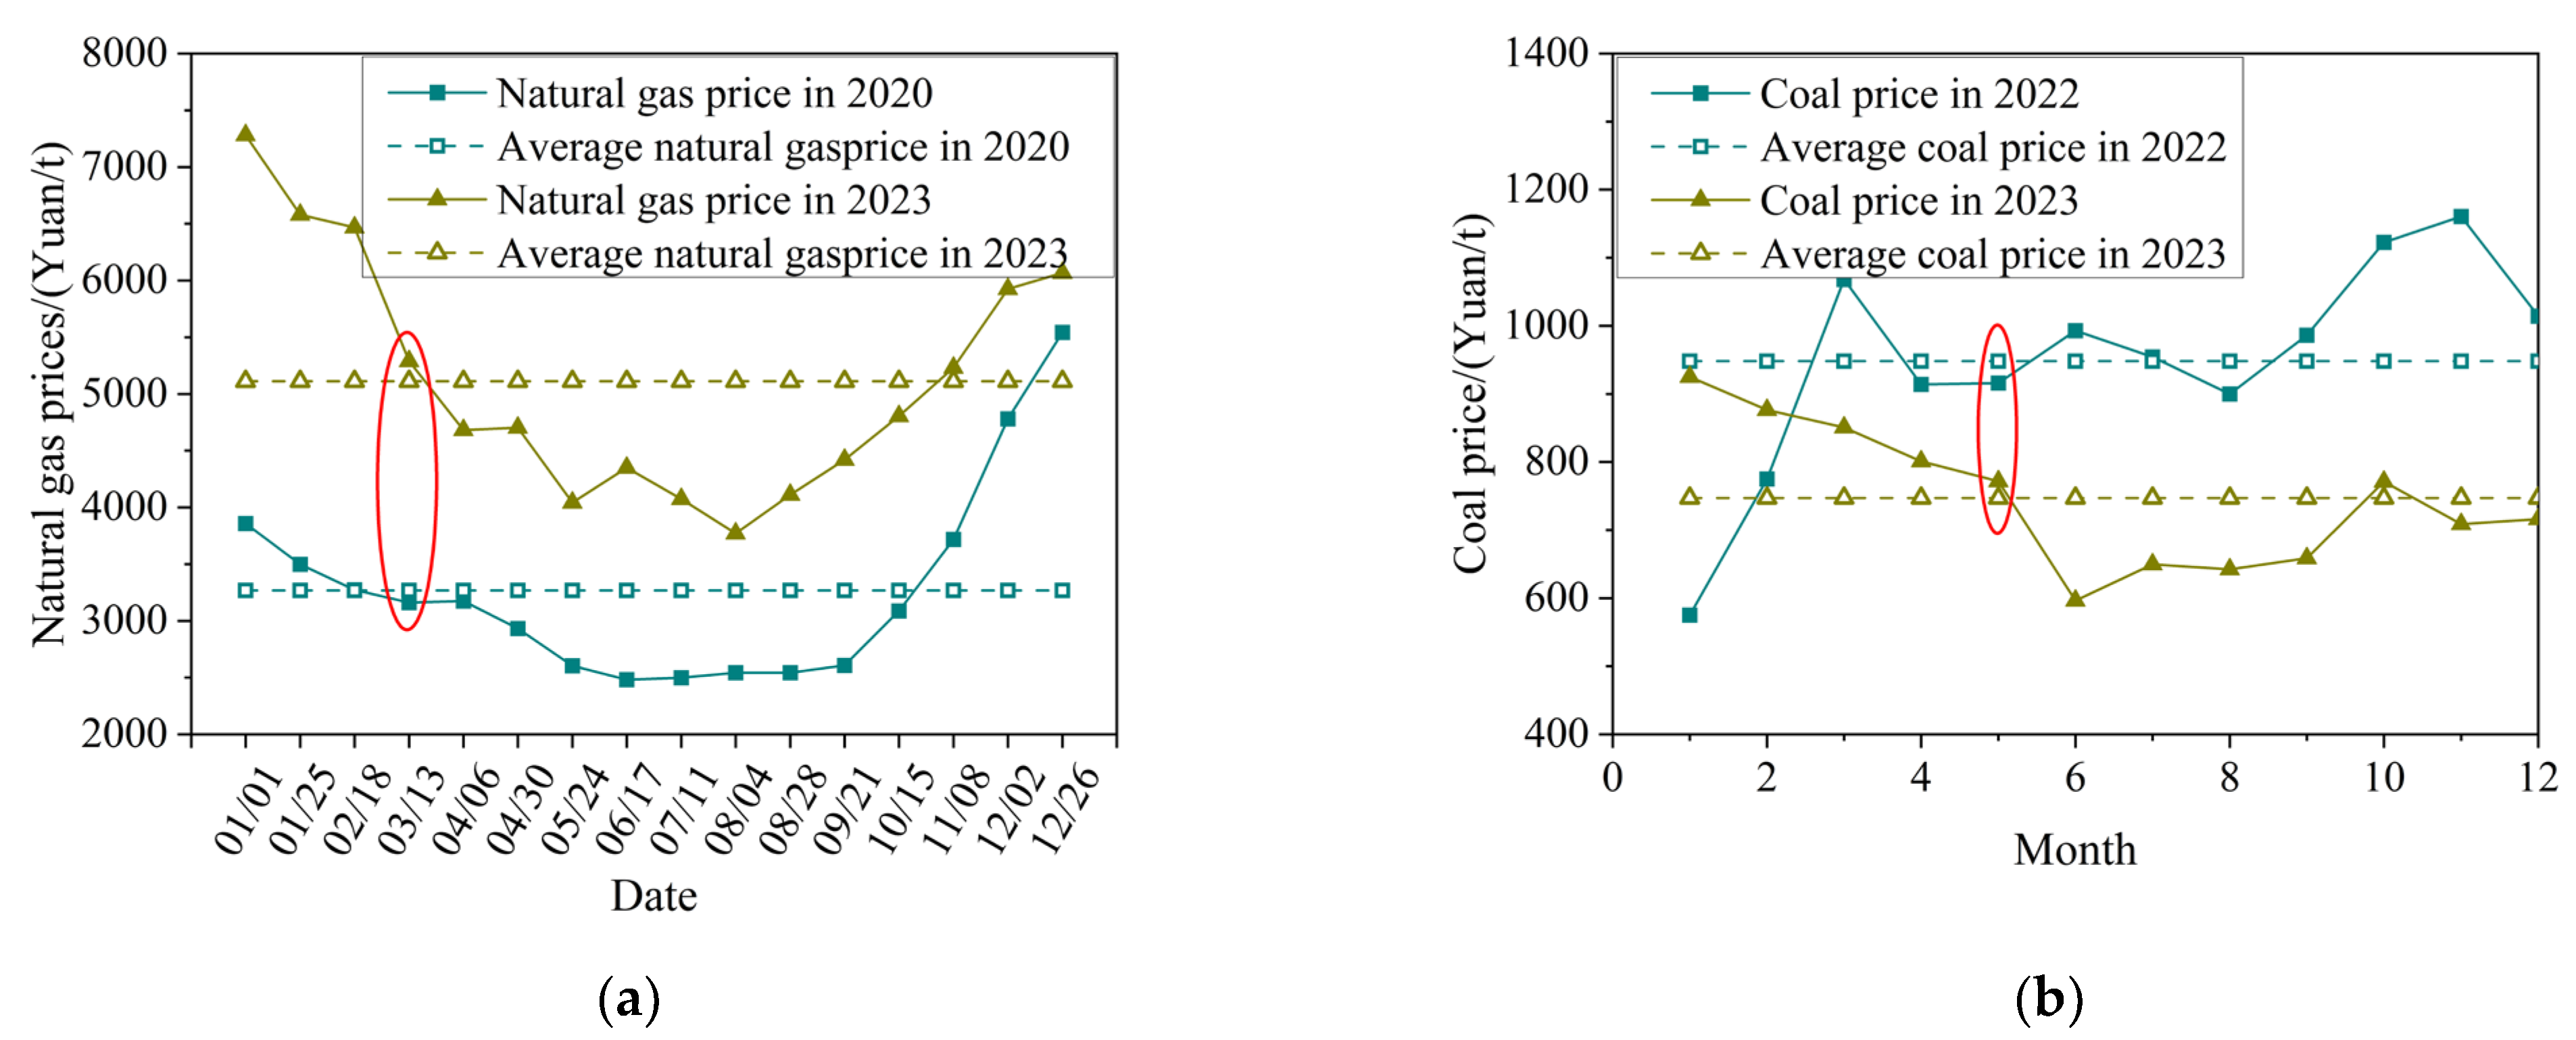
Due to the fact that the price change cycle of natural gas and coal is short, the average price is used. As we can see in Figure 4, the natural gas prices in early March were close to the annual average price, and the annual average prices of coal were nearly identical to the price of coal in May. The annual average prices of natura gas and coal from 2012 to 2023 are shown in the Table A1 in Appendix A.
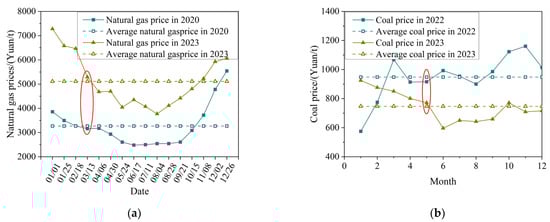
Figure 4.
The average prices of natural gas and coal during one year, (a) the natural gas prices in 2020 and 2023; and (b) the coal prices in 2022 and 2023.
3.3. Training
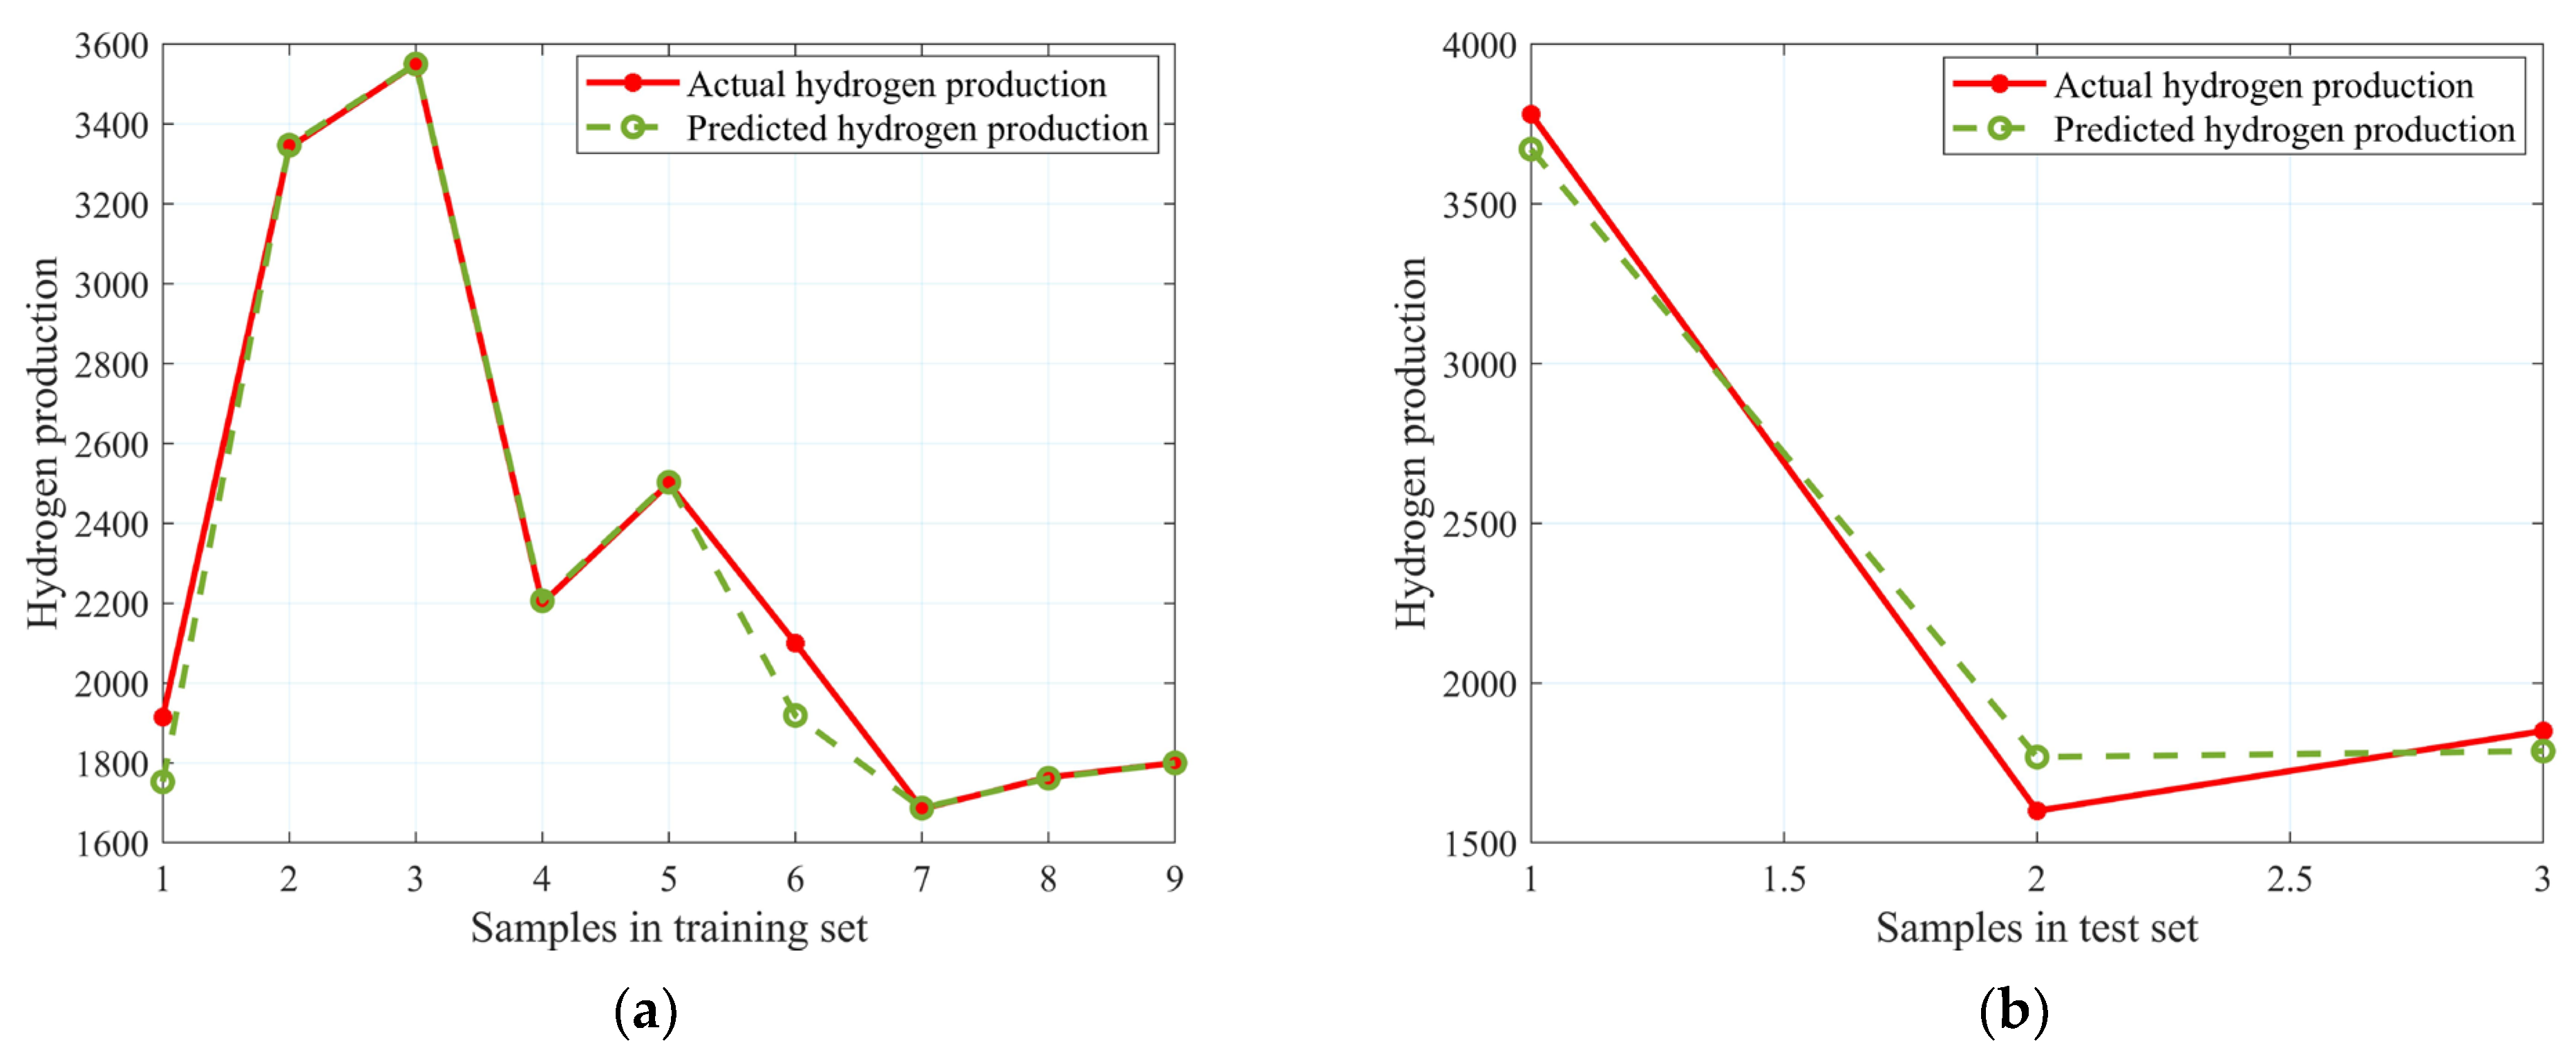
The training set and test set are randomly divided and the training set accounts for 75% of the total samples. The training and testing process of the hydrogen production prediction model is exhibited in Figure 5. The R2 of training set and test set are 0.9844 and 0.9845, respectively. The average relative error of a training set and test set are 1.99% and 5.61%, respectively, showing a good fitting effect.
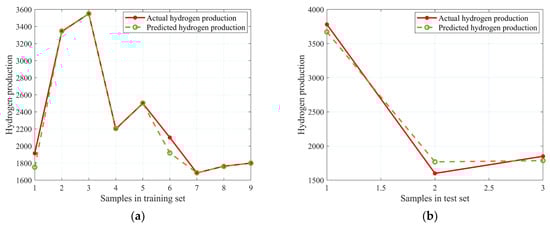
Figure 5.
The hydrogen production prediction model based on PSO-BP neural network, (a) the training process; and (b) the testing process.
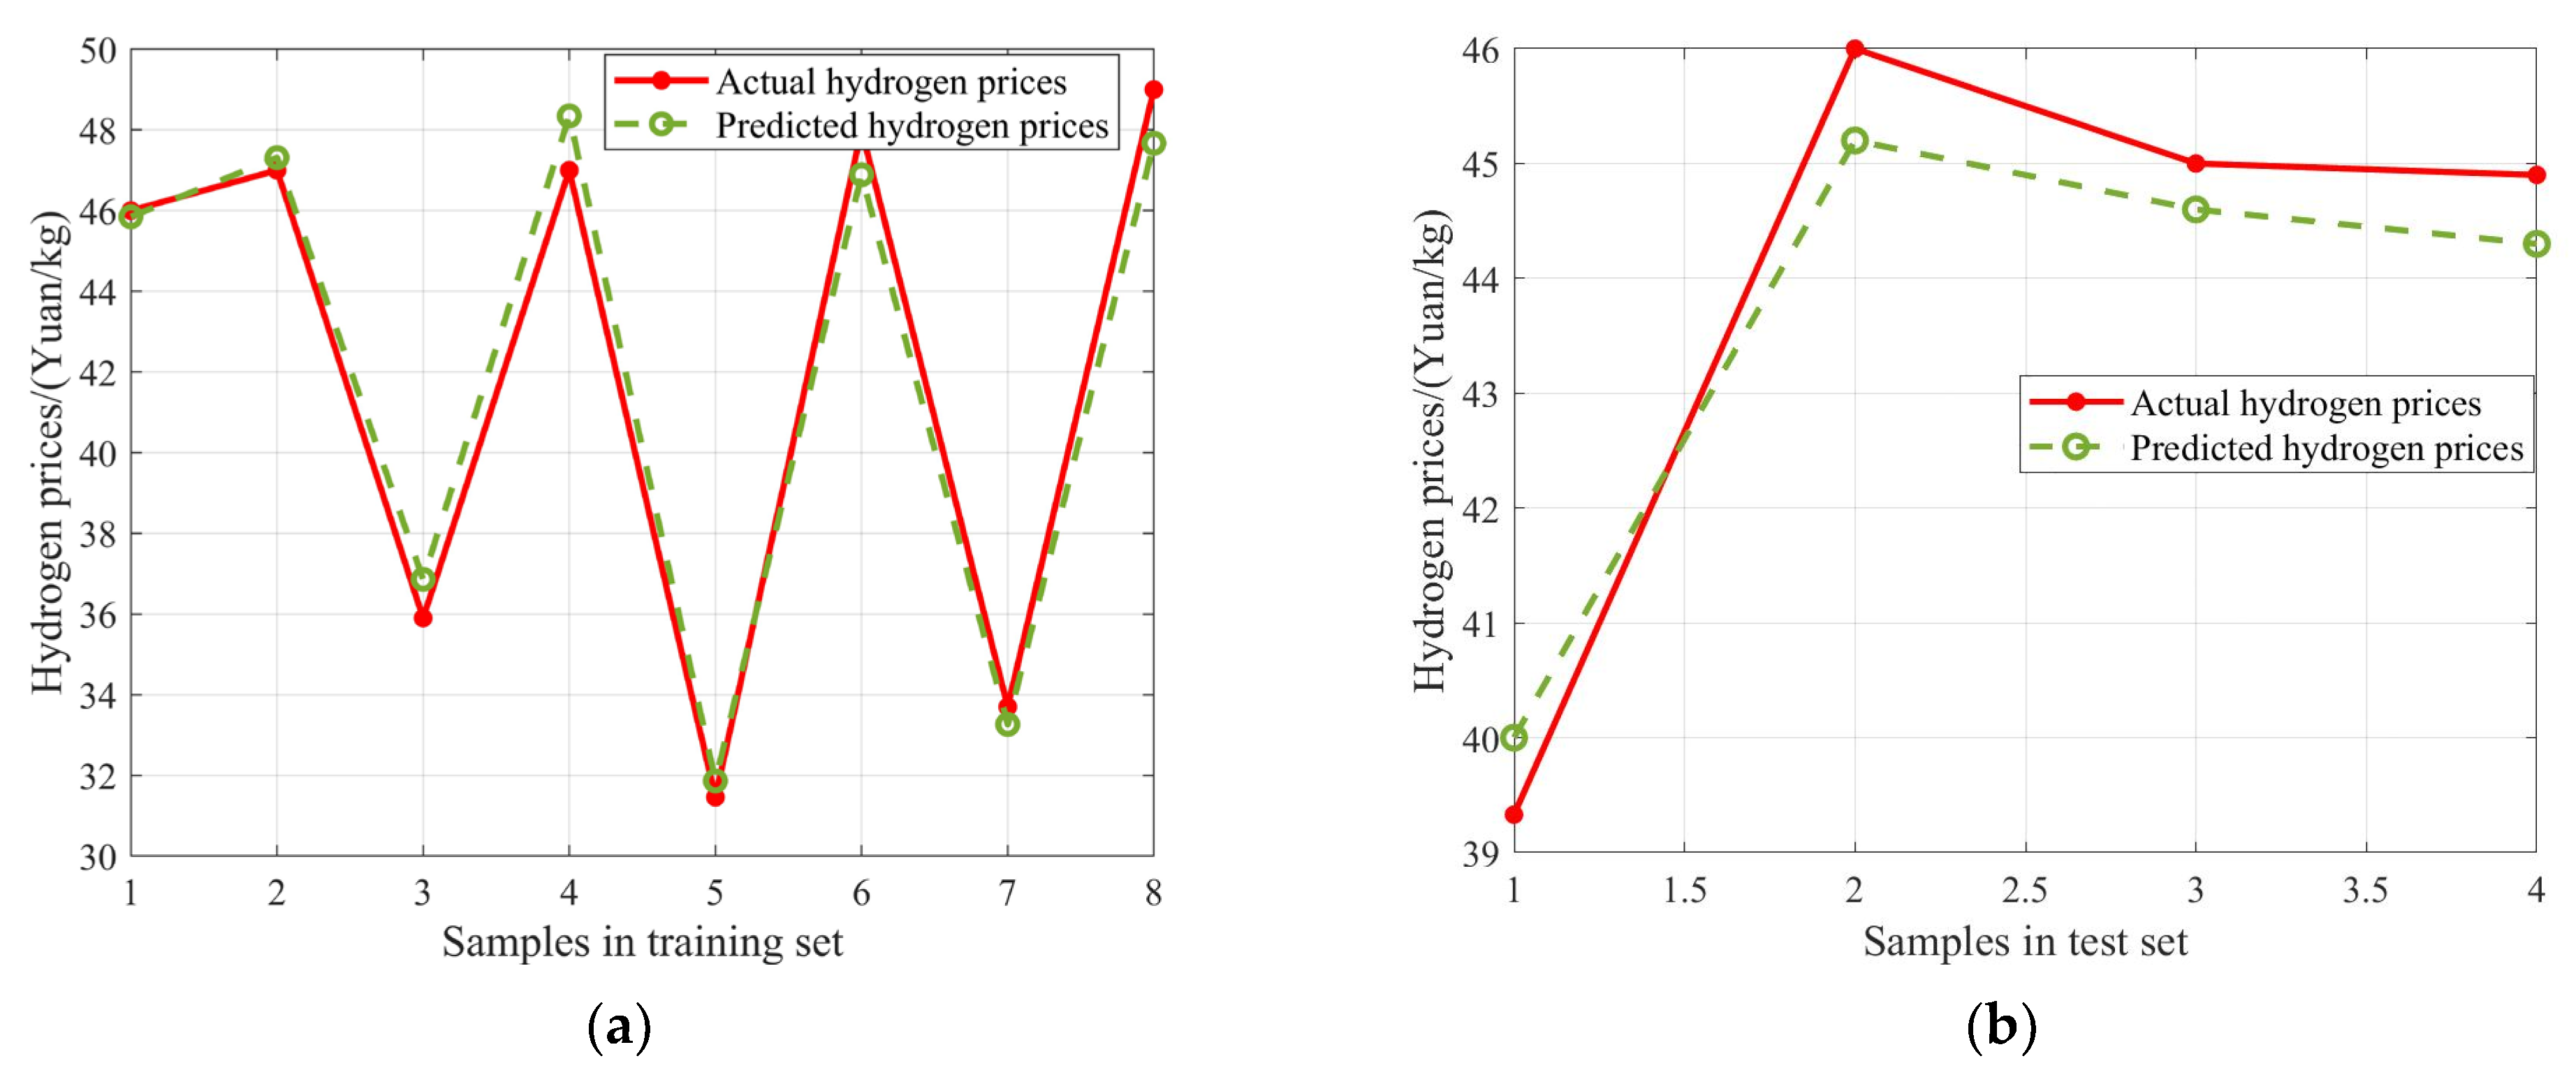
The training and testing process of the hydrogen production prediction model is exhibited in Figure 6. The R2s of the training set and test set are 0.9844 and 0.9845, respectively. The RMSEs are 0.88 and 0.65, respectively. The MAE and mean relative error of the test set are 0.6175 and 1.4%. The hydrogen prices prediction model based on BO-LSSVM shows good prediction performance with a small error under small sample size. The MBE of the test set is −0.2825. The MBE is negative, indicating that the hydrogen prices prediction model underestimated the actual hydrogen prices.
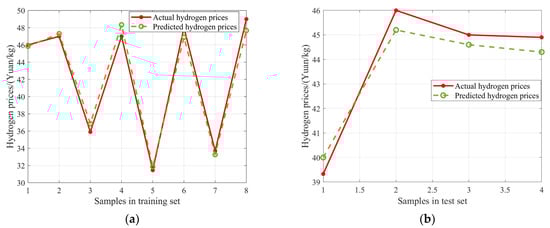
Figure 6.
The hydrogen prices prediction model based on BO-LSSVM, (a) the training process; and (b) the testing process.
4. Results and Discussion
4.1. Estimation of National Average Hydrogen Prices
The hydrogen production from 2024 to 2060 is predicted by the trained hydrogen production prediction model. The hydrogen production shows an upward trend, indicating that the pace of energy transformation in China is accelerating. The hydrogen production will be 12,000 × 104 t by 2060, a large increase compared to 3550 × 104 t in 2023. Compared with the expected demand, the hydrogen production is large, which is conducive to the decline in hydrogen prices.
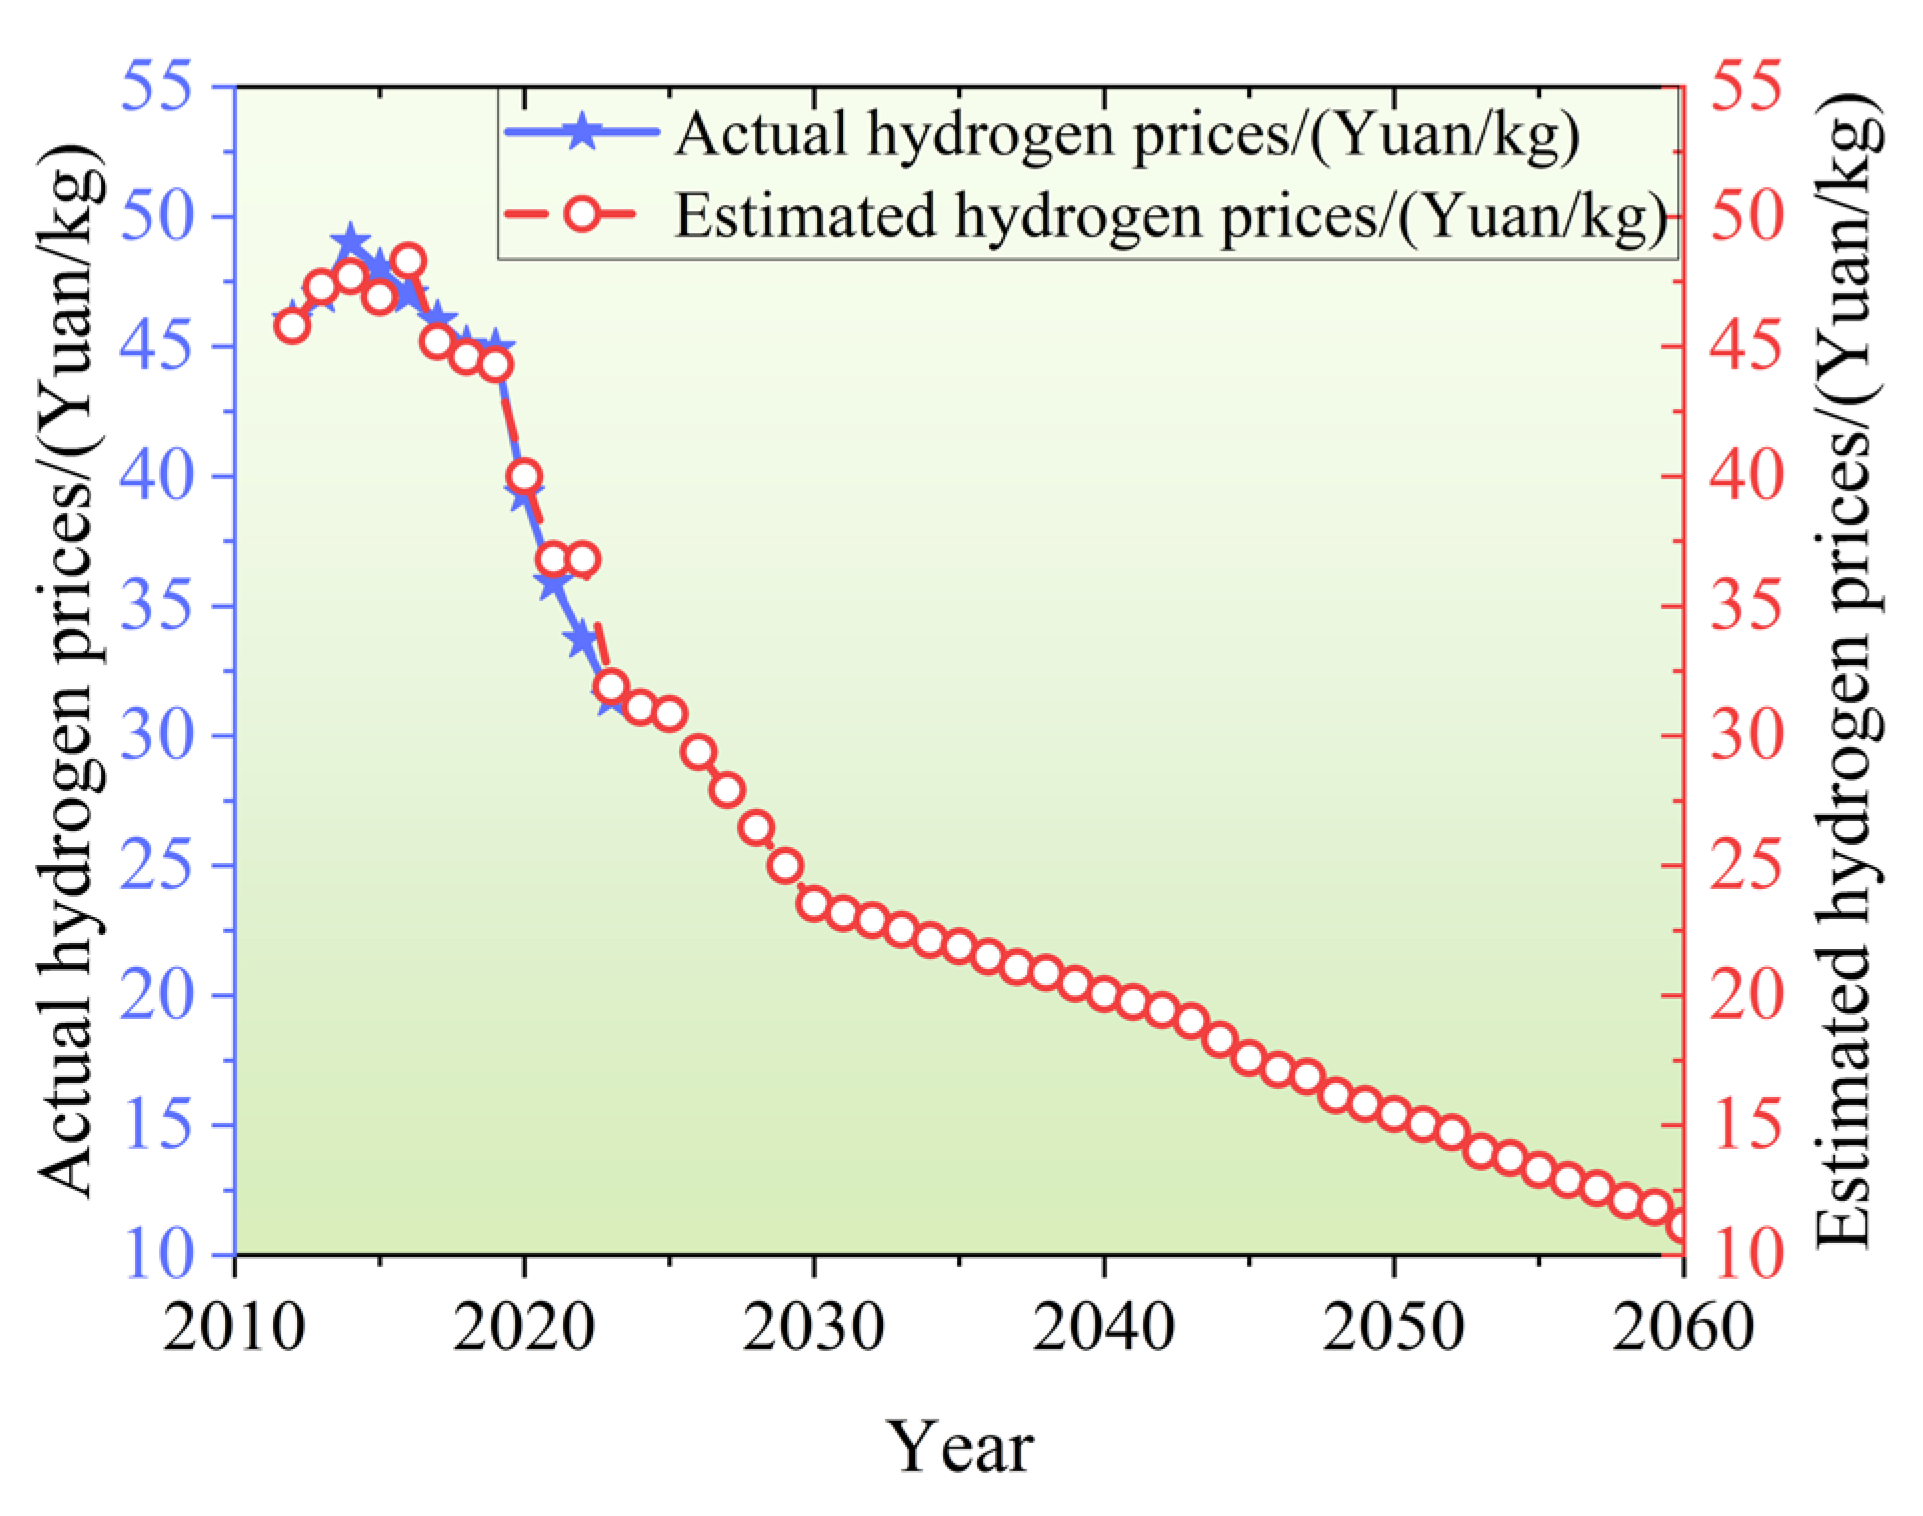
The hydrogen prices from 2024 to 2060 are predicted based on the trained BO-LSSVM model. The estimated hydrogen prices are showed in Figure 7. The hydrogen prices show a downward trend. The current average hydrogen price is still above CNY 30/kg. The hydrogen price is estimated to be below CNY 30/kg by 2026. Furthermore, it is estimated that the hydrogen price will be lower than CNY 24/kg by 2030 (“carbon peak”) and CNY 12/kg by 2060 (“carbon neutrality”).

Figure 7.
The estimated hydrogen prices from 2012 to 2060.
The economics of hydrogen are compared with those of traditional fuels by taking the heavy trucks with the same cargo weight (30 t) as an example. The diesel consumption of a traditional truck per 100 km is about 30~35 L, and the hydrogen consumption of fuel cell truck per 100 km is about 7.5~10 kg. The fuel cost per kilometer is estimated based on fuel price and fuel consumption. The fuel cost per kilometer of traditional truck is about CNY 210~245. The hydrogen costs less than diesel when the hydrogen price is below CNY 24/kg. Therefore, the hydrogen will show economic competitivity compared to the traditional fuels in the next few years in China. According to the review of Frieden and Leker [35], the estimated median and average hydrogen production costs by 2050 are 17.5 and CNY 21.1/kg, respectively. The estimated hydrogen price by 2050 in this paper is CNY 15.4/kg, which is sightly lower than the median hydrogen production cost due to the lower electricity and raw material costs in China.
4.2. Estimation of Hydrogen Prices Comparing Regional Variations
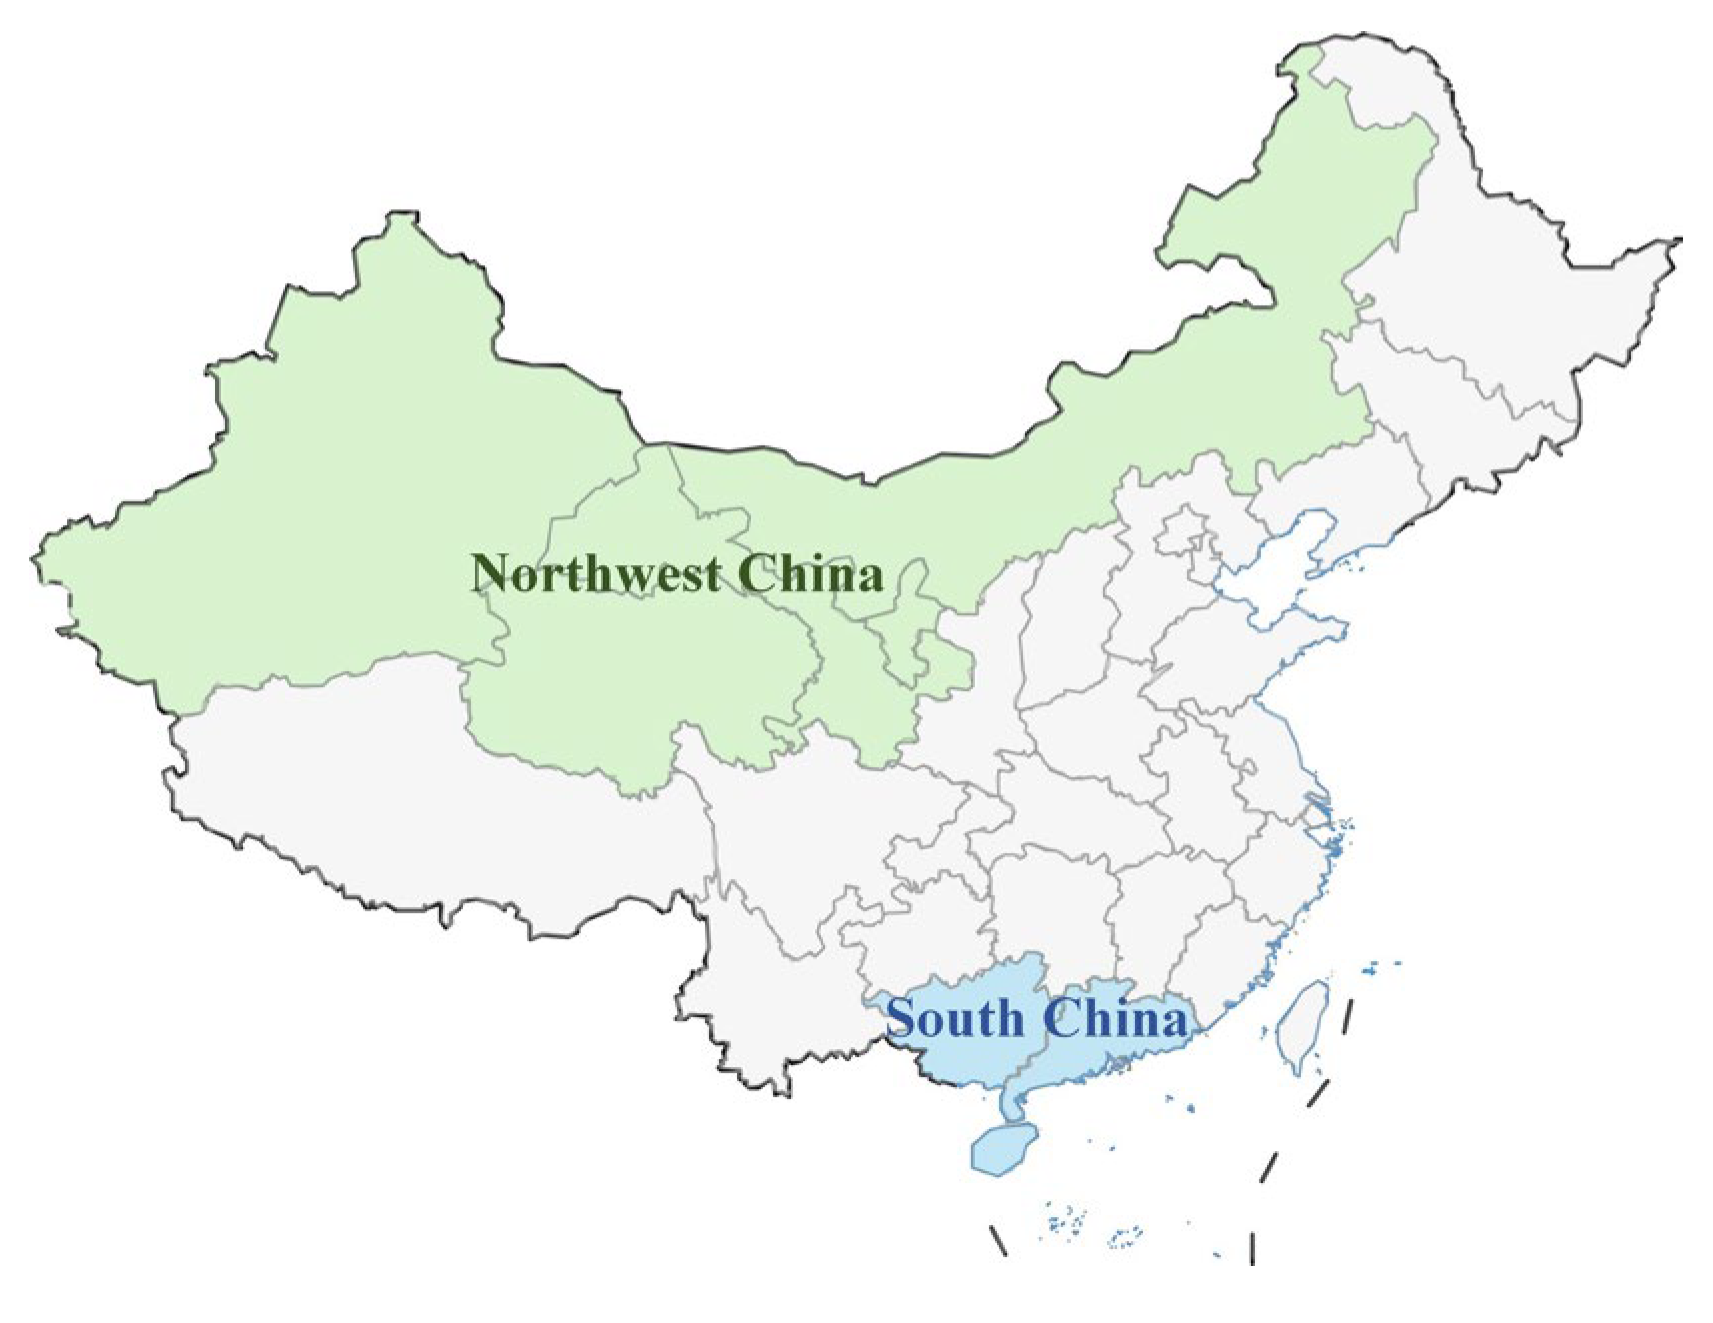
The above predicted hydrogen price is the average price in China. However, there are significant regional variations within China. The province government should take full account of the local industrial level and raw material cost. Two typical regions, South China and Northwest China are selected to analyze the regional variations in hydrogen price. The South China referred to in this paper mainly includes the following provinces: Guangdong, Guangxi, and Hainan. The Northwest China referred to in this paper mainly includes the following provinces: Xinjiang, Inner Mongolia, Qinghai, Gansu, and Ningxia. The location of the two typical regions in China is shown in Figure 8.
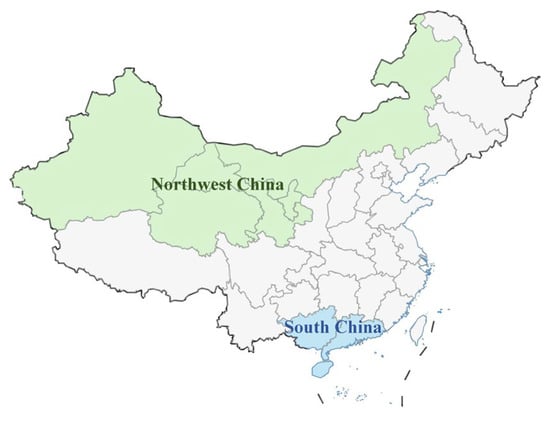
Figure 8.
The location of two typical regions in China.
The hydrogen prices in South China and Northwest China compared with the national average hydrogen prices are shown in Figure 9. The electricity cost in Northwest China is relatively low due to the abundant wind and solar energy resources. In the future, green hydrogen will account for a large proportion. Regions with lower electricity prices have cost advantages, and the hydrogen price in the Northwest China is lower than the national average. The estimated hydrogen prices in Northwest China by 2060 is about CNY 7.2/kg.
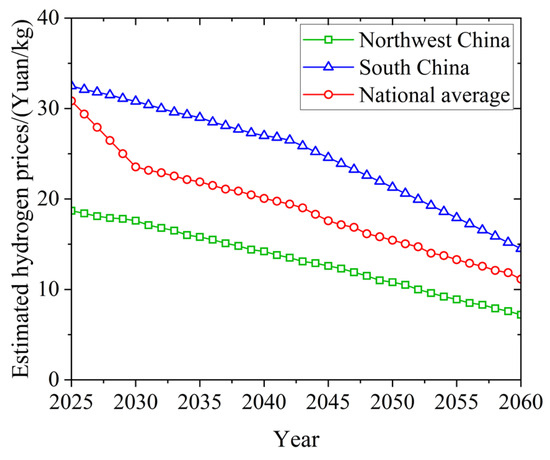
Figure 9.
The estimated hydrogen prices in South China and Northwest China from 2025 to 2060.
5. Conclusions
To attain the objective of “carbon neutrality” by 2060, improving the economic efficiency of hydrogen energy is important. The estimation of hydrogen prices can provide insights for decision makers about the potential for large-scale deployment of hydrogen energy from the economic perspective. A novel model is established to estimate the hydrogen price in China by 2060 based on combined machine learning models. The hydrogen prices prediction model is built from the perspectives of economics and machine learning. The features that affect hydrogen prices are selected and an effective feature set is constructed. The hydrogen price is mainly determined by hydrogen production and demand and cost. The hydrogen production is predicted according to the uses of hydrogen. The major influencing factors, including the number of FCV, synthetic ammonia production, methanol production, gasoline production, and diesel production, are selected to establish the relationship with the hydrogen production. The hydrogen production prediction model is trained and tested based on the PSO-BP neural network. The results show that the established model exhibits good prediction performance. The hydrogen production is predicted based on the trained PSO-BP neural network. The results show that the hydrogen production increases year by year, exceeding the estimated hydrogen demand, which is beneficial for reducing hydrogen prices. Based on the main hydrogen production technologies in China, the prices of natural gas, coal, and electricity, and the green hydrogen share are selected as the main factors influencing hydrogen costs. The hydrogen prices prediction model is trained and tested based on BO-LSSVM. The results show that the hydrogen price is estimated to decrease below CNY 24/kg by 2030 (“carbon peak”) and CNY 12/kg by 2060 (“carbon neutrality”), showing economic competitivity compared to the traditional fuels (such as gasoline and diesel). The regional variations within China have also been analyzed. In the future, green hydrogen will account for a larger proportion. Northwest China will have a hydrogen price advantage due to the lower electricity costs. The predicted low hydrogen prices will help strengthen the confidence of decision makers in the realization of the hydrogen economy. Considering that scale-up will be the biggest driver of cost reduction, this will also promote the infrastructure construction. Moreover, considering the huge emission reduction potential of green hydrogen and the regional variations in clean power resources, it is recommended to increase hydrogen production in provinces with abundant clean electricity resources. The results are sensitive to the assumptions and the existing carbon tax policy. In the future, the proposed method can be fused with other methods (such as bottom-up methods and learning rate methods) to improve the accuracy.
Author Contributions
Conceptualization, C.Y. and L.J.; methodology, C.Y. and L.J.; software, validation, formal analysis, investigation, resources, writing—original draft preparation, data curation, writing—review and editing, visualization, C.Y.; supervision, L.J.; project administration, L.J. All authors have read and agreed to the published version of the manuscript.
Funding
No external funding was provided for this study.
Institutional Review Board Statement
Not applicable.
Informed Consent Statement
Not applicable.
Data Availability Statement
The data are available from the corresponding author on reasonable request.
Conflicts of Interest
The authors declare no conflicts of interest.
Appendix A

Table A1.
The FCV ownership, synthetic ammonia production, methanol production, gasoline production, and diesel production from 2012 to 2023.
Table A1.
The FCV ownership, synthetic ammonia production, methanol production, gasoline production, and diesel production from 2012 to 2023.
| Year | FCV Ownership | Synthetic Ammonia Production/104t | Methanol Production/104t | Gasoline Production/104t | Diesel Production/104t |
|---|---|---|---|---|---|
| 2012 | 0 | 5528 | 3129 | 9000 | 17,063 |
| 2013 | 0 | 5385 | 2812 | 9800 | 17,275 |
| 2014 | 0 | 5700 | 3630 | 11,000 | 17,635 |
| 2015 | 10 | 5791 | 3886 | 12,100 | 18,008 |
| 2016 | 639 | 5708 | 4193 | 12,900 | 17,917 |
| 2017 | 1914 | 4946 | 4448 | 13,300 | 18,318 |
| 2018 | 3441 | 4587 | 5522 | 14,000 | 17,376 |
| 2019 | 6178 | 4755 | 6216 | 14,100 | 16,638 |
| 2020 | 7355 | 5117 | 6357 | 13,200 | 15,904 |
| 2021 | 8941 | 5189 | 7765 | 15,500 | 16,337 |
| 2022 | 12,730 | 5321 | 8100 | 14,600 | 19,125 |
| 2023 | 18,530 | 5489 | 8317 | 16,100 | 21,729 |
Table A2.
The annual average prices of natura gas and coal from 2012 to 2023.
Table A2.
The annual average prices of natura gas and coal from 2012 to 2023.
| Year | Natural Gas Price/(Yuan/t) | Coal Price/(Yuan/t) |
|---|---|---|
| 2012 | 5476 | 580 |
| 2013 | 6187 | 430 |
| 2014 | 5043 | 408 |
| 2015 | 4225 | 500 |
| 2016 | 4611 | 310 |
| 2017 | 3396 | 490.7 |
| 2018 | 3661 | 470 |
| 2019 | 4415 | 462 |
| 2020 | 3232 | 416.7 |
| 2021 | 3320 | 681.7 |
| 2022 | 8103 | 916 |
| 2023 | 5832 | 771.7 |
References
- Jung, J.; Lee, D.-J.; Yoshida, K. Comparison between Korean and Japanese consumers’ preferences for fuel cell electric vehicles. Transp. Res. Part. D Transp. Environ. 2022, 113, 103511. [Google Scholar] [CrossRef]
- Wang, Y.; Guo, C.; Chen, X.; Jia, L.; Guo, X.; Chen, R.; Zhang, M.; Chen, Z.; Wang, H. Carbon peak and carbon neutrality in China: Goals, implementation path and prospects. China Geol. 2021, 4, 720–746. [Google Scholar] [CrossRef]
- Yang, P.; Peng, S.; Benani, N.; Dong, L.; Li, X.; Liu, R.; Mao, G. An integrated evaluation on China’s provincial carbon peak and carbon neutrality. J. Clean. Prod. 2022, 377, 134497. [Google Scholar] [CrossRef]
- Dieterich, V.; Buttler, A.; Hanel, A.; Spliethoff, H.; Fendt, S. Power-to-liquid via synthesis of methanol, DME or Fischer-Tropsch-fuels: A review. Energy Environ. Sci. 2020, 13, 3207–3252. [Google Scholar] [CrossRef]
- Van Hoecke, L.; Laffineur, L.; Campe, R.; Perreault, P.; Verbruggen, S.W.; Lenaerts, S. Challenges in the use of hydrogen for maritime applications. Energy Environ. Sci. 2021, 14, 815–843. [Google Scholar] [CrossRef]
- Brändle, G.; Schönfisch, M.; Schulte, S. Estimating long-term global supply costs for low-carbon hydrogen. Appl. Energy 2021, 302, 117481. [Google Scholar] [CrossRef]
- Utomo, O.; Abeysekera, M.; Ugalde-Loo, C.E. Optimal operation of a hydrogen storage and fuel cell coupled integrated energy system. Sustainability 2021, 13, 3525. [Google Scholar] [CrossRef]
- Rasul, M.; Hazrat, M.; Sattar, M.; Jahirul, M.; Shearer, M. The future of hydrogen: Challenges on production, storage and applications. Energy Convers. Manag. 2022, 272, 116326. [Google Scholar] [CrossRef]
- Ajanovic, A.; Haas, R. Economic prospects and policy framework for hydrogen as fuel in the transport sector. Energy Policy 2018, 123, 280–288. [Google Scholar] [CrossRef]
- Le Duigou, A.; Quéméré, M.-M.; Marion, P.; Menanteau, P.; Decarre, S.; Sinegre, L.; Nadau, L.; Rastetter, A.; Cuni, A.; Mulard, P. Hydrogen pathways in France: Results of the HyFrance3 project. Energy Policy 2013, 62, 1562–1569. [Google Scholar] [CrossRef]
- Tang, O.; Rehme, J.; Cerin, P.; Huisingh, D. Hydrogen production in the Swedish power sector: Considering operational volatilities and long-term uncertainties. Energy Policy 2021, 148, 111990. [Google Scholar] [CrossRef]
- Zhigang, S.; Baolian, Y. Developing trend and present status of hydrogen energy and fuel cell development. Bull. Chin. Acad. Sci. 2019, 34, 469–477. [Google Scholar]
- Li, Y.; Kimura, S. Economic competitiveness and environmental implications of hydrogen energy and fuel cell electric vehicles in ASEAN countries: The current and future scenarios. Energy Policy 2021, 148, 111980. [Google Scholar] [CrossRef]
- Hu, D.; Zhang, J.; Huang, J.; Li, J.; Yang, Q.; Wang, J. Speed fluctuation suppression control of super-high-speed electric air compressors considering high-frequency electromagnetic excitation. IEEE Trans. Power Electron. 2024, 39, 9650–9660. [Google Scholar] [CrossRef]
- George, J.F.; Müller, V.P.; Winkler, J.; Ragwitz, M. Is blue hydrogen a bridging technology?-The limits of a CO2 price and the role of state-induced price components for green hydrogen production in Germany. Energy Policy 2022, 167, 113072. [Google Scholar] [CrossRef]
- Maggio, G.; Nicita, A.; Squadrito, G. How the hydrogen production from RES could change energy and fuel markets: A review of recent literature. Int. J. Hydrog. Energy 2019, 44, 11371–11384. [Google Scholar] [CrossRef]
- Ueckerdt, F.; Bauer, C.; Dirnaichner, A.; Everall, J.; Sacchi, R.; Luderer, G. Potential and risks of hydrogen-based e-fuels in climate change mitigation. Nat. Clim. Change 2021, 11, 384–393. [Google Scholar] [CrossRef]
- Glenk, G.; Reichelstein, S. Economics of converting renewable power to hydrogen. Nat. Energy 2019, 4, 216–222. [Google Scholar] [CrossRef]
- Dumančić, A.; Vlahinić Lenz, N.; Wagmann, L. Profitability Model of Green Hydrogen Production on an Existing Wind Power Plant Location. Sustainability 2024, 16, 1424. [Google Scholar] [CrossRef]
- González-Delgado, Á.D.; Vargas-Mira, A.; Zuluaga-García, C. Economic Evaluation and Technoeconomic Resilience Analysis of Two Routes for Hydrogen Production via Indirect Gasification in North Colombia. Sustainability 2023, 15, 16371. [Google Scholar] [CrossRef]
- Nicita, A.; Maggio, G.; Andaloro, A.; Squadrito, G. Green hydrogen as feedstock: Financial analysis of a photovoltaic-powered electrolysis plant. Int. J. Hydrog. Energy 2020, 45, 11395–11408. [Google Scholar] [CrossRef]
- Madeira, J.G.F.; Oliveira, E.M.; Springer, M.V.; Cabral, H.L.; do Carmo Barbeito, D.F.; Souza, A.P.G.; da Silva Moura, D.A.; Delgado, A.R.S. Hydrogen production from swine manure biogas via steam reforming of methane (SRM) and water gas shift (WGS): A ecological, technical, and economic analysis. Int. J. Hydrog. Energy 2021, 46, 8961–8971. [Google Scholar] [CrossRef]
- Almutairi, K.; Dehshiri, S.S.H.; Dehshiri, S.J.H.; Mostafaeipour, A.; Jahangiri, M.; Techato, K. Technical, economic, carbon footprint assessment, and prioritizing stations for hydrogen production using wind energy: A case study. Energy Strategy Rev. 2021, 36, 100684. [Google Scholar] [CrossRef]
- Al-Mufachi, N.A.; Shah, N. The role of hydrogen and fuel cell technology in providing security for the UK energy system. Energy Policy 2022, 171, 113286. [Google Scholar] [CrossRef]
- Hu, D.; Wang, Y.; Li, J.; Wang, J.; Yang, Q. Energy saving control of waste heat utilization subsystem for fuel cell vehicle. IEEE Trans. Transp. Electrif. 2023, 10, 3192–3205. [Google Scholar] [CrossRef]
- Lee, B.; Lee, H.; Cho, H.-S.; Cho, W.-C.; Kim, C.-H.; Lim, H. Projected economic outlook and scenario analysis for H 2 production by alkaline water electrolysis on the basis of the unit electricity price, the learning rate, and the automation level. Sustain. Energy Fuels 2019, 3, 1799–1807. [Google Scholar] [CrossRef]
- Gerloff, N. Economic analysis of hydrogen production in Germany with a focus on green hydrogen, considering all three major water electrolysis technologies. Sustain. Energy Fuels 2023, 7, 1893–1907. [Google Scholar] [CrossRef]
- Povacz, L.; Bhandari, R. Analysis of the levelized cost of renewable hydrogen in Austria. Sustainability 2023, 15, 4575. [Google Scholar] [CrossRef]
- Davis, M.; Okunlola, A.; Di Lullo, G.; Giwa, T.; Kumar, A. Greenhouse gas reduction potential and cost-effectiveness of economy-wide hydrogen-natural gas blending for energy end uses. Renew. Sustain. Energy Rev. 2023, 171, 112962. [Google Scholar] [CrossRef]
- Dodds, P. Economics of Hydrogen Production. In Compendium of Hydrogen Energy; Elsevier: Amsterdam, Netherlands, 2015; pp. 63–79. [Google Scholar]
- Lux, B.; Pfluger, B. A supply curve of electricity-based hydrogen in a decarbonized European energy system in 2050. Appl. Energy 2020, 269, 115011. [Google Scholar] [CrossRef]
- Miyagawa, T.; Goto, M. Hydrogen production cost forecasts since the 1970s and implications for technological development. Energies 2022, 15, 4375. [Google Scholar] [CrossRef]
- Lane, B.; Reed, J.; Shaffer, B.; Samuelsen, S. Forecasting renewable hydrogen production technology shares under cost uncertainty. Int. J. Hydrog. Energy 2021, 46, 27293–27306. [Google Scholar] [CrossRef]
- Lemus, R.G.; Duart, J.M.M. Updated hydrogen production costs and parities for conventional and renewable technologies. Int. J. Hydrog. Energy 2010, 35, 3929–3936. [Google Scholar] [CrossRef]
- Frieden, F.; Leker, J. Future costs of hydrogen: A quantitative review. Sustain. Energy Fuels 2024, 8, 1806–1822. [Google Scholar] [CrossRef]
- Zhang, W.; Li, X.; Yang, J.; Liu, J.; Xu, C. Economic analysis of hydrogen production from China’s province-level power grid considering carbon emissions. Clean. Energy 2023, 7, 30–40. [Google Scholar] [CrossRef]
- Bolz, S.; Thiele, J.; Wendler, T. Regional capabilities and hydrogen adoption barriers. Energy Policy 2024, 185, 113934. [Google Scholar] [CrossRef]
- Mauler, L.; Duffner, F.; Zeier, W.G.; Leker, J. Battery cost forecasting: A review of methods and results with an outlook to 2050. Energy Environ. Sci 2021, 14, 4712–4739. [Google Scholar] [CrossRef]
- Hong, Y.; Rong, X.; Liu, W. Construction of influencing factor segmentation and intelligent prediction model of college students’ cell phone addiction model based on machine learning algorithm. Heliyon 2024, 10, e29245. [Google Scholar] [CrossRef]
- Liu, Z.; Ma, Q.; Zhang, T.; Zhao, S.; Gao, X.; Sun, T.; Dai, Y. Quantitative modeling and uncertainty estimation for small-sample LIBS using Gaussian negative log-likelihood and monte carlo dropout methods. Opt. Laser Technol. 2025, 181, 111720. [Google Scholar] [CrossRef]
- Gogas, P.; Papadimitriou, T. Machine learning in economics and finance. Comput. Econ. 2021, 57, 1–4. [Google Scholar] [CrossRef]
- Kokol, P.; Kokol, M.; Zagoranski, S. Machine learning on small size samples: A synthetic knowledge synthesis. Sci. Prog. 2022, 105, 00368504211029777. [Google Scholar] [CrossRef]
- Hu, D.; Wang, Y.; Li, J.; Yang, Q.; Wang, J. Investigation of optimal operating temperature for the PEMFC and its tracking control for energy saving in vehicle applications. Energy Convers. Manag. 2021, 249, 114842. [Google Scholar] [CrossRef]
- Hydrogen Council. Path to Hydrogen Competitiveness: A Cost Perspective. 2020. Available online: https://www.h2knowledgecentre.com/content/policypaper1202?crawler=redirect&mimetype=application/pdf (accessed on 23 January 2025).
- Suykens, J.A.; Vandewalle, J. Least squares support vector machine classifiers. Neural Process Lett. 1999, 9, 293–300. [Google Scholar] [CrossRef]
- Zhao, F.; Mu, Z.; Hao, H.; Liu, Z.; He, X.; Victor Przesmitzki, S.; Ahmad Amer, A. Hydrogen fuel cell vehicle development in China: An industry chain perspective. Energy Technol. 2020, 8, 2000179. [Google Scholar] [CrossRef]

Disclaimer/Publisher’s Note: The statements, opinions and data contained in all publications are solely those of the individual author(s) and contributor(s) and not of MDPI and/or the editor(s). MDPI and/or the editor(s) disclaim responsibility for any injury to people or property resulting from any ideas, methods, instructions or products referred to in the content. |
© 2025 by the authors. Licensee MDPI, Basel, Switzerland. This article is an open access article distributed under the terms and conditions of the Creative Commons Attribution (CC BY) license (https://creativecommons.org/licenses/by/4.0/).