Article

Research on the Nested Structure and Substitution Elasticity of China’s Power Energy Sources

School of Economics, Beijing Wuzi University, Beijing 101149, China
*
Author to whom correspondence should be addressed.
Sustainability 2025, 17(3), 1098; https://doi.org/10.3390/su17031098
Submission received: 29 November 2024 / Revised: 23 January 2025 / Accepted: 28 January 2025 / Published: 29 January 2025

Abstract

:
In alignment with China’s “carbon peak and carbon neutrality” goals, carbon reduction and energy structure transformation are central priorities. As a major emitter, the power industry plays a key role in this transition, and identifying effective pathways for its green energy transformation is essential to driving broader industrial green transformation and ensuring sustainable development. This article calculates the elasticity of substitution between clean and non-clean energy within China’s power sector from 1993 to 2021, employing the kernel density estimation method. By further comparing the goodness-of-fit across various nested structures of clean energy sources, the study identifies the optimal internal nested structure and examines the interactions among its components. The results underscore two key insights: on the one hand, a robust substitutive relationship exists between clean and non-clean energy, with the substitution elasticity of 1.646, exhibiting pronounced regional heterogeneity characterized as “weaker in the east and stronger in the west”; on the other hand, the optimal nested structure of clean energy is identified as (hydropower + nuclear power)—wind power—solar power. In this structure, the elements display a substitutive relationship in the Eastern Region, while in the Western Region, they exhibit a complementary relationship.

1. Introduction

The issue of global warming caused by excessive carbon emissions has become a critical challenge that humanity must confront and urgently resolve. In response, the United Nations has strongly advocated for the global community to adopt the Paris Agreement, a climate change accord, urging signatories to establish clear emissions reduction targets tailored to their respective national circumstances [1]. China has actively heeded the United Nations’ call, setting ambitious dual-carbon targets: to achieve peak carbon emissions by 2030 and carbon neutrality by 2060 [2]. Concurrently, with the advent of the Industry 4.0 era, characterized by information technology, a new industrial revolution is unfolding worldwide. Countries are strategically positioning themselves in advanced manufacturing, artificial intelligence, and other emerging fields, with the development of low-carbon, energy-efficient industries being indispensable for realizing the dual-carbon goals [3]. The cornerstone of achieving the dual-carbon goals is a fundamental transition to a modern energy structure, which, at its economic essence, entails the development of a low-carbon economy and ultimately advancing toward a zero-carbon economy [4]. Looking to the future, non-clean energy sources such as coal and oil will inevitably be phased out, while clean energy—primarily solar and wind power—will emerge as the dominant force [5]. This shift in energy structure has become increasingly evident in recent years. Prominent oil companies are channeling investments into the research and development of new energy sources like solar and wind [6], accelerating their pivot toward non-oil sectors [7]. Meanwhile, governments worldwide are imposing more stringent greenhouse gas emission standards across industries [8], compelling high-energy-consuming and polluting sectors to undergo energy restructuring [9]. These developments clearly signal that the establishment of a new energy system is both necessary and imminent [10].
As a key sector in energy consumption and carbon emissions, the power industry has been subject to heightened expectations, driven by the need to align with broader industrial transformation trends. Countries have responded by setting higher standards and actively advancing energy structure reforms. Germany, for instance, has significantly expanded the share of renewable energy in its power mix through the “Energiewende” policy, with clean energy now accounting for over 50% of total electricity generation [11]. The United States has similarly accelerated investment in clean energy through the Inflation Reduction Act, achieving significant progress in offshore wind power [12]. Furthermore, Nordic countries are renowned for their deep integration of clean energy; Norway’s hydropower constitutes over 90% of its electricity generation [13], while Denmark has become a global leader in wind energy technology [14]. China has also made remarkable progress in the green transformation of its power sector. It is now the world’s largest producer and consumer of renewable energy, with its wind and solar capacities consistently leading the globe year after year—an impressive turnaround from their near-zero levels at the dawn of the 21st century [15]. Projections indicate that, in order to achieve the carbon peak target by 2030, China’s wind and solar capacity will reach 1.2 billion kw by that time. By 2060, when carbon neutrality is achieved, these capacities are expected to soar to an extraordinary 6 billion kw [16].
To achieve the comprehensive green transformation of the power industry, constructing a new energy system must be prioritized. As the core element of the energy structure, understanding the substitution capacity between non-clean and clean energy generation, as well as the nested structure within clean energy, is essential. This understanding directly impacts the ability of the country to formulate appropriate environmental and industrial policies tailored to the characteristics of clean and non-clean energy sources. It also determines the feasibility of optimizing production by combining various energy inputs. Therefore, analyzing the nested relationships between energy factors from a substitution perspective provides a critical foundation for developing policies aimed at transforming the power industry. It also offers essential decision-making insights for building China’s new energy system and fostering long-term economic sustainability.
Currently, most substitution elasticities between energy factors are derived from the Allen elasticity of substitution (AES) [17], which requires prior fitting of production functions related to electricity generation [18,19]. Different functional forms are employed to estimate the substitution elasticity between energy types. Initially, the C-D (Cobb–Douglas) or Leontief functions were used to model relationships between energy factors, which are indicative of either substitution or complementary relationships [20,21]. Subsequently, the CES (constant elasticity of substitution) function expanded the range of substitution elasticity, allowing a more general representation of energy relationships and accommodating nested structures [22,23]. The trans-log production function (TPF), which is a Taylor expansion of the CES function, is particularly suitable for evaluating substitution capacities between factors at various stages [24,25]. In contrast to parameter-heavy functions and complex economic assumptions, nonparametric methods offer flexibility, allowing for a more generalized, nonlinear analysis of substitution elasticities [26,27].
The academic community continues to debate whether clean energy can adequately replace non-clean energy within power systems and the extent to which this substitution is feasible. Some researchers, using the MSE (Morishima elasticity of substitution) to examine clean versus non-clean energy, argue that clean energy does not adequately replace non-clean energy [28]. Conversely, other scholars, using the PEC (Pigou elasticity of complementarity), arrive at the opposite conclusion [29]. Most scholars contend that clean energy sources within the power sector exhibit synergistic and complementary dynamics [30,31]. This interdependence enables the coupling of diverse energy types, fostering a sustainable and reliable electricity supply [32]. Furthermore, scholars using the UCRCD model to analyze the pairing of hydropower, wind, nuclear, and solar energy highlight that optimizing the collaborative configuration of these energy types is crucial for achieving a successful energy transition [33].
In production functions with only two input factors, the elasticity of substitution effectively captures the strength of the substitution or complementary relationship between the factors. However, when the number of input factors increases to three or more, relying solely on the elasticity of substitution is insufficient, as the relationships between factors do not always follow a parallel structure. Instead, a more complex vertical structure often emerges [34]. A nested structure composed of multiple factors is a central focus in current energy structure research. Previous studies on nested structures have predominantly focused on three input factors: capital, labor, and energy [35]. The (K-E)-L nested structure, in particular, aligns well with the operational reality of China’s industrial sectors [36]. Most scholars evaluate the optimal nested structure based on model fit or parameter significance [37]. Some also compare production function models under different nested structures to real-world conditions to identify the most appropriate configuration [38], while a few enhance the credibility of their findings through hypothesis testing [39]. Many scholars have developed nested structures for clean energy generation based on electricity balance, asserting that China’s clean electricity production depends on a coupled system of hydropower, wind, and solar energy [40]. However, few studies have empirically examined the origins of the optimal nested structure within clean energy or explained why complementary relationships emerge within such a structure.
In conclusion, existing studies on the substitution elasticity between clean and non-clean energy primarily rely on parameter estimation using CES or trans-log production functions, with resulting elasticity values varying widely. Moreover, there is no consensus in the literature regarding the nested structure within clean energy from a mathematical standpoint. Against this backdrop, this study makes two key contributions: First, it applies the Gaussian kernel for nonparametric model fitting, utilizes cross-validation to determine the optimal bandwidth, and employs numerical differentiation to construct confidence intervals for the substitution elasticity statistic, ensuring both accuracy and robustness in the nonparametric estimates. Second, it calculates the substitution elasticity between clean and non-clean energy sources within China’s power sector at the provincial level, compares the nonparametric fitting quality of various clean energy nested models, identifies the optimal nested structure within clean energy, and assesses the relationships between elements within that structure.

2. Materials and Methods

2.1. Materials

2.1.1. Indicator Selection

This study adopts the annual total electricity generation of each province as the measure of total output in the production function. To effectively mitigate issues of multicollinearity, the installed capacities of various types of electricity generation are selected as the input factors, categorized into non-clean and clean energy generation. Non-clean energy generation encompasses thermal power, while clean energy generation is further classified into hydropower, nuclear power, wind power, and solar power.

2.1.2. Data Sources

Considering data availability, this study utilizes panel data from 31 Chinese provinces spanning the years 1993 to 2021 as the research sample. Notably, wind power and solar power, as components of China’s clean energy portfolio, began in 2005 and 2011, respectively. The data on annual electricity generation and installed capacity for non-clean energy (thermal power) and clean energy (hydropower, nuclear power, wind power, and solar power) are primarily derived from the China Electric Power Statistical Yearbook, the National Energy Administration, and the official website of the China Electricity Council.

2.2. Methods

The models used to estimate the electricity production function can be broadly classified into parametric and nonparametric models. Parametric models, which impose numerous constraints and rely on fixed functional forms, are limited by a linear perspective. Specifically, the C-D and Leontief models are designed to simulate scenarios where the elasticity of substitution between factors is fixed at 1 and 0, respectively. These models are commonly employed in the construction of computable general equilibrium (CGE) models but are unsuitable for estimating substitution elasticity. In contrast, the CES model and its derived TPF model relax the assumption of a constant substitution elasticity between factors. However, the substitution elasticity estimated by the parametric model is a fixed value, whereas in reality, the substitution relationship between factors may vary in response to various internal and external factors. This leads to significant discrepancies in the estimates of substitution elasticity between clean and non-clean energy, as observed in several studies [18,28,41].
Currently, there is no universally accepted functional form for power generation models in the academic literature, and a wide range of parametric models have been employed in scholarly research. Among them, the C-D and TPF models are widely adopted; however, both impose stringent assumptions on factor substitutability. The C-D function presumes a unitary elasticity of substitution, while the TPF model constrains this elasticity to be close to 1. Nevertheless, in reality, power generation levels vary across regions and countries due to differences in resource endowments, making it unlikely that these theoretical assumptions hold universally. Unlike parametric models, nonparametric models do not rely on predefined functional forms, impose fewer assumptions, and transcend the constraints of linear models. The production functions derived from nonparametric models can better capture the complex relationships between variables, with the estimated substitution elasticity varying depending on the specific data points. Table 1 summarizes the functional forms of different types of production functions, along with the elasticity of substitution between variables for each form. Therefore, in this study, we follow the approach proposed by Malikov [19] and adopt a nonparametric model to better reflect the real-world dynamics of electricity production.

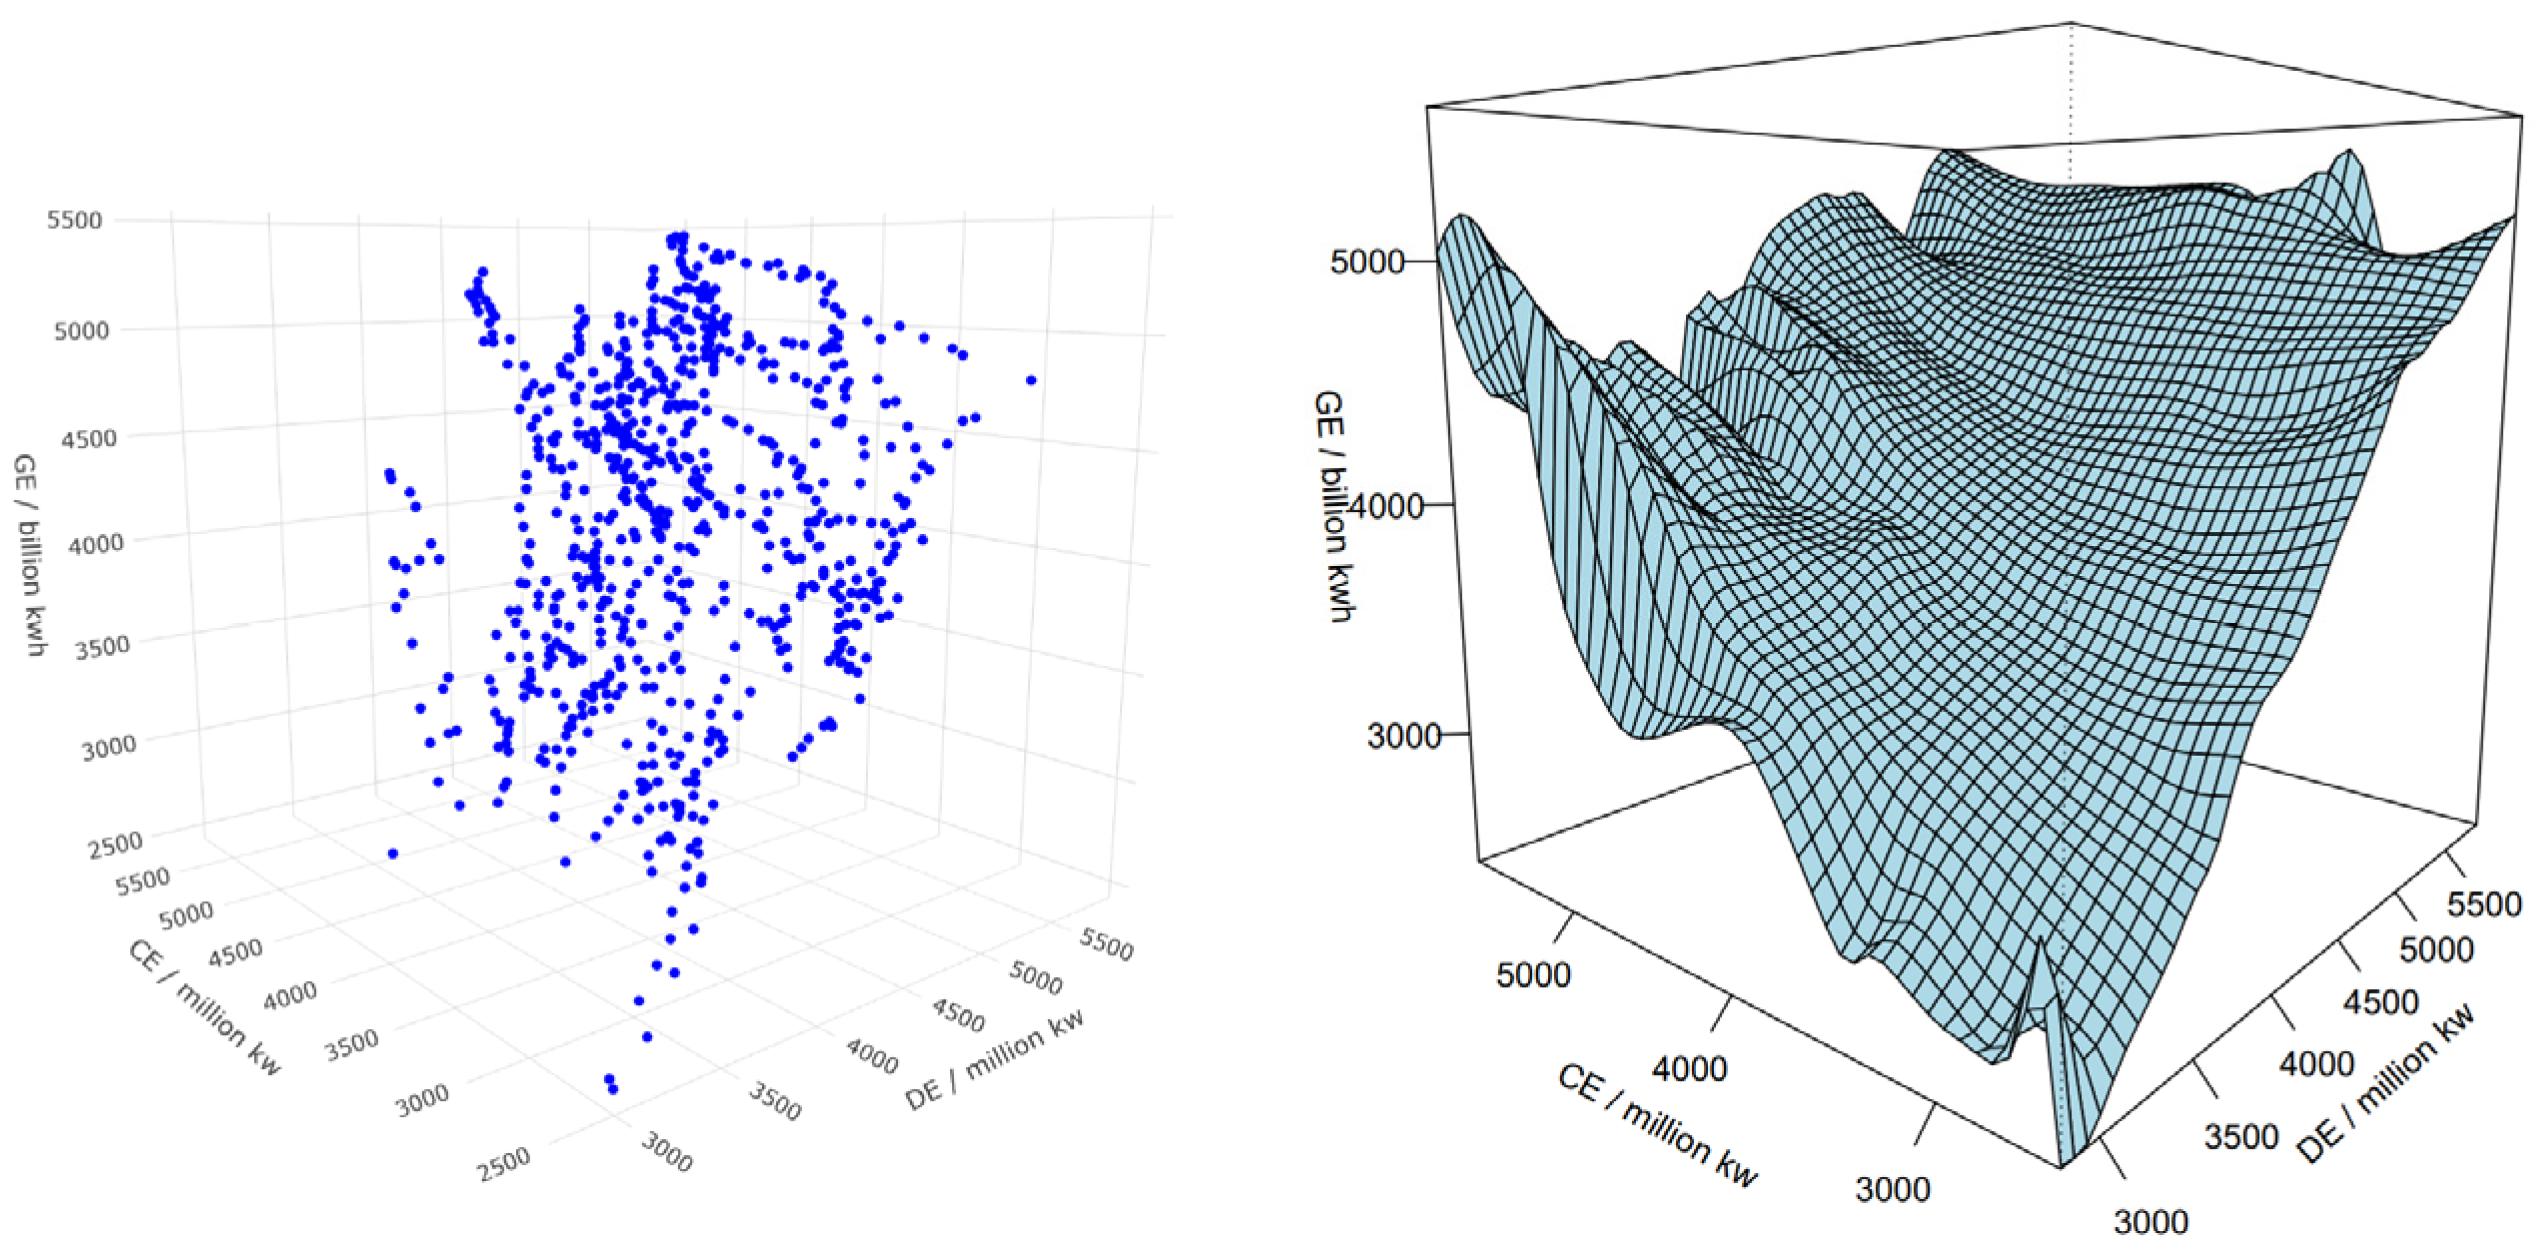
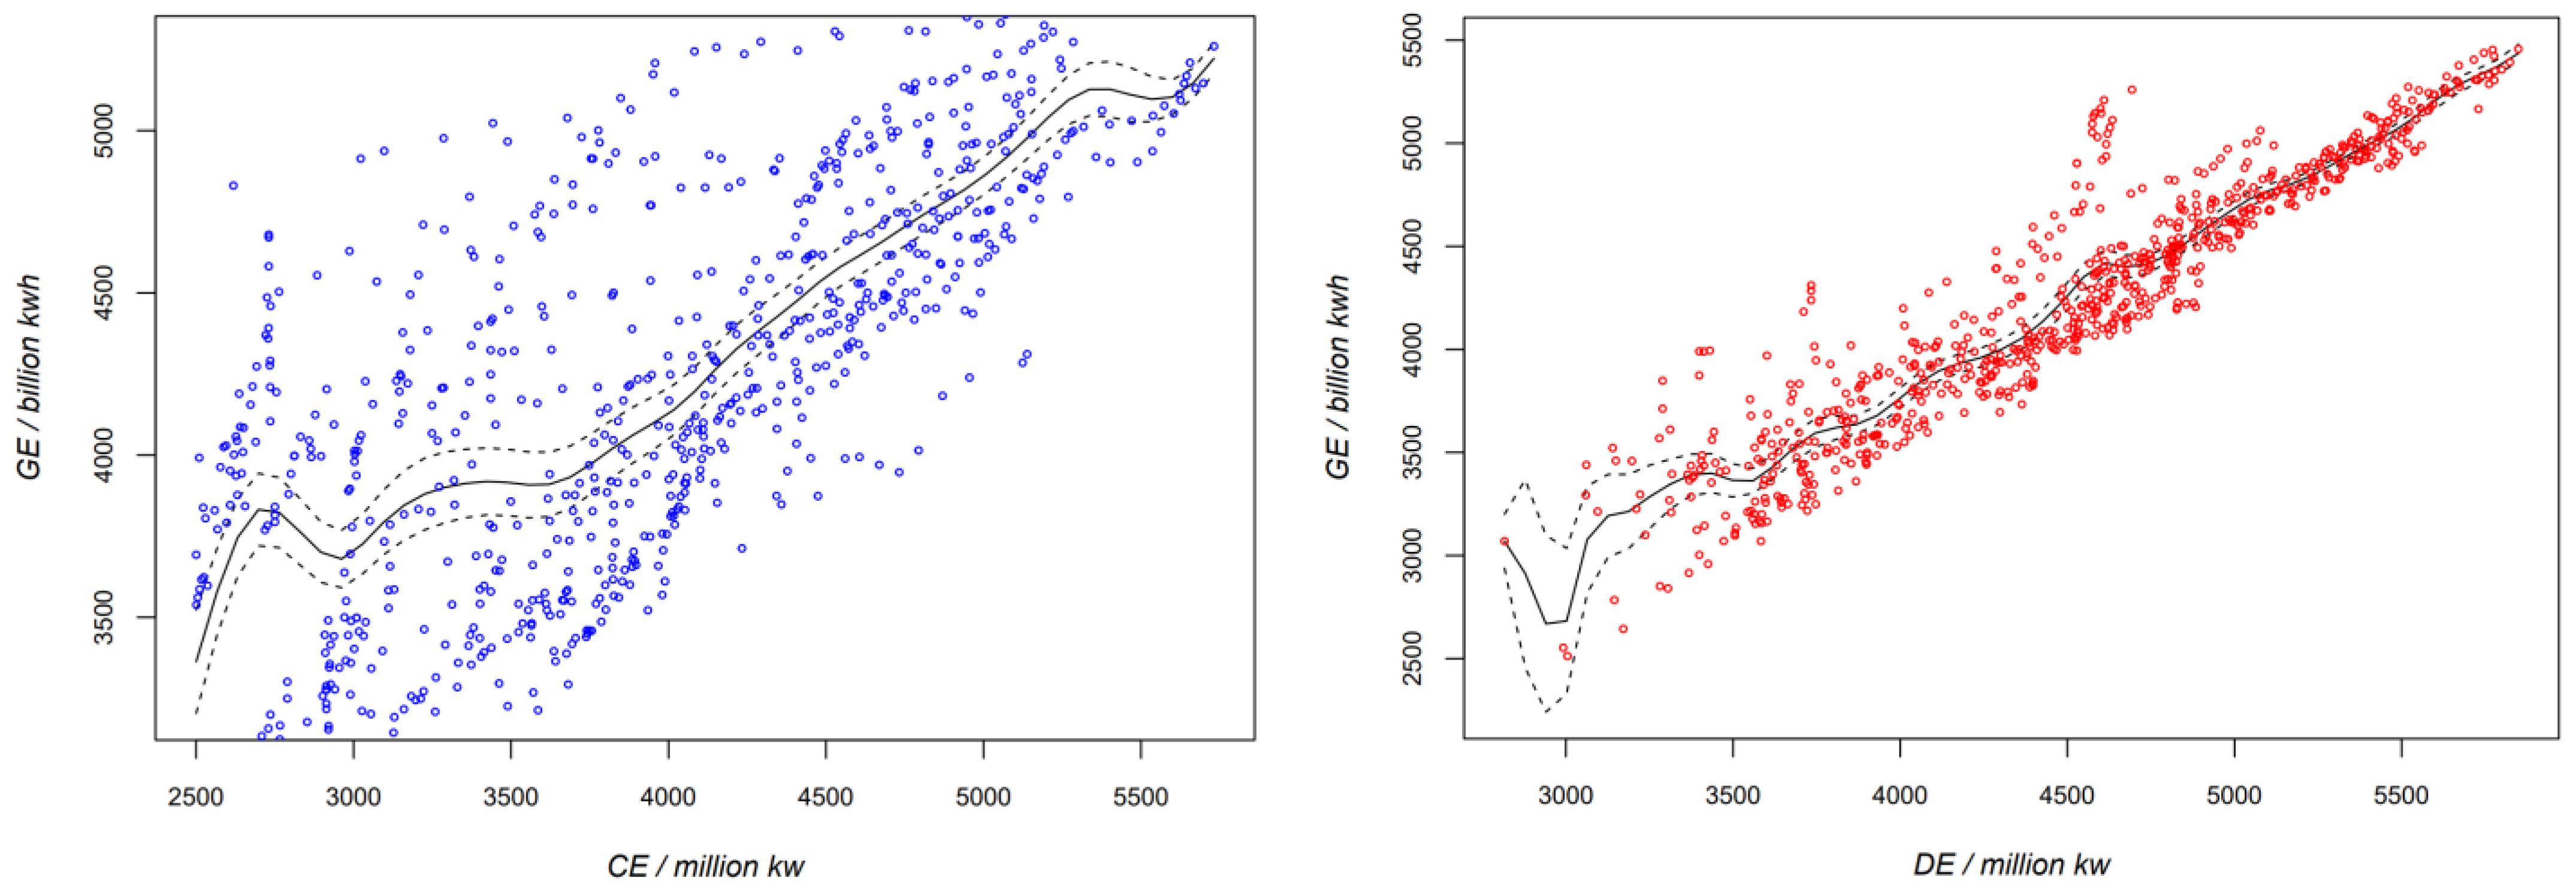
2.2.1. Nonparametric Production Function Model

With reference to the production function model within the power sector constructed by Papageorgiou [18], the following nonparametric production function model is developed:
G E i t = f C E i t , D E i t , D i t + ε i t
where the subscripts i and t, respectively, represent different provinces and years. GE denotes the total generated electricity in a given year for a specific province, while CE and DE represent the installed capacity of clean and dirty energy, respectively. D is a discrete and ordinal time variable.
Due to space limitations, the mathematical derivation of the nonparametric production function model is included in Appendix A. Traditional econometric regression models operate within a linear space framework, seeking to identify a linear combination of explanatory variables that minimizes the discrepancy between predicted and observed values. In contrast, nonparametric models depart from this perspective, leveraging raw data to assign varying weights to each observation based on specific rules. These weights are then used to compute the model’s predictions. The rules governing the weight assignment in nonparametric estimation are defined by kernel functions. Common kernel functions include the Gaussian kernel, quartic kernel, uniform kernel, and triangle kernel. Typically, the closer the Euclidean distance between an observation and the prediction point, the greater the weight assigned to the observation. Beyond a certain threshold distance, observations are considered to have no influence on the predicted value. This threshold, referred to as the bandwidth in nonparametric estimation, plays a critical role in the model’s performance. The optimal bandwidth is often determined using methods such as cross-validation, though alternatives like refined plug-in methods are also commonly utilized.
For the nonparametric production function model, the selection of the kernel function and bandwidth is of paramount importance. Table 2 provides the functional forms of various kernel functions, along with their respective strengths and weaknesses. This study opts for the Gaussian kernel function for nonparametric estimation, guided by two principal considerations. Firstly, the subsequent estimation of the elasticity of substitution between power energy sources necessitates the computation of the second-order gradient of the production function. The Gaussian kernel guarantees that the resulting fitted function is sufficiently smooth and possesses a well-defined second-order gradient. Secondly, the estimation process involves kernel convolution, where the Gaussian kernel’s property of being a normal distribution proves advantageous. Specifically, the Gaussian kernel’s characteristic that linear uncorrelation implies independence significantly simplifies the computational complexity involved in bandwidth selection. The Gaussian kernel function is defined as follows:
K u = 1 2 π e 1 2 u 2 , u ( , + )
Referring to the bandwidth measurement method in Malikov [19], this paper employs cross-validation combined with the least squares method to select the bandwidth. This approach minimizes the sum of squares of errors between the estimated and actual values of the probability density functions of each variable.
C V H = 1 n 2 det H i = 1 n j = 1 n K K H 1 X j X i 2 n n 1 i = 1 n j = 1 , j i n K H X j X i
The probability density function of the total generated electricity is defined as follows:
G E ^ H x = 1 31 × 29 i = 1 31 t = 1993 2021 1 det h C E 0 0 0 h D E 0 0 0 h D K H 1 x X i t   = 1 N T i = 1 31 t = 1993 2021 K H x X i t
In Equation (4), x = (CE, DE, D)T and Xit = (CEit, DEit, Dit)T, where i = 1, …, 31 represents the provinces and t = 1993, …, 2021 represents the years. The matrix H = diag[hCE, hDE, hD] denotes the bandwidth matrix, where hCE, hDE, and hD are the bandwidths for each explanatory variable, determined via cross-validation. The kernel function K H is defined as K H = det H / K H 1 . Here, N represents the total number of provinces in the dataset, and T indicates the time span of the original data.
Assume that the true function between the output generated electricity and input electric energy takes the following form:
E G E X = E G E C E , D E , D = m X
Based on the probability density functions of the explanatory variables and the total amount of electricity generated in each province over the years, the estimates m(X) are given as follows:
m ^ H x = k = 1 N T K H x X k G E k k = 1 N T K H x X k   = k = 1 N T K H x X k k = 1 N T K H x X k G E k
Observing Equation (6), it is evident that a point estimate of the total electricity generation is obtained as a weighted sum based on the original data for electricity generation. The weights are derived from the nonparametric estimation of the probability density function. So far, the solution for the nonparametric production function model of the power industry is completed.

2.2.2. Allen Elasticity of Substitution Measurement

In this paper, the selection of input variables includes only the installed capacity of each type of power generation, excluding other factors such as price. Additionally, the focus of this paper is on the bidirectional substitution relationship between the input factors. Therefore, the Allen elasticity of substitution is appropriately chosen to accurately depict the relationship between electric energies.
For simplicity, consider the expression for the elasticity of substitution in the bivariate case:
y = f x = f x 1 , x 2
Under the condition of constant total output, the elasticity of substitution σ between variables x1 and x2 is defined as follows:
σ = d x 2 / x 1 / x 2 / x 1 d f 1 / f 2 / f 1 / f 2
Originally, Hicks defined the elasticity of substitution as the ratio of the rate of change between two variables to the rate of change between the marginal outputs of the two variables. Let fi represent the first partial derivative at xi. For simplicity, define r = f1/f2. Taking the total differential on both sides of the production function yields the following:
f 1 d x 1 + f 2 d x 2 = 0
r = f 1 f 2 = d x 2 d x 1
Here, r represents the marginal rate of substitution between variables x1 and x2. Generally, the marginal rate of substitution tends to decrease, meaning that under the condition of constant output, as the input of one factor increases, its ability to substitute for other factors diminishes. Specifically,
d x 2 x 1 = x 1 d x 2 x 2 d x 1 x 1 2 = x 1 f 1 / f 2 + x 2 d x 1 x 1 2
Simultaneously, the variable r can also be considered as a function of the variables x1 and x2, denoted as r(x1, x2). Therefore, there is
d r = r x 1 d x 1 + r x 2 d x 2
r x 1 = f 1 / f 2 x 1 = f 11 f 2 f 1 f 21 f 2 2
r x 2 = f 1 / f 2 x 2 = f 12 f 2 f 1 f 22 f 2 2
Substituting dr and dx2 in the definition of elasticity of substitution σ from Equation (8) with dx1 using Equations (12)–(14), and simplifying the result, yields
σ = x 1 f 1 + λ 2 f 2 x 1 x 2 f 1 f 2 f 11 f 2 2 + 2 f 12 f 1 f 2 f 22 f 1 2
The variables in Equation (15) are solely related to the explanatory variables of the original production function, as well as its first and second partial derivatives. The derived Equation (15) is the Allen elasticity of substitution formula utilized in this paper. Next, consider the general case. Assume the nonparametric production function is of the form f(x) = f(x1, …, xn), where xi (i = 1, …, n) represents the input electric energies. This nonparametric production function model exhibits characteristics of constant returns to scale and diminishing marginal rates of substitution. Then, the Allen elasticity of substitution σij between electric energies i and j (i ≠ j) can be expressed as follows:
σ i j = k = 1 n x k f k x i x j F i j F
where
f i = f x i f i j = 2 f x i x j F = d e t 0 , f 1 , f n f 1 , f 11   f 1 n   f n f n 1 , f n n
Fij is the algebraic cofactor after removing the elements fij.
The Allen elasticity of substitution σij is symmetric with respect to the input electric energies i and j (i ≠ j), specifying the bidirectional substitution relationship between the electric energies,
σ i j = σ j i

3. Results and Discussion

3.1. Substitution Between Clean and Dirty Energy

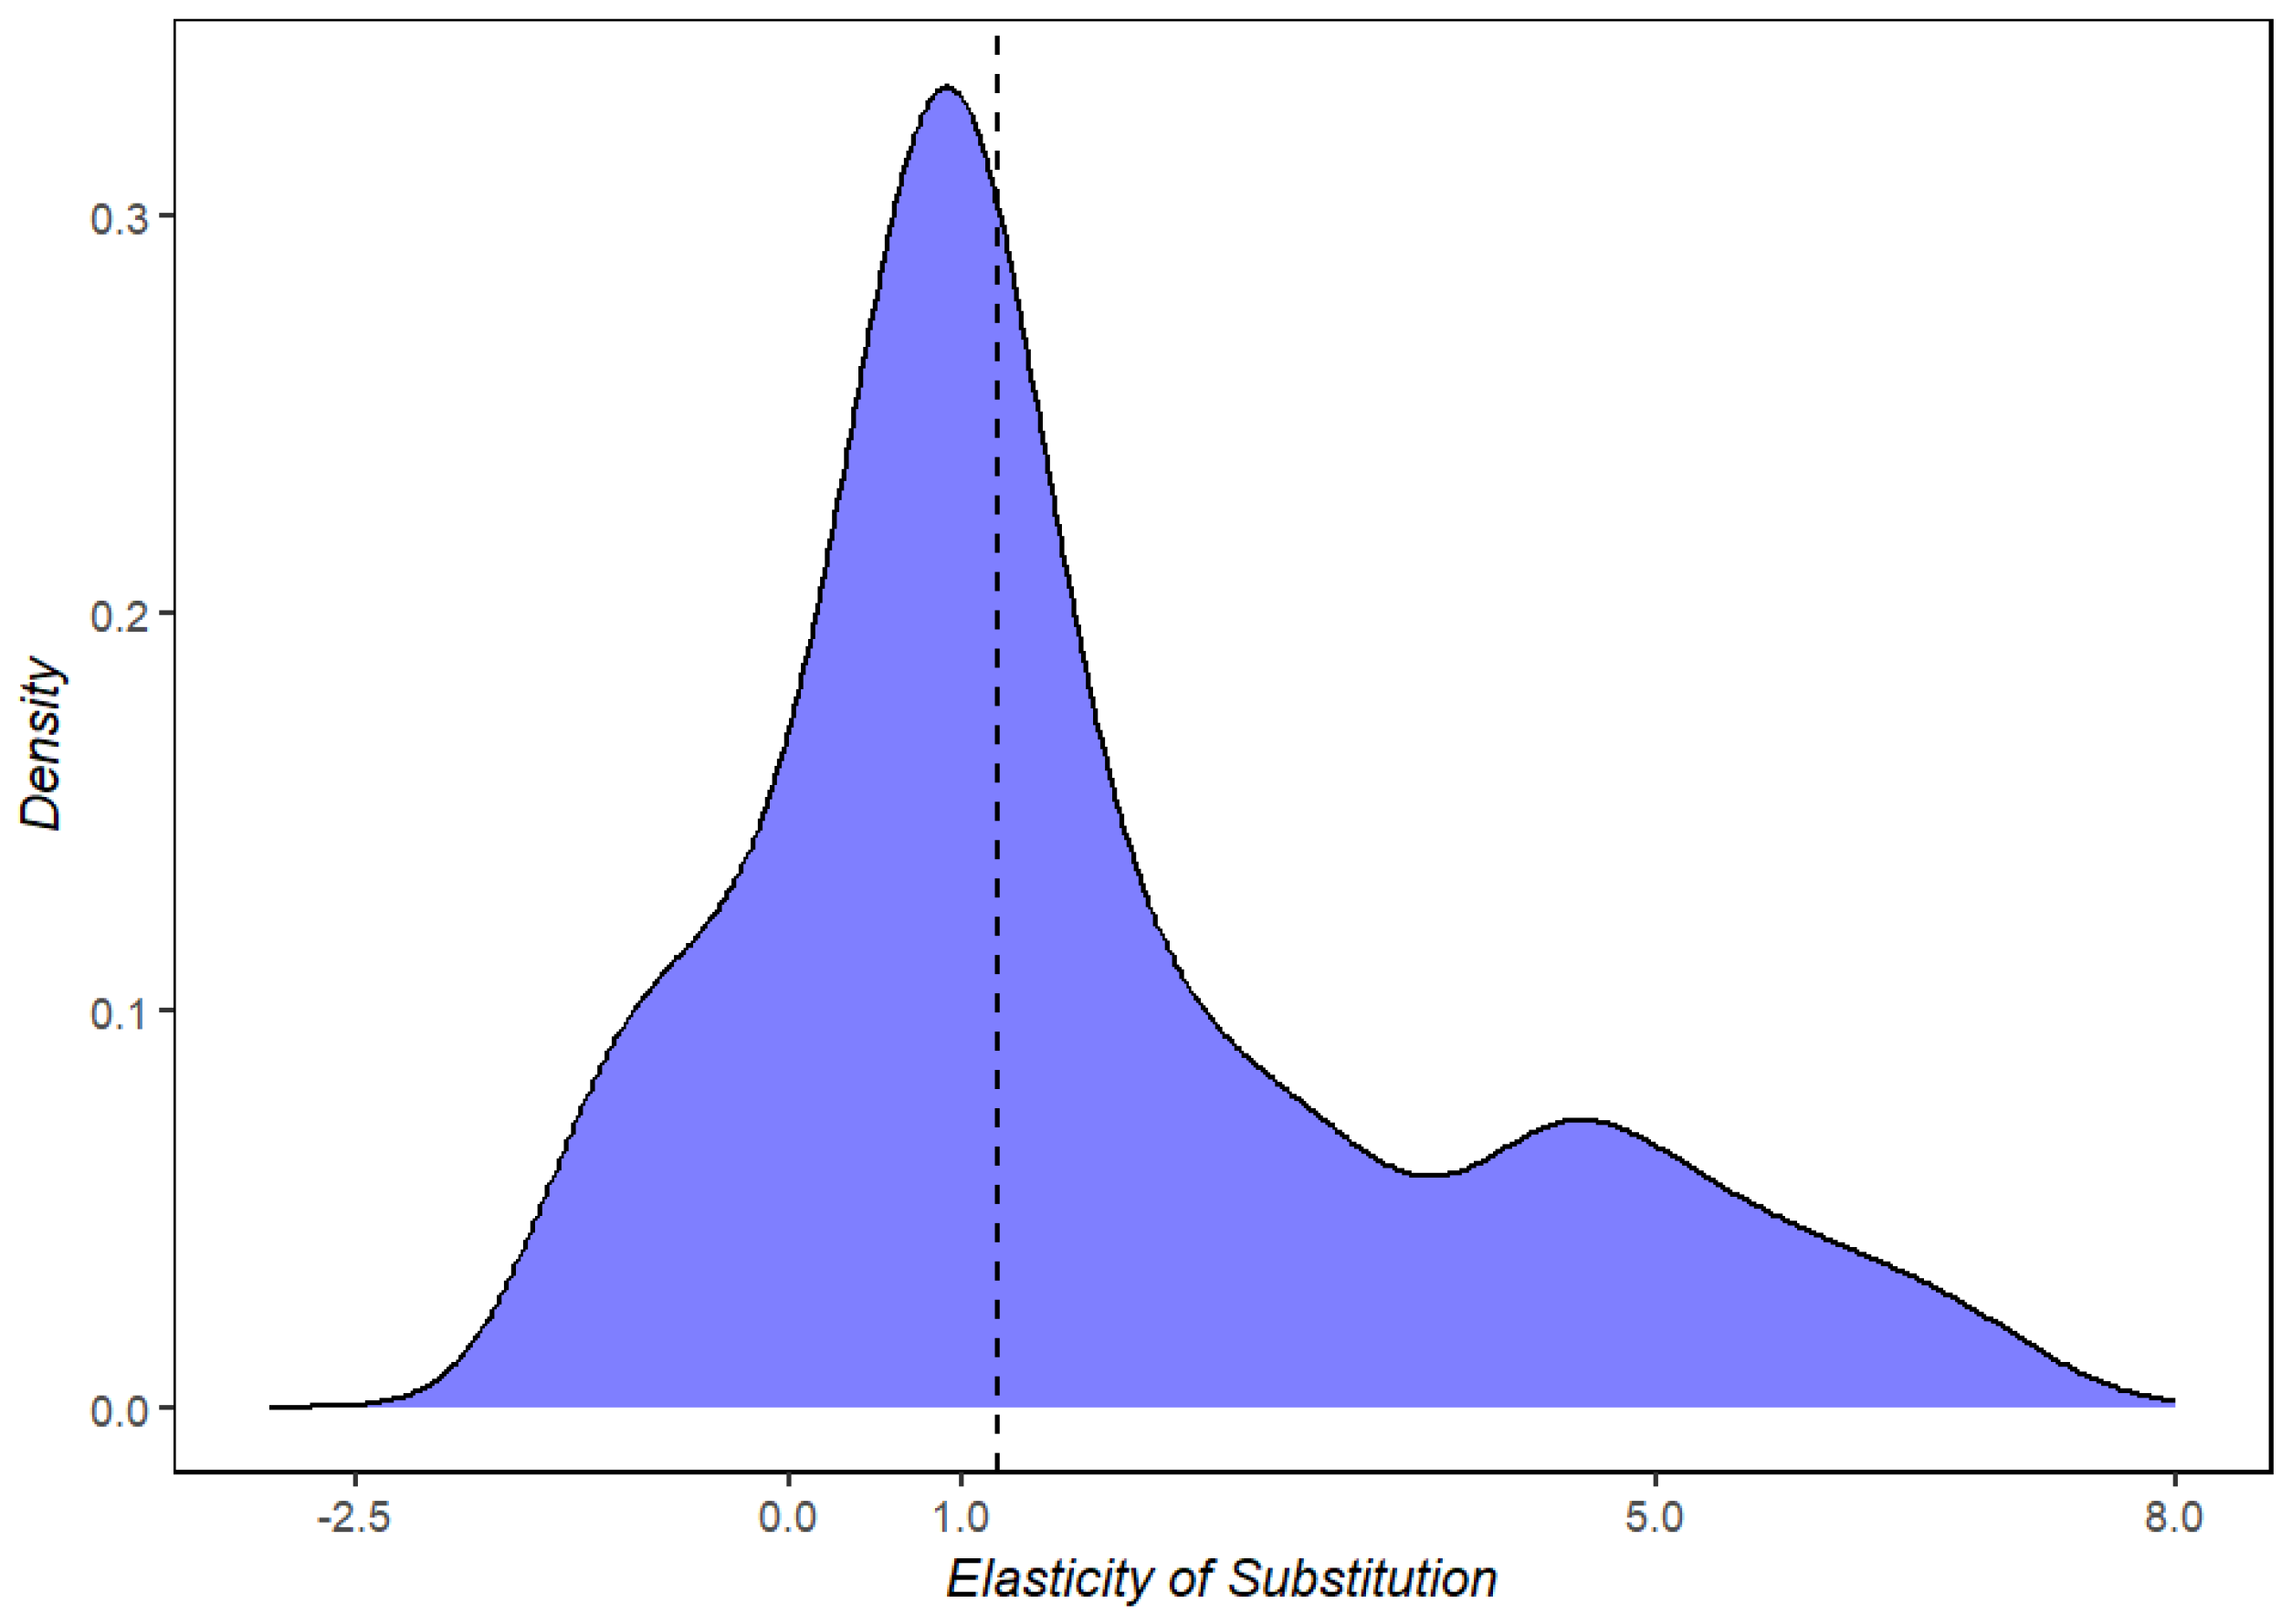
3.1.1. Estimation of Elasticity of Substitution Between Clean and Dirty Energy

This study employs data on electricity generation, clean energy installed capacity, and non-clean energy installed capacity to solve the nonparametric production function using Equation (6). The model achieves an R-squared value of 0.9904, demonstrating that the nonparametric approach effectively captures the variations in electricity generation. Furthermore, the AES between clean and non-clean energy is derived using Equations (16) and (17). Consistent with the methodology proposed by Malikov [19], the median of the calculated substitution elasticities is used to represent the substitution elasticity between input factors.
As shown in Figure 1, if the substitution elasticity, represented by the dashed line, is located to the right of the unit elasticity threshold, it indicates a strong substitutive relationship between clean and non-clean energy. Conversely, if it falls to the left of this threshold, the substitutive relationship is weaker. If the value is positioned to the left of the origin, it suggests a potential complementary relationship between the two energy types. The computed substitution elasticity between clean and non-clean energy is 1.188, exceeding the critical threshold of 1.0. This result indicates a high degree of substitutability between clean and non-clean energy in China’s power sector. Theoretically, this demonstrates that clean energy has the capability to replace non-clean energy, meeting the electricity demands of the broader economic system. This finding supports the feasibility of constructing larger-scale, geographically expansive, and more advanced clean energy production facilities to gradually phase out traditional coal-fired power and achieve a comprehensive green transformation of the power industry.
To ensure the reliability of the estimation results, this study adopts the methodology of DiCiccio and Efron (1996) [42], applying the numerical differentiation method to calculate two-sided confidence intervals for the substitution elasticity statistic at the 90%, 95%, and 99% confidence levels. As shown in Table 3, the substitution elasticity statistic exhibits a right-skewed distribution, making this method particularly well-suited for addressing non-normal distributions. The results in Table 3 reveal that, at the 1% significance level, the confidence interval for the substitution elasticity between clean and non-clean energy is (0.954, 3.860). The previously calculated substitution elasticity lies within this range, providing robust evidence that the substitution elasticity between clean and non-clean energy exceeds the unit elasticity threshold.
Additionally, a comparison of this study’s findings with those of other scholars (see Table 4) reveals notable differences. The nonparametric estimation using the TPF function by Malikov [19] and the parametric CES function estimation by Papageorgiou [18] both support the finding that the substitution elasticity between clean and non-clean energy exceeds unity. These results underscore the feasibility of substituting clean energy for non-clean energy to achieve a green transition. In contrast, other energy models, such as those proposed by Jiang S et al. [41] and Liu Z et al. [28], rely on parametric methods that assume a CES production function for energy. Their findings yield significantly lower substitution elasticity values compared to this study, indicating a much weaker substitutive relationship between clean and non-clean energy. Such results could lead to a considerable overestimation of the costs associated with achieving a green transition in China’s power sector.
To provide a clear depiction of the relationship between total electricity generation and the installed capacities of clean and non-clean energy, a scatter plot is presented in Figure 2. The figure reveals a positive correlation, as total electricity generation steadily increases alongside the annual growth in clean and non-clean energy installed capacities. At lower levels of total electricity generation, the fitted plane for the three variables appears relatively flat, indicating characteristics of constant returns to scale and conforming to the assumptions of the CES production function. However, as total electricity generation increases, the fitted plane exhibits a wavy pattern, highlighting significant nonlinear features. This suggests that the input proportions of clean and non-clean energy have undergone continuous adjustments, which may partly explain why traditional parametric models fail to accurately capture the complexities of electricity generation data.

3.1.2. Model Robustness

A key advantage of using nonparametric estimation to fit the production function is that the final model outcome remains invariant to the choice of kernel function or bandwidth selection rule. Furthermore, mathematical derivations confirm that the ratio of optimal bandwidths corresponding to any two kernel functions is a fixed value. In other words, the kernel function and bandwidth serve merely as tools for presenting the fitted results rather than determining the model’s inherent fit. Ultimately, the accuracy of a nonparametric model is dictated by the distribution of the original data.
To ensure the robustness of the model, this study recalculates the substitution elasticity between clean and non-clean energy in the electricity sector by changing the kernel function and bandwidth selection. The available kernel functions include the Gaussian and quartic kernels. For bandwidth selection, two approaches are employed: cross-validation with least squares (CV-LS) and cross-validation with the Akaike Information Criterion (CV-AIC). Table 5 presents the substitution elasticities between factors derived from all combinations of kernel functions and bandwidth selection methods. All substitution elasticities exceed unity, indicating significant elasticity between clean and non-clean energy in China’s electricity sector. This suggests that the model developed in this study is robust, and the conclusions drawn are both credible and reliable.

3.1.3. Heterogeneity Between Eastern and Western Regions

The aforementioned study establishes that the elasticity of substitution between clean and dirty energy in China’s electric power sector exceeds unity, underscoring the viability of transitioning from dirty to clean energy in China. Building upon this finding, the subsequent nonparametric model offers a more nuanced exploration of inter-regional heterogeneity. In alignment with the “Power Transmission from West to East” strategy, the nation is segmented into two distinct regions: the Eastern Region and Western Region. The detailed methodology for this regional partitioning is provided in Table 6.
The installed capacities of clean and non-clean energy were used as independent variables to fit the total electricity generation, and the results are shown in Figure 3. As observed in Figure 3 (right), the original dataset of non-clean energy installed capacities is evenly distributed around the fitted curve, whereas the clean energy data exhibit greater dispersion (Figure 3, left). The solid and dashed lines correspond to the fitted curve and its estimated variations, respectively. This indicates that, under comparable electricity supply conditions, the disparity in installed capacities of non-clean energy across provinces is relatively small, while significant variations exist for clean energy installed capacities. Combined with the levels of electricity generation in China’s Eastern and Western Regions (Figure 4), it is evident that, from 1993 to 2021, electricity production in the Eastern Region primarily relied on thermal power from non-clean energy sources, with non-clean energy still accounting for approximately 80% of the total electricity generation in 2021 (left bar chart). In contrast, the Western Region has experienced a gradual increase in the proportion of clean energy, reaching nearly 50% by 2021, indicating substantial progress in energy substitution (right bar chart). This regional divergence in energy structure transformation may be attributed to differences in energy endowments between the Eastern and Western Regions. The Eastern Region of China, characterized by plains and hills, lacks the significant topographical variations required for hydropower generation and has limited areas suitable for wind and solar energy development, resulting in relatively scarce clean energy resources. Conversely, the Western Region, dominated by mountains, basins, and plateaus, benefits from abundant topographical conditions for hydropower generation, consistent wind resources, and prolonged sunshine in the desert and Gobi areas, all of which support the establishment of large-scale clean energy bases. Therefore, when fitting total electricity generation, non-clean energy exhibits a higher degree of fit, while clean energy installed capacities show substantial regional heterogeneity, leading to a more dispersed pattern in the fitted graph. In light of this potential regional heterogeneity, this study will estimate the substitution elasticity of clean and non-clean energy separately for the Eastern and Western Regions.
Based on the numerical differentiation method proposed by DiCiccio and Efron [41], two-sided confidence intervals for the statistics were computed, and the confidence intervals for the substitution elasticity statistics at significance levels of 1%, 5%, and 10% are presented in Table 7. The results show that, at all significance levels, the substitution elasticity confidence intervals for the Eastern Region lie to the left of unity, indicating that the region has a relatively weak capacity to substitute clean energy for non-clean energy, which is consistent with the current power generation and supply structure in the area. In contrast, the substitution elasticity confidence intervals for the Western Region exceed unity by a significant margin, reflecting a strong substitution potential of clean energy for non-clean energy. In recent years, the contribution of clean energy to power generation in the Western Region has grown rapidly. It is reasonable to conclude that, in the foreseeable future, clean energy will become the dominant source of power supply in this region.

3.2. Nested Structures Within Clean Energy

3.2.1. Optimal Nested Structure Within National Clean Energy

In the context of carbon neutrality, clean energy will play an increasingly crucial role in the transformation of energy structure. Clarifying the internal structural relationships among these clean energy sources will contribute to the targeted development of a new energy system, accelerating the green transformation of power industry. Among these energy sources, nuclear power, as a distinctive form of generation, is often viewed as a transitional energy source, with a close relationship to hydropower. Geographically, China’s nuclear power plants are primarily located along the southeast coast, where hydropower and nuclear power serve as the optimal choices for achieving energy transition. Additionally, in terms of operational lifespan, the dams of hydropower plants and the nuclear islands of nuclear power plants have similar service lives. Based on these considerations, this paper analyzes the optimal nested structure of clean energy by combining hydropower and nuclear power (hydropower + nuclear power) as a single entity [43].
In this framework, clean energy power generation methods are categorized into three types: hydropower + nuclear power, wind power, and solar power. In addition to treating these three types individually as production inputs, they can also be paired together to form new production inputs, resulting in four distinct nested structures: (hydropower + nuclear power) − wind power − solar power, (hydropower + nuclear power − wind power) − solar power, (hydropower + nuclear power − solar power) − wind power, and hydropower + nuclear power − (wind power − solar power). Taking (hydropower + nuclear power − wind power) − solar power as an example, this structure involves first nesting hydropower + nuclear power with wind power, and then further nesting the result with solar power. In this case, the dependent variable shifts from total electricity generation to clean energy electricity generation.
Most studies assess the quality of a nested structure based on the goodness of fit of the model. Generally speaking, the higher the goodness of fit under a given nested structure, the better the structure [35,36]. The coefficient of determination (R-squared) is commonly used as a statistical indicator for this purpose [38]. The nested structure corresponding to the highest R-squared is considered optimal. In Section 2, the statistical indicator CV is constructed to select the appropriate bandwidth, and this indicator also reflects the goodness of fit. A smaller CV value indicates a higher degree of model fit and a better corresponding nested structure. To ensure the reliability of the results, this study considers both the CV and R-squared statistical indicators to select the optimal nested structure within clean energy. Table 8 presents the CV and R-squared values obtained from the nonparametric fitting of the four nested structures. Both statistical indicators suggest that the (hydropower + nuclear power) − wind power − solar power structure is the optimal nested structure within clean energy.
To further analyze the optimal nested structure, the elasticity of substitution among its components (hydropower + nuclear power, wind power, and solar power) was calculated (see Table 9). The results indicate that the AES values for all clean energy types in the (hydropower + nuclear power) − wind power − solar power structure are negative, highlighting a complementary relationship among these energy sources. This finding underscores the importance of fostering synergy between different clean energy sources in China’s power industry. By utilizing nuclear power as a transitional energy source and capitalizing on the complementary dynamics among hydropower, wind power, and solar power, the industry can ensure the nation’s electricity demand is met while steadily advancing toward a fully green transformation [44].

3.2.2. Heterogeneity Between East and West Regions

Based on the four nested structures of clean energy described above, a nonparametric production function models power generation data for the Eastern and Western Regions of China (see Table 10). The results demonstrate that the optimal nested structure for clean energy in the Eastern Region consistently follows the pattern of (hydropower + nuclear power) − wind power − solar power. Notably, nuclear power exclusively concentrates in the Eastern coastal areas, with no nuclear capacity present in the Western Region. As a result, the optimal nested structure for clean energy in the Western Region adopts the configuration of hydropower − wind power − solar power. At both the national and regional levels, the analysis consistently identifies the same optimal nested structure for clean energy sources.
When examining the nested structures of clean energy, the conclusions drawn for the Eastern and Western Regions align with the national findings. The subsequent analysis delves deeper into the relationships among the elements within the optimal nested structures of these two regions. As presented in Table 11, clean energy sources in the Eastern Region’s optimal structure exhibit a substitutive relationship, while those in the Western Region demonstrate a complementary dynamic, highlighting a stark dichotomy between the two areas.
In the Eastern Region, the substitutive relationship is largely attributed to its limited energy resources. Insufficient clean energy reserves necessitate a reliance on nuclear power to fill gaps in electricity supply, resulting in substitution between hydropower + nuclear power and wind and solar energy. In contrast, the Western Region, endowed with abundant and diverse energy resources, is gradually replacing coal-fired power with clean energy, signaling the early stages of a transformative shift in its energy landscape. The complementary relationship observed in the Western Region stems from the inherent intermittency and variability of clean energy generation. As electricity demand remains constant and unyielding, stabilizing power output on the supply side becomes imperative. By harnessing the complementary characteristics of clean energy sources, the Western Region is well-positioned to establish a multi-energy system integrating hydropower, wind power, and solar power [44]. This synergistic approach not only enhances the consistency of electricity supply but also facilitates a sustainable transition to a modern, clean energy framework.

4. Conclusions and Recommendations

4.1. Conclusions

This paper examines the feasibility and practicality of the comprehensive green transformation of the power industry in China, with a particular focus on the transition of the clean energy structure. It explores two primary issues: the substitution elasticity between clean and non-clean energy, and the optimal nested structure within clean energy. The results show the following:
  • The substitution elasticity between clean and non-clean energy in China’s power industry is 1.188, indicating a strong substitution relationship. This suggests that through the continuous expansion of clean energy supply capacity, coal-fired power generation can be gradually replaced, moving towards a cleaner production model in the power sector. Furthermore, by categorizing Chinese provinces into Eastern and Western Regions based on the “west-to-east power transmission” framework, regional heterogeneity in substitution elasticity is observed. This is likely due to differences in the energy endowments between the two regions. The Western Region, benefiting from superior geographical advantages and abundant natural resources suitable for clean energy generation, exhibits a strong ability to replace non-clean energy with clean energy. Conversely, the Eastern Region, with relatively limited natural reserves of clean energy, demonstrates a weaker capacity for substitution.
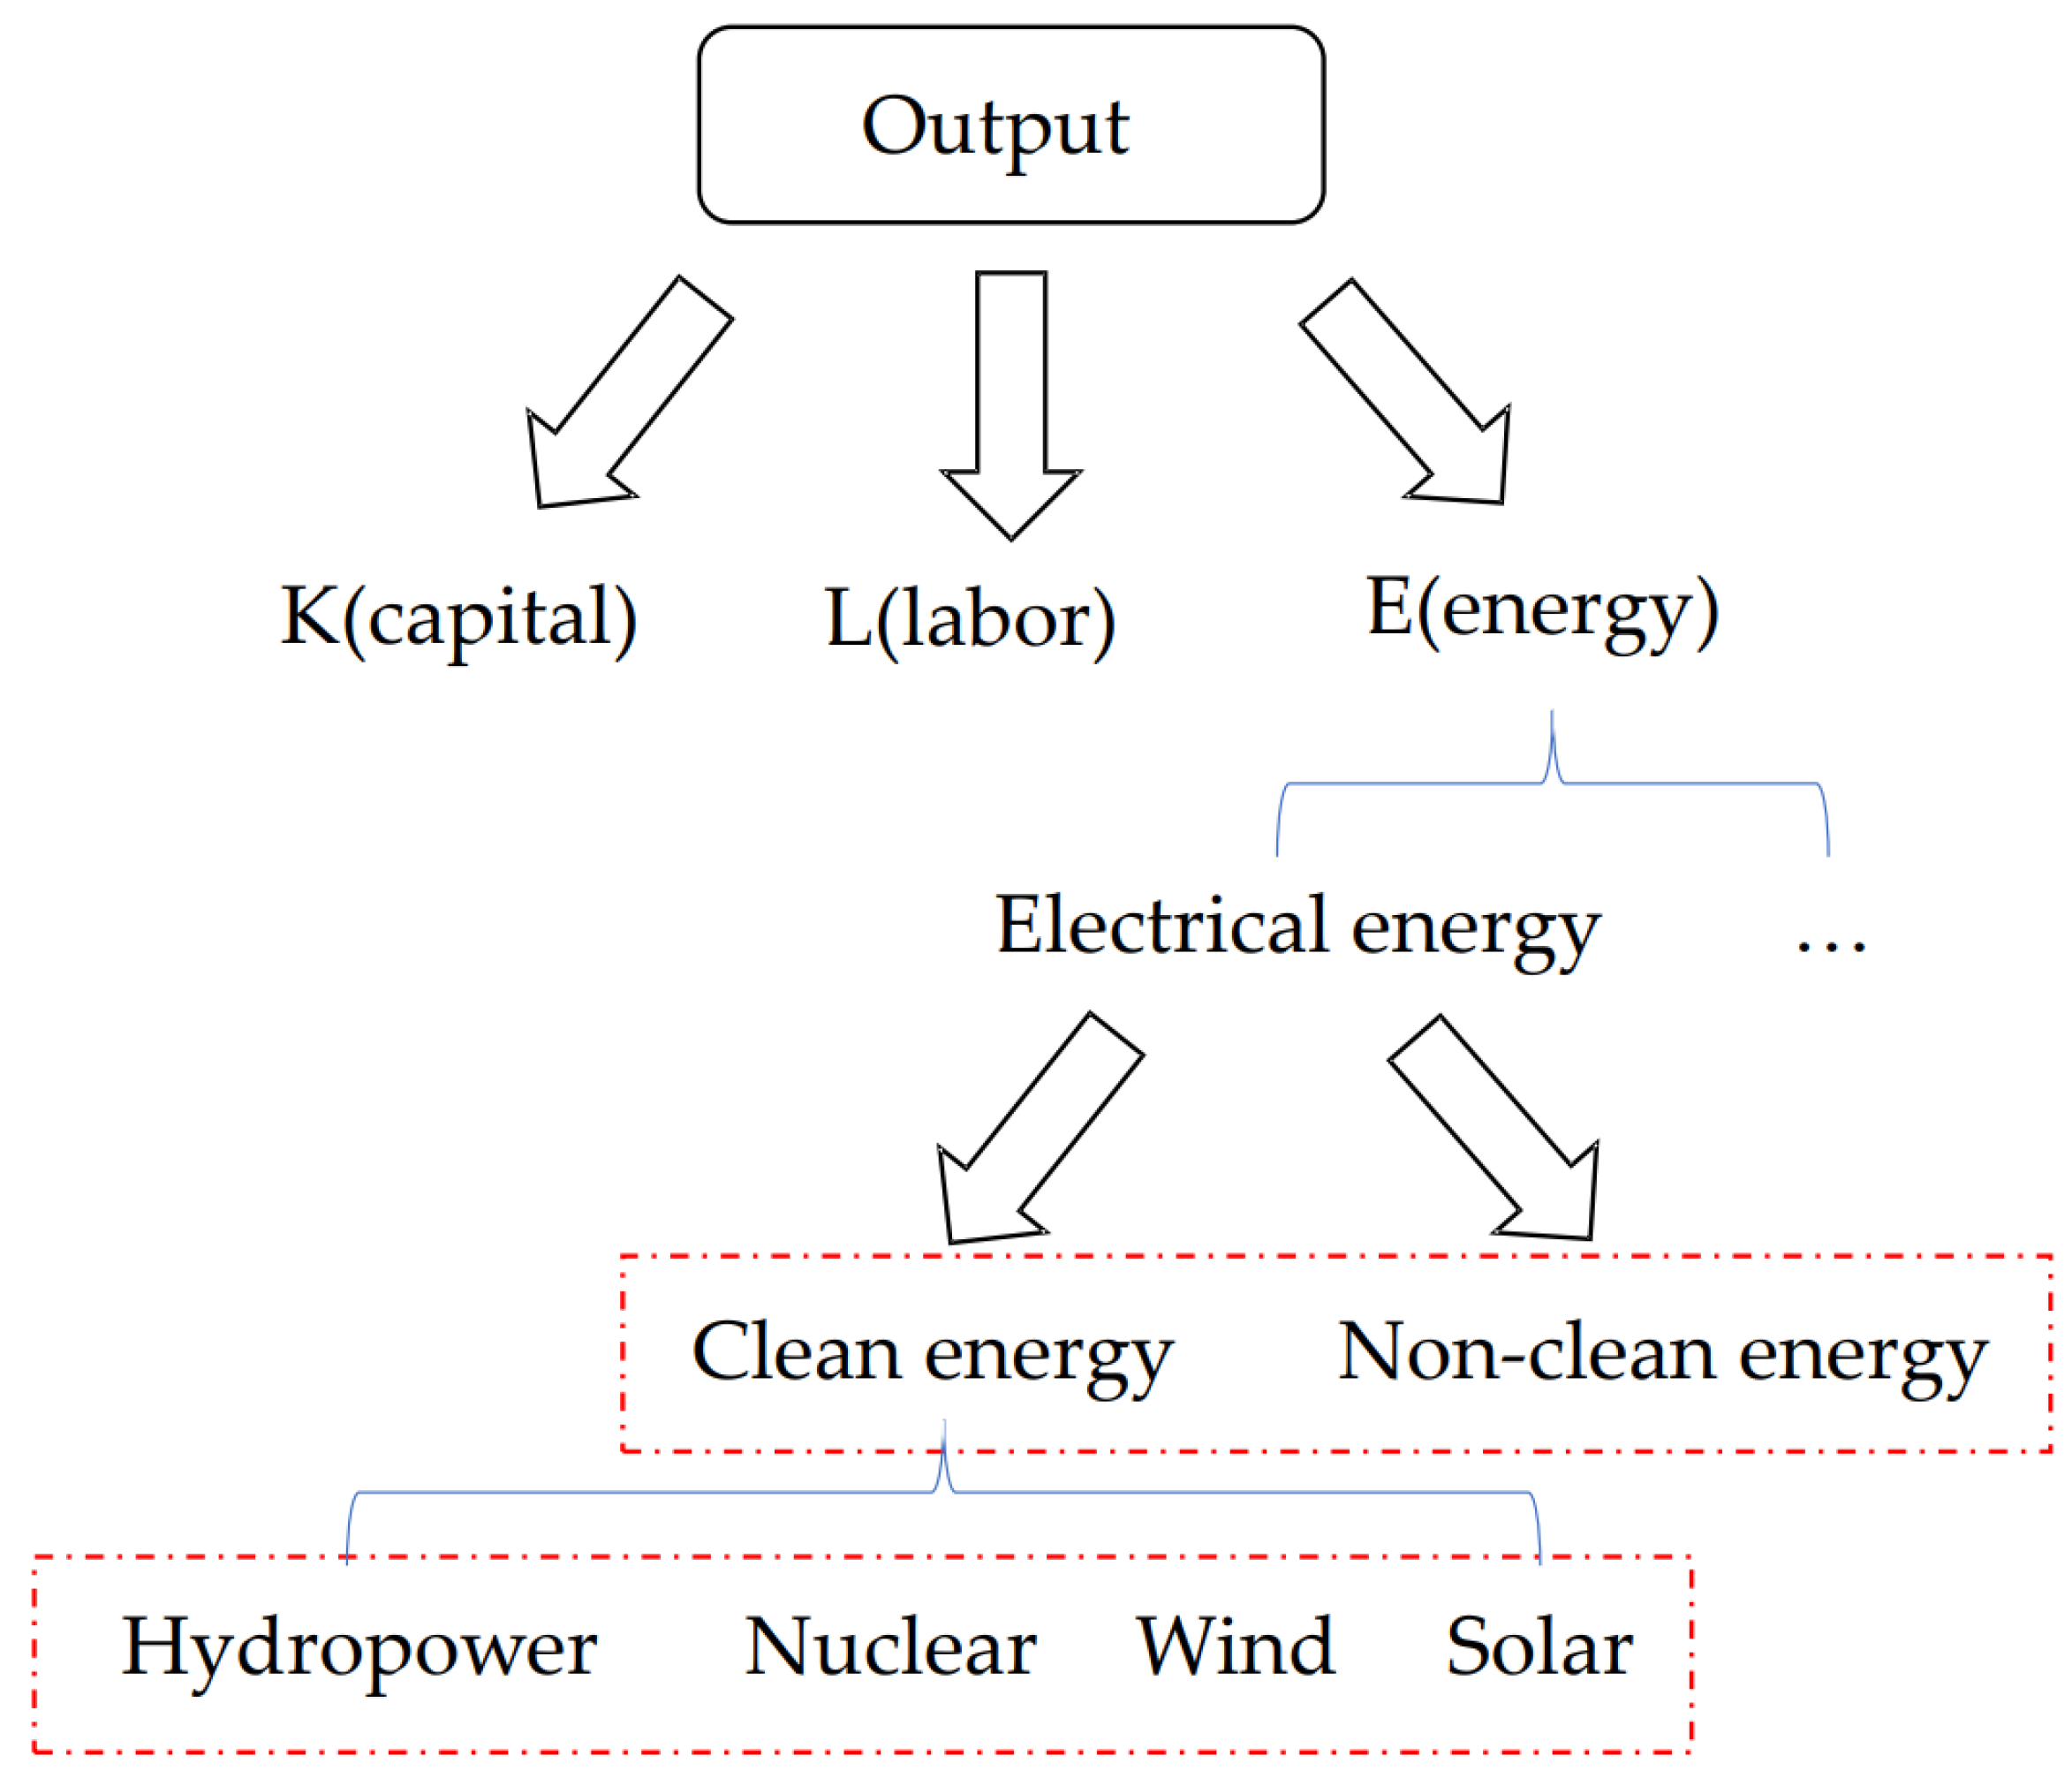
  • By comparing the goodness-of-fit of various nested structures in the clean energy production function, it is determined that the optimal nested structure for clean energy in China is (hydropower + nuclear power) − wind power − solar power. Within this structure, the substitution elasticity between the energy input factors is negative, indicating that clean energy production in China primarily relies on the complementary integration of hydropower, nuclear power, wind, and solar power. At the regional level, the results for the Western Region largely align with the national findings. It should be noted, however, that this region lacks nuclear power infrastructure, leading to an optimal nested structure of hydropower − wind power − solar power, with complementary relationships between the elements. In contrast, the Eastern Region’s optimal nested structure mirrors the national optimal structure, (hydropower + nuclear power) − wind power − solar power. However, there is a substitution relationship between the input factors within this structure, primarily between hydropower/nuclear power and wind/solar power. This substitution is likely due to the unique role of nuclear power in the Eastern Region, which compensates for the scarcity of wind and solar energy resources. To ensure the continuity of power supply in this region, nuclear power is required to fill the gap left by wind and solar power.

4.2. Recommendations

Based on the above empirical findings, this paper proposes the following policy recommendations for advancing the energy structure transition in China’s power industry:
  • The empirical model estimates indicate that the substitution elasticity between clean and non-clean energy in China’s power sector exceeds unity, theoretically affirming the feasibility of replacing non-clean energy with clean energy in electricity generation. Globally, nations are vigorously pursuing energy structure transitions, with low-carbon or near-zero-carbon economies emerging as the defining paradigm of future energy systems. For China, resolutely committing to the clean energy transition is an essential pathway to achieve sustainable development. On one hand, it is imperative to reduce reliance on non-clean energy sources. While China’s energy consumption per unit of GDP in the power industry has shown an overall decline in recent years, reflecting positive progress, the industry’s massive scale and society’s significant electricity demand make achieving zero reliance on high-carbon energy in the short term unrealistic. Accordingly, China’s “dual carbon” targets should be implemented in alignment with its national circumstances, progressively reducing dependency on coal-fired power and ultimately attaining the goal of zero-carbon electricity generation. On the other hand, investments in clean energy must be significantly increased, with efforts concentrated on constructing large-scale clean energy production bases to enhance clean energy supply capacity. Simultaneously, advancing research into clean energy generation technologies is crucial to lowering production costs per unit of electricity, boosting clean energy’s competitiveness, and optimizing a diversified power production system that leverages the complementary strengths of hydropower, nuclear, wind, and solar energy. These measures collectively aim to establish a sustainable and resilient power industry.
  • Given China’s vast geographical expanse, the natural resource endowments for electricity generation vary significantly between Eastern and Western Regions, necessitating region-specific pathways for the energy structure transition. In the Eastern Region, resources suitable for wind and solar power generation are relatively scarce. However, its extensive coastline and proximity to the sea provide a unique geographical advantage for developing nuclear power, which can offset the region’s limitations in wind and solar resources. Furthermore, the empirical analysis demonstrates a substitution relationship within the optimal clean energy mix for this region, theoretically validating the feasibility of this transition pathway. Therefore, the Eastern power sector can prioritize a clean energy transition strategy that leverages nuclear power as an intermediate step. Conversely, the Western Region, already a national leader in installed wind and solar power capacity, also ranks among the top globally and retains substantial potential for further development. Nevertheless, the intermittent and variable nature of clean energy generation poses challenges, particularly when juxtaposed with society’s continuous and stable demand for electricity. This mismatch between supply and demand can be addressed by constructing an integrated hydropower–wind–solar complementary system. Through coordinated development and utilization of various clean energy sources, such a system can simultaneously meet societal electricity demands and ensure supply sustainability. Accordingly, the Western Region should further explore its untapped clean energy generation potential, comprehensively plan for the development of diverse clean energy types, and establish a power energy structure that aligns with future needs.

5. Future Research

This study focuses on estimating the nested structures underlying China’s power production and providing an in-depth interpretation of the results. The analysis covers the nested relationships between clean and non-clean energy, as well as within clean energy itself, specifically the components highlighted in the dashed red box in Figure 5. Since the former involves only two factors, the calculation is limited to the substitution elasticity between them. Future research will leverage the substitution elasticities and nested structures identified in this study to examine the development prospects of the power industry within the carbon neutrality framework using a computable general equilibrium (CGE) model. The proposed CGE model framework is outlined in Figure 5. While substitution elasticities and nested structures among capital, labor, and energy are well established and widely recognized, research on the nested structures within power energy—especially clean energy—remains sparse. This paper addresses that gap as its core focus. By estimating the substitution elasticity between clean and non-clean energy and analyzing the nested structures within clean energy, this paper enhances the framework depicted in Figure 5. These findings provide essential data and theoretical support for advancing future CGE model research.

Author Contributions

Conceptualization, S.W. and K.Z.; methodology, S.W.; writing—original draft preparation, S.W.; writing—review and editing, S.W. and K.Z.; visualization, S.W.; supervision, K.Z. All authors have read and agreed to the published version of the manuscript.

Funding

This research was funded by Project supported by Ministry of Education (22YJCZH239).

Institutional Review Board Statement

Not applicable.

Informed Consent Statement

Not applicable.

Data Availability Statement

All the data were obtained from China Electric Power Statistical Yearbook, the National Energy Administration, and the official website of the China Electricity Council. The data that support the findings of this study are available from the corresponding author upon reasonable request.

Acknowledgments

We would like to thank the editor and the anonymous reviewers for their helpful comments and suggestions.

Conflicts of Interest

The authors declare no conflicts of interest.

Appendix A

The solution of the nonparametric model relies on the original data, applying specific rules to assign different weights to each observation. Generally, the smaller the Euclidean distance between the original data observation and the prediction point, the greater the weight assigned. For simplicity, the following illustrates the fitting process using a univariate nonparametric function. Assume the true relationship between variables follows
Y = m X
Variable Y implies final product value, whereas variable X implies initial input value. First, the probability density function of variable Y needs to be determined. For any point x in the domain of X, a closed interval [xh, x + h] with length 2h is constructed, centered at x. The value of the probability density function f(x) at point x can then be obtained by weighting the original data that fall within this interval.
f ^ H x = 1 2 h n X i x h , x + h
To estimate the probability density function of variables from the original data, it is essential to establish the rules for assigning weights and to determine the values of these weights. These two steps are crucial in nonparametric function fitting: selecting the kernel function and choosing the bandwidth. The kernel function plays a central role in the solution of a nonparametric function, as it is used to estimate the density of the data or the relationship between variables. Commonly used kernel functions include the Gaussian kernel, Epanechnikov kernel, uniform kernel, and triangular kernel. The bandwidth is a parameter in nonparametric methods that controls the smoothness of the function. Smaller bandwidths can introduce more noise, while larger bandwidths may lead to overfitting. The optimal bandwidth is typically selected using cross-validation, though refined plug-in methods are also utilized. Once the kernel function and bandwidth are determined, the following equation is derived:
f ^ H x = 1 h n i = 1 n K x X i h
where the kernel function K(u) is similar to the normal distribution of those random distributions, and the definition of the domain of the definite integral is equal to the characteristics of unity. Nonparametric models using different kernel functions are equivalent to fitting the model for the observations to be given different weights. For convenience, we make
K h = 1 h K h
Thus, the following equation is derived:
f ^ H x = 1 n i = 1 n K h x X i
After determining the kernel function, it is necessary to select a suitable bandwidth. Cross-validation is introduced to determine the optimal bandwidth. This method resembles the least squares approach used in nonparametric regression, with the objective of finding a bandwidth that minimizes the sum of the squares of the differences between the estimated and actual values.
Min I S E h = min f ^ h x f x 2 d x
The expansion of Equation (A6) yields
I S E h = f ^ h 2 x d x 2 { f ^ h f } x d x + f 2 x d x
The last term on the right side of Equation (A7) does not depend on the value of the bandwidth, so the final statistic can be obtained by shifting the terms of Equation (A7).
C V h = I S E h f 2 x d x   = f ^ h 2 x d x 2 { f ^ h f } x d x
The first term of Equation (A8) can be viewed as the result of a convolution transformation applied to a single kernel function:
f ^ h 2 x d x = 1 n 2 h i = 1 n j = 1 n K K X j X i h
where
K K u = K u v K v d v
The second term is found to be exactly the expected value of the probability density function of variable X:
{ f ^ h f } x d x = E f ^ h x ^ = 1 n i = 1 n f ^ h , i X i
Note that if an observation is located exactly where the original data are, fitting the probability density at that point x requires removing that observation from the original sample. This means that the data, excluding the point of interest, are used for fitting at that specific point.
f ^ h , i X i = 1 n 1 j = 1 , j i n K h x X j
Combining the above derivations, the Equation (A8) for the criterion for cross-validation can finally be derived as
C V h = 1 n 2 h i = 1 n j = 1 n K K X j X i h 2 n n 1 i = 1 n j = 1 , j i n K h X j X i
Equation (A13) contains only one unknown parameter for bandwidth h, which can be solved after bringing in the original data.
Generally speaking, assume that the nonparametric production function contains M input variables, for which there are N observations. Variable Y continues to represent the total output of the model.
y = f x = f x 1 , x 2 , , x m
At one point x, the probability density function of the dependent variable Y can be expressed as
f ^ h x = 1 n i = 1 n 1 j = 1 m h j K x 1 X i 1 h 1 , , x m X m 1 h m
Similarly to Equation (A5), it can be simplified as follows:
f ^ H x = 1 n i = 1 n 1 det H K H 1 x X i   = 1 n i = 1 n K H x X i
where the matrix H is a diagonal matrix consisting of bandwidths h, and the kernel density function is analogous to Equation (A4), which can be abbreviated as
K H = 1 det H K H 1
Similarly, based on the cross-validation method, the criterion expression can be obtained as
C V H = 1 n 2 det H i = 1 n j = 1 n K K H 1 X j X i 2 n n 1 i = 1 n j = 1 , j i n K H X j X i

References

  1. Stavins, R.N.; Stowe, R.C. The Paris Agreement and Beyond: International Climate Change Policy Post-2020; Harvard Project on Climate Agreements: Cambridge, MA, USA, 2016; pp. 1–114. [Google Scholar]
  2. Stern, N. The economics of climate change. Am. Econ. Rev. 2008, 98, 1–37. [Google Scholar] [CrossRef]
  3. Bag, S.; Gupta, S.; Kumar, S. Industry 4.0 adoption and 10R advance manufacturing capabilities for sustainable development. Int. J. Prod. Econ. 2021, 231, 107844. [Google Scholar] [CrossRef]
  4. Stern, D.I. The role of energy in economic growth. Ann. N. Y. Acad. Sci. 2011, 1219, 26–51. [Google Scholar] [CrossRef]
  5. Balgehshiri, S.K.M.; Zohuri, B. The impact of energy transition to net-zero emissions on the world economy and global strategies. J. Econ. Manag. Res. 2023, 4, 2–7. [Google Scholar] [CrossRef]
  6. Hartmann, J.; Inkpen, A.C.; Ramaswamy, K. Different shades of green: Global oil and gas companies and renewable energy. J. Int. Bus. Stud. 2021, 52, 879–903. [Google Scholar] [CrossRef]
  7. Adebayo, Y.A.; Ikevuje, A.H.; Kwakye, J.M.; Esiri, A.E. A model for assessing the economic impact of renewable energy adoption in traditional oil and gas companies. GSC Adv. Res. Rev. 2024, 20, 298–315. [Google Scholar] [CrossRef]
  8. Newell, P. Trasformismo or transformation? The global political economy of energy transitions. Rev. Int. Political Econ. 2019, 26, 25–48. [Google Scholar] [CrossRef]
  9. Hepburn, C.; Qi, Y.; Stern, N.; Ward, B.; Xie, C.; Zenghelis, D. Towards carbon neutrality and China’s 14th Five-Year Plan: Clean energy transition, sustainable urban development, and investment priorities. Environ. Sci. Ecotechnol. 2021, 8, 100130. [Google Scholar] [CrossRef]
  10. Gielen, D.; Boshell, F.; Saygin, D.; Bazilian, M.D.; Wagner, N.; Gorini, R. The role of renewable energy in the global energy transformation. Energy Strategy Rev. 2019, 24, 38–50. [Google Scholar] [CrossRef]
  11. Chen, C.C. Comparative impacts of energy sources on environmental quality: A five-decade analysis of Germany’s Energiewende. Energy Rep. 2024, 11, 3550–3561. [Google Scholar] [CrossRef]
  12. Esteban, M.; Leary, D. Current developments and future prospects of offshore wind and ocean energy. Appl. Energy 2012, 90, 128–136. [Google Scholar] [CrossRef]
  13. Auestad, I.; Nilsen, Y.; Rydgren, K. Environmental restoration in hydropower development—Lessons from Norway. Sustainability 2018, 10, 3358. [Google Scholar] [CrossRef]
  14. Pinson, P.; Mitridati, L.; Ordoudis, C.; Østergaard, J. Towards fully renewable energy systems: Experience and trends in Denmark. CSEE J. Power Energy Syst. 2017, 3, 26–35. [Google Scholar] [CrossRef]
  15. Afshan, S.; Zaied, Y.B.; Yaqoob, T.; Managi, S. Insights into the efficiency of China’s green energy policies. J. Clean. Prod. 2024, 434, 139913. [Google Scholar] [CrossRef]
  16. Yang, X.J.; Hu, H.; Tan, T.; Li, J. China’s renewable energy goals by 2050. Environ. Dev. 2016, 20, 83–90. [Google Scholar] [CrossRef]
  17. Allen, R.G.D. The Concept of Elasticity of Subst Some Generalizations. Rev. Econ. Stud. 1962, 29, 161–168. [Google Scholar]
  18. Papageorgiou, C.; Saam, M.; Schulte, P. Substitution between Clean and Dirty Energy Inputs: A Macroeconomic Perspective. Rev. Econ. Stat. 2017, 99, 281–290. [Google Scholar] [CrossRef]
  19. Malikov, E.; Sun, K.; Kumbhakar, C.S. Nonparametric estimates of the clean and dirty energy substitutability. Econ. Lett. 2018, 168, 118–122. [Google Scholar] [CrossRef]
  20. Arbex, M.; Perobelli, F.S. Solow meets Leontief: Economic growth and energy consumption. Energy Econ. 2010, 32, 43–53. [Google Scholar] [CrossRef]
  21. Mu, Y.; Cai, W.; Evans, S.; Wang, C.; Roland-Holst, D. Employment impacts of renewable energy policies in China: A decomposition analysis based on a CGE modeling framework. Appl. Energy 2018, 210, 256–267. [Google Scholar] [CrossRef]
  22. Brockway, P.E.; Heun, M.K.; Santos, J.; Barrett, J.R. Energy-extended CES aggregate production: Current aspects of their specification and econometric estimation. Energies 2017, 10, 202. [Google Scholar] [CrossRef]
  23. Prywes, M. A nested CES approach to capital-energy substitution. Energy Econ. 1986, 8, 22–28. [Google Scholar] [CrossRef]
  24. Lin, B.; Ahmad, I. Technical change, inter-factor and inter-fuel substitution possibilities in Pakistan: A trans-log production function approach. J. Clean. Prod. 2016, 126, 537–549. [Google Scholar] [CrossRef]
  25. Wang, F.; Jiang, Y.; Zhang, W.; Yang, F. Elasticity of factor substitution and driving factors of energy intensity in China’s industry. Energy Environ. 2019, 30, 385–407. [Google Scholar] [CrossRef]
  26. Dergiades, T.; Martinopoulos, G.; Tsoulfidis, L. Energy consumption and economic growth: Parametric and non-parametric causality testing for the case of Greece. Energy Econ. 2013, 36, 686–697. [Google Scholar] [CrossRef]
  27. Miao, Z.; Chen, X. Combining parametric and non-parametric approach, variable & source-specific productivity changes and rebound effect of energy & environment. Technol. Forecast. Soc. Change 2022, 175, 121368. [Google Scholar]
  28. Liu, Z.; Ma, J.; Zhang, Y. Estimation of Substitution Elasticity and Structural Optimization of Clean and Non-clean Energy in China. J. Environ. Econ. 2023, 8, 53–83. (In Chinese) [Google Scholar] [CrossRef]
  29. Igliński, B.; Kiełkowska, U.; Pietrzak, M.B.; Skrzatek, M.; Kumar, G.; Piechota, G. The regional energy transformation in the context of renewable energy sources potential. Renew. Energy 2023, 218, 119246. [Google Scholar] [CrossRef]
  30. Guo, Y.; Ming, B.; Huang, Q.; Yang, Z.; Kong, Y.; Wang, X. Variation-based complementarity assessment between wind and solar resources in China. Energy Convers. Manag. 2023, 278, 116726. [Google Scholar] [CrossRef]
  31. Xu, Y.; Yang, Z.; Yuan, J. The economics of renewable energy power in China. Clean Technol. Environ. Policy 2021, 23, 1341–1351. [Google Scholar] [CrossRef]
  32. Wang, Y.; Pan, H.; Zhen, J.; Xu, B. Exploring the substitution within clean energy: Evidence from China’s top 14 hydropower provinces. Clean. Energy Syst. 2024, 9, 100152. [Google Scholar] [CrossRef]
  33. Xiao, J.; Wei, S. The bridging role of natural gas in China’s energy transition—A study based on UCRCD model. Coal Econ. Res. 2024, 44, 122–128. (In Chinese) [Google Scholar] [CrossRef]
  34. Lagomarsino, E. Estimating elasticities of substitution with nested CES production functions: Where do we stand? Energy Econ. 2020, 88, 104752. [Google Scholar] [CrossRef]
  35. Henningsen, A.; Henningsen, G.; van der Werf, E. Capital-labour-energy substitution in a nested CES framework: A replication and update of Kemfert (1998). Energy Econ. 2019, 82, 16–25. [Google Scholar] [CrossRef]
  36. Su, X.; Zhou, W.; Nakagami, K.I.; Ren, H.; Mu, H. Capital stock-labor-energy substitution and production efficiency study for China. Energy Econ. 2012, 34, 1208–1213. [Google Scholar] [CrossRef]
  37. Feng, S.; Zhang, K. Fuel-factor nesting structures in CGE models of China. Energy Econ. 2018, 75, 274–284. [Google Scholar] [CrossRef]
  38. Liu, H.; Lei, Q. Measurement of Energy-augmenting Technical Progress Rate and Factor Substitution Elasticity in China. Stat. Res. 2016, 33, 18–25. (In Chinese) [Google Scholar] [CrossRef]
  39. Wei, W.; He, X. Estimation of China’s Industrial Sectors’ Energy CES Production Function. J. Beijing Inst. Technol. (Soc. Sci. Ed.) 2014, 16, 27–31. (In Chinese) [Google Scholar] [CrossRef]
  40. Zhang, H.; Lu, Z.; Hu, W.; Wang, Y.; Dong, L.; Zhang, J. Coordinated optimal operation of hydro–wind–solar integrated systems. Appl. Energy 2019, 242, 883–896. [Google Scholar] [CrossRef]
  41. Jiang, S.; Du, H.; Xu, M. Dual Transition of Energy and Industrial Structure under the Carbon Peaking and Neutrality Goals. J. Quant. Technol. Econ. 2024, 41, 109–130. [Google Scholar] [CrossRef]
  42. DiCiccio, T.; Efron, B. Bootstrap confidence intervals (with discussion). Stat. Sci. 1996, 11, 189–228. [Google Scholar] [CrossRef]
  43. Wang, C.; Raza, S.A.; Adebayo, T.S.; Yi, S.; Shah, M.I. The roles of hydro, nuclear and biomass energy towards carbon neutrality target in China: A policy-based analysis. Energy 2023, 262, 125303. [Google Scholar] [CrossRef]
  44. Shen, J.; Wang, Y.; Cheng, C. Research Status and Prospect of Generation Scheduling for Hydropower-wind-solar Energy Complementary System. Proc. CSEE 2022, 42, 3871–3885. (In Chinese) [Google Scholar] [CrossRef]
Figure 1. Allen elasticity of substitution probability density distribution.
Sustainability 17 01098 g001
Figure 2. Power production scatterplot and fitting image.
Sustainability 17 01098 g002
Figure 3. Nonparametric fitting of installed capacities of clean and non-clean energy and total electricity generation.
Sustainability 17 01098 g003
Figure 4. Development levels of clean and non-clean electricity generation in Eastern and Western Regions.
Sustainability 17 01098 g004
Figure 5. The perspective of previous studies and of the working hypotheses.
Sustainability 17 01098 g005
Table 1. Comparison of different estimation models.
MethodologiesProduction FunctionsElasticity of Substitution
C-D G E = A D E α C E β 1
Leontief G E = A m i n { D E / α , C E / β } 0
CES G E = A λ D E ρ + μ C E ρ 1 ρ 1 / ( 1 ρ )
TPF ln G E = ln A + λ ln D E + μ ln C E + λ μ ρ ln D E / C E 2 / 2 1 / ( 1 ρ )
Nonparametric G E = f C E , D E , D k = 1 n x k f k x i x j F i j F
Table 2. Comparison of various kernel functions.
Kernel FunctionsK(u) StrengthsWeaknesses
Uniform 1 2 I u 1 Clear and concise settingThe second-order gradient of the production function obtained from the fit is zero
Triangle ( 1 u ) I u 1 Clear and concise settingAs above
Quartic 15 16 1 u 2 2 I u 1 The fitted production function has a second-order gradientThe computational load required for fitting multivariate functions is large
Gaussian 1 2 π e 1 2 u 2 The fitted production function is sufficiently smooth, with derivatives of all orders existing and being continuous within its domain; transforming the complex multivariate fitting into the product of multiple univariate fittings greatly reduces the computational load and difficultyNone, this setting meets the requirements for the kernel function in the nonparametric estimation of this paper
Table 3. Elasticity of substitution and test of significance.
Confidence LevelLower Bound of the Confidence IntervalUpper Limit of the Confidence Interval
90%0.5652.884
95%0.8953.214
99%0.9543.860
Table 4. Comparison of findings on elasticity of substitution between clean energy and dirty energy.
SourceTypeValue
This studyNonparametric Bootstrap Estimator1.646
Malikov [19]Nonparametric Estimator1.786
Papageorgiou [18]Parametric Estimator1.840
Jiang S [41]Parametric Estimator0.311
Liu Z [28]Parametric Estimator0.2~0.3
Table 5. Substitution elasticity under different kernel functions and bandwidth selections.
Kernel FunctionsBandwidth Selection
CV-LSCV-AIC
Quartic1.5841.407
Gaussian1.6461.539
Table 6. Rules for dividing the Eastern and Western Regions.
RegionProvince
Eastern RegionBeijing, Tianjin, Hebei, Shanghai, Jiangsu, Zhejiang, Fujian, Shandong, Guangdong, Hainan, Liaoning, Jilin, Heilongjiang, Shanxi, Anhui, Jiangxi, Henan, Hubei, Hunan
Western RegionGuangxi, Chongqing, Sichuan, Guizhou, Yunnan, Tibet, Shaanxi, Gansu, Qinghai, Ningxia, Xinjiang, Inner Mongolia
Table 7. Confidence intervals for Eastern and Western elasticities of substitution.
RegionConfidence LevelLower Bound of the Confidence IntervalUpper Limit of the Confidence Interval
Eastern Region90%0.1470.336
95%0.1940.382
99%0.2540.473
Western Region90%3.4808.340
95%3.0158.805
99%2.1059.715
Table 8. Comparison of nonparametric goodness-of-fit.
Nested StructureCVR Square
(hydropower + nuclear) − wind − solar3163.60.9875
(hydropower + nuclear − wind) − solar7062.60.9795
(hydropower + nuclear − solar) − wind10640.90.9718
hydropower + nuclear − (wind − solar)4732.00.9845
Table 9. Elasticity of substitution between factors within the optimal nested structure.
Elasticity of Substitutionhydropower + nuclearwindsolar
hydropower + nuclear −0.255−0.144
wind−0.255 −0.049
solar−0.144−0.049
Table 10. Comparison of goodness-of-fit across nested structures in the Eastern and Western Regions.
Nested StructureEastern RegionNested StructureWestern Region
CVR SquareCVR Square
(hydropower + nuclear) − wind − solar490.80.9896hydropower − wind − solar2291.10.9943
(hydropower + nuclear − wind) − solar5233.10.9614(hydropower − wind) − solar3744.70.9940
(hydropower + nuclear − solar) − wind11325.30.9110(hydropower − solar) − wind4011.00.9937
hydropower + nuclear − (wind − solar)3613.20.9706hydropower − (wind − solar)4239.20.9934
Table 11. Elasticity of substitution between factors under the optimal nested structure in the Eastern and Western Regions.
Eastern Regionhydropower + nuclearwindsolar
hydropower + nuclear 0.4820.117
wind0.482 −0.287
solar0.117−0.287
West regionhydropowerwindsolar
hydropower −0.164−0.660
wind−0.164 −0.423
solar−0.660−0.423
Disclaimer/Publisher’s Note: The statements, opinions and data contained in all publications are solely those of the individual author(s) and contributor(s) and not of MDPI and/or the editor(s). MDPI and/or the editor(s) disclaim responsibility for any injury to people or property resulting from any ideas, methods, instructions or products referred to in the content.

