Abstract
Global fossil fuel consumption, including diesel and gasoline, significantly contributes to emissions. Understanding emission percentages and types is critical. Alternative energies, like hydrogen mixed with gasoline, help mitigate emissions in sectors such as transport and energy. Hydrogen-gasoline blends in internal combustion engines improve the combustion process but require studying engine behavior and carbon footprint. This research designs a low-cost sensor network to monitor combustion emissions and provide reliable data for statistical comparison across vehicles. Two synchronized client–server software systems are proposed. The client software runs on an IoT development board (ESP32) and communicates with sensors via the ESP-NOW protocol to detect and collect gas data, transmitting it wirelessly to the web server. The server software provides a user-friendly interface for data control and visualization from a ground station. Tests used 100% Mexican gasoline (G100) and hydrogen-gasoline blends (GH) with a hydrogen cell electrolyte concentration of 0.0211 mL/gal (80 mL). A single vehicle followed the same route at 40–60 km/h, collecting data every 30 s over three trials. Results showed average reductions of 5% and 10% in CO and CO2 emissions, respectively, with GH fuel.
1. Introduction
Fossil fuels such as natural gas, coal, and oil and their derivatives, such as gasoline and diesel, just to mention the most important, satisfy most of the world’s energy demand. The dependence on fossil fuels can be seen even more in Mexico, where biofuels have an intangible participation. For 2023, the fuel consumption for the transportation sector totaled an energy consumption of 2567.72 PJ, 3.8% lower than in 2022. Highlighting, within the global energy consumption in Mexico for 2023, was the transportation sector; it is the most representative component with a 48.36% share, among which are energy consumption for the industrial sector, agricultural sector, residential commercial sector, and public sector [1,2,3]. However, the combustion products of these fossil fuels, such as carbon monoxide (CO), carbon dioxide (CO2), sulfur oxides (SOx), nitrogen oxides (NOx), hydrocarbons (HCs), toxic metals, and ash, have been causing many environmental problems and pose a great danger to the Earth [4,5,6]. Reported research indicates that the solution to these problems is to replace the existing fossil fuel systems with clean renewable energy systems, considering the technological modifications that this entails [7]. There are many studies supporting the reduction in emissions using biofuels. It is expected that by gradually or completely implementing the use of fossil fuels, emissions will be reduced [8,9]. An essential parameter in the production of biofuels is to determine the optimal blend proportions that allow reducing the environmental impact of emissions. Some experts claim that biofuels produce cleaner combustion than conventional fuels [10]. However, other researchers report an increase of up to 10% in NOX (nitrogen oxide) emissions [7,11,12], which is a harmful gas for living beings and the environment. In [13,14], authors investigate the recommended mixture proportions to mitigate this problem. Hydrogen provides an important path towards a sustainable energy future for the transportation sector in general, since it can be produced from wind, photovoltaic, solar, hydroelectric, biomass, or solid waste without consumption of non-renewable resources and without pollution of any kind. The current accessibility for the creation of cells that produce hydrogen further opens the possibilities for the massive implementation of these technologies [15,16].
During the emergence of potential technological innovation, most engineers spend years optimizing processes. In most cases, this optimization can be achieved by adding mature technologies that, at first glance, may seem unrelated. Nowadays, there is a tendency to introduce communication technologies to improve most processes since it is known that the best decisions are made if relevant and up-to-date information is provided. Nowadays, a wide range of communication protocols and reprogrammable Internet of Things (IoTs) devices are available [17,18], which allow the transfer of information over long distances with a very short time delay as well as facilitating the implementation of artificial intelligence techniques capable of making fast and accurate decisions. We live in a digitalized environment where Internet of Things devices and technological gadgets are necessary and included in most of our activities. For example, in [19,20,21], an air quality monitoring system was designed and implemented using IoT, considering temperature, humidity, and other gases in the environment. In [22,23], an IoT system was developed and implemented for the online visualization of collected solar energy.
In recent years, the application of IoT devices has been increasing, paving the way for a more optimistic future. For example, in agriculture, it has been used to monitor humidity and temperature in crops [24,25,26], also to monitor air quality. In [27,28], an innovative model is presented that uses these artificial intelligence techniques to detect pests in cotton crops. We can also find potential applications and advances in health care [29]. In [30], the authors developed a cloud-based distributed system to store data from users with chronic health problems, improving patient care and control. For domestic use, facial recognition access control (AI) systems and edge computing integration have been developed, which are commonly known as smart homes [31,32,33,34]. In Refs. [35,36], they have used IoT tools for the development of systems focused on monitoring air quality and traffic. In [37], the authors propose the study of CO2 emissions from traffic flow sensors, which estimates the CO2 in the air with respect to different congested and non-congested conditions.
The design and implementation of a safe and low-cost real-time air pollution monitoring system is presented by authors such as [24,38,39]. Their proposals consist of developing and implementing information systems (client–server), which provide information to users on air pollution rates. One of the differences between our proposal and the previous approach is in the application for monitoring emissions gases produced by the combustion of gasoline and hydrogen mixtures. Our prototype measures the levels of gases emitted by vehicles, specifically carbon monoxide (CO), hydrogen (H2), and carbon dioxide (CO2), as well as the temperature of the emissions to analyze the environmental impact and determine the carbon footprint caused by the use of. The primary contribution of this research lies in the technological innovation achieved through the design and development of a distributed client–server architecture that integrates both hardware and software components. This system incorporates Internet of Things (IoTs) devices and a robust software platform for efficient data management. The core objective is to develop and implement a sensor network specifically designed to monitor vehicle emissions from internal combustion engines, enabling the collection and analysis of critical environmental data.
The data gathered by this system facilitates a statistical comparison of emissions between vehicles powered by biofuels and those using conventional fuels. This comparative analysis provides valuable insights that support efforts to reduce environmental pollution—one of the most pressing ecological challenges both regionally and globally.
By combining innovative IoT technology with its application in a critical domain, this research demonstrates a dual focus: advancing technological solutions and addressing globally significant environmental concerns. This unique intersection of technology and environmental impact establishes the novelty and practical relevance of the study.
The design and implementation of secure and low-cost real-time air pollution monitoring systems have been explored in previous studies [3,27,28]. These systems primarily focus on monitoring air quality by measuring pollution levels in the environment, providing critical information to users about air pollution indices through client–server architectures.
Our proposal, however, addresses a significantly different application as follows: measuring the gas levels emitted directly by vehicles during operation. Specifically, we focus on monitoring carbon monoxide (CO), hydrogen (H2), and carbon dioxide (CO2), as well as the temperature of emissions. This approach allows us to analyze the environmental impact of vehicular emissions and determine the carbon footprint associated with the use of biofuels.
Measuring pollution while the vehicle is in motion is crucial because it captures real-world emission levels under varying driving conditions, such as acceleration, deceleration, and on streets with slopes, and with 5 crew members in the vehicle, the demand for fuel is greater. Unlike stationary environmental monitoring, this method provides more accurate and dynamic insights into how vehicles contribute to air pollution in real time. Such data are invaluable for evaluating the performance of biofuels compared to conventional fuels, identifying emission patterns, and informing strategies to reduce vehicular pollution. Ultimately, this innovation supports global efforts to mitigate environmental damage by providing actionable data for policymakers, researchers, and stakeholders.
In this paragraph, the sections that make up this study are described. In the materials and methods section, the electronic architecture designed to communicate with the sensors and the proposed devices is described, the client–server architecture and the user interface for data visualization are also designed, and a list of all the components used and all their characteristics is integrated. In the proposed hardware section, we can observe a more detailed description of the components used, as well as the reference data; flow charts that model the internal process of the device are also presented, and the specifications of the vehicle that was used for the tests are also described. In the results session, the final designs of the system that collects the information, the research findings found, and the future studies for this proposal are presented.
2. Materials and Methods
The proposed system is mainly based on two devices; the first device is a TTGO T-Call V1.3 ESP32 with SIM800L 240 MHz [40,41]. The TTGO T-Call V1.3 is a development board based on the ESP32 that includes a SIM800L module for 2G connectivity, allowing communication via SMS or mobile data. Here is the information about the manufacturer and other related details: Manufacturer: LoRa Electronics (or T-TGO, which is a brand associated with LoRa Electronics) City: Shenzhen (China).
This module is from the family of SoC chips with low cost and energy consumption (5 V DC), and it also features a SIM800L module that enables a GPRS 3G/4G connection.. The manufacturer of the development board used in this study, “Espressif”, developed a communication protocol called “ESP-Now” that works under the 2.4 GHz [42,43] band. This protocol is designed by the esp32 module provider. This communication protocol allows the connection of many devices in a master-slave network to provide information from different nodes simultaneously, as shown in Figure 1. As we can see in Figure 1, the master device receives information from the node 1 device with slave settings; the data are collected through the sensors shown in Figure 1.
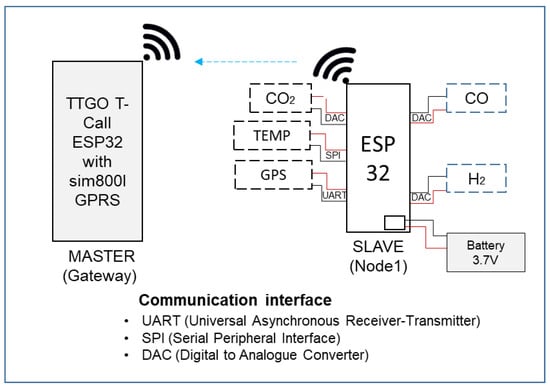
Figure 1.
Master-slave communication scheme.
The ESP32 module has the following features: Xtensa dual-core processor, 32-bit architecture and Bluetooth, 24 GPIO pins, Analog-to-Digital Converter: Two SAR-type 12-bit ADCs, power supply (USB) of 5 V DC, manufactured by Espressif Systems, a technology company based in Shanghai, China. This module has the necessary features for this project. Table 1 shows the features of the physical components proposed for this project.

Table 1.
Description of the device components.
Figure 2 shows the system that consists of cloud-based software architecture (client–server); information comes from the software that establishes a connection with the specific sensors to detect carbon dioxide (CO2), carbon monoxide (CO), hydrogen (H2), the temperature of the gases of emissions, and GPS positioning. These sensors are connected to a development board. They are connected wirelessly using a gsm data network to the second software to send the collected data of pollutant emissions of vehicles that use mixtures of petroleum fuels and biofuels mixed with fuels for observation and analysis. The developed software is a website where users can register and view data from the emissions of their cars or units to evaluate, with a GUI to visualize real-time data. It also has administrator operations for user control.
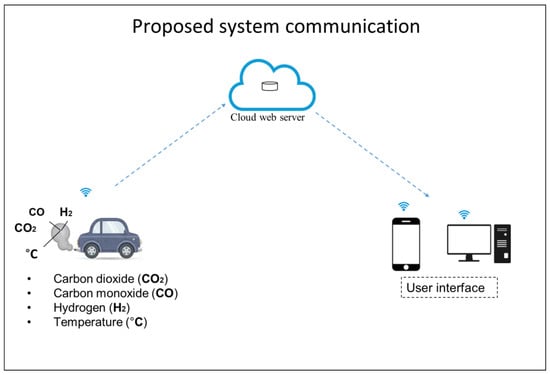
Figure 2.
General illustration of the proposal.
Figure 2 shows the illustration of communication used in this project. Some of the features are mentioned below:
- (a)
- The sensors used in this project were placed in a device designed and manufactured according to the requirements of this project (see Figure 3). Features and a list of additional components are described in Table 1.
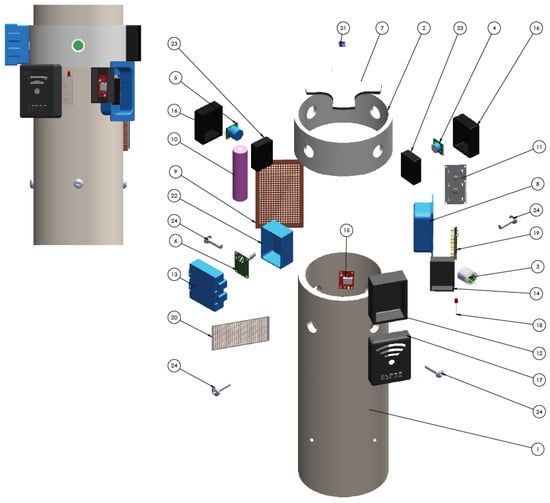 Figure 3. Illustration of the developed system and the numbered parts that make it up.
The design ensures the correct operation of the device; adapters were also designed for the connection in exhaust pipes so the device could be versatile and adaptable to most vehicles. This provides advantages for performing tests in any vehicle. The components of the designed device are described in Table 1.
The collected data are sent by module TTGO T-Call using the GSM network with 4G mobile data service.
- (a)
- The data collected by the sensors are sent to a cloud-based web server to be stored in a database. The web-based system, designed with user-friendliness in mind, features a MySQL database manager (version 8.0 lts), the PHP (Latest version 8.4.3) programming language, HTML5, CSS style sheets, JavaScript (ES12), and node.js, see https://citecuvp.tij.uabc.mx/hcarbono/, accessed on 28 January 2025. The software tools proposed in this project allow the creation of an intuitive and interactive web system. The programming for the master and slave devices is C-type code, carried out by using the Arduino programming interface in accordance with the indications provided by manufacturers. The device provides libraries to simplify communication and operation with sensors. It is important to mention that MySQL was selected because it is one of the most popular for its compatibility to work with web-based systems and can be installed on any operating system.
- (b)
- The user interface allows the creation of a customizable profile account. It also visualizes the data through graphs and exports it to different formats so that it can be analyzed and characterized with specialized software.
Hardware Proposal
Table 2 shows the main characteristics of the electronic components used in this project.

Table 2.
Characteristics of the sensors.
Unlike the CO2 sensor, the sensors used for this project feature self-calibration. Calibration for this sensor is performed based on the recommendation by [45].
Based on Figure 1, it is considered important to mention the following: the main component of this project is the ESP 32 TTGO t-call ‘Esp 32 Master’. The purpose of this device is to gather and send to the cloud the data coming from the emissions of the test vehicle. A second ESP 32 ‘slave’ device is also implemented to communicate with the sensors to perform the readings and collect the data to send to the master device. Figure 4 and Figure 5 describe the phases of the process. For synchronization and communication between the two devices, the ESP now [43,45] protocol is used; this protocol is developed and proposed by the manufacturer of these ESP32 development boards. Figure 4 shows a flow diagram illustrating the process of the ESP 32 Slave ‘Node 1’.
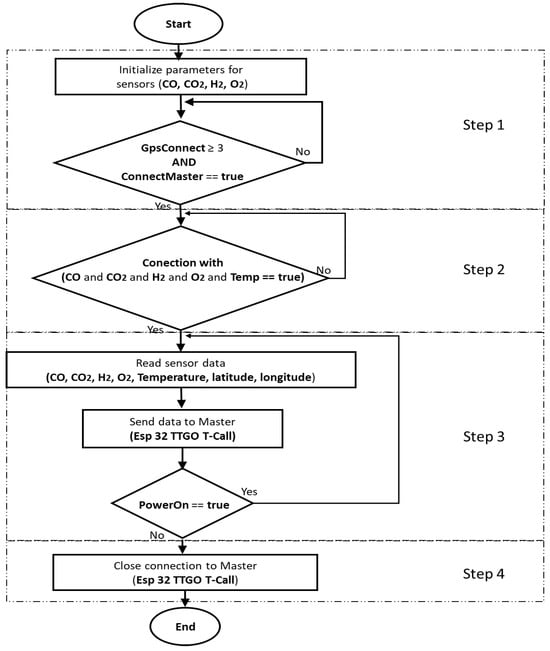
Figure 4.
Process flow diagram of ESP 32 Slave ‘Node 1’.
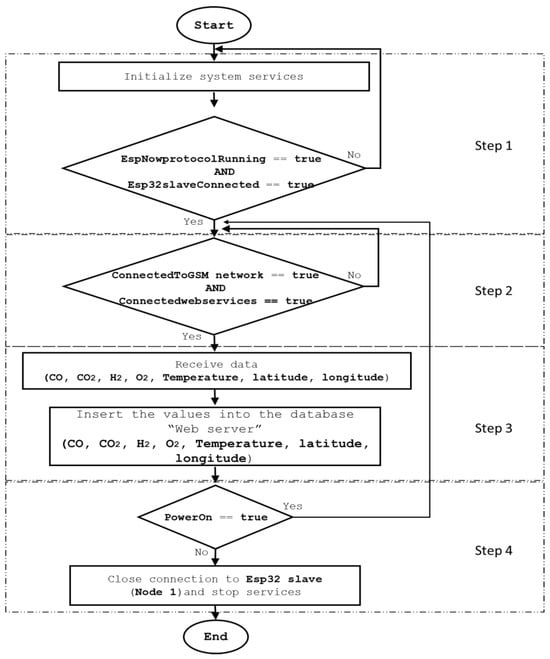
Figure 5.
Flowchart 2 ESP 32 TTGO t-call process “Esp 32 Master”.
Step 1: As mentioned in the previous section, the slave module is programmed following the C language syntax. The required parameters by the components are initialized, values are also established for variables, and communication with the sensors is synchronized for self-calibration and to initiate data reading. A condition is established to validate communication of the GPS module with at least 3 satellites for optimal accuracy. In addition, communication with the master module (node 2) is validated. If this condition is not met, the process cannot continue. Therefore, this step is repeated until the condition is true.
Step 2: In this step, a condition is established to validate the communication and synchronization with all the sensors used in this project. If the condition is not met, the process cannot continue. Therefore, this step is repeated until the condition is true.
Step 3: At this stage, the test vehicle must be in operation, and the device must be attached to the emissions exhaust so that the sensors can start collecting data and send it to the master module (node 2). The task is performed if the device has a power supply and is turned on. Otherwise, the task is finished, and the connection to the master module is closed.
Step 4: In this step, the communication with the master device is closed, and the data transmission is ceased; this can happen due to the following conditions: power shortage, test time expired for the vehicle, or circuit failure.
Figure 5 shows the ESP 32 TTGO t-call ‘Esp 32 master’ process.
Step 1: At this stage, the primary system services must be active, a condition is established to validate it, the communication protocol esp now [45] must be active, and also the slave esp 32 (node 1) must be synchronized; otherwise, the process cannot continue. Therefore, this step is repeated until the condition is proper.
Step 2: For the successful delivery of data to the developed web system, the following must be validated: the gms module must be connected to the 4 g mobile network with a data package sending service, and the master module must be synchronized with the web server; otherwise, the process is repeated until the 2 conditions are true.
Step 3: If the conditions established in the previous steps are true, the data reception starts, and then the data are sent to the web system: https://citecuvp.tij.uabc.mx/hcarbono/, accessed on 28 January 2025. The process is repeated as long as the device has a power supply and is turned on; otherwise, the connection with the slave module ‘node 1’ is closed, and the services mentioned in steps 1 and 2 are ceased.
Step 4: In this step, a condition is established to validate if the device is on; if this condition is true, steps 2 and 3 are repeated. Otherwise, the connection to the slave device is closed, and the services are ceased. Figure 4 and Figure 5 describe the general process carried out by each device used in this project.
For the experimental tests, a vehicle will be used; the technical characteristics are as follows: Toyota Corolla 2017 has a 1.8 L engine, with 132 horsepower and a torque of 128 lb-ft associated with a 5-speed automatic transmission CVT w/OD. The tests were carried out over a distance of 10 km on a road with few curves and slopes, mostly a straight route, considering two accelerations at 40 km/h and 60 km/h. For the two speeds, two fuels were used, namely, 100% gasoline (G100) and a mixture of gasoline and hydrogen (G-H). For the first test scenario, 100% Mexican gasoline is used. The physicochemical properties of gasoline are an average octane rating of 87, an average density of 0.746 kg/L, an average maximum sulfur content of 30 ppm, and an average calorific value of 44 MG/L. Physicochemical properties may vary depending on the region of the country [46,47,48,49,50]. The second scenario is the use of a mixture of hydrogen fuel with gasoline; for the hydrogen cell, a concentration of 0.0211 mL/gal of electrolyte (80 mL) was used, as shown in Table 3. For the measurement and calibration of the sensors used by the device, the following specialized equipment for measuring emissions was used: Enerac 700 portable equipment with the technical specifications, as shown in Table 4. For this study, the measuring instruments were previously tested and calibrated.

Table 3.
Experimental design of the tests.

Table 4.
Emissions analyzer specifications.
3. Results
As part of the obtained results, the communication and synchronization circuit of the sensors with the reprogrammable esp32 devices used on this project was designed and developed, as shown in Figure 1. This first integrated software and hardware prototype was initially developed and designed to work with sensors for the detection of gases such as CO, CO2, SOX, H2, NOX, and ppm. However, for the purposes of this article, the information is limited to the CO and CO2 exhaust gases produced by combustion. In the next phase of the project, results for the remaining exhaust gases will be presented. The collected data will be available for the user to interact with. In Figure 2, the illustration of the communication design is displayed. In Figure 3, the device designed to integrate the components used in this project is displayed. Figure 6 shows the communication interface between the user and the web system developed for this project. The following link can be used to visit the system: H.Carbono|Pagina Principal. Figure 6 is divided into 5 sections that are described below: In this session of the interface, the user selects which data to display in the graph 5 (emissions humidity, emissions temperature, atmospheric pressure, H2, CO, and CO2).
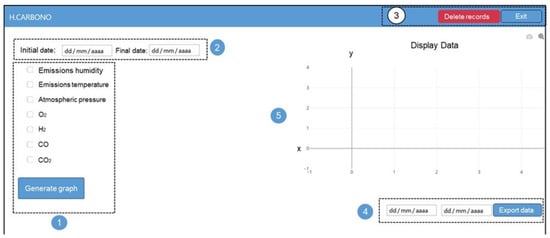
Figure 6.
User interface for data visualization.
- The user selects the range of dates for the data to be displayed.
- The user can delete the collected data so far, plus a button to log out or exit the system.
- The user can export the collected data to a format (.xlsx) to perform a specific analysis.
- In this area, the user can graphically observe the selected data. The displayed data are obtained and sent from the esp32 modules (slave and master).
- (a)
- X: Displays the time of the test in minutes.
- (b)
- Y: Represents the value assigned for each data.
In Section 3 of Figure 6 shows the results obtained from the tests performed on the vehicle; technical features are as follows: Toyota Corolla 2017 has a 1.8 L engine, with 132 horsepower and a torque of 128 lb-ft associated with a 5-speed automatic transmission CVT w/OD. The tests were conducted over a distance of 6 km on a road with few curves and slopes, mostly a straight route, as shown in Figure 6.
The results of all experimental runs were conducted under the following identical conditions: maintaining a constant average speed of either 40 km/h or 60 km/h, depending on the type of experiment. The experiments followed a straight 10 km route with minimal obstacles and negligible differences in terrain elevation. These conditions were chosen to ensure basic tests with reduced vibrations, thereby minimizing risks to the integrity of the developed prototype. Environmental parameters included an average temperature of 30 °C, a relative humidity of 91%, and an atmospheric pressure of 101.76 kPa.
Figure 7a presents the CO and CO2 emission results from the experimental runs with the vehicle operating on G100 fuel at an average speed of 40 km/h. The emissions averaged 283 ppm of CO and 15.43% Vol of CO2 over the entire route. These results correspond to a vehicle operating under conditions that do not demand significant power, with the engine running at low revolutions.
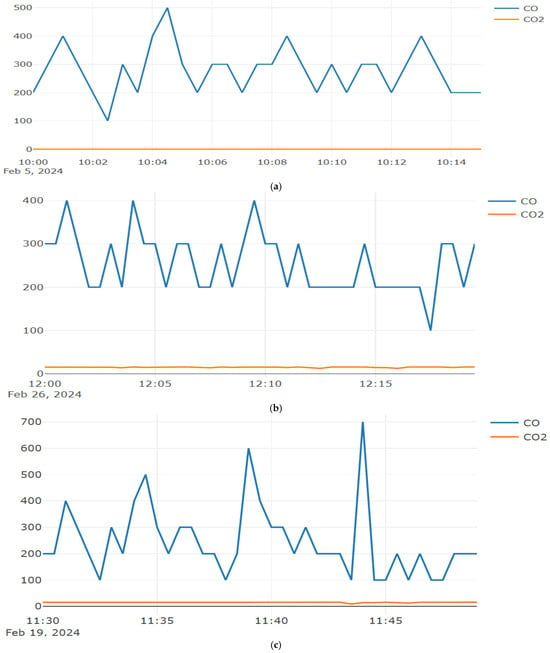
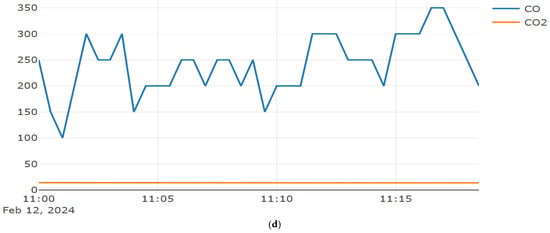
Figure 7.
(a) Speed of 40 km/h using G100 fuel, (b) speed of 40 km/h using G-H fuel, (c) speed of 60 km/h using G100 fuel, and (d) speed of 60 km/h using G-H fuel.
Figure 7b illustrates the CO and CO2 emissions for runs using GH fuel at an average speed of 40 km/h. On average, emissions measured 255 ppm of CO and 15% Vol of CO2. Compared to the G100 fuel runs, these values indicate a reduction of 28 ppm in CO and 0.38% Vol in CO2. This decrease aligns with expectations, as hydrogen mixed with gasoline enhances combustion efficiency within the combustion chamber.
Figure 7c shows the emission results for runs using G100 fuel at an average speed of 60 km/h. Emissions averaged 245 ppm of CO and 15% Vol of CO2. These findings reflect conditions where the engine operates at moderate revolutions, and the vehicle approaches the manufacturer-recommended speed range of 100–105 km/h for optimal fuel efficiency and mileage. Maintaining a steady speed in this range minimizes energy consumption and enhances overall efficiency.
Figure 7d reports the CO and CO2 emissions for runs conducted with GH fuel at an average speed of 60 km/h. Emissions averaged 240 ppm of CO and 14.2% Vol of CO2. As anticipated, the use of hydrogen in the fuel mixture led to a further reduction of 5 ppm in CO and 0.8% Vol in CO2. This outcome highlights the positive impact of hydrogen in improving combustion dynamics and reducing pollutant emissions.
In a study conducted by the University of California, a 2.4 L four-cylinder engine was used to analyze emissions produced by different blends of gasoline and hydrogen. The results showed that using a 20% hydrogen blend reduced carbon dioxide (CO2) emissions by 12% and total emissions by 38%. However, using a 40% hydrogen blend increased total emissions due to higher production of nitrogen oxides (NOx) [51]. Another study by the Technical University of Denmark used a diesel engine to analyze emissions from a blend containing 30% hydrogen in natural gas. The results showed a significant reduction in total emissions, including CO2, NOx, and particulates. Additionally, an improvement in engine performance was observed [52,53].
When using G100 and GH fuels at a speed of 40 km/h, under the conditions mentioned, an average decrease of 10% CO and 5% CO2 can be observed. For the speed of 60 km/h, a reduction of 2% and 5% CO and CO2 emissions was obtained working with G100 and GH fuels, as shown in Figure 8. This is because hydrogen improves the combustion stage within the engine by accelerating the burning process [53]. It should be noted that hydrogen has a higher calorific value than gasoline, but it should also be noted that increasing the speed from 40 km/h to 60 km/h improves performance and increases combustion efficiency, considering that the road that is traveled does not demand a power demand from the engine and considering that the environmental conditions are favorable for a friendly operation [54].
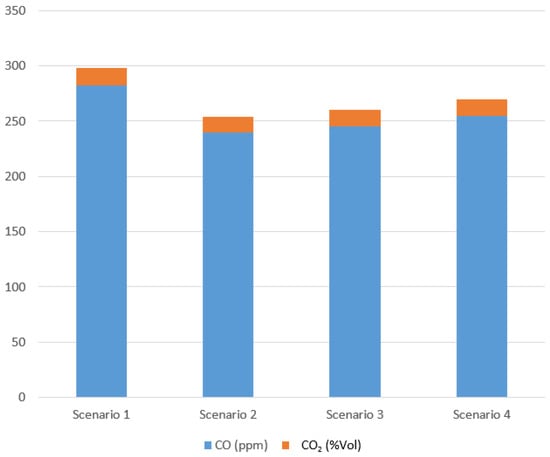
Figure 8.
Average emissions at 40 km/h and 60 km/h using G100 and GH as fuel.
4. Final Considerations and Future Research
The developed prototype incorporates stages of research, design, software, and hardware development. It is a distributed system with a client–server architecture, integrating Internet of Things (IoTs) devices along with data management software. The device is designed to census and evaluate the carbon footprint. A website, H.Carbono|Pagina Principal, accessed on 28 January 2025 was created to receive real-time data transmitted by the device, along with data from the developed software and hardware. This information is then evaluated to calculate the carbon footprint, based on two constant speeds, 40 km/h and 60 km/h, using G100 and GH fuels.
On average, a reduction in emissions of 5% to 10% was achieved due to hydrogen use in the vehicle. Although the emission reduction is relatively low, future research aims to increase the concentration of electrolytes in the solution to boost hydrogen production and increase the amount of hydrogen injected into the combustion chamber. Initial tests started with 0.1198 mL of electrolytes dissolved in 1 L of solution within the hydrogen cell in a hydrogen-gasoline mixture. In future developments, sensors specifically for vehicle emissions will be incorporated to provide more precise gas emission measurements. This includes sensors for oxygen, NOx, and unburned hydrocarbons, as well as sensors to determine the engine’s RPM and fuel consumption.
Developing a prototype equipped with portable hardware and software, featuring its own power source and incorporating Internet of Things (IoTs) devices along with a robust software platform for efficient data management, would enable precise measurement of the carbon footprint under real road conditions. This solution would be applicable to vehicles of various brands and models, including those with 4, 6, and 8 pistons, powered by G100 gasoline, diesel mixed with biodiesel, propane, or natural gas.
The system would facilitate the collection and analysis of emissions data, allowing for the detection of regular or irregular behavior in vehicle performance. Additionally, it would support the evaluation of emission levels over time, building a comprehensive database to enhance understanding of emission patterns. This approach is particularly relevant in the context of the gradual adoption of biofuels in internal combustion engines (ICEs), a process that is just beginning to gain traction in countries like Mexico.
Author Contributions
Substantial contributions to the conception of the experiments were carried out by C.C.M. and A.S.-P.; the methodology and statistical experimental design were mostly conceptualized by J.A.S.M. and J.A.R.O.; the analysis corresponding to the desirability function and optimization were performed by L.C.H. and S.J.C. All authors have read and agreed to the published version of the manuscript.
Funding
This research received no external funding.
Institutional Review Board Statement
Not applicable.
Informed Consent Statement
Not applicable.
Data Availability Statement
Data is contained within the article.
Acknowledgments
The authors thank the National Council of Science and Technology CONACYT Mexico, Faculty of Engineering and Technology Sciences, and the Autonomous University of Baja California for their support in the development of this study.
Conflicts of Interest
The authors declare no conflicts of interest.
References
- BP. BP Statistical Review of World Energy. 2021. Available online: https://www.bp.com/content/dam/bp/business-sites/en/global/corporate/pdfs/energy-economics/statistical-review/bp-stats-review-2021-full-report.pdf (accessed on 12 February 2023).
- Davenport, J. Launch Presentation: AGM. 2024. Available online: https://www.energy.ox.ac.uk/wp-content/uploads/2024/09/4.-11.50am-Juliet-Davenport-SLIDES-SR-2024-launch-presentation-AGM.pdf (accessed on 15 February 2023).
- Gobierno de México. Balance Nacional de Energía: Preliminar. 2023. Available online: https://www.gob.mx/cms/uploads/attachment/file/947752/BALANCE_NACIONAL_DE_ENERG_A_PRELIMINAR_2023.pdf (accessed on 22 February 2023).
- Scholz, I.; Brandi, C. Implementing the 2030 Agenda for Sustainable Development: Achievements and Limitations of the G20 Presidency in 2017. Glob. Summitry 2017, 3, 156–175. [Google Scholar] [CrossRef]
- Edenhofer, O.; Pichs-Madruga, R.; Sokona, Y.; Minx, J.C.; Farahani, E.; Kadner, S.; Seyboth, K.; Adler, A.; Baum, I.; Brunner, S.; et al. Climate Change 2014 Mitigation of Climate Change; Cambridge University Press: Cambridge, UK, 2014. [Google Scholar]
- Sarkodie, S.A.; Strezov, V. A Review on Environmental Kuznets Curve Hypothesis Using Bibliometric and Meta-Analysis. Sci. Total Environ. 2019, 649, 128–145. [Google Scholar] [CrossRef] [PubMed]
- Chauhan, B.S.; Kumar, N.; Cho, H.M. A study on the performance and emission of a diesel engine fueled with Jatropha biodiesel oil and its blends. Energy 2012, 37, 616–622. [Google Scholar] [CrossRef]
- Frijters, P.J.M.; Baert, R.S.G. Oxygenated fuels for clean heavy-duty diesel engines. Int. J. Veh. Des. 2006, 41, 242–255. [Google Scholar] [CrossRef]
- Sahoo, P.K.; Das, L.M.; Babu, M.K.G.; Arora, P.; Singh, V.P.; Kumar, N.R.; Varyani, T.S. Comparative evaluation of performance and emission characteristics of jatropha, karanja and polanga based biodiesel as fuel in a tractor engine. Fuel 2009, 88, 1698–1707. [Google Scholar] [CrossRef]
- Igbum, O.G.; Eloka-Eboka, A.C.; Ubwa, S.T.; Inambao, F.L. Evaluation of environmental impact and gaseous emissions of biodiesel fuels and blends of selected feedstocks. Int. J. Glob. Warm. 2014, 6, 99–112. [Google Scholar] [CrossRef]
- Tesfa, B.; Gu, F.; Mishra, R.; Ball, A. Emission Characteristics of a CI Engine Running with a Range of Biodiesel Feedstocks. Energies 2014, 7, 334–350. [Google Scholar] [CrossRef]
- Hansen, A.C.; Gratton, M.R.; Yuan, W. Diesel engine performance and NOX emissions from oxygenated biofuels and blends with diesel fuel. Trans. ASABE 2006, 49, 589–595. [Google Scholar] [CrossRef]
- Varatharajan, K.; Cheralathan, M.; Velraj, R. Mitigation of NOx emissions from a jatropha biodiesel fuelled DI diesel engine using antioxidant additives. Fuel 2011, 90, 2721–2725. [Google Scholar] [CrossRef]
- Pérez, A.; Ramos, R.; Montero, G.; Coronado, M.; García, C.; Pérez, R. Virtual Instrument for Emissions Measurement of Internal Combustion Engines. J. Anal. Methods Chem. 2016, 2016, 9459516. [Google Scholar] [CrossRef]
- Jurić, Z.; Vidović, T.; Šimunović, J.; Radica, G. A Comprehensive Analysis of Hydrogen–Gasoline Blends in SI Engine Performance and Emissions. Energies 2024, 17, 1557. [Google Scholar] [CrossRef]
- Desantes, J.; Molina, S.; Novella, R.; Lopez-Juarez, M. Comparative global warming impact and NOX emissions of conventional and hydrogen automotive propulsion systems. Energy Convers. Manag. 2020, 221, 113137. [Google Scholar] [CrossRef]
- Li, S.; da Xu, L.; Zhao, S. 5G Internet of Things: A survey. J. Ind. Inf. Integr. 2018, 10, 1–9. [Google Scholar] [CrossRef]
- IEEE Xplore Full-Text PDF. Available online: https://ieeexplore.ieee.org/stamp/stamp.jsp?tp=&arnumber=10643995 (accessed on 16 January 2025).
- Landge, P.D.; Harne, R. Air Quality Monitoring System for City: A Review. Int. Res. J. Eng. Technol. 2018, 5, 5–6. [Google Scholar]
- Calderón, D.; Folgado, F.J.; González, I.; Calderón, A.J. Implementation and Experimental Application of Industrial IoT Architecture Using Automation and IoT Hardware/Software. Sensors 2024, 24, 8074. [Google Scholar] [CrossRef]
- Saffran, J.; Garcia, G.; Souza, M.A.; Penna, P.H.; Castro, M.; Góes, L.F.W.; Freitas, H.C. A low-cost energy-efficient raspberry Pi cluster for data mining algorithms. In Proceedings of the European Conference on Parallel Processing, Compostela, Spain, 28 August–1 September 2017; Lecture Notes in Computer Science (Including Subseries Lecture Notes in Artificial Intelligence and Lecture Notes in Bioinformatics). Springer: Berlin/Heidelberg, Germany, 2017; Volume 10104, pp. 788–799. [Google Scholar]
- Patil, S.M.; Vijayalashmi, M.; Tapaskar, R. IoT based solar energy monitoring system. In Proceedings of the 2017 International Conference on Energy, Communication, Data Analytics and Soft Computing (ICECDS), Chennai, India, 1–2 August 2017; pp. 1574–1579. [Google Scholar] [CrossRef]
- Paneque, M. Bioenergy—A Sustainable and Reliable Energy Source. Agric. Res. Technol. Open Access J. 2017, 4, 555642. [Google Scholar] [CrossRef]
- Navulur, S.; Sastry, A.S.C.S.; Giri Prasad, M.N. Agricultural Management through Wireless Sensors and Internet of Things. Int. J. Electr. Comput. Eng. 2017, 7, 3492–3499. [Google Scholar] [CrossRef]
- Lai, X.; Yang, T.; Wang, Z.; Chen, P. IoT Implementation of Kalman Filter to Improve Accuracy of Air Quality Monitoring and Prediction. Appl. Sci. 2019, 9, 1831. [Google Scholar] [CrossRef]
- Kumar, R.; Pallikonda Rajasekaran, M. An IoT based patient monitoring system using raspberry Pi. In Proceedings of the 2016 International Conference on Computing Technologies and Intelligent Data Engineering (ICCTIDE’16), Kovilpatti, India, 7–9 January 2016. [Google Scholar] [CrossRef]
- Rustia, D.J.A.; Lin, T.-T. An IoT-based wireless imaging and sensor node system for remote greenhouse pest monitoring. Chem. Eng. Trans. 2017, 58, 601–606. [Google Scholar] [CrossRef]
- Sarangdhar, A.A.; Pawar, V. Machine learning regression technique for cotton leaf disease detection and controlling using IoT. In Proceedings of the International Conference on Electronics, Communication and Aerospace Technology, ICECA 2017, Coimbatore, India, 20–22 April 2017; pp. 449–454. [Google Scholar] [CrossRef]
- Sanjeevi, P.; Siva Kumar, B.; Prasanna, S.; Maruthupandi, J.; Manikandan, R.; Baseera, A. An ontology enabled internet of things framework in intelligent agriculture for preventing post-harvest losses. Complex Intell. Syst. 2021, 7, 1767–1783. [Google Scholar] [CrossRef]
- Qi, J.; Yang, P.; Min, G.; Amft, O.; Dong, F.; Xu, L. Advanced internet of things for personalised healthcare systems: A survey. Pervasive Mob. Comput. 2017, 41, 132–149. [Google Scholar] [CrossRef]
- Calo, S.B.; Touna, M.; Verma, D.C.; Cullen, A. Edge computing architecture for applying AI to IoT. In Proceedings of the 2017 IEEE International Conference on Big Data, Boston, MA, USA, 11–14 December 2017; pp. 3012–3016. [Google Scholar] [CrossRef]
- (PDF Internet of Things) Internet of Things (IOT) Based Gas Leakage Monitoring and Alerting System with MQ-2 Sensor. Available online: https://www.researchgate.net/publication/357768388_Internet_of_Things_IOT_Based_Gas_Leakage_Monitoring_and_Alerting_System_with_MQ-2_Sensor (accessed on 10 April 2023).
- IoT Based Water Monitoring and Alerting System. Available online: https://www.researchgate.net/publication/341908442_IoT_based_Water_Monitoring_and_Alerting_System (accessed on 18 April 2023).
- Al-Mutawa, R.F.; Eassa, F.A. A smart home system based on internet of things. Int. J. Adv. Comput. Sci. Appl. 2020, 2, 260–267. [Google Scholar] [CrossRef]
- Martín-Baos, J.Á.; Rodriguez-Benitez, L.; García-Ródenas, R.; Liu, J. IoT based monitoring of air quality and traffic using regression analysis. Appl. Soft Comput. 2022, 115, 108282. [Google Scholar] [CrossRef]
- Wang, H.; Chen, Y.; Li, L. A novel deep learning method for traffic flow forecasting based on Web traffic data. IEEE Access 2019, 7, 104453–104464. [Google Scholar]
- Bilotta, S.; Nesi, P. Estimating CO2 emissions from IoT traffic flow sensors and reconstruction. Sensors 2022, 22, 3382. [Google Scholar] [CrossRef] [PubMed]
- Guanochanga, B.; Cachipuendo, R.; Fuertes, W.; Salvador, S.; Benítez, D.S.; Toulkeridis, T.; Torres, J.; Villacís, C.; Tapia, F.; Meneses, F. Real-time air pollution monitoring systems using wireless sensor networks connected in a cloud-computing, wrapped up web services. Adv. Intell. Syst. Comput. 2019, 880, 171–184. [Google Scholar]
- Alkandari, A.A.; Moein, S. Implementation of monitoring system for air quality using raspberry PI: Experimental study. Indones. J. Electr. Eng. Comput. Sci. 2018, 10, 43–49. [Google Scholar] [CrossRef]
- Kodali, R.K.; Borra, K.Y.; Sharan Sai, G.N.; Domma, H.J. An IoT Based Smart Parking System Using LoRa. In Proceedings of the 2018 International Conference on Cyber-Enabled Distributed Computing and Knowledge Discovery (CyberC), Zhengzhou, China, 18–20 October 2018; pp. 151–154. [Google Scholar] [CrossRef]
- Tovar-Soto, J.P.; Pareja-Figueredo, C.F.; García-Navarrete, O.L.; Gutiérrez-Martínez, L.C. Performance evaluation of LoRa technology for implementation in rural areas. DYNA 2021, 88, 69–78. [Google Scholar] [CrossRef]
- Hoang, T.N.; Van, S.T.; Nguyen, B.D. ESP-NOW Based Decentralized Low Cost Voice Communication Systems for Buildings. In Proceedings of the 2019 International Symposium on Electrical and Electronics Engineering (ISEE), Ho Chi Minh City, Vietnam, 10–12 October 2019; pp. 108–112. [Google Scholar] [CrossRef]
- Cameron, N. Electronics Projects with the ESP8266 and ESP32. In Electronics Projects with the ESP8266 and ESP32; Springer: Berlin/Heidelberg, Germany, 2021. [Google Scholar] [CrossRef]
- Maier, A.; Sharp, A.; Vagapov, Y. Comparative analysis and practical implementation of the ESP32 microcontroller module for the internet of things. In Proceedings of the 2017 Internet Technologies and Applications (ITA), Wrexham, UK, 12–15 September 2017; pp. 143–148. [Google Scholar] [CrossRef]
- Gutai, I.; Sovilj, P.; Subotin, M.; Novakovic, D.; Gazivoda, N.; Vujicic, B. A prototype of a system for detecting G force in an automobile, based on two ESP32′s. In Proceedings of the 2021 Zooming Innovation in Consumer Technologies Conference (ZINC), Novi Sad, Serbia, 26–27 May 2021; pp. 191–192. [Google Scholar] [CrossRef]
- Pemex. Available online: https://www.pemex.com/ (accessed on 12 April 2023).
- Secretaría de Energía de México. Available online: https://www.gob.mx/sener (accessed on 18 April 2023).
- Agencia Nacional de Seguridad Industrial y de Protección al Medio Ambiente del Sector Hidrocarburos (ASEA). Available online: https://www.gob.mx/asea (accessed on 23 May 2023).
- Instituto Mexicano del Petróleo (IMP). Available online: https://www.gob.mx/imp (accessed on 29 May 2023).
- Normas Oficiales Mexicanas (NOM) Relacionadas Con la Gasolina. Available online: https://www.gob.mx/busqueda?utf8=%E2%9C%93&search=gasolina+noms (accessed on 5 June 2023).
- Dimitriou, P.; Kumar, M.; Tsujimura, T.; Suzuki, Y. Combustion and emission characteristics of a hydrogen-diesel dual-fuel engine. Int. J. Hydrog. Energy 2018, 43, 13605–13617. [Google Scholar] [CrossRef]
- Dimitriou, P.; Tsujimura, T. A review of hydrogen as a compression ignition engine fuel. Int. J. Hydrogen Energy 2017, 42, 24470–24486. [Google Scholar] [CrossRef]
- Ji, C.; Wang, S.; Zhang, B. Effect of spark timing on the performance of a hybrid hydrogen–gasoline engine at lean conditions. Int. J. Hydrogen Energy 2010, 35, 2203–2212. [Google Scholar] [CrossRef]
- Ji, C.; Wang, S. Experimental study on combustion and emissions performance of a hybrid hydrogen–gasoline engine at lean burn limits. Int. J. Hydrogen Energy 2010, 35, 1453–1462. [Google Scholar] [CrossRef]
Disclaimer/Publisher’s Note: The statements, opinions and data contained in all publications are solely those of the individual author(s) and contributor(s) and not of MDPI and/or the editor(s). MDPI and/or the editor(s) disclaim responsibility for any injury to people or property resulting from any ideas, methods, instructions or products referred to in the content. |
© 2025 by the authors. Licensee MDPI, Basel, Switzerland. This article is an open access article distributed under the terms and conditions of the Creative Commons Attribution (CC BY) license (https://creativecommons.org/licenses/by/4.0/).