Abstract
Environmental, social, and governance (ESG) aspects have a growing relevance in the corporate world where the objective for sustainability becomes an essential point. The supply chain (SC) is a buyer’s responsibility and accounts for a large part of their ESG footprint. Since ESG performance extends to SC, poor ESG practices in the SC can negatively affect the sustainability of the Anchor Company (AC). Therefore, AC, the buyer, needs to go through a complex, expensive, and time-consuming process to assess their SC. The objective of this work is to develop an ESG assessment model for companies to receive a quantitative score of their footprint by considering both their operations and the SC. The model is verified by considering different scenarios that are designed by testing two different cases with different interactions between two ACs and two SCs with different ESG maturity levels. Results show that the SC has a significant impact on the final ESG score of the AC, highlighting the need for considering the SC to evolve in ESG aspects. In all tested cases, the SC accounted for more than 50% of the final consolidated ESG score. Despite differing ESG maturity levels, two ACs received the same consolidated score due to the influence of their SC scores. Results emphasize that achieving a strong consolidated ESG score is important, and advanced corporate sustainability is not possible without integrating the SC into the strategy. The novel methodology proposed contributes to sustainability, expanding the scope of ESG assessments to include SC and developing a standardized and adaptable model with practical applications.
1. Introduction
Sustainability is a complex concept related to the responsibility of the future generations. This idea has a growing importance especially due to environmental issues associated with climate change. Nevertheless, this responsibility spreads all over human society, reaching social welfare and the corporate world. The environmental, social, and governance (ESG) framework is a collection of strategies that defines the management of sustainable care. ESG is a trend that incorporates sustainability issues in company strategies by evaluating the impacts that are made on both planet and society. ESG is becoming an emblematic symbol of the modern era since it is a high priority for businesses as they must comply with requirements of sustainability standards and be focused on more than just profit [1]. Companies that do not assess ESG are losing competitiveness; nevertheless, on the other hand, processes are usually high in cost and time consuming. In this regard, it is important to quantify the ESG footprint to establish proper strategies to evolve with ESG performance.
An Anchor Company (AC) is a focal company, a buyer, that needs to be supplied by different companies that constitute its supply chain (SC). This chain can be complex, involving different market aspects. An SC positively affects the operational performance of the buyer, which means that a resilient SC is entirely connected with the success of a company [2]. By considering the ESG momentum and the responsibility for suppliers’ action, it is necessary to work all these aspects down the chain. However, managers are finding difficulties in dealing with the increasingly complex SC despite adopting a variety of risk mitigation strategies. In this regard, various kinds of environmental and social sustainability practices in recent times have been adopted to reduce carbon footprint, improving a company’s reputation on the social front [3].
Ref. [4] presented an analysis showing that sustainable internal, supplier, and customer integration fosters both green managerial and process innovations. Findings also suggest that green managerial innovation has a significant positive influence on the firm’s financial performance, which enhances the ESG level [5] showed that social SC practices impact the firm’s social performance. Nevertheless, results indicated that the social element of sustainable procurement does not affect the firm’s social performance. Social fairness challenged manufacturing firms to comply with sustainable production and distribution. Most firms are still not aware of their role and social responsibility to develop the local suppliers and community. Moreover, incorporating green procurement, logistics, product, and process design has a positive impact on improving carbon performance. Nevertheless, green logistics needs improvements to achieve carbon efficiency [6], which are factors that directly support the shift towards a more sustainable SC, reinforcing the relationship between the AC with its SC.
Usually, companies affirm that tracing suppliers is costly and does not provide clear benefits [7]. SC traceability is achieved when the AC verifies and follows the entire operation from the lowest tier until the final customer, reporting the findings to the community in order to address all ESG topics and footprint [8]. In addition, corporate obligations go beyond their operations, and they are held liable for the actions of their suppliers [9]. Furthermore, AC faces significant challenges to track suppliers’ emissions and other sustainability indicators to meet the growing demand for decarbonization and avoid reputational liabilities through illegal or unethical actions. Suppliers directly impact disruptions experienced by the AC [10]. For example, suppliers with working conditions analogous to slavery can make people stop consuming from the AC, and companies that fail to measure and reduce their total emissions may be less attractive to investors.
On this basis, innovative technologies are being developed to help companies to access these topics, allowing them to become more consistent and successful. There is a new industrial revolution era coming through the fast development of artificial intelligence, data-driven information, machine learning, energy sources, and others, directly affecting production and operation management [11]. Technology-driven strategies not only improve operational efficiency and cost management but also advance long-term ESG performance and sustainability outcomes [12].
Moreover, the adoption of ESG practices to meet the new demands can be challenging for companies due to the lack of historical data, difficulty in measurement, and the absence of standardized reporting metrics. To promote an environmentally informed society and drive real change, ESG standardization, reporting, benchmarking, and rating need to be improved [13]. There are several frameworks to address this challenge such as the Sustainability Accounting Standards Board (SASB), the Global Reporting Initiative (GRI), the EU Taxonomy, the Carbon Disclosure Project (CDP), and the GHG Protocol, but each of them has a specific focus, which does not cover all topics and industries, creating different parameters. Among them, SASB best aligns with the materiality concept and stakeholders’ expectation from sustainable businesses [14].
The main motivation of this work is the urgent factor of sustainable businesses mitigating global ESG problems such as climate change, social inequality, and governance issues. Since it is essentially recognized that the SC is an important part of any AC, a big effort is required to evaluate their suppliers’ ESG footprint. Moreover, there is very little knowledge on how AC sustainability is affected by their SC performance, which motivates novel efforts in this direction.
In this regard, this work proposes a novel strategy to evaluate ESG footprint, incorporating SC in the AC analysis, which expands the scope of ESG assessment, covering a relevant and underexplored area with the potential to make a meaningful contribution to the literature on supply chain impact on company sustainability performance. This strategy has big potential repercussions for the production sector that demands a fast, direct, and low cost ESG evaluation approach. This study develops a standardized and adaptable model with practical applications that can be used as a guide for companies in their sustainability strategy, achieving great potential results with innovation. The lack of related literature endorses the importance of the proposed methodology.
The proposed score is essentially based on the international taxonomy (SASB—Sustainability Accounting Standards Board). In addition, it employs classical measurements such as the Human Development Index (HDI) and the Governance Transparency Index (GTI) in order to incorporate all nuances of ESG aspects. The methodology defines an ESG score to the AC, to their SC, and an aggregated value, resulting in a consolidated index that is able to capture the ESG footprint; it is useful as a quantitative index for policymakers, helping the ESG performance evaluation. As a proof of concept, a scenario analysis is discussed showing the real impact of the SC score in an AC score, showing all the benefits and potential risks for both suppliers and the focal corporation. Although it is a general approach, Brazilian cases are of concern to define indexes. Results show that neglecting the SC can dramatically alter the analysis of ESG footprint, establishing the need for a proper evaluation and the capacity of the proposed procedure to incorporate the SC in the analysis.
After this introduction, Section 2 presents the ESG score methodology, showing all the steps needed for its definition. Afterward, Section 3 and Section 4 present the application of the ESG for different qualitative scenarios, providing an analysis that is useful for a global comprehension of the proposed methodology. Concluding remarks are discussed at the end. Supplementary Materials are presented to show details of the information about the proposed methodology.
2. Methodology
The main objective of this work is to develop a weighted ESG evaluation model for companies to receive a quantitative score of their operations and their supply chain footprint. The ESG score is defined for the evaluation of the AC, replicated in the entire SC to provide a consolidated score. The evaluation on the Sustainability Accounting Standards Board (SASB) methodology is based on materiality [15,16,17]. In addition, it incorporates classical measurements for the social aspects, including the Human Development Index (HDI), and governance, such as the Governance Transparency Index (GTI). On this basis, it becomes a representative of all ESG aspects.
Concerning the Sustainability Accounting Standards Board (SASB), ref. [18] stated that materiality can better inform decisions since it affects the value of ESG scores, performance, and rankings. In addition, SASB offers the best path to the materiality concept that aligns with society’s demand for sustainable businesses and activities [14]. The weights based on SASB materiality need to have a score for each of the disclosure topics specified, see Table S2 in Supplementary Materials. The score for each of the topics can be calculated based on the methodologies discussed in [19,20,21]. Another possibility could be the usage of questionnaires; Table S3 in Supplementary Materials presents an example of a questionnaire and a score output for the environment part. In addition, the company might decide on the method that best suits their business.
Ref. [19] discussed the ESG ratings based on the EU Taxonomy using related firm data in tobit regressions. It was stated that a logic of obtaining an ESG rating could be used to achieve the needed scores. Ref. [20] proposed an indicator grid that specifically monitors and measures the sustainable impacts of the manufacturing companies’ operations, allowing them to rank and compare their performances; they made a systematic review of the literature and professional standards to define the material aspects to be evaluated. Moreover, ref. [21] employed a random forest algorithm to investigate how structural data affect the ESG scores for companies. As a result, they found that the balance sheet is a crucial element to the ESG scores. These strategies and methods are examples of how to obtain the score for each topic that is needed to apply the developed formulas to obtain the final ESG scores for the companies and SC. Participating companies must complete this step before using the model and potentially create a database with this information to facilitate further steps.
The evaluation methods employ specific grids for each sector. The analysis model must be replicated in the entire SC to provide an ESG score. Moreover, it also presents a formula to define the weightage to be able to completely assess the entire SC. This is a novel strategy with big potential repercussions for the production sector that demands a fast, direct, and low cost ESG evaluation system.
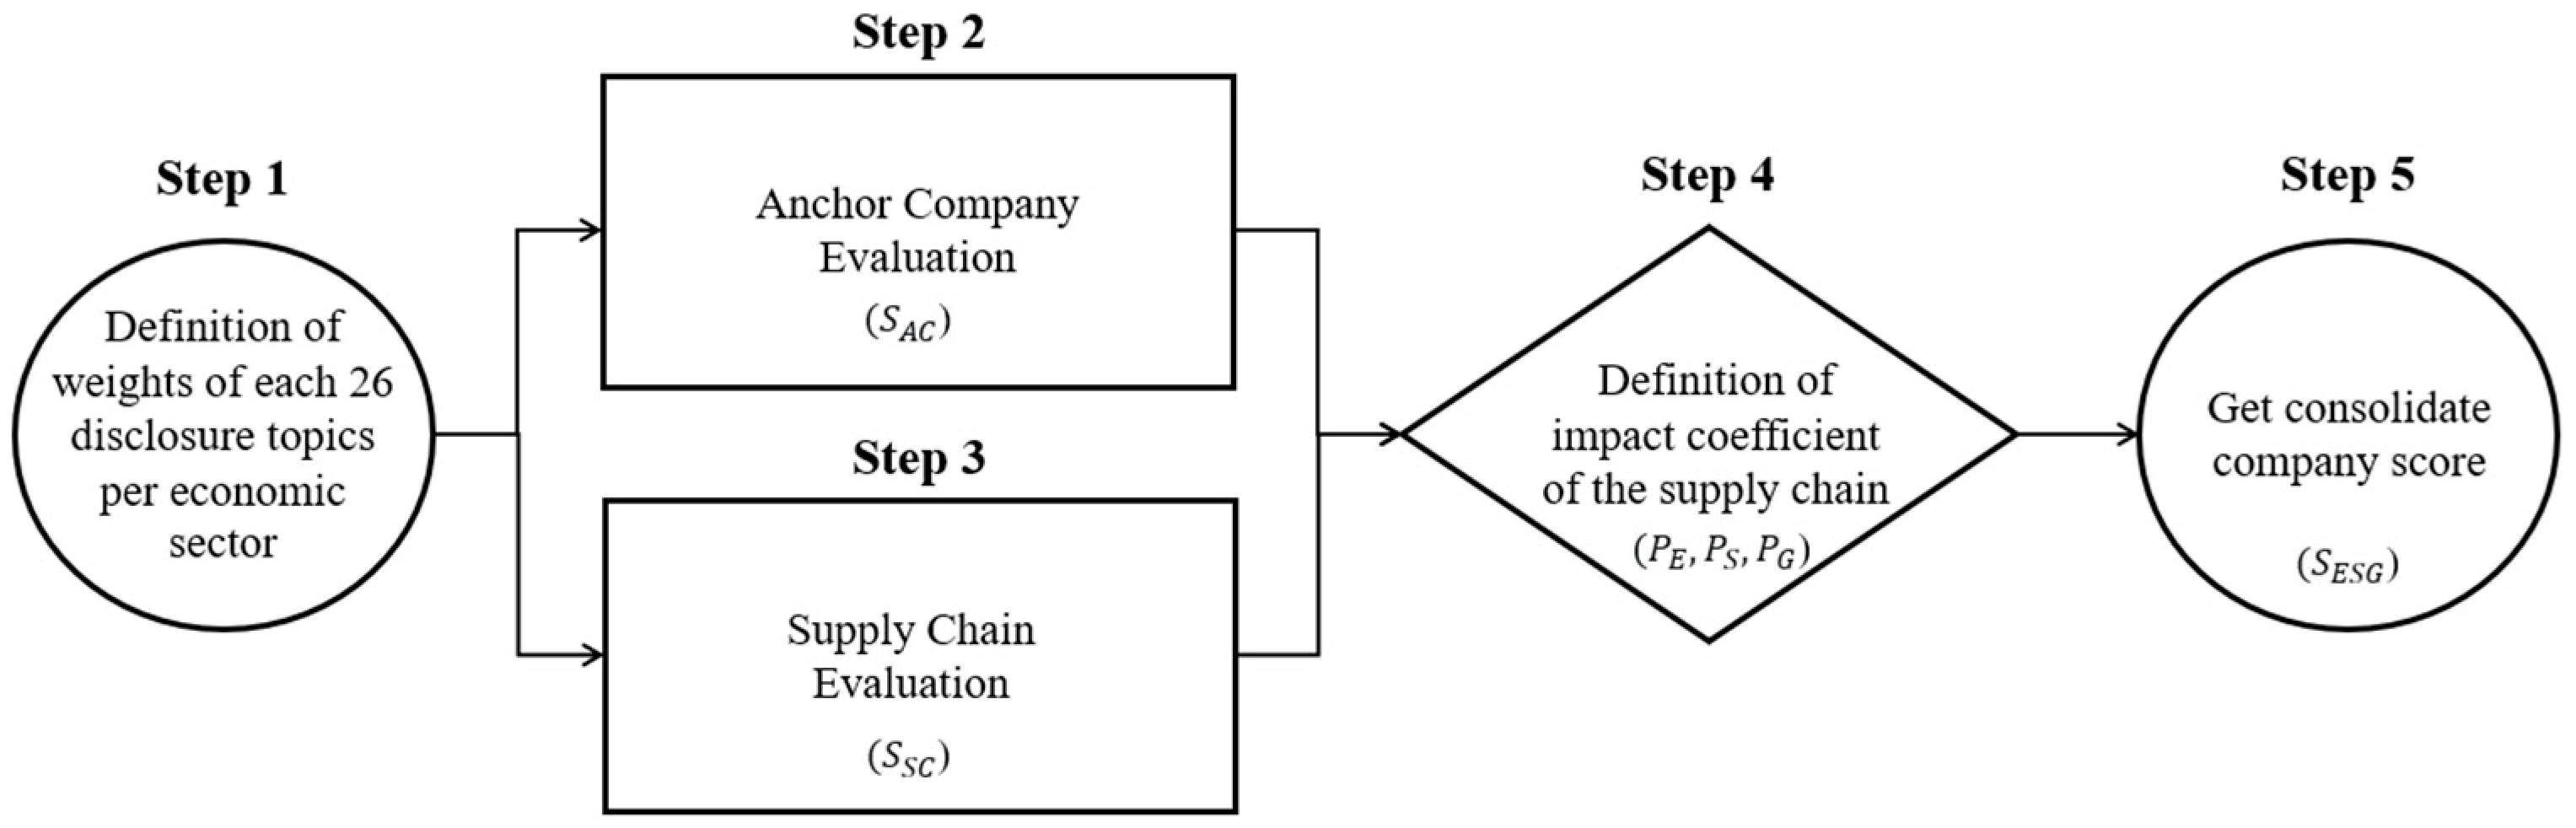
SASB has defined 11 economic sector groups that are divided into 77 subsectors, shown in Table S1 in Supplementary Materials, defining the relevant issues for them. There are 26 disclosure topics that are divided into 5 groups, shown in Table S2 in Supplementary Materials. For every subsector, the relevant issues that are among the 26 options were established. This work is going to use the 11 economics sectors, which would be defined as a weight methodology to calculate the ESG score based on the industry materiality aspects by counting the topics that are important for the subsectors inside the big sectors. Some limitations might apply, since 11 economic sectors have a macro level view of the industries; for example, the transportation sector considers both passengers and freight. The flow to represent the methodology and how to obtain the result are shown in Figure 1.

Figure 1.
Methodology workflow.
2.1. Company Evaluation
After going through an ESG assessment of all topics to obtain the individual score for each topic, the first step for a company evaluation is to define the weights of each of the 26 disclosure topics per economic sector based on SASB. The five groups are combined into three groups: environmental (E), social (S), or governance (G). ‘E’ represents the first group called ‘environment’; ‘S’ combines the second and third groups called ‘Social Capital’ and ‘Human Capital’, and ‘G’ combines the fourth and fifth groups called ‘business model & innovation’ and ‘leadership and governance’.
The companies’ score is expressed considering environmental (), social (), and governance (), which has been developed to cover all sectors with their particularities by keeping the same parameters for all types of businesses, allowing for comparisons and benchmarking:
where is the weight of each material topic, defined by the occurrence of each of them as shown in Table 1 for typical cases for different kinds of industry; is the score evaluated for each material topic. Table 1 also shows the industries and the defined weight for each disclosure topic and their groups. Each line represents one industry that encompasses a few subsectors. Each column represents a disclosure topic with the weight of it for each of the industries. The weight is calculated based on the relevance of the topics for each subsector. In case it is relevant for more subsectors, the weight is higher for the entire industry. For example, the consumer goods industry encompasses 7 subsectors; the topic GE is not material to any of them, resulting in a weight of 1, and the EM topic is material to 3 of them, resulting in a weight of 4 on that specific topic. The same logic applies to all sectors and topics.

Table 1.
Weights for ESG calculation.
Based on the ESG scores, it is possible to establish weights to calculate the final company score that would be the anchor for any of the suppliers; it is calculated as follows:
where is the weight of the environmental, is the weight of the social, is the weight of governance, and is the total weight, where . Each one of these weights is defined from the material topics , as presented in Table 2 that shows the total weight for each group (environmental, social, and governance) per industry. It should be pointed out that it is calculated by adding all weights of the disclosure topics that are part of the group.
Table 2.
Weight for ESG aspects by industry.
2.2. Supply Chain
The analysis of the supply chain considers the evaluation of each company individually, weighted by the relevance in the supply chain. Similar to the company evaluation, the supply chain’s score is defined for environmental (), social (), and governance () as follows:
Based on the ESG score, each SC company has a consolidated score, , using an expression similar to Equation (2). Afterward, a single score for the supply chain is defined considering all companies together:
where is the relevance defined based on the contract with the anchor, divided into four categories: (i) critical, (ii) important, (iii) relevant, and (iv) basic. Each situation is related to the importance for the anchor company, defining a weight index. Table 3 presents an example of an index that can be employed for the analysis.
Table 3.
Relevance of the company for the SC of the AC based on its contract.
2.3. Consolidated Score
After the analysis of the anchor and the supply chain, a consolidated score is defined considering both the supply chain and the anchor company. This score defines an impact coefficient that is weighted based on environmental (, social (, and governance ( aspects.
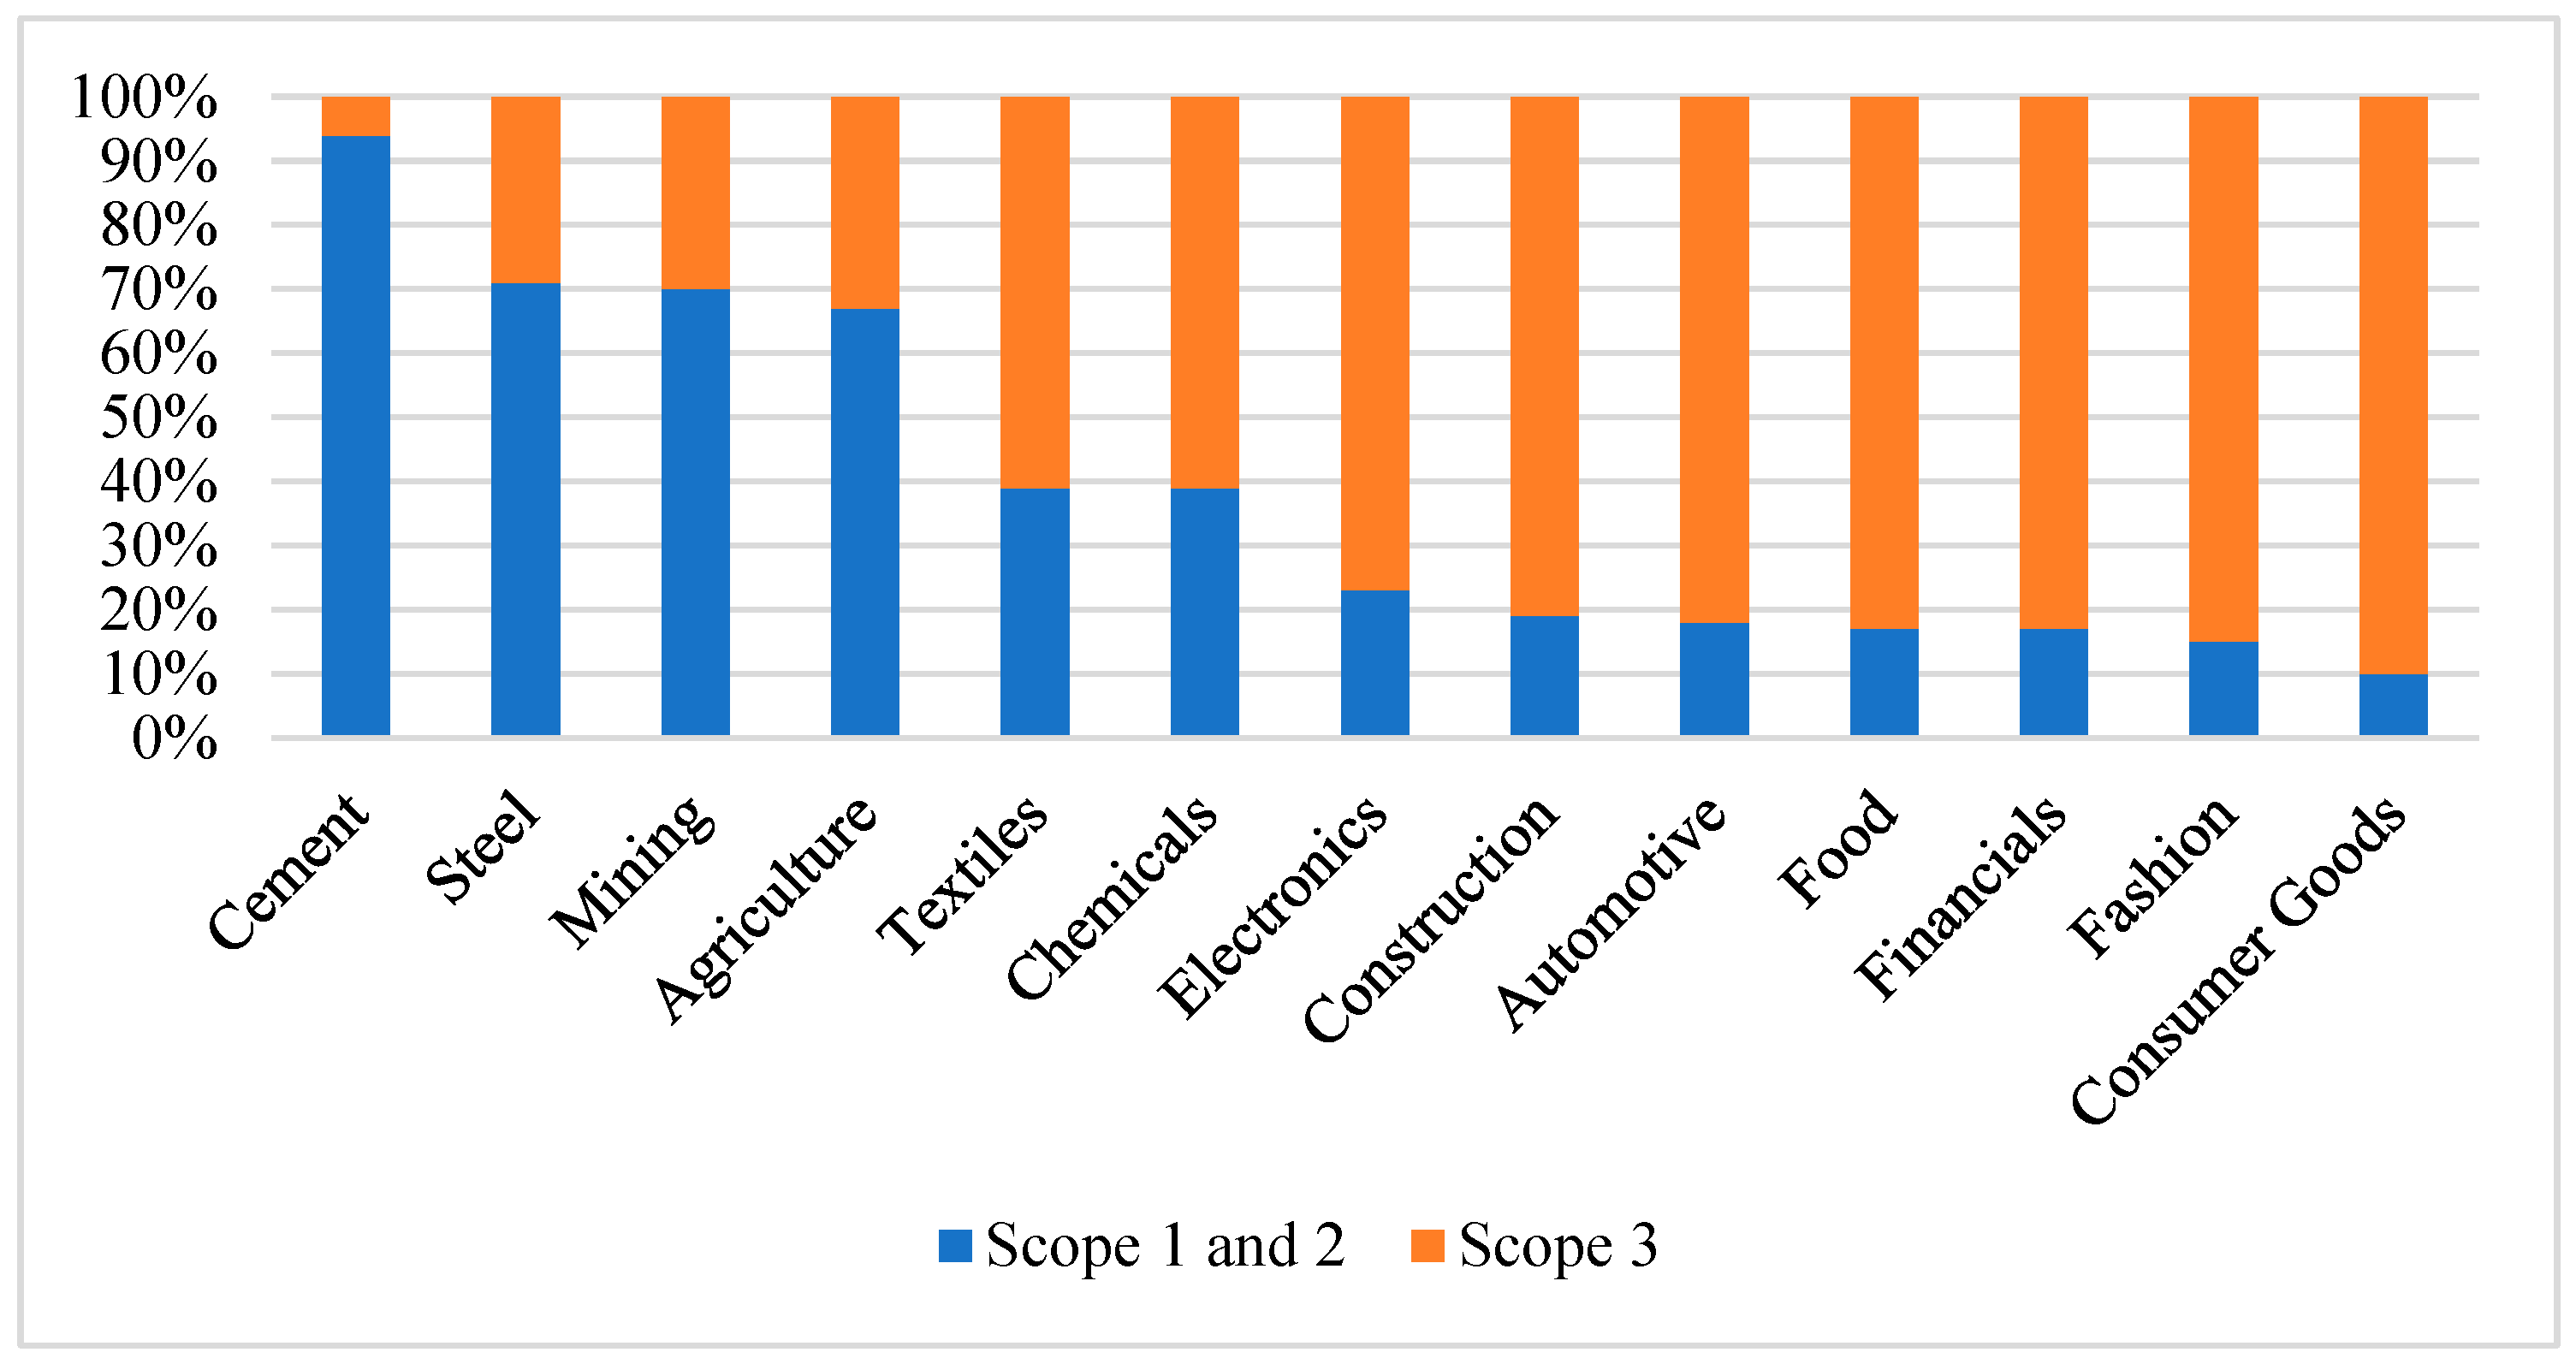
The environmental impact () is a proxy using the scope emissions. Companies and industries are big contributors to air pollution, and their GHG emissions are divided into three categories: scope 1, 2, and 3. Scope 1 considers emissions that occur directly at the facility or company in question; scope 2 considers the emissions associated with electricity consumption, and scope 3 encompasses the emissions associated with other inputs mainly in the SC [23]. Figure 2 shows the distribution of air emission through the three scopes [23,24]. It is noticeable that Scope 3 emissions (that occur in the SC) are the main source of a company’s total emission. These points highlight the importance of measuring, analyzing, reducing, managing, and controlling the SC ESG aspects. On this basis, it is fair to assume that the ESG footprint follows the same logic, showing that SC is responsible for a big portion of an enterprise’s footprint, thereby being essential for their success and decarbonization.
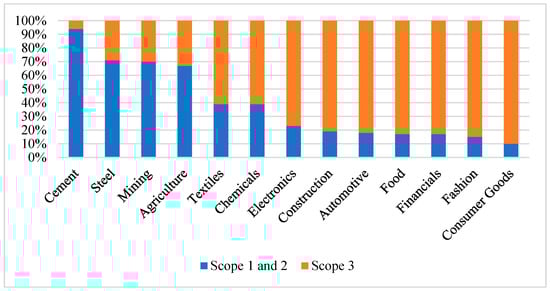
Figure 2.
Emission split in scopes 1, 2, and 3 for selected industries (CO2e, 2019). Source: adapted from [24].
On this basis, it is possible to assume that the percentage of emissions in scope 3 are going to be replicated in all environmental aspects. Therefore, the following impact coefficient is defined:
The social SC impact () is calculated based on the Human Development Index (HDI). According to [25], HDI is the widely adopted indicator for measuring sustainable development in socio-economy, emphasizing the improvement of human welfare. Therefore, the social SC impact () is expressed as follows [25]:
where is the HDI and the SC based on the location of the matrix/headquarter of the supplier and is the HDI of the anchor company based on the location of the matrix.
The governance SC impact () is calculated based on the Governance Transparency Index (GTI). Ref. [26] employed hierarchical linear models to show that strong Governance Transparency has a positive impact on a firm’s value, and the following impact coefficient is employed:
where is the GTI of the SC based on the location of the matrix of the supplier and is the GTI of the anchor company based on the location of the matrix.
Table 4 shows the HDI and GTI by Brazilian states in order to calculate both the social impact coefficient and the governance impact coefficient, which consider the location of the matrix. Similar indexes can be replicated to any country.
Table 4.
HDI and GTI by Brazilian states.
Once again, the supplier analysis needs to be weighed based on the relevance of each company. Moreover, since the SC has multiple suppliers, it is necessary to make an average of the HDI or the GTI based on each group and then use the same weights for them to achieve the (Equation (8)) or the (Equation (9)):
Finally, a consolidated company score () is defined using all definitions discussed:
A verification method of the quantitative model is developed by considering a scenario analysis. This objective of this analysis is to test the proposed approach using tangible scenarios, establishing a proof of concept for the validity, quality, and applicability of the model using different possibilities, illustrating the methodology with examples. By the end of the analysis, companies will have an ESG score, reflecting their footprint, and they will be able to fully understand, in a quantitative way, the real impact the SC has in their operations. The case scenarios will consider hypothetical companies based on real situations in different sectors by assessing a sample of their suppliers.
3. Anchor Company and Supply Chain Analyses
In order to stress, test, and simulate the procedure, different situations considering some companies based on real situations are analyzed. Companies’ sector and location come from a project that is being created for two anchor companies to assess and evaluate their suppliers with ESG criteria, with a service provider in the climate–tech sector. Real names are hidden; contract values are arbitrarily defined, and only the industry (sector) is shown. Two SCs are of concern, and for the sake of simplicity, a small sample of 10 suppliers for each SC is chosen to be a part of the analysis, and the scores for each topic are representative of the companies. The analysis of the two anchor companies (AC 1 and AC 2) and the two supply chains (SC 1 and SC 2) is presented in the following section.
3.1. Anchor Company 1—Infrastructure Sector
Anchor company 1 (AC 1) is related to the infrastructure sector. To define the weights of each of the 26 disclosure topics of the infrastructure sector, it is necessary to observe Table S1 in Supplementary Materials and find the sector there. Table 5 contains the highlighted part of Table S1 that refers to the infrastructure sector, which is the base of the ESG score of the company, and the score that AC 1 achieved on each aspect on a ratio between 0 and 10 in this case scenario. The scores are arbitrary, simulating the company’s score by testing different scenarios.
Table 5.
Infrastructure disclosure topic weights.
After inputting the data in Table 5 into the model, the result of the AC 1 ESG evaluation is presented in Figure 3, divided into three groups: E for environmental, S for social, and G for governance. The blue bar (α) represents the score for each aspect of the E, S, or G, showing that The light blue bar represents the weight of each aspect, where WE = 19, WS = 20, and WG = 27. Finally, the dark blue line shows the final ESG score of AC 1 that comes from the interaction with all the elements, where = 9.4.
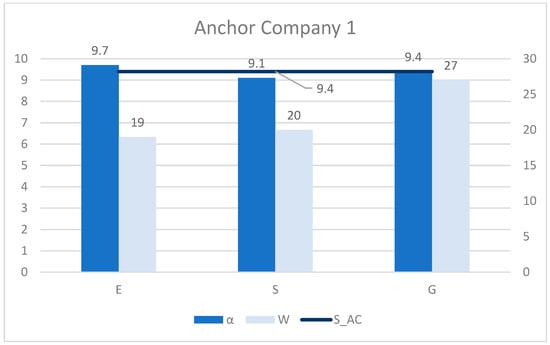
Figure 3.
Anchor company 1 ESG evaluation results.
Note that AC 1 received the lowest score (1) on the topics HR and CB, and it does not have a big impact on the final ESG score because the scores have low weights. In a different scenario, if the weak points were on EH and BM, the ESG score would be more significantly impacted. In the AC 1 case, if the score is switched from HR to EH and from CB to BM, the results would be = 9.7, = 7.3, and = 7.7. This proves the point of the model that gives more importance to the material aspects.
3.2. Anchor Company 2—Financial Sector
Anchor company 2 (AC 2) is related to the financial sector. The flow of anchor company 2 is going to be the same as anchor company 1 but considers the specificities of this sector and their weights. Table 6 is the highlighted part of Table S1 in Supplementary Materials that refers to the financial sector, which is the base of the formula to calculate the ESG score of the company, and the score that AC 2 obtains on each aspect on a ratio between 0 and 10 in this case scenario. Once again, the scores are arbitrary.
Table 6.
Financial disclosure topic weights.
After inputting the data in Table 6 into the model, the result of the AC 2 ESG evaluation is represented in Figure 4. The blue bar (α) represents the score for each aspect of the E, S, or G: The light blue bar represents the weight of each aspect, where WE = 6, WS = 20, and WG = 25. Finally, the dark blue line shows the final ESG score of AC 1 which comes from the interaction with all the elements, where = 2.7.
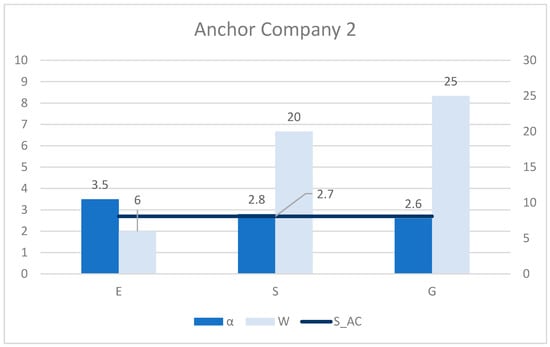
Figure 4.
Anchor company 2 ESG evaluation results.
Note that AC 2 received a high score on WW (9), CB (10), AA (7), and HR (6) since these are aspects that have a low weight; the score is not impacted by much. If the high score was on PD, BE, SP, and SR, the score would be significantly affected by a higher score. By switching the scores of CB for PD, WW for BE, AA for SP, and HR for SR, the scores would be = 2.5, = 3.1, and = 6.2, which would be a dramatic increase in the final ESG score, proving that the material topics are worth more and can really have an impact on the score.
3.3. Supply Chain 1
Supply chain 1 (SC 1) is summarized in Table 7. It represents a typical SC based on an infrastructure company from São Paulo, showing a sample of 10 suppliers with industry, location, and contract size.
Table 7.
Supply chain 1.
After inputting Table 7 into the model defined suppliers’ importance, it is divided into priority groups, and the HDI and GTI based on the matrix location are calculated. Moreover, each individual supplier was evaluated to obtain the ESG score of their operations using the same methodology applied to the AC. Table 8 identifies suppliers’ priority groups, HDI, GTI, and ESG scores for each individual supplier.
Table 8.
Supply chain 1’s HDI, GTI, importance, and ESG scores.
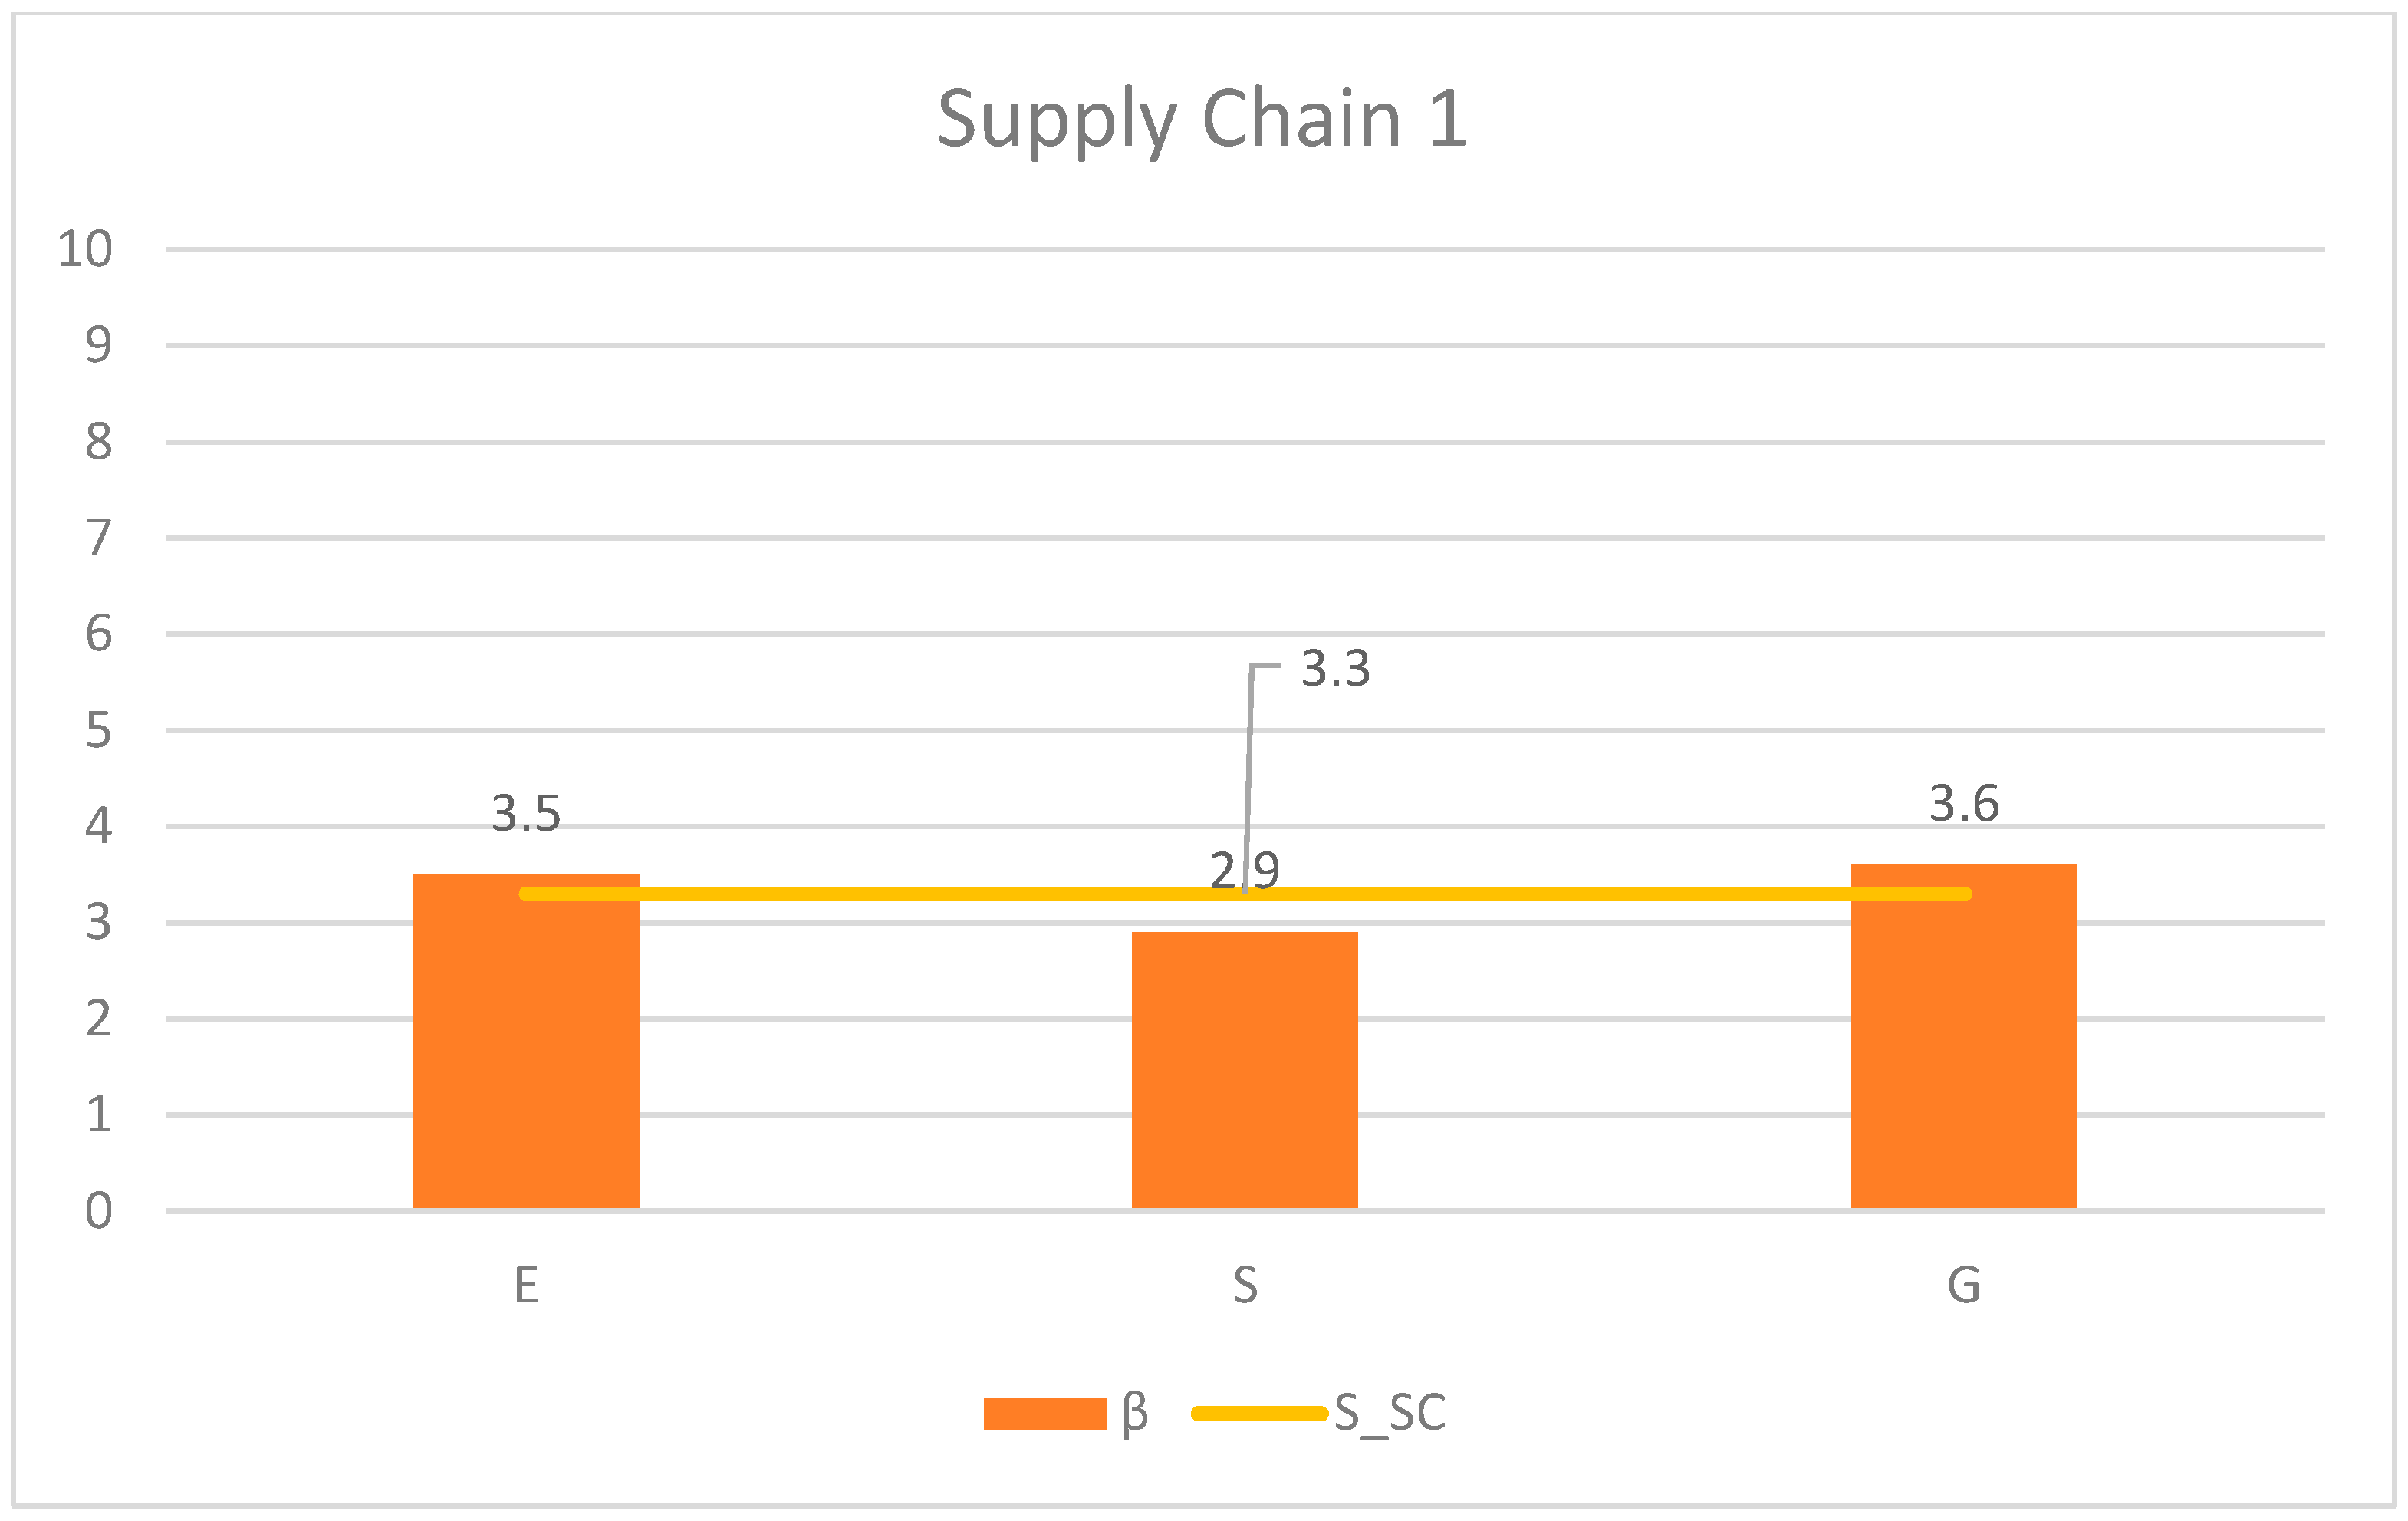
Based on the information, the result of the SC 1 ESG evaluation is shown in Figure 5. The figure is divided into three groups which are E for environmental, S for social, and G for the governance. The orange bar (β) represents the score for each aspect of the E, S, or G. It shows that The yellow line shows the final ESG score of SC 1, which comes from all the elements inputted, where = 9.4.
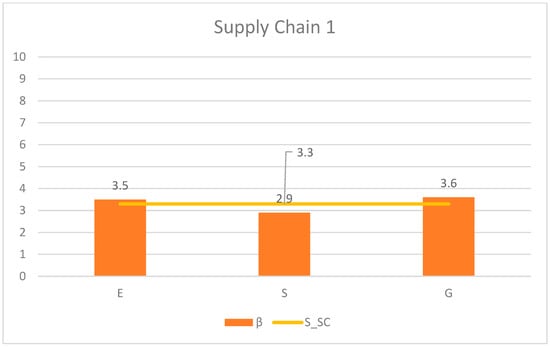
Figure 5.
Supply Chain 1 ESG evaluation results.
In addition, even though suppliers K, L, and M have high ESG scores, they do not have a big impact on the scores of the SC because they are on the lowest priority group (BS). Nevertheless, by inverting the order of the contracts (the last would become the first and so on), the scores would be = 6.1, = 6.1, = 6.2, and = 6.2. This shows the point that the high-priority groups have a significant impact on the score.
3.4. Supply Chain 2
Supply chain (SC 2) is characterized in Table 9 based on a financial company from Rio de Janeiro, with a sample of 10 suppliers with industry, location, and contract size. All suppliers are from tier 1, as they are direct suppliers.
Table 9.
Supply Chain 2.
The process and steps of SC 2 are going to be the same as ‘Supply Chain 1’. After inputting Table 9, the model defined suppliers’ importance, divided them into priority groups, and calculated the HDI and GTI based on the matrix location. Moreover, each individual supplier would be evaluated to obtain the ESG score of their operations using the same methodology applied to the AC. Table 10 identifies suppliers’ priority groups, HDI, GTI, and ESG scores for each individual supplier.
Table 10.
Supply Chain 2’s HDI, GTI, and importance.
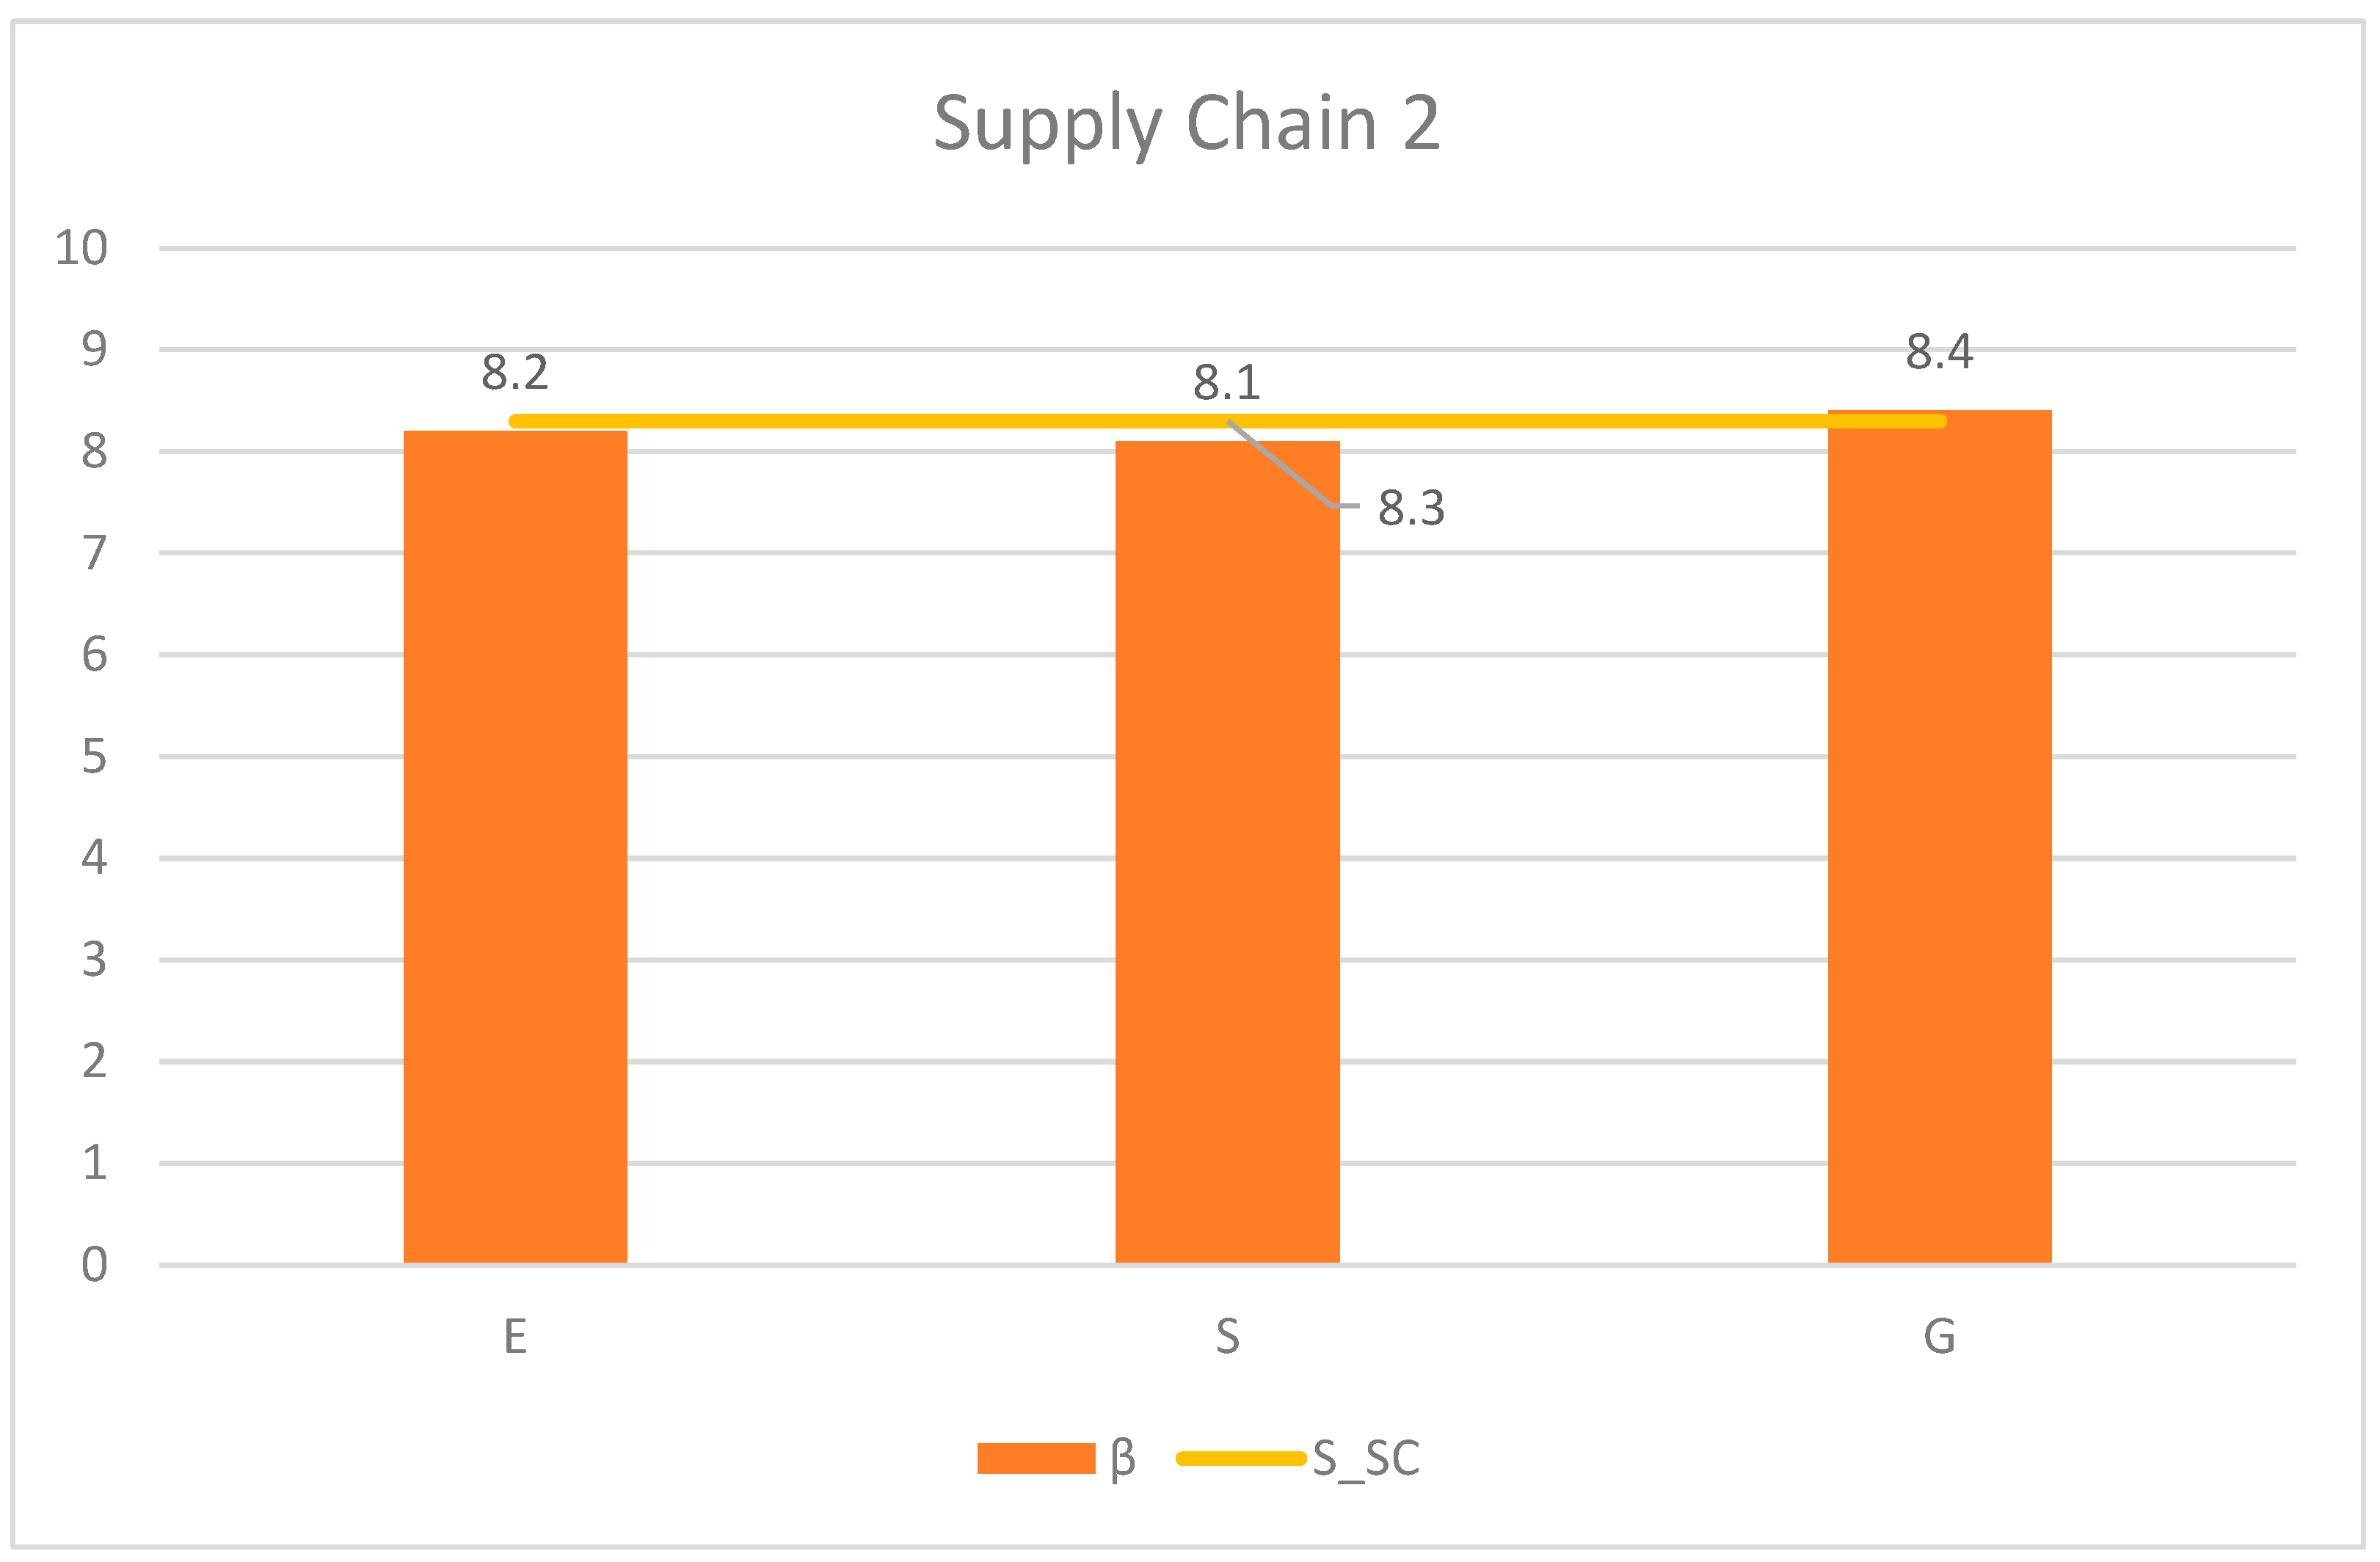
Based on the information, the result of the SC 2 ESG evaluation is presented in Figure 6, divided into three groups. The orange bar (β) represents the score for each aspect of the E, S, or G. It shows that The yellow line shows the final ESG score of SC 2 which comes from all the elements inputted, where = 8.3.
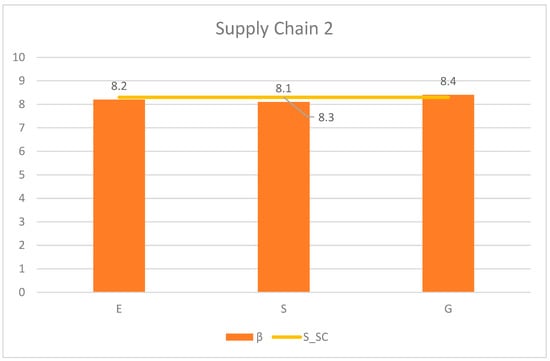
Figure 6.
Supply Chain 2 ESG evaluation results.
In addition, even though suppliers U, V, and W have low ESG scores, they do not have a big impact on the scores of the SC because they are on the lowest priority group (BS). However, if the order of the contracts is inverted (the last on would become the first and so on), the scores would be = 5.3, = 5.0, = 5.4, and = 5.3. This proves the point that the high-priority groups have a significant impact on the score.
4. Scenario Analysis
Different scenarios are analyzed to simulate typical situations, defining the impact of the SC score in the company. Although the model can be replicated in different geographies, it considers Brazilian indexes in the analysis. The main goal is to identify the applicability and adaptability of the model by addressing AC and SC with different ESG maturity levels, different sectorial activities, and combining different possibilities. The expected outcome is to develop a significant ESG evaluation methodology based on industry materiality to guide non-governmental organizations (NGOs), companies, enterprises, and industry, as well as others that may want to assess ESG. Moreover, it would be extended to the entire SC, since it is responsible for a relevant part of the ESG footprint. A comparative analysis allows one to quantify the impact of the SC in the definition of the ESG footprint, showcasing the model’s capability to capture this issue.
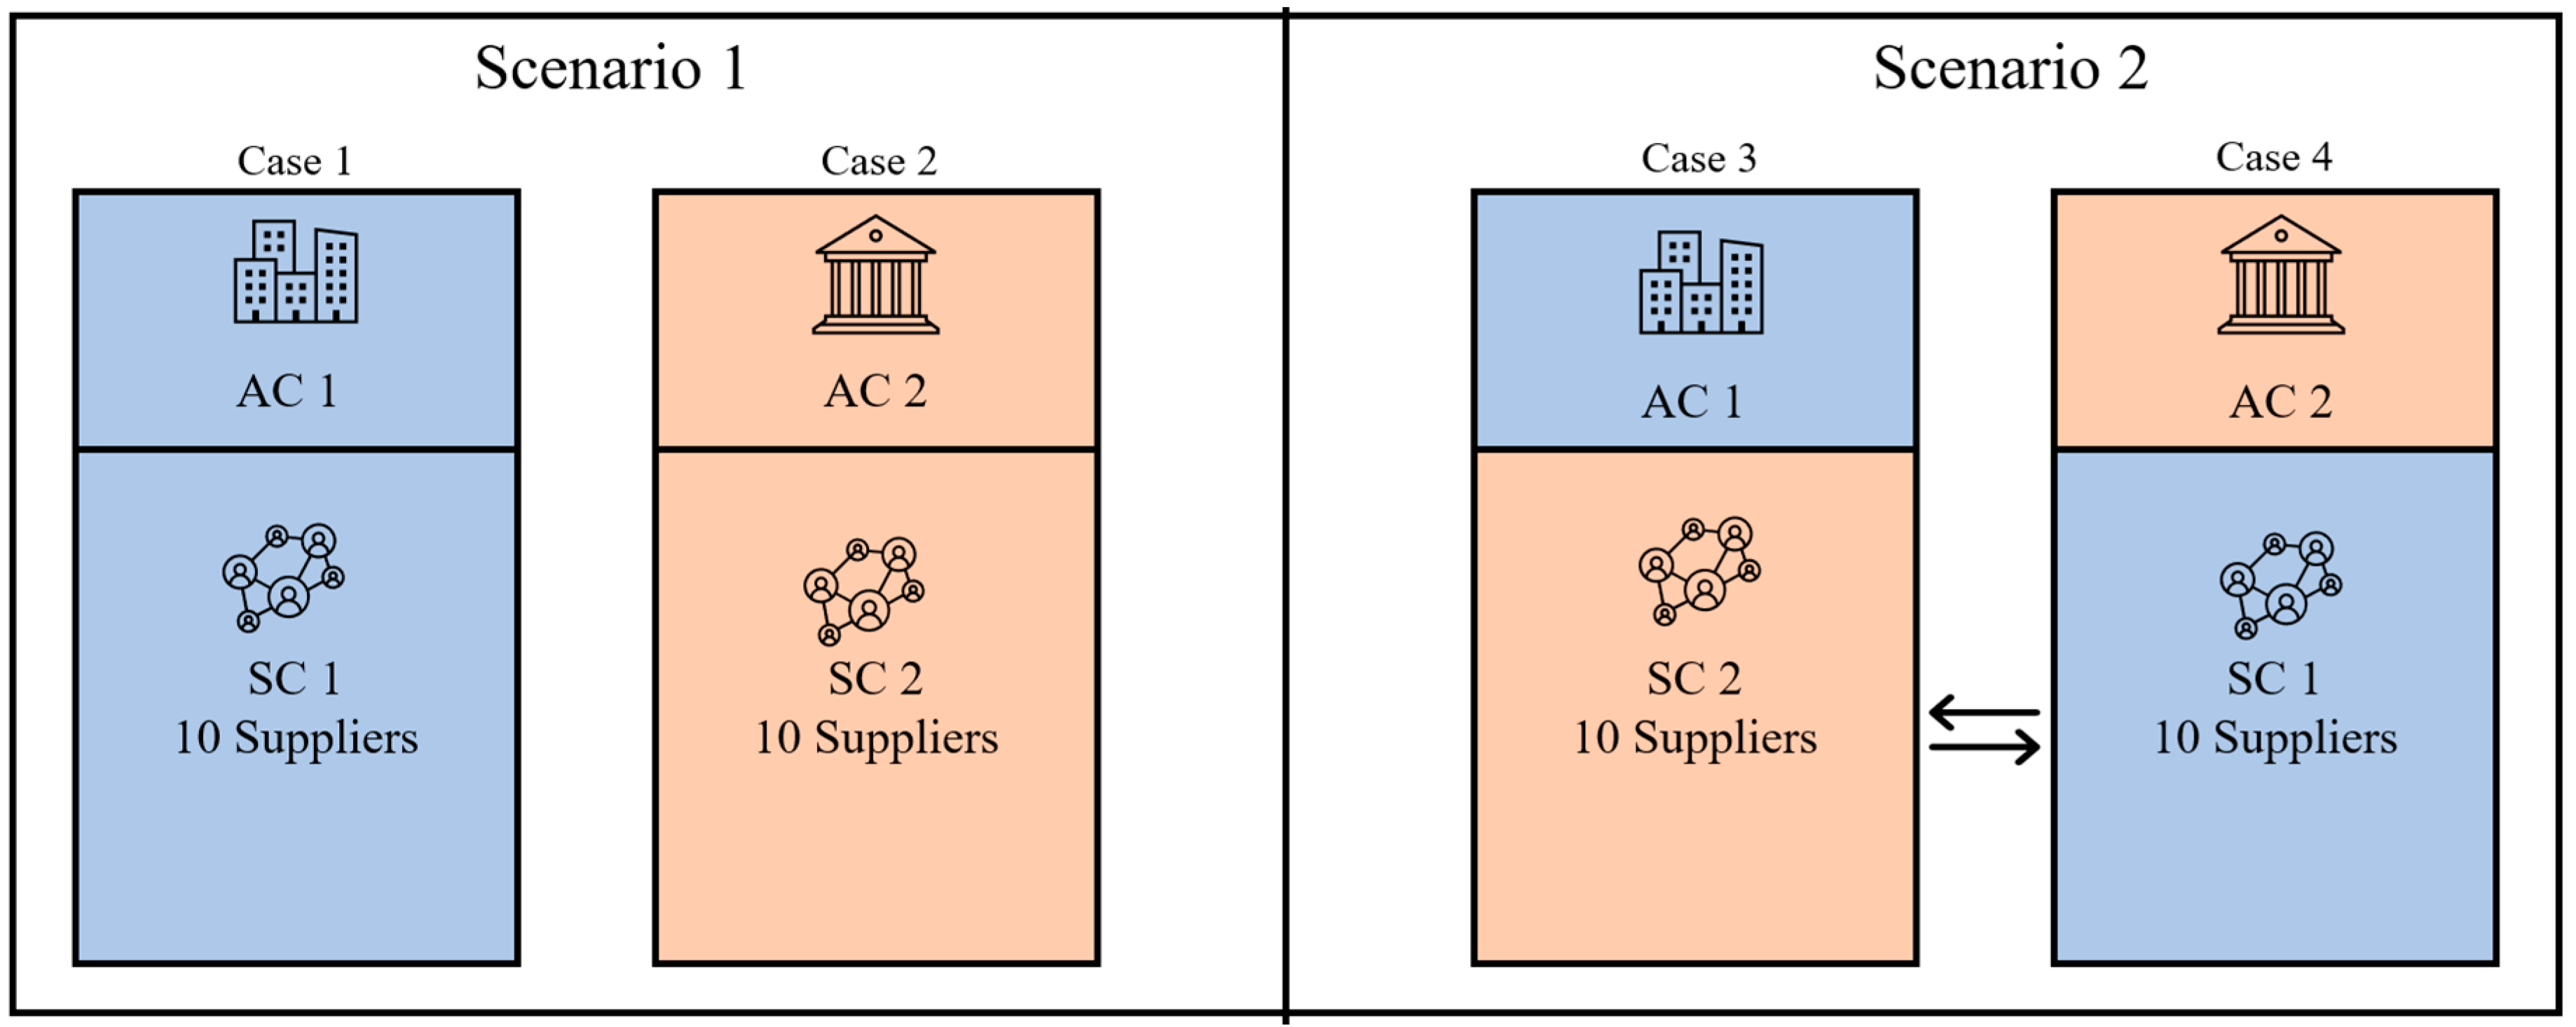
Two different scenarios are analyzed by changing the owner of the SC. As illustrate in Figure 7, the first scenario analyzed AC 1 with SC 1 and AC 2 with SC 2, and the second scenario analyzed AC 1 with SC 2 and AC 2 with SC 1. The colors facilitate the visualization and the understanding of the proposal. Moreover, even though the ACs are the same in both scenarios, the objective of switching the SC sample is to test the interaction and the different impacts from different ESG maturity levels in the same company.
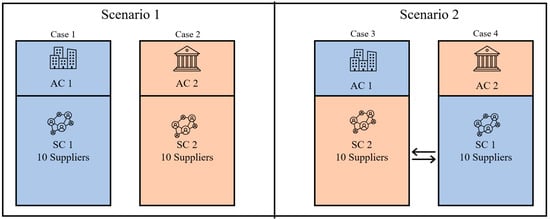
Figure 7.
Scenario analysis.
4.1. Scenario One—Case One
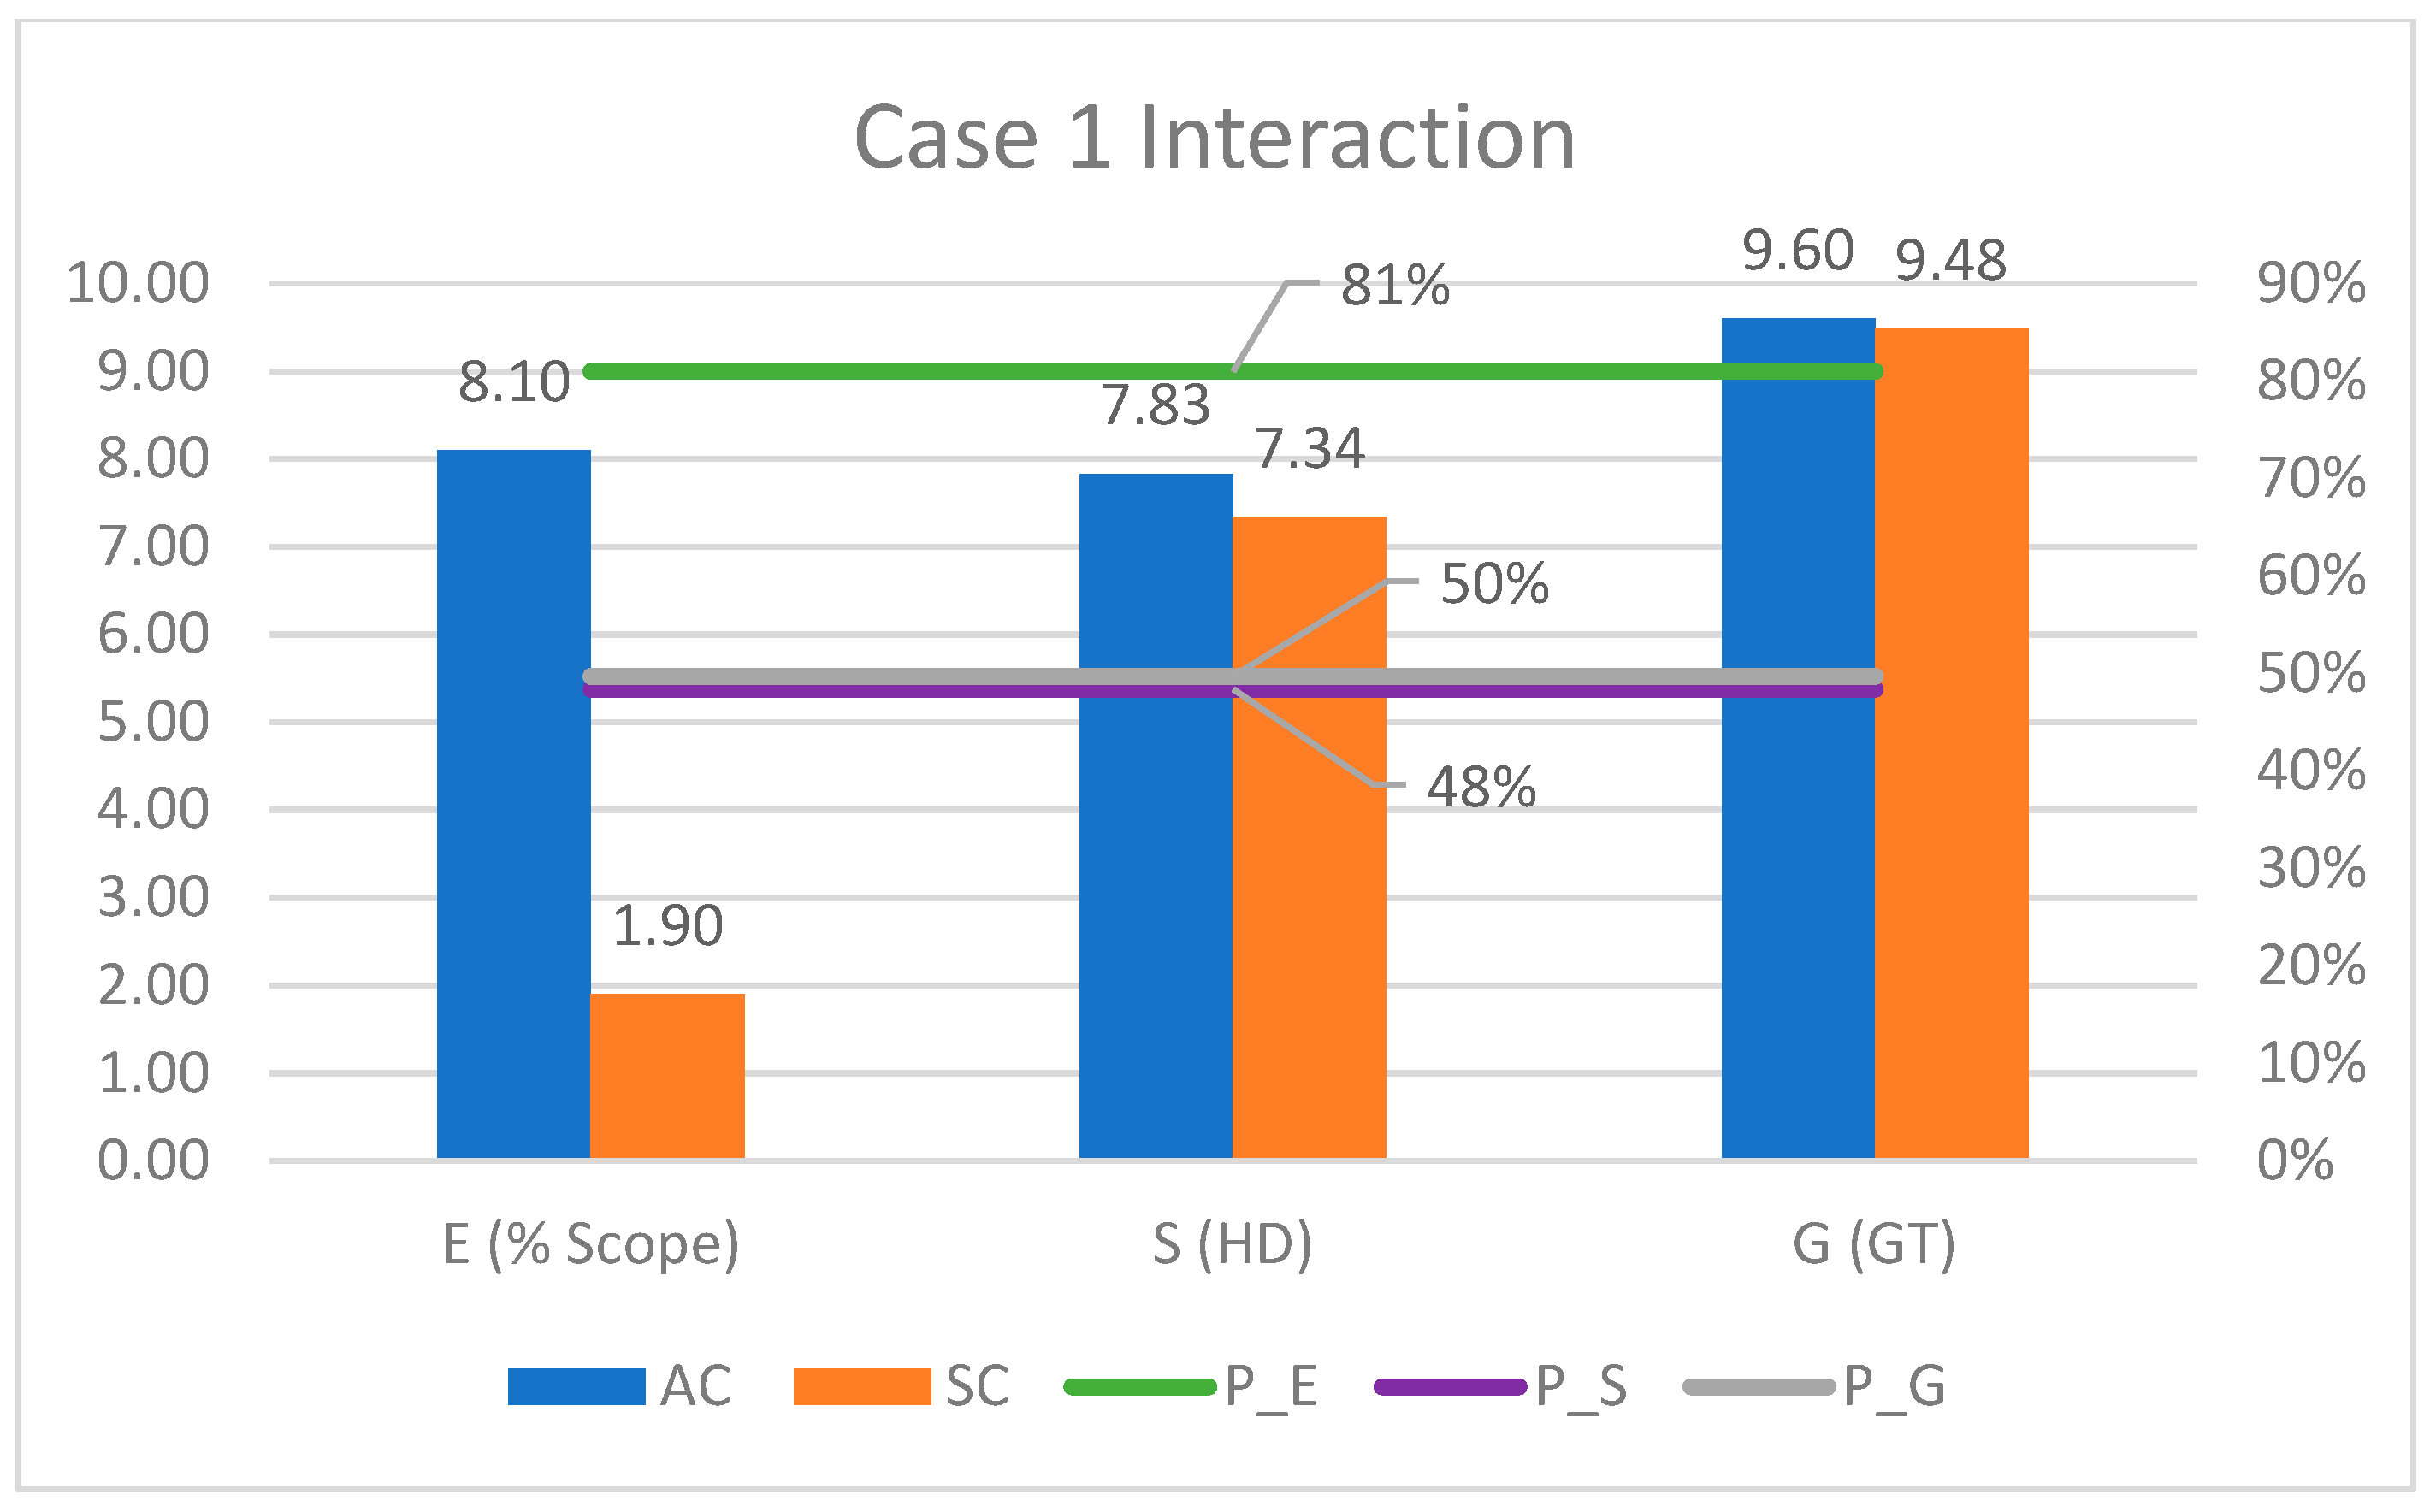
Case one represents the interaction of AC 1 and SC 1. First, it is required to calculate the impact coefficient of the SC in the AC, and it is going to have a different value for each area: environment, social, and governance. The input of data from AC 1 and SC 1 on the model generates result illustrated in Figure 8 that is divided into three groups, showing the impact coefficient for environmental (% scope emissions based on Figure 2), social (HD), and governance (GT). The blue bars represent the data from the AC for each topic (% scope 3 = 8.10; = 7.83; = 9.60), and the orange bars represent the data from each topic (% scope 1+2 = 1.90; = 7.34; = 9.48). Based on this interaction, the impact coefficient is represented on the lines: the green line represents the environmental ( = 81%), the purple line represents the social ( = 48%), and the gray line represents the governance ( = 50%).
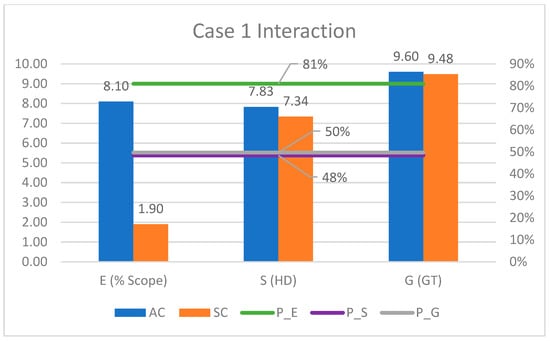
Figure 8.
Case one interaction—ESG impact coefficient.
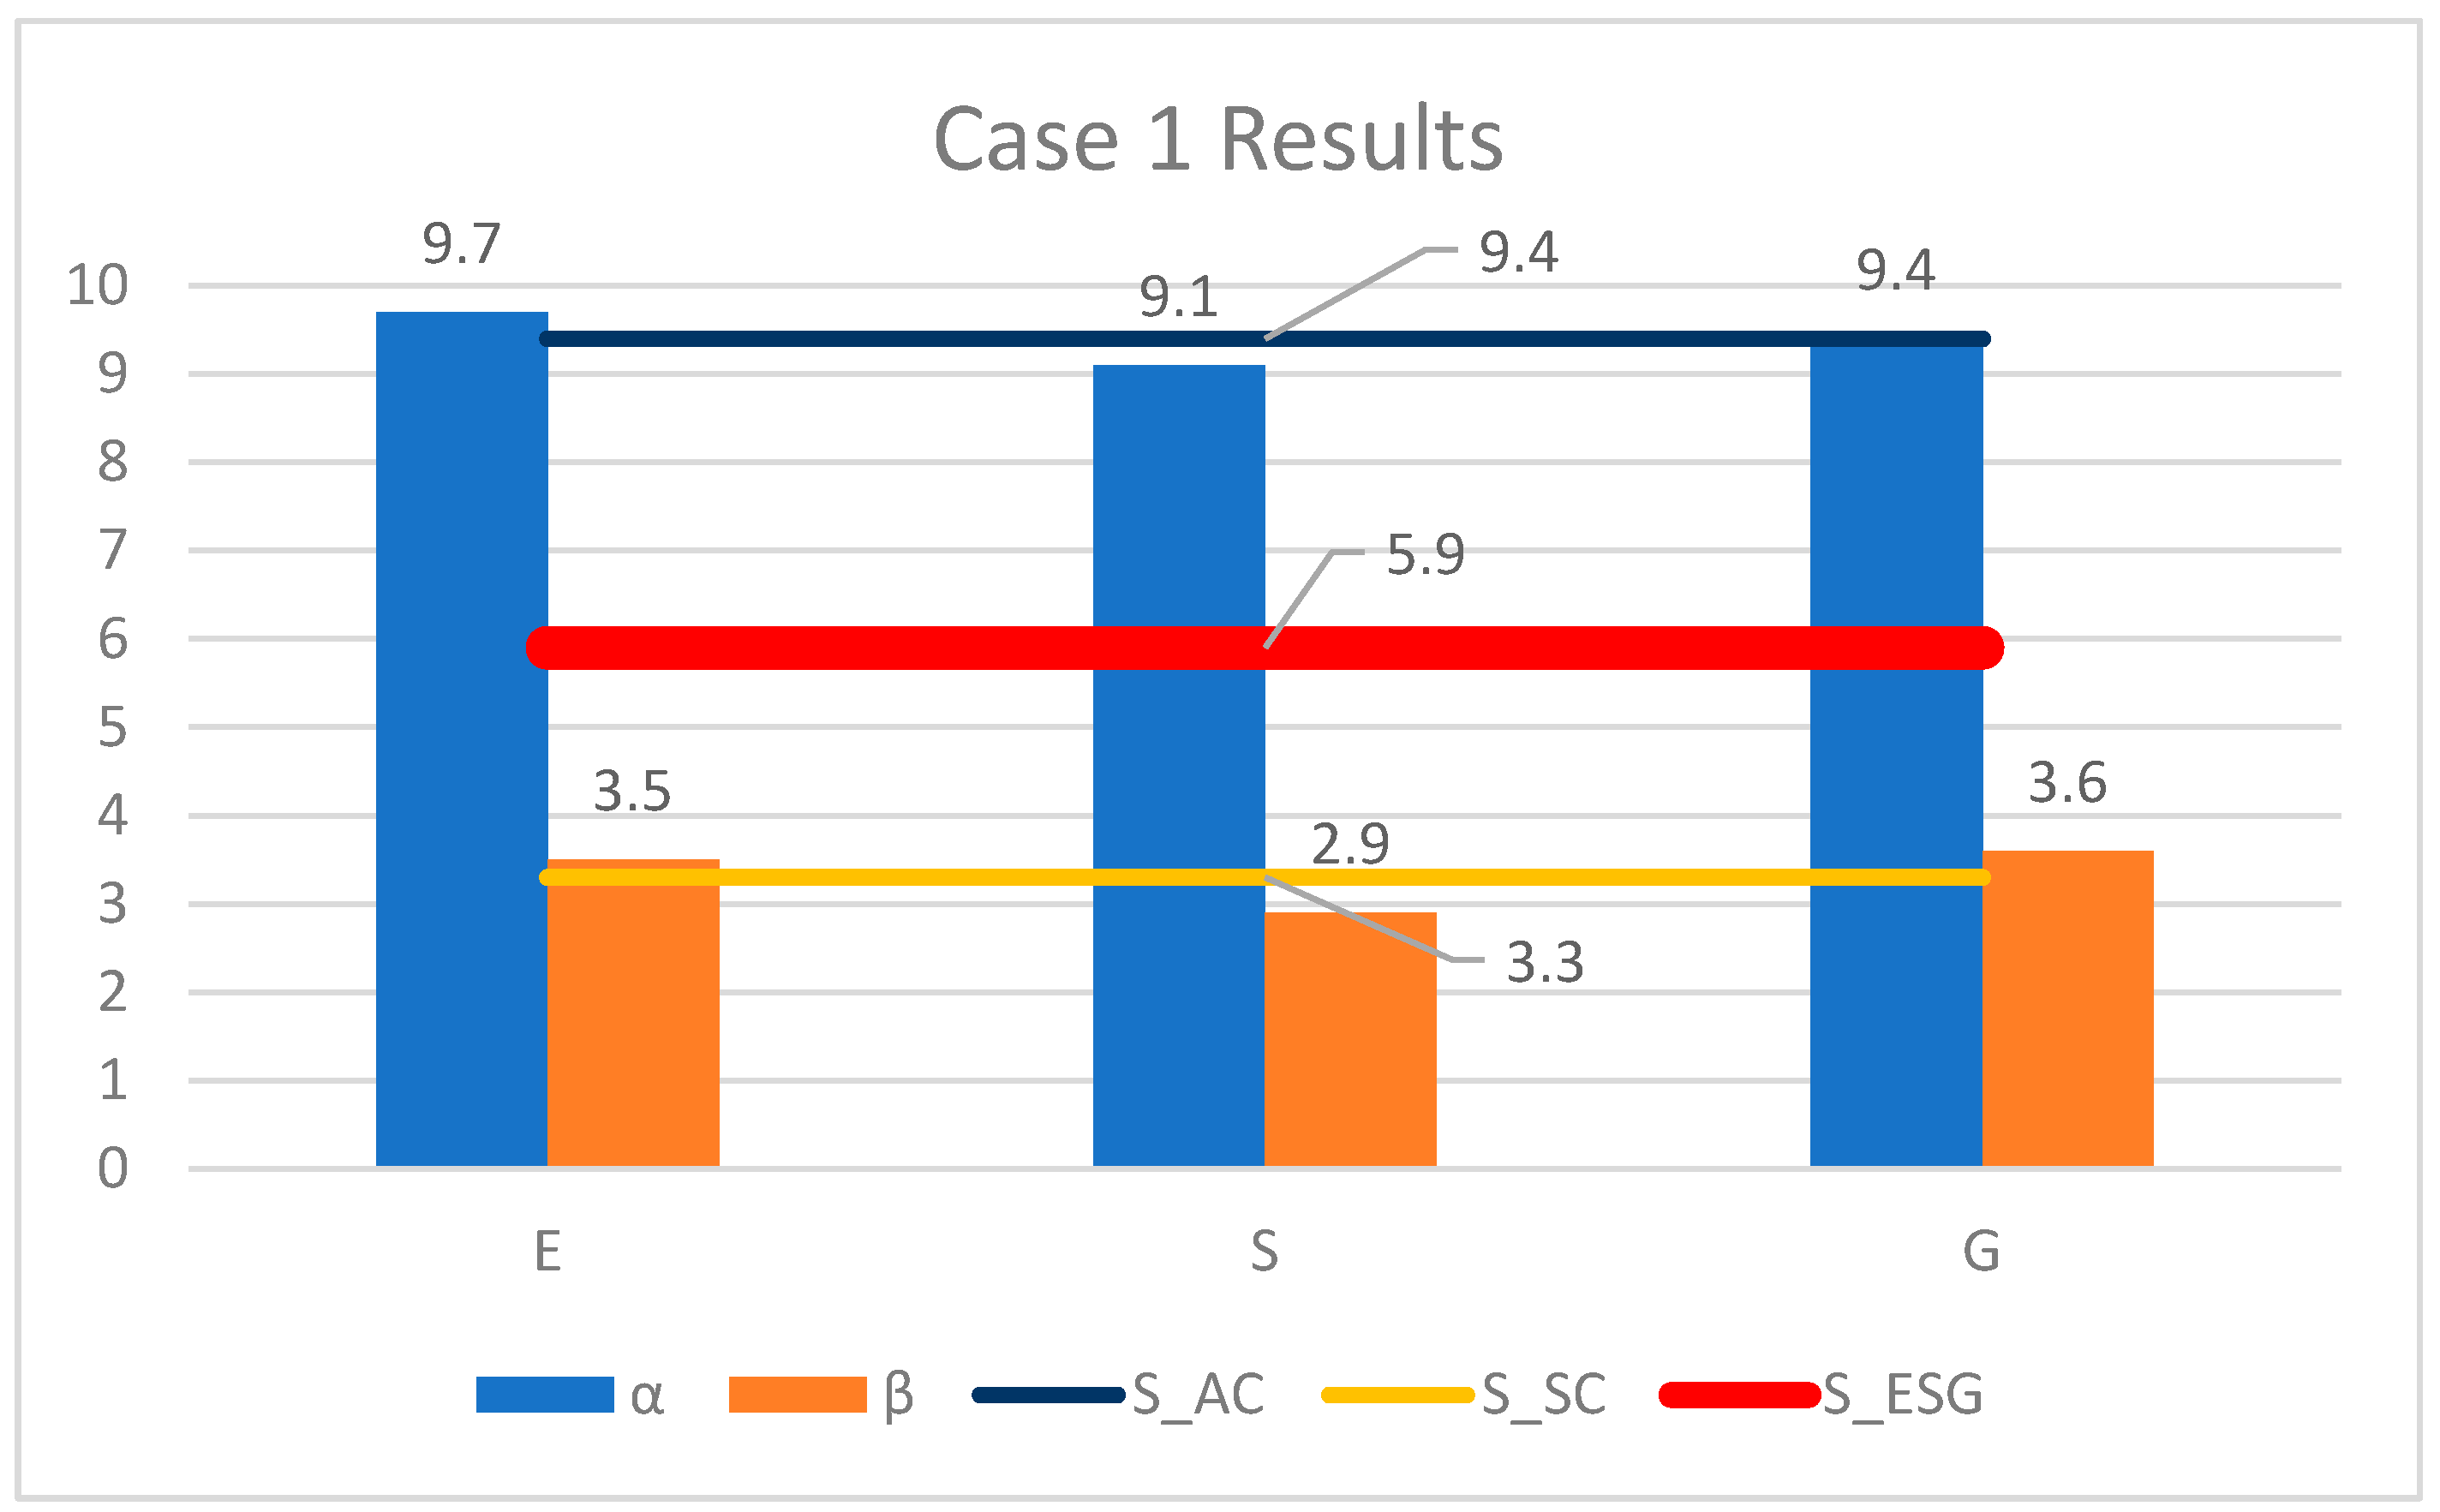
The consolidated ESG score for the relationship between AC 1 and SC 1 is now in focus, allowing for the understand of the real impact of the SC score in the AC score. Figure 9 shows this result, divided into ESG categories. Blue bars (α) represent the AC 1 score for each category ( = 9.7; = 9.1; = 9.4). Orange bars (β) represent the SC 1 score for each category ( = 3.5; = 2.9; = 3.6). The dark blue line represents the final ESG score of AC 1 ( = 9.4). The yellow line represents the final ESG score of SC 1 ( = 3.3). The red line shows the consolidated ESG score of the AC, considering the SC ( = 5.9) based on the interaction of these scores and considering the impact coefficient data on Figure 8.

Figure 9.
Case one results—ESG scores.
4.2. Scenario One—Case Two
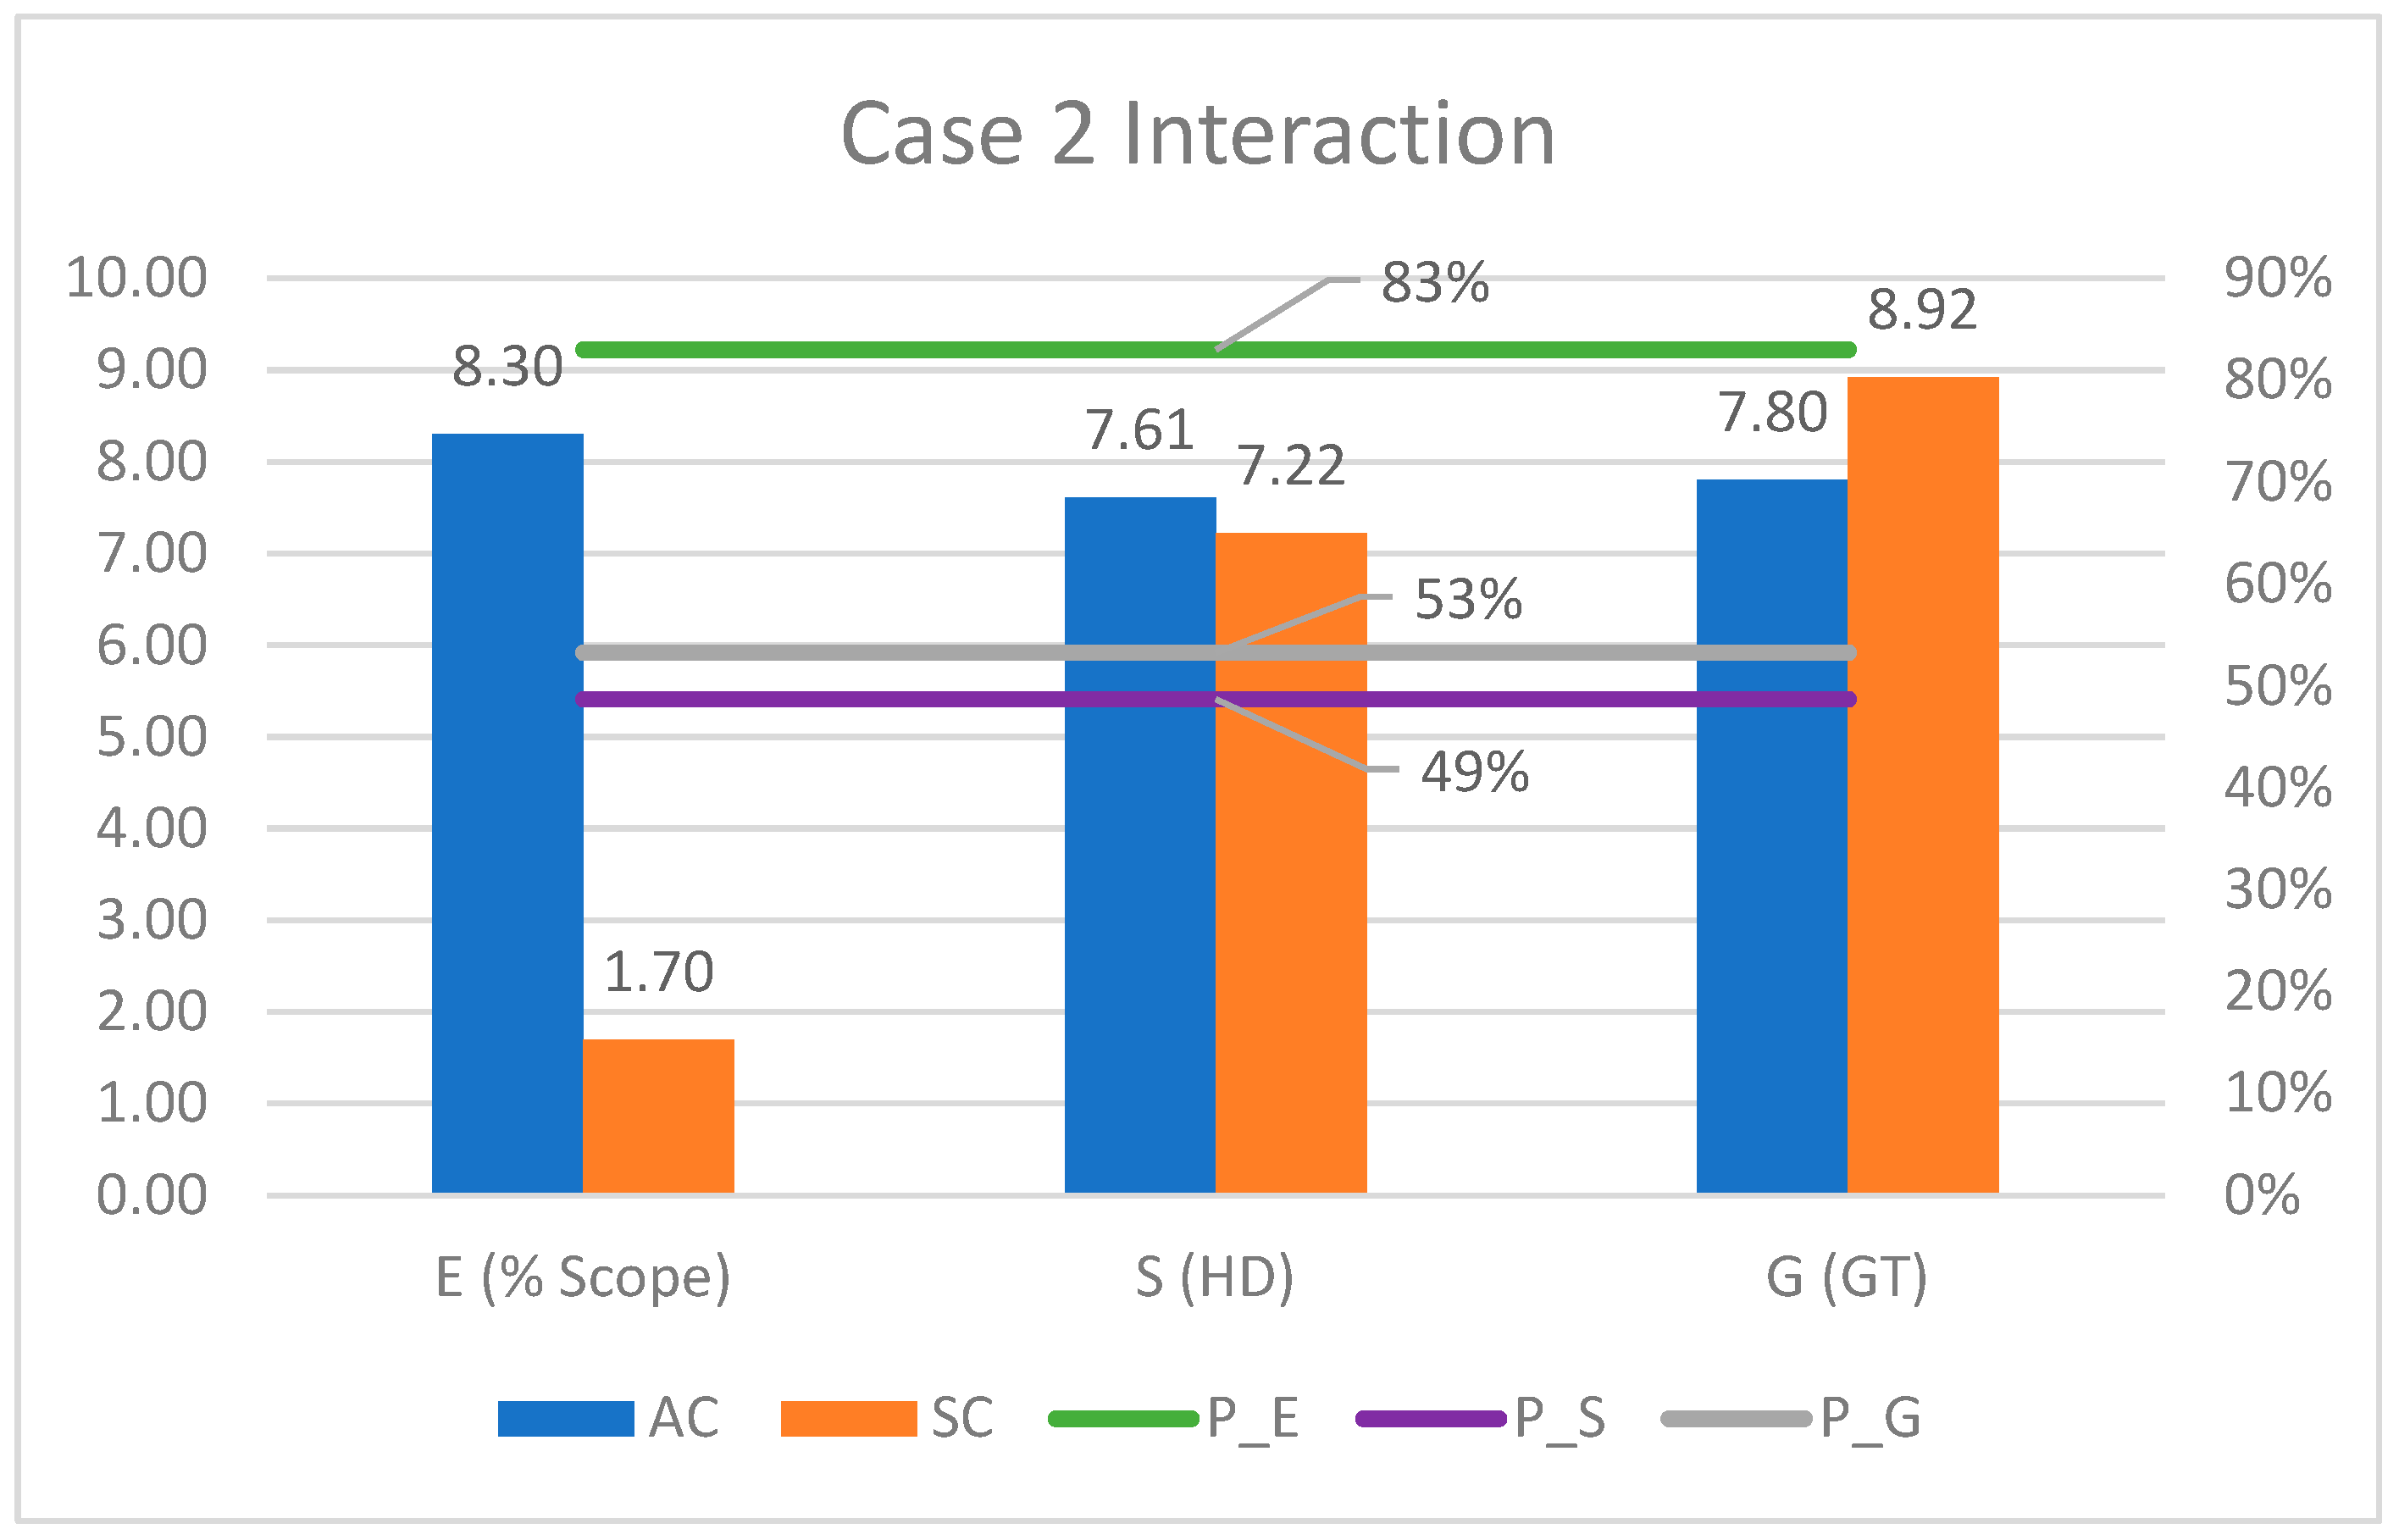
Case two represents the interaction of AC 2 and SC 2, and Figure 10 shows the result of this analysis, divided into three groups and represented by the impact coefficient: environmental (% scope emissions based on Figure 2), social (HD), and governance (GT). The blue bars represent the data from the AC for each topic (% scope 3 = 8.30; = 7.61; = 7.80), and the orange bars represent the data from each topic (% scope 1 + 2 = 1.70; = 7.22; = 8.92). The impact coefficient is represented on the green line that represents the environmental ( = 83%); the purple line represents the social ( = 49%), and the gray line represents the governance ( = 53%).
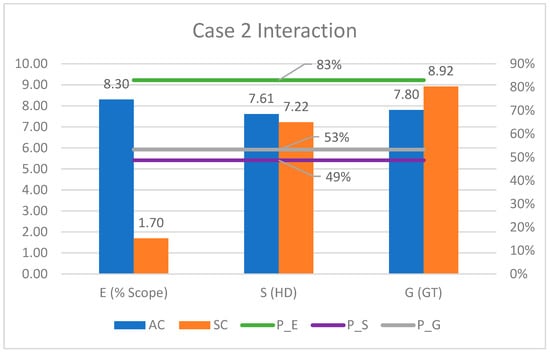
Figure 10.
Case two interaction—ESG impact coefficient.
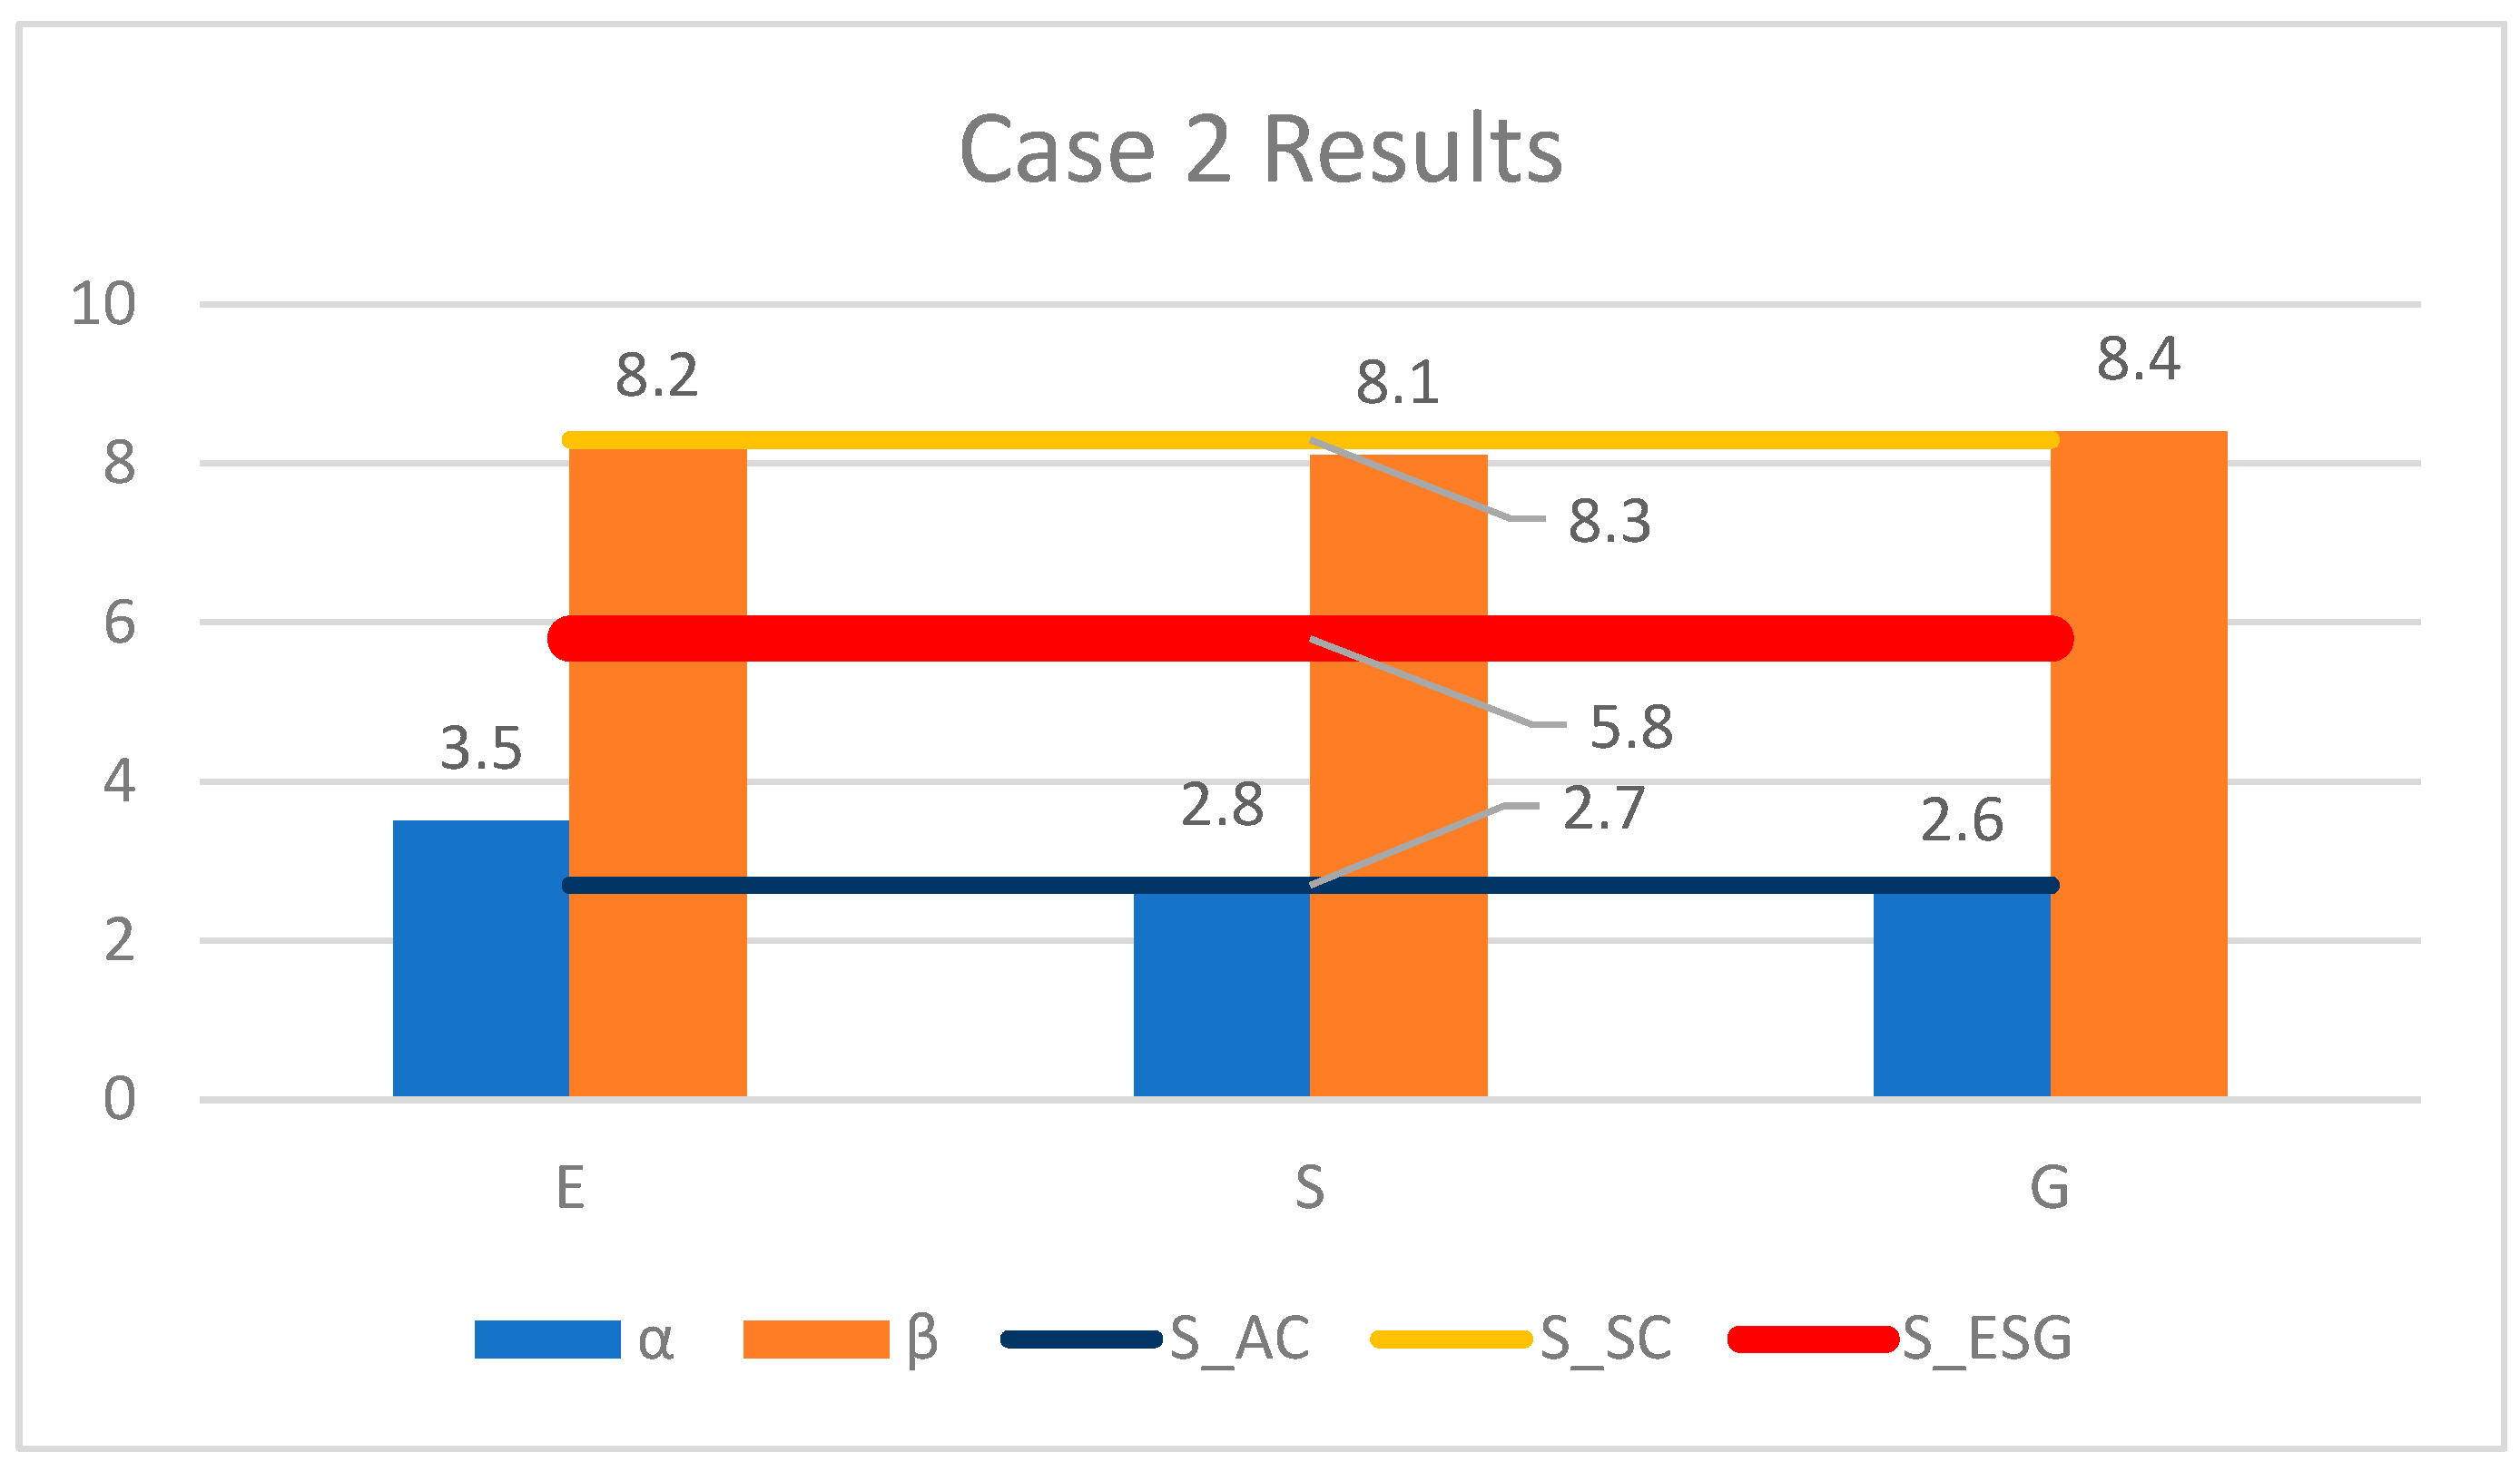
Figure 11 shows the consolidated ESG score for the relationship between AC 2 and SC 2, divided into three categories: environmental, social, and governance. Blue bars (α) represent the AC 2 score for each category ( = 3.5; = 2.8; = 2.6), while orange bars (β) represent the SC 2 score for each category ( = 8.2; = 8.1; = 8.4). The dark blue line represents the final ESG score of AC 2 ( = 2.7), and the yellow line represents the final ESG score of SC 2 ( = 8.3). The red line shows the consolidated ESG score of the AC, considering the SC ( = 5.8) based on the interaction of these scores and considering the impact coefficient data of Figure 10.

Figure 11.
Case two results—ESG scores.
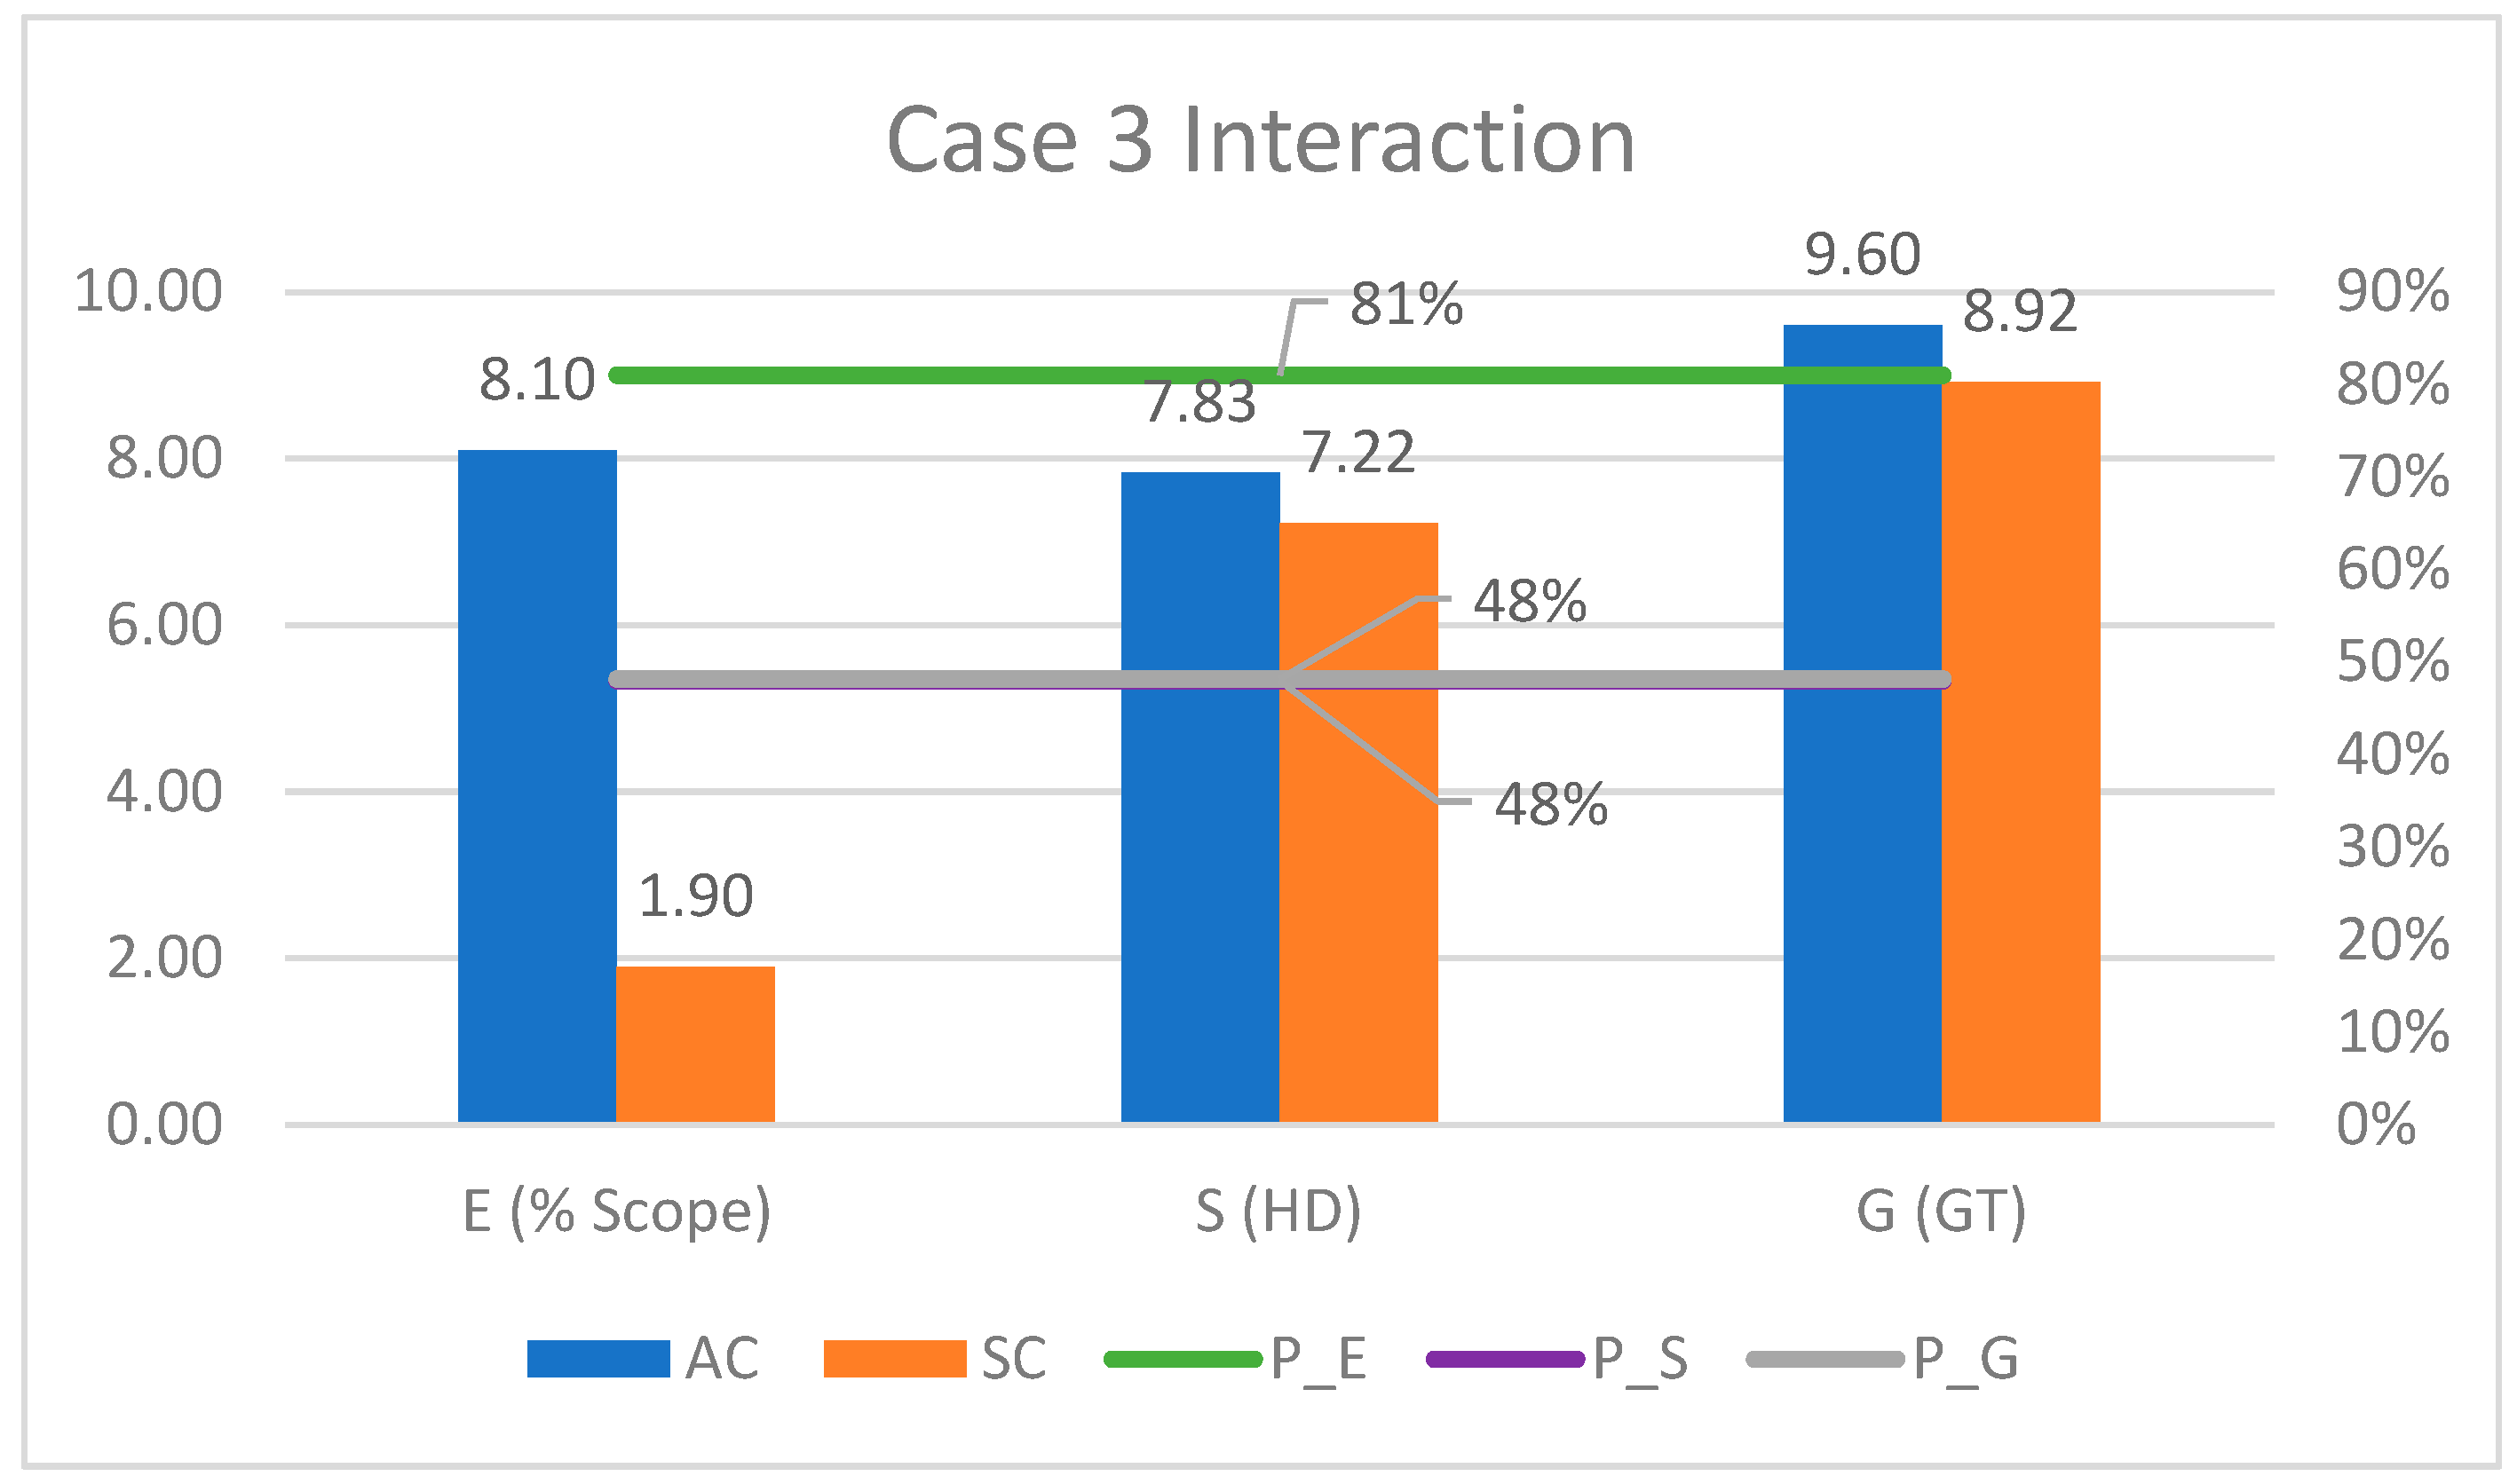
4.3. Scenario Two—Case Three
Case three treats the interaction of AC 1 and SC 2. Figure 12 shows the results of the analysis, divided into the ESG three groups. The blue bars represent the data from the AC for each topic (% scope 3 = 8.10; = 7.83; = 9.60), and the orange bars represent the data from each topic (% scope 1 + 2 = 1.90; = 7.83; = 8.92). Based on this interaction, the impact coefficient is represented on the lines: the green line represents the environmental ( = 81%), the purple line represents the social ( = 48%), and the gray line represents the governance ( = 48%).
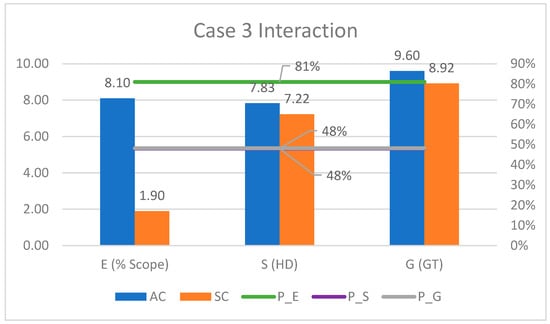
Figure 12.
Case three interaction—ESG impact coefficient.
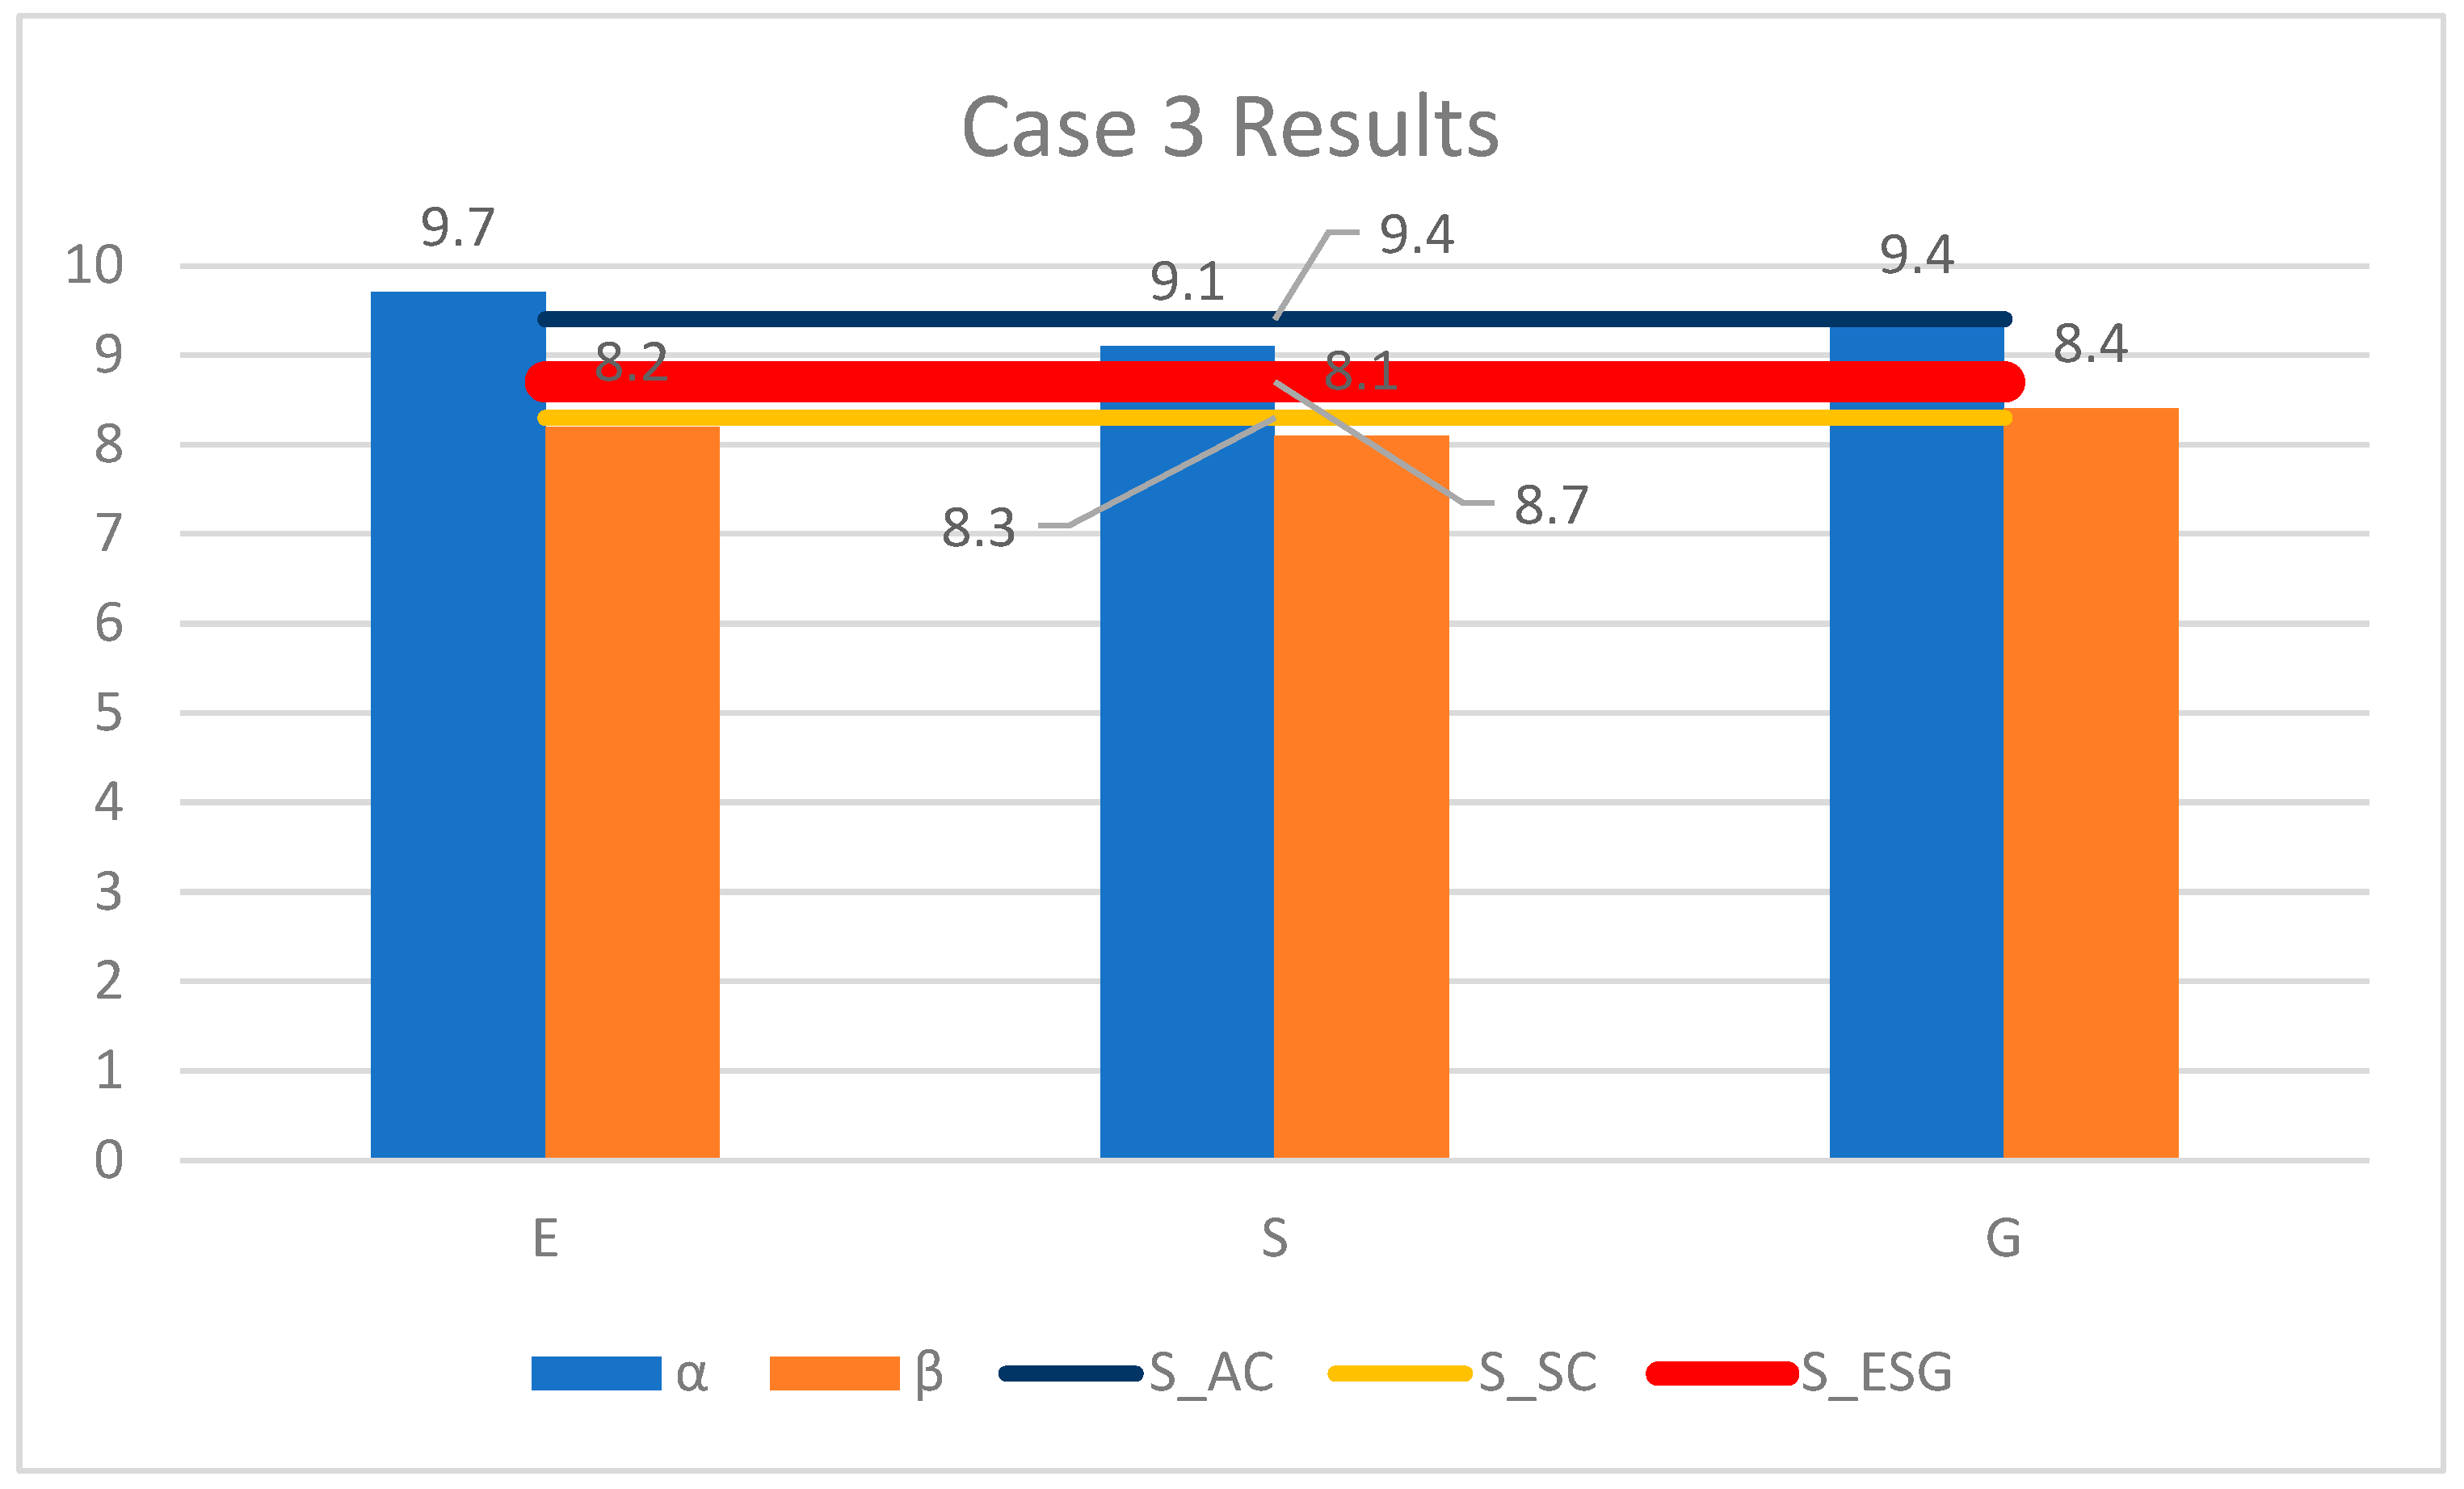
Figure 13 shows the results of the consolidated ESG score, divided into three categories: environmental, social, and governance. Blue bars (α) represent the AC 1 score for each category ( = 9.7; = 9.1; = 9.4). Orange bars (β) represent the SC 2 score for each category ( = 8.2; = 8.1; = 8.4). The dark blue line represents the final ESG score of AC 1 ( = 9.4). The yellow line represents the final ESG score of SC 2 ( = 8.3). The red line shows the consolidated ESG score of the AC, considering the SC ( = 8.7) based on the interaction of these scores and considering the impact coefficient data on Figure 12.

Figure 13.
Case three results—ESG scores.
4.4. Scenario Two—Case Four
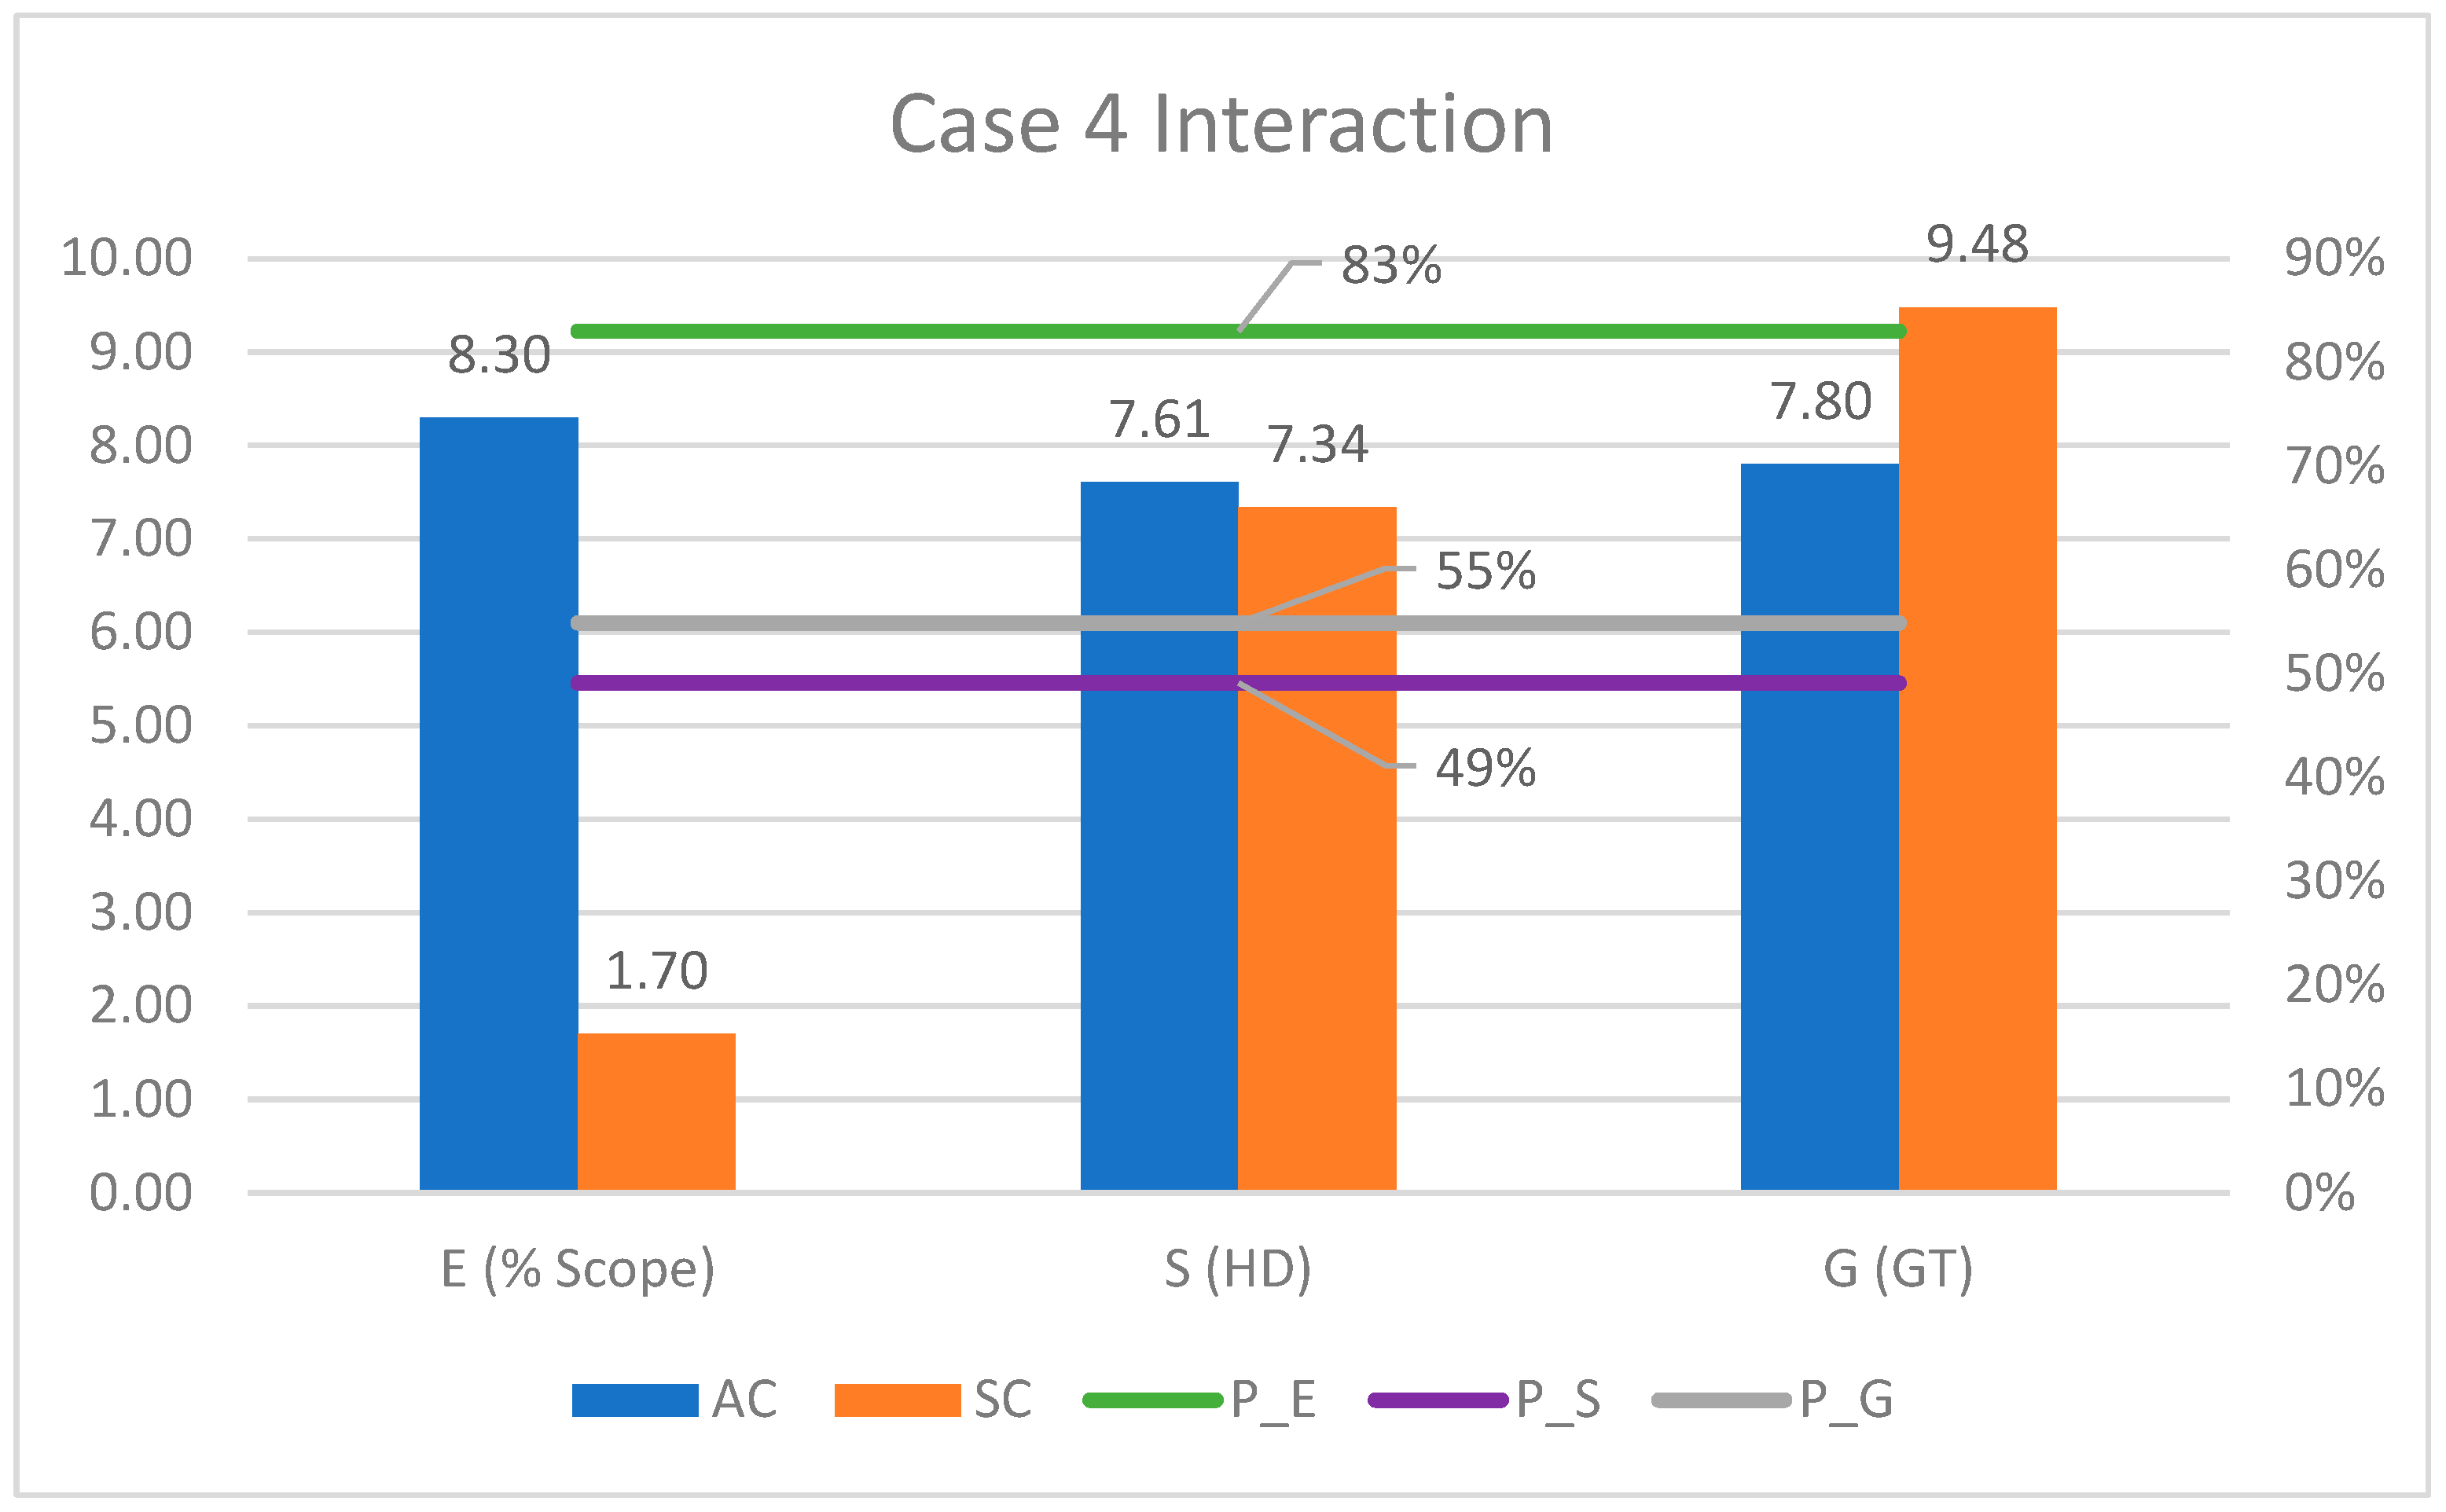
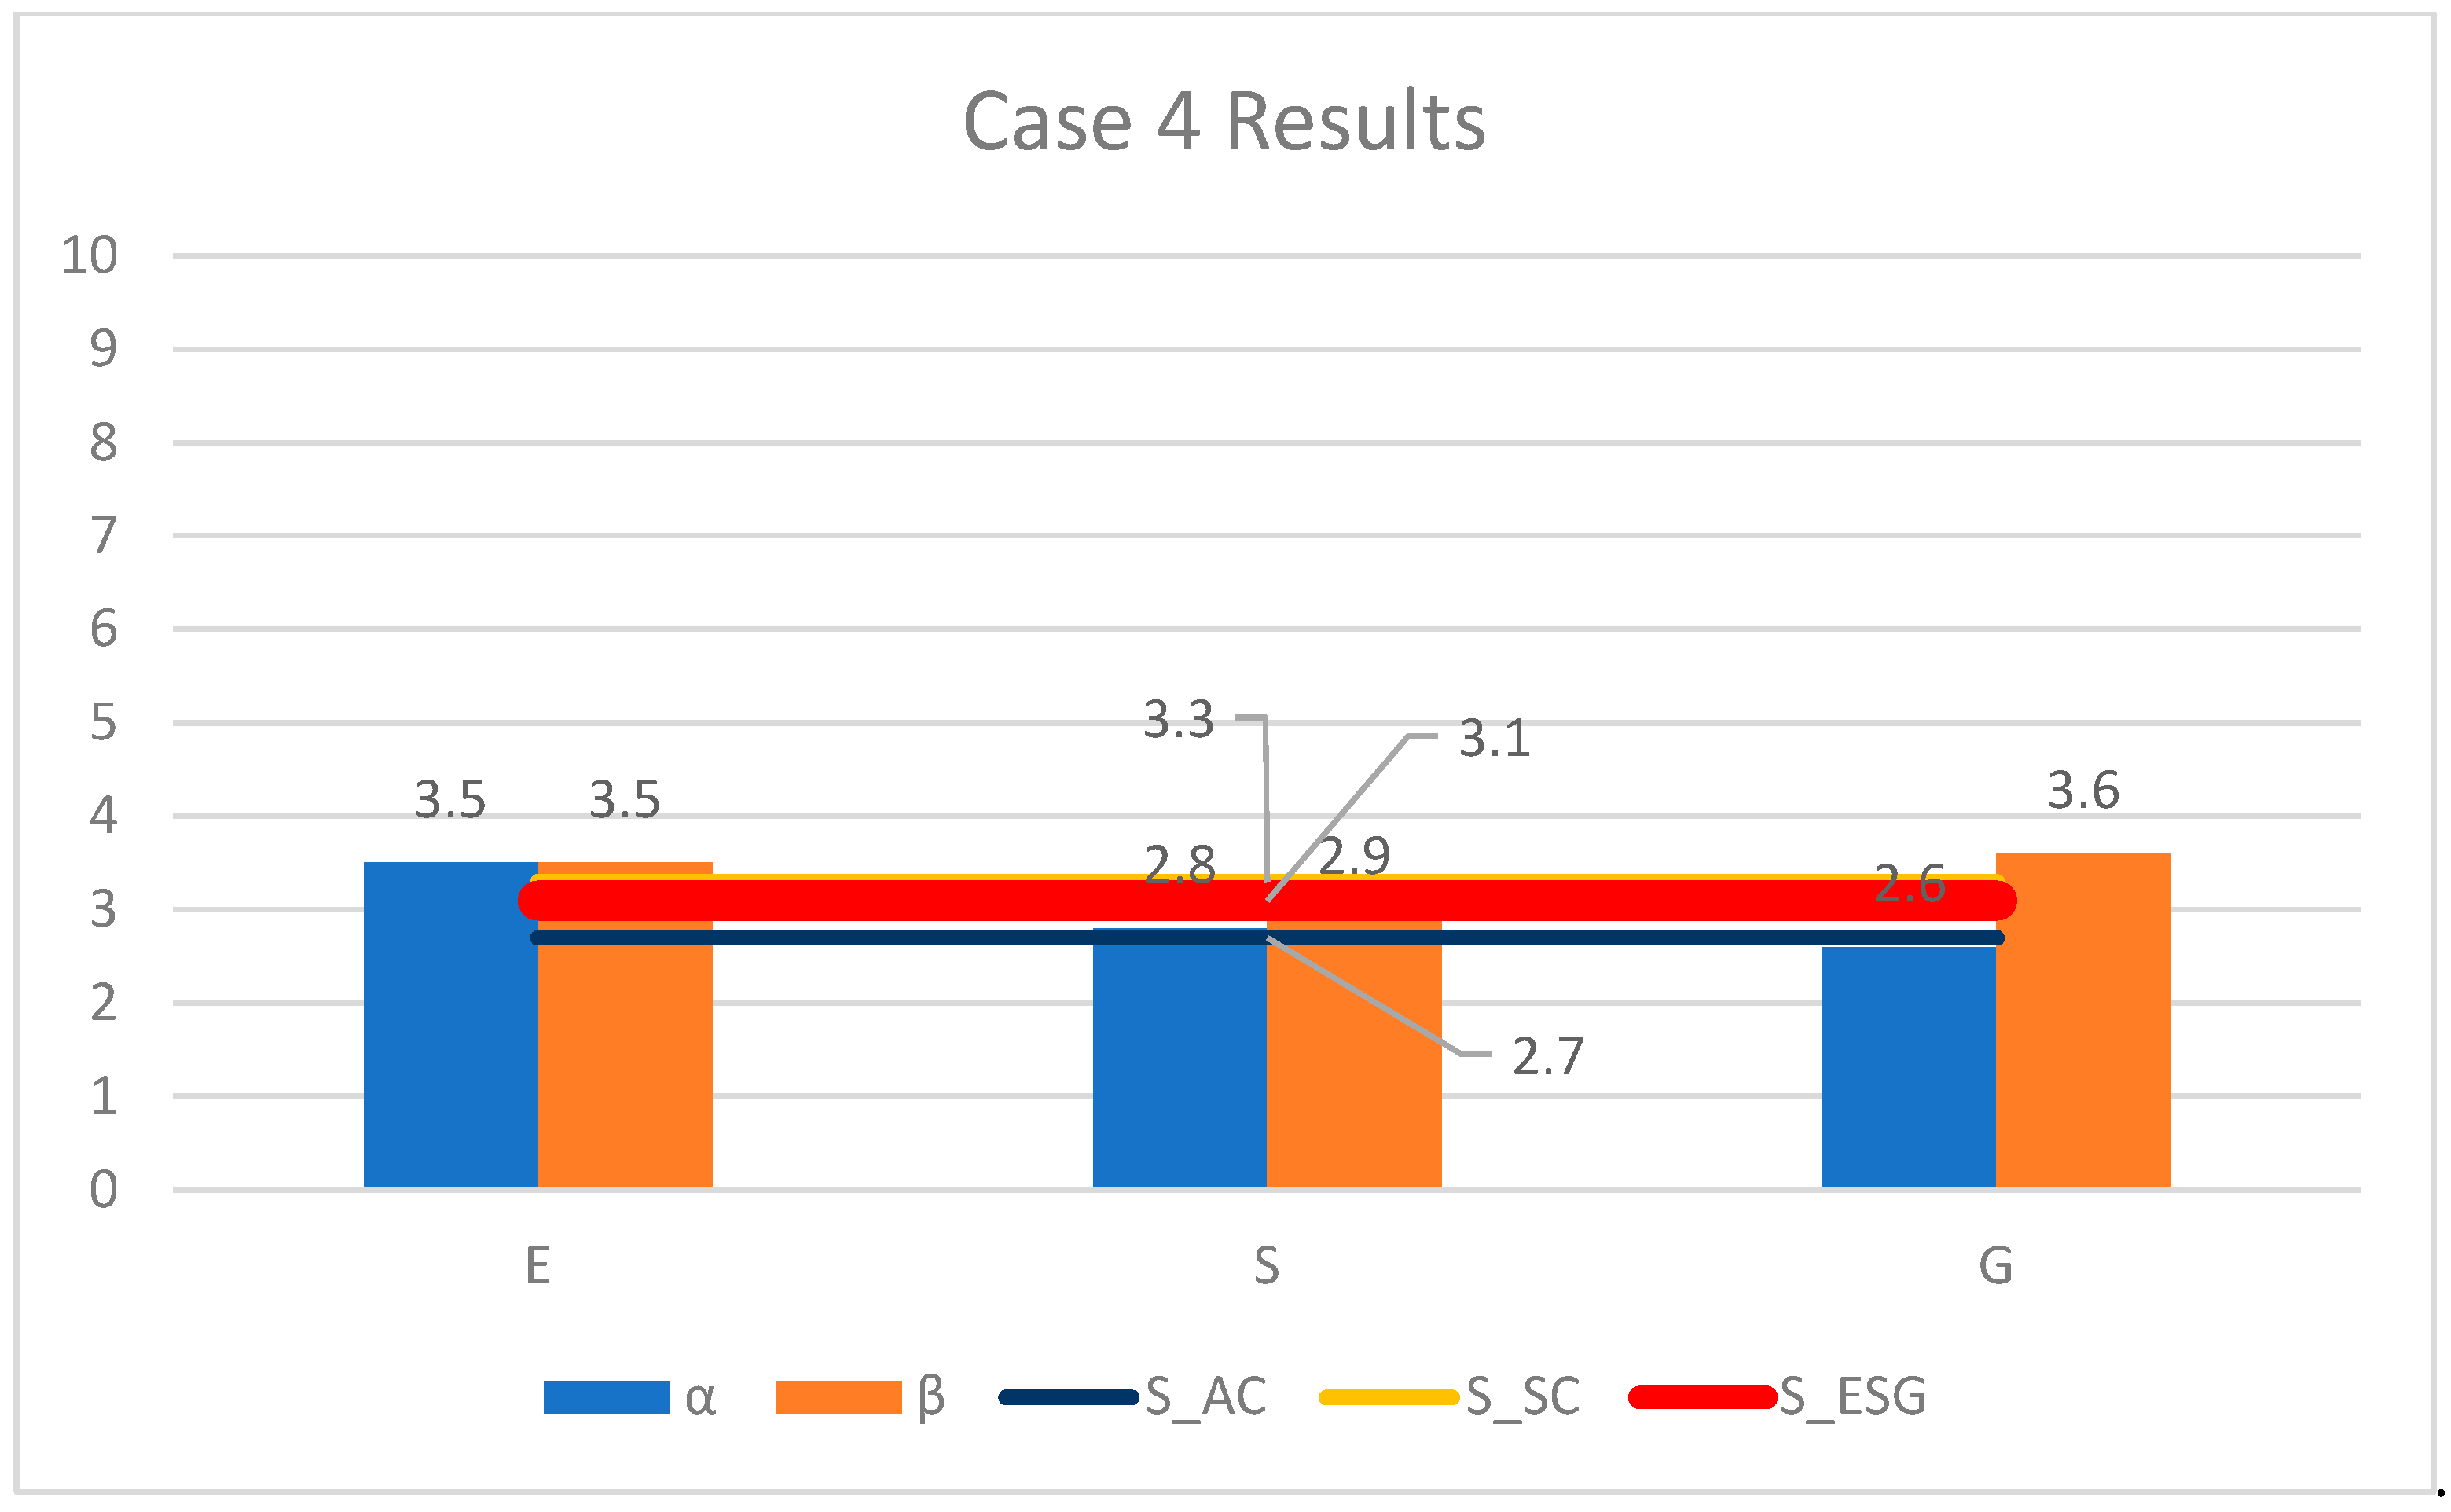
Case four represents the interaction of AC 2 and SC 1, and Figure 14 presents the results of this analysis considering the ESG groups. The blue bars represent the data from the AC for each topic (% scope 3 = 8.30; = 7.61; = 7.80), and the orange bars represent the data from each topic (% scope 1 + 2 = 1.70; = 7.34; = 9.48). Based on that interaction, the impact coefficient is represented on the lines: the green line represents the environmental ( = 83%), the purple line represents the social ( = 49%), and the gray line represents the governance ( = 55%). Figure 15 shows the consolidated ESG score where blue bars (α) represent the AC 2 score for each category ( = 3.5; = 2.8; = 2.6) and orange bars (β) represent the SC 1 score for each category ( = 3.5; = 2.9; = 3.6). The dark blue line represents the final ESG score of AC 2 ( = 2.7). The yellow line represents the final ESG score of SC 2 ( = 3.3). The red line shows the consolidated ESG score of the AC considering the SC ( = 3.1).

Figure 14.
Case four interaction—ESG impact coefficient.

Figure 15.
Case four results—ESG scores.
4.5. Scenario Comparisons
This section summarizes all the results, establishing a comparison among the different scenarios. Table 11 shows the score of the AC, the SC, and the consolidated one for each case. Cases one and two ended up achieving a similar consolidated score with some space for improvement. Case one is a combination of AC 1, which has a good ESG performance, and SC 1 still has a lot to improve, and the consolidated ESG score is in the mid range. On the other hand, case two is a combination of AC 2 that performed very badly in the ESG analysis, where SC 2 performed decently in some ESG aspects, and the consolidated ESG score is also in the mid range. Even though AC 1 has a much better ESG score than AC 2, the score of the supply chains influenced a lot the final score.
Table 11.
Comparison of the scores for different scenarios.
In the interest of identifying the real impact of the SC on the AC ESG analysis, scenario two used the same parties but considered a different combination. This time, case 3 is assumed, where AC 1 is connected with SC 2; since both have good scores, the consolidated score is also good. Case 4 considers AC 2 connected with SC 1, and both have bad scores, which resulted in a bad consolidated score. Moreover, it is possible to see that in all cases, the consolidated score found a spot in between the AC and the SC scores.
Seeking to understand how the SC score affected the consolidated score, Table 12 summarizes all the impact coefficients in environment, social, and governance in each case. In addition, it shows the percentage that the SC score represents on the final/consolidated score. The environment impact coefficient is very high, which means that the consolidated score considers the SC the most. The social impact coefficient represents a little bit less than half, showing that the consolidated score considers the SC quite less than the AC. The governance impact coefficient has similar results as the social; however, in some cases, it is a little bit more than half. Finally, the percentage that the SC score represents on the final/consolidated score is shown, and for cases 1 and 3, it is the same (58%); for Case 2, it is 55%, and for Case 4, it is 56%. This means that in Case 1, if the AC score was 10 and the SC was 0, the consolidate score would be 4.2.
Table 12.
Comparison of the scenarios’ impact coefficient.
SC emissions represent most of the emissions in all economic sectors, except those that focused on raw material. Even in these sectors, the SC contribution (%) of the score might be very significant to the consolidated score, showing that all industries are experiencing pressure to become more sustainable. The AC in the first case is an infrastructure company that is crucial for national development, but it faces several challenges due to deforestation, resource usage, and high emissions. Reinforcing sustainable infrastructure initiatives and considering projects that balance growth with environmental conservation and the rights of local communities are needed. The second case is a financial company, which plays a role in driving sustainability through investment decisions, focusing on main topics of deforestation, social inequality, and emissions. They are held responsible by the organizations receiving their funds, and ESG criteria must become critical.
AC could implement some tools and policies to their strategy to promote sustainability and manage the SC. Some examples include the following: a diligence process on supplier selection considering ESG aspects; the inclusion of clear socio-environmental metrics/clauses/targets on contracts; periodically monitoring and auditing of suppliers; capacity-building programs to create awareness of sustainability; the implementation of innovative technologies to support the transition; defining key performance indicators to be reported; incentives and continuous improvements of all process; and partnerships among the industry by sharing best practices and cases.
5. Conclusions
This work proposed a quantitative ESG score to evaluate carbon footprint by considering both the SC and the AC operations. Environmental, social, and governance are all incorporated in the analysis by considering the materiality and classical measurements for the social aspects, the Human Development Index (HDI), and Governance, the Governance Transparency Index (GTI).
A scenario analysis is developed to test the methodology, showing a proof of concept of the proposed methodology. The score proved to be functional in real-life potential scenarios while being flexible for multiple sectors. The defined weights based on the real sector business and priority groups based on contract size have an impact on the final scores of the AC and the SC. When calculating the scores in the scenario analysis, some variations were tested, and the score proved to be significantly affected by the weights and the priority groups.
This work is a novel contribution to the literature in the field of economics and sustainability, identified either from the scientific literature or the productivity sector. This points to a real-life potential applicability. Both the corporate world and the academic world can use the model to assess real case scenarios and contribute to the model to make it more consistent to fit the specific demands. It was able to develop a framework for companies to evaluate their operational ESG score, to evaluate all the suppliers’ members of the SC by providing an ESG score, to determine suppliers’ importance level, and finally to test the model in different case scenarios, showing that the SC has a significant impact on the AC ESG evaluation process. It extends the traditional ESG assessment framework to incorporate the SC, since it is a critical contributor to corporate sustainability performance.
This model is applicable to support the decision and management process of companies mainly in the procurement, finance, sustainability, and supply chain areas, thereby making the company and the SC more resilient. Additionally, it can be a useful tool for companies to evaluate in a quantitative way their ESG maturity including the SC with some personalized dashboards, thereby identifying the weaknesses, strengths, opportunities, and threats for all parties.
Moreover, in all presented scenarios, the SC had a significant impact on the consolidated ESG score. This proves the point that assessing the SC is important if the company wants to improve its ESG agenda. In all four cases, the SC is responsible for more than 50% of the final consolidated ESG score. However, some other economic sectors that focused on raw material might have a higher contribution of the AC since their footprint is not focused on scope 3. Based on the result, it is impossible to achieve a great consolidated score and achieve a sustainable ecosystem without addressing ESG key topics on the SC as well.
Even though the ESG score of AC 1 was much higher than the AC 2, in the first scenario, they both ended up achieving a similar consolidated ESG score. That happened because in case 1, the ESG score of AC was good, but it was really impacted by the bad ESG score of the SC; in case 2, AC had a very bad ESG score, and the high score of the SC kept the good standard. In scenario 2, after changing the owner of the SC, the output was completely different; in case 3, the good ESG score of the SC helped the good AC score keep its value up and received a great consolidated score, and in case 4, both AC and SC had bad scores, and the consolidated score reflected that.
This research faced some limitations because of the lack of consolidated ESG taxonomy and data. Even though SASB is well recognized, the model did not consider other taxonomies like GRI, CDP, and EU Taxonomy. In addition, since it is an emerging topic, there is a lack of a robust ESG database, resulting in no comprehensive company data, which limited the analysis. The model was only designed for upstream suppliers, not considering ESG impacts on downstream activities such as consumers and disposal.
Natural future research would be the usage of different parameters to define the ESG’s impact coefficient and applicability of the model to various geographies or industries. In addition, the analysis can include more specific sub-sectors and different breakouts, such as separating the transportation of people and cargo, to provide more detailed insights. Finaly, other ESG taxonomies could be explored, and the creation of an industry-specific ESG questionnaire could offer relevant perspectives and comparisons.
Supplementary Materials
The following supporting information can be downloaded at: https://www.mdpi.com/article/10.3390/su17031158/s1, Table S1: SASB Sectors and subsectors; Table S2: SASB materiality topics; Table S3: Example of Questionnaire Assessment Evaluation.
Author Contributions
Conceptualization, A.S., L.S. and M.S.; methodology, A.S.; validation, A.S.; formal analysis, A.S., L.S. and M.S.; investigation, A.S., L.S. and M.S.; writing—original draft preparation, A.S.; writing—review and editing, L.S. and M.S.; visualization, A.S., L.S. and M.S.; supervision, L.S.; project administration, L.S.; funding acquisition, L.S. and M.S. All authors have read and agreed to the published version of the manuscript.
Funding
This research was funded by Brazilian Research Agencies CNPq, CAPES and FAPERJ.
Institutional Review Board Statement
Not applicable.
Informed Consent Statement
Not applicable.
Data Availability Statement
Data will be made available on request.
Acknowledgments
The authors acknowledge the support of the Brazilian Research Agencies CNPq, CAPES and FAPERJ.
Conflicts of Interest
The authors declare no conflict of interest.
References
- Tsalis, T.; Malamateniou, K.; Koulouriotis, D.; Nikolaou, L. New challenges for corporate sustainability reporting: United Nations’ 2030 Agenda for sustainable development and the sustainable development goals. Corp. Soc. Responsib. Evironmental Manag. 2020, 27, 1617–1629. [Google Scholar] [CrossRef]
- Manzoor, U.; Baig, S.A.; Hashim, M.; Sami, A.; Rehman, H.U.; Sajjad, I. The effect of supply chain agility and lean practices on operational performance: A resource-based view and dynamic capabilities perspective. TQM J. 2021, 34, 1273–1297. [Google Scholar] [CrossRef]
- Gouda, K.S.; Saranga, H. Sustainable supply chains for supply chain sustainability: Impact of sustainability efforts on supply chain risk. Int. J. Prod. Res. 2018, 56, 5820–5835. [Google Scholar] [CrossRef]
- Junaid, M.; Zhang, Q.; Syed, W.M. Effects of sustainable supply chain integration on green innovation and firm performance. Sustain. Prod. Consum. 2022, 30, 145–157. [Google Scholar] [CrossRef]
- Fernando, Y.; Halili, M.; Tseng, M.L.; Tseng, W.J.; Lim, K.M. Sustainable social supply chain practices and firm social performance: Framework and empirical evidence. Sustain. Prod. Consum. 2022, 32, 160–172. [Google Scholar] [CrossRef]
- Ali, S.S.; Kaur, R.; Ersöz, F.; Altaf, B.; Basu, A.; Weber, G. Measuring carbon performance for sustainable green supply chain practices: A developing country scenario. Cent. Eur. J. Oper. Res. 2020, 28, 1389–1416. [Google Scholar] [CrossRef]
- Sodhi, M.S.; Tang, C.S. Research Opportunities in Supply Chain Transparency. Prod. Oper. Manag. 2019, 28, 12. [Google Scholar] [CrossRef]
- Chen, J.Y. Responsible sourcing and supply chain traceability. Int. J. Prod. Econ. 2022, 248, 108462. [Google Scholar] [CrossRef]
- Islam, M.A.; Staden, C.J. Social movement NGOs and the comprehensiveness of conflict mineral disclosures: Evidence from global companies. Account. Organ. Soc. 2018, 65, 1–19. [Google Scholar] [CrossRef]
- Wissuwa, F.; Durach, C.F.; Choi, T.Y. Selecting resilient suppliers: Supplier complexity and buyer disruption. Int. J. Prod. Econ. 2022, 253, 108601. [Google Scholar] [CrossRef]
- Liu, Y.; Zhu, Q.; Seuring, S. New technologies in operations and supply chains: Implications for sustainability. Int. J. Prod. Econ. 2020, 229, 107889. [Google Scholar] [CrossRef]
- Lotfi, R.; Hazrati, R.; Aghakhani, S.; Afshar, M.; Amra, M.; Ali, S.S. A data-driven robust optimization in viable supply chain network design by considering Open Innovation and Blockchain Technology. J. Clean. Prod. 2024, 436, 140369. [Google Scholar] [CrossRef]
- Vergara, C.C.; Agudo, L.F. Fintech and Sustainability: Do They Affect Each Other? Sustainability 2021, 13, 7012. [Google Scholar] [CrossRef]
- Jebe, R. The Convergence of Financial and ESG Materiality: Taking Sustainability Mainstream. Am. Bus. Law J. 2019, 56, 645–702. [Google Scholar] [CrossRef]
- Matsumura, E.M.; Prakash, R.; Vera-Munoz, S.C. Climate Risk Materiality and Firm Risk. Rev. Account. Stud. 2022, 29, 33–74. [Google Scholar] [CrossRef]
- Betti, G.; Consolandi, C.; Eccles, R.G. The Relationship between Investor Materiality and the Sustainable Development Goals: A Methodological Framework. Sustainability 2018, 10, 2248. [Google Scholar] [CrossRef]
- Escoto, X.; Gebrehewot, D.; Morris, K.C. Refocusing the barriers to sustainability for small and medium-sized manufacturers. J. Clean. Prod. 2022, 338, 130589. [Google Scholar] [CrossRef]
- Madison, N.; Schiehll, E. The Effect of Financial Materiality on ESG Performance Assessment. Sustainability 2021, 13, 3652. [Google Scholar] [CrossRef]
- Dumrose, M.; Rink, S.; Eckert, J. Disaggregating confusion? The EU Taxonomy and its relation to ESG rating. Financ. Res. Lett. 2022, 48, 102928. [Google Scholar] [CrossRef]
- Frini, A.; Diouf, D. Corporate Sustainable Development Performance Measurement: A Systematic Review and proposal of an indicator Grid for Manufacturing Companies. In Proceedings of the International Conference on Industrial Engineering and Operations Management, Bangkok, Thailand, 5–7 March 2019. [Google Scholar]
- D’Amato, V.; D’Ecclesia, R.; Levantesi, S. ESG score prediction through random forest algorithm. Comput. Manag. Sci. 2022, 19, 347–373. [Google Scholar] [CrossRef]
- SASB. Find your industry. In Sustainability Accounting Standards Board; SASB: San Francisco, CA, USA, 2022. [Google Scholar]
- Wood, R.; Hertwich, G.E. The growing importance of scope 3 greenhouse gas emissions from industry. Environ. Res. Lett. 2018, 13, 104013. [Google Scholar]
- World Economic Forum. Net-Zero Challenge: The Supply Chain Opportunity; World economic forum, Boston Consulting Group: Boston, MA, USA, 2021. [Google Scholar]
- Zhang, Y.; Wu, Z. Environmental performance and human development for sustainability: Towards to a new Environmental Human Index. Sci. Total Environ. 2022, 838, 156491. [Google Scholar] [CrossRef] [PubMed]
- Liu, C.; Li, Q.; Lin, Y.E. Corporate transparency and firm value: Does market competition play an external governance role? J. Contemp. Account. Econ. 2022, 19, 100334. [Google Scholar] [CrossRef]
- Instituto Brasileiro de Geografia e Estatística (IBGE). Censo Demográfico, IBGE; Instituto Brasileiro de Geografia e Estatística (IBGE): Rio de Janeiro, Brazil, 2010. [Google Scholar]
- Mapa Brasil Transparente (MBT). Indice de Transparência Governamental, Controladoria-Geral da União; Mapa Brasil Transparente (MBT): Brasilia, Brazil, 2020. [Google Scholar]


Disclaimer/Publisher’s Note: The statements, opinions and data contained in all publications are solely those of the individual author(s) and contributor(s) and not of MDPI and/or the editor(s). MDPI and/or the editor(s) disclaim responsibility for any injury to people or property resulting from any ideas, methods, instructions or products referred to in the content. |
© 2025 by the authors. Licensee MDPI, Basel, Switzerland. This article is an open access article distributed under the terms and conditions of the Creative Commons Attribution (CC BY) license (https://creativecommons.org/licenses/by/4.0/).