Article

Establishment and Application of Modern Ecological Governance Systems from the Perspective of Digital Empowerment

1
School of Marxism, North China University of Water Resources and Electric Power, Zhengzhou 450046, China
2
School of Management Science and Engineering, Beijing Jiaotong University, Beijing 100044, China
*
Author to whom correspondence should be addressed.
Sustainability 2025, 17(3), 1176; https://doi.org/10.3390/su17031176
Submission received: 12 December 2024 / Revised: 21 January 2025 / Accepted: 23 January 2025 / Published: 31 January 2025

Abstract

:
The ecological governance system has made significant progress in information technology construction, and digitization has become an important driving force in the construction of this system. This article delves into the digital construction path of ecosystem governance and elaborates on the practical application effectiveness of digitalization in the ecological governance system through two specific cases: intelligent water management and air pollution warning digital models. Furthermore, we adopt the TOE (Technology–Organization–Environment) model to integrate a collaborative theory with the concept of multi-center governance and innovatively propose a new model for nearshore ecological environment protection management. On this basis, we constructed an evaluation index system and established a theoretical model of the impact of environmental regulations on nearshore ecological efficiency. After empirical analysis, we found that the impact of environmental regulations on ecological efficiency in coastal areas presents a curvilinear characteristic. In the modern ecological governance system, organizational factors and technological factors are the two modules that have the greatest impact on system construction, accounting for 49% and 31% of the weight of the indicator system, respectively, followed by technological advantages and the urgency and feasibility of construction. Gender factors indicate that technology and organization are necessary factors that constrain institutional development.

1. Introduction

In recent years, with the development of digital technology and the application of related tools, China has attached great importance to the digital transformation and upgrading of organizations, encouraging and supporting various industries to implement digital system construction and management. The iterative development and popularization of digital technology have driven human society into a process of deep digital transformation. This is not only reflected in the continuous emergence of business innovation in various fields driven by digital technology, but also in the comprehensive transformation of national governance towards digital governance in accordance with the requirements of digital transformation. For the latter, on the one hand, it is necessary to establish a macro-level digital governance system and a top-level framework for governance capabilities to ensure the systematic, holistic, and collaborative nature of relevant reforms. The governance laws have organized the path of digital transformation and formed governance innovations with their own characteristics. Existing research focuses more on institutional construction at the macro level [1,2]. The exploration of governance innovation in specific fields focuses more on public services [3] or social governance [4]. What opportunities and challenges will environmental governance reform face in the era of digital transformation? Should the theoretical basis for guiding reform be based on emerging digital technologies, or should it draw on traditional environmental governance research? How to promote the integration and innovation of digital technology and environmental governance? These issues deserve further research.
At present, the academic community has conducted extensive discussions on the application of digital governance in the field of the ecological environment, such as the mining and application of ecological environment big data, the exploration of the “Internet plus environmental governance” model, and the development of intelligent environmental governance systems [5]. When the diversity and differences in real society are simplified into “0/1” binary numbers that computers can handle, these rich features and subtle differences face the risk of being overlooked [6]. Although the process of data collection, storage, circulation, and analysis is efficient, it may also lead to excessive simplification of the complexity of reality. This leads to governance decisions overly relying on the output of data models, while ignoring specific needs and contextual changes in actual situations [7]. From this theoretical perspective, digital ecological governance seems to have the ability to surpass the limitations of traditional fields. To some extent, it is possible to temporarily ignore the governance laws and practical details in specific fields and focus on the iterative upgrading and innovative development of the digital governance system itself. This trend not only improves efficiency but may also pose new challenges to the effectiveness and fairness of governance [8].
Compared to the grand narrative surrounding the transformation of the digital age, the specific mechanisms at the micro level can provide a clearer explanation of how digital processes accumulate over time and the governance logic in the ecological domain [9]. Scholars in the field of the environment have observed that the micro mechanism of environmental “information” is an intermediate variable that affects ecological environment governance behavior and institutional change. It can be seen that “informatization” plays an important role in promoting the process of environmental governance reform. A review of such research naturally helps us understand the potential mechanisms by which digital technology changes ecological governance behavior and institutional logic [10]. It is in the context of the development and application of digital technology that the role of “information” in environmental governance has been elevated to a crucial position. Digital technology has driven changes in the production, dissemination, and processing of environmental information, naturally bringing about environmental changes in governance behavior and institutions. This article reveals the mechanism and process of how digital technology affects environmental governance performance from this perspective. Then, it analyzes the characteristics and logic of China’s ecological environment governance. Ultimately, we can understand how the development and application of digital technology will promote reform and innovation in China’s ecological environment management [11]. However, most scholars are enthusiastic about applying specific digital methods to environmental governance, and there is little research on digitalization in the ecological environment governance system, lacking further research and discussion. Therefore, from the perspective of digital empowerment, this article establishes a digital system for ecological environment governance based on the analysis of practical problems in the ecological environment digital governance system, evaluating the system through digital models and proposing corresponding improvement measures. This provides a scientific basis for the construction of a digital system for future ecological environment governance [12].
The application of digital technology can significantly improve the efficiency of ecological governance systems by optimizing resource allocation and enhancing monitoring and early warning capabilities. Specifically, this article will use intelligent water management and air pollution warning digital models as application cases to analyze in detail the practical application effects of digital technology in ecological governance. At the same time, we will also use the TOE (Technology–Organization–Environment) model, combined with collaborative theory and multi-center governance concepts, to innovate the management mode of nearshore ecological environment protection and establish a corresponding evaluation index system [13]. Through empirical analysis, we will explore the impact of environmental regulations on nearshore ecological efficiency, as well as the importance of organizational and technological factors in the construction of ecological governance systems. The significance of this study lies in exploring the application of digital technology in ecological governance, providing theoretical support and practical guidance for building a more efficient and intelligent ecological governance system. At the same time, we also hope that through this study, researchers and practitioners in related fields can pay more attention to the potential of digital technology in ecological governance and jointly promote innovation and development of the ecological governance system.

2. The Practical Problems of the Digital Governance System of the Ecological Environment System

At present, comprehensive research on the ecological environment and digitalization has covered the theoretical and practical research of the “ecological environment” and “digitalization”. These research topics focus on digital transformation, technology, era, background, ecological environment, ecology, and ecology. This indicates that the application of digitization in ecological environments is more comprehensive and diverse but also comes with real risks [14].
(1) Own risks of digital governance
In ecological environment governance, it is necessary to control factors such as the integrity of ecological environment protection. Data collection and data equipment construction are related to the safety of everyone’s life and property, as well as the information security of the country. Therefore, achieving digital transformation must first eliminate the risk of data leakage in the environment. Secondly, long-term reliance on digital technology to handle transactions may lead people to gradually overlook or forget traditional methods of handling events [15]. The operation of digital technology is highly dependent on a stable power source. Once the power supply is interrupted, it may lead to long-term system failures, resulting in interrupted and chaotic event-handling [16]. This situation is particularly evident during extreme weather or natural disasters, and in severe cases may even directly threaten the stability of public order. In addition, digital governance itself also carries certain risks, which are particularly prominent in the current context of uneven regional economic development and uneven digital technology capabilities in different regions. The data collection work in different regions is often closely related to regional interests, which may lead to each region tending to adopt independent governance strategies, exacerbating the trend of fragmented governance [17].
(2) Scientific risks of ecological environment digitalization standards
The pursuit of the ecological environment by humans is rooted in constantly changing needs and interests, and the yearning for a better life drives us to strive to create an “ecological environment” that meets specific environmental standards. The achievement of this goal largely relies on the application of digital technology in ecological environment governance. Digital governance utilizes advanced digital technologies to monitor the environment in real-time to ensure compliance with established environmental standards. However, the scientific nature of environmental standards, as the cornerstone of the rationality of digital governance, cannot be ignored in its importance [18]. The concept of the “ecological environment” itself contains many uncertainties and complexities, involving the interaction of multiple dimensions such as nature, society, and economy. Although digital governance is built on a solid foundation of intelligent data analysis, which can provide decision recommendations based on large amounts of data, these analyses and recommendations are all conducted within established norms or procedural frameworks. When abnormal situations occur in the environment, especially beyond the normal prediction range, digital governance systems may find it difficult to provide sensitive feedback quickly, making it difficult to achieve preventive ecological environment governance [19].
(3) Difficulties in guaranteeing the digital technology infrastructure for the ecological environment
In the digital age, big data analysis has become an important tool for enterprise decision-making, operations, and innovation. For ecological enterprises, big data analysis can not only provide massive real-time environmental data, but also deeply mine and analyze these data through algorithm models, revealing hidden environmental problems and innovation opportunities [20]. This provides strong support for enterprises to formulate scientific environmental protection strategies, optimize production processes, and improve resource utilization efficiency. Big data analysis can monitor real-time environmental data of enterprises, such as wastewater discharge, exhaust emissions, energy consumption, etc., and predict potential environmental risks through algorithm models. This real-time monitoring and warning mechanism helps enterprises to detect and respond to environmental problems in a timely manner, avoiding the occurrence of environmental accidents. Meanwhile, big data analysis can also provide quantitative assessment of environmental risks for enterprises, helping them develop targeted risk management measures. Big data analysis can deeply explore and analyze various links in the production process of enterprises and discover bottlenecks and problems that exist in the production process [21]. By optimizing production processes, enterprises can improve production efficiency, reduce production costs, and minimize their impact on the environment. For example, big data analysis can help enterprises achieve intelligent scheduling of production lines, optimize resource allocation, and improve resource utilization efficiency.
With the acceleration of China’s “new infrastructure” pace, infrastructure security cannot be ignored. Ecological environment protection is a comprehensive and systematic project. To achieve digital governance of the ecological environment nationwide, it is necessary to build a comprehensive digital infrastructure and talent development that covers the whole country [22,23]. Some scholars have analyzed the management mode of ecological enterprises under the background of big data in China. They established various indicators to analyze the role of sustainable technological innovation in enterprise development and the impact of digital empowerment on enterprise development. Finally, taking China’s manufacturing industry and ecological enterprises in Hubei Province as examples, the digital empowerment of sustainable technological innovation management in ecological enterprises against the background of big data is summarized. The final results indicate that sustainable technological innovation significantly reduces resource consumption and waste emissions of ecological enterprises [24]. These inconsistencies may stem from differences in research methods, differences in data collection and processing, and the specificity of the study area and ecosystem, as well as changes in policy environment and socio-economic background. For example, some studies emphasize the significant advantages of digital technology in improving ecological governance efficiency, precise policy implementation, and real-time monitoring. However, other studies have pointed out issues such as data privacy breaches, technological barriers, and digital divides that digitization may bring. In addition, different studies have yielded different results regarding the impact of environmental regulations on ecological efficiency in coastal areas, including linear relationships, inverted U-shaped curves, and no significant relationships [25]. This article provides a detailed comparison and analysis of different research methods, data, and conclusions, attempting to identify the key factors that lead to inconsistent results. This helps us to have a more accurate understanding of the mechanism of digitalization in ecological governance systems, as well as the complexity of the impact of environmental regulations on ecological efficiency in coastal areas. Through empirical research, we have chosen intelligent water management and air pollution warning digital models as application cases to demonstrate the practical application effects of digitalization in ecological governance systems. These case studies not only validate our theoretical hypotheses but also provide valuable experience for the governance of other similar ecosystems.

3. Construction of a Digital System for Ecological Environment Governance

3.1. Construction Principles

Currently, with the acceleration of urbanization and the increasingly prominent ecological environment issues, the demand and urgency for the digital construction of urban ecological environment systems have become more prominent. However, despite the continuous advancement of practical exploration in this field, its top-level design and strategic planning are still insufficient and in the early stages of development. As a key link in promoting this process, the research on the impact of digital construction of intelligent ecological environments needs to be further strengthened in both depth and breadth. In order to deeply analyze the core factors affecting the digital construction of ecological environment systems, this article draws on the theoretical framework of Technology–Organization–Environment (TOE) proposed by Tornatzky and Fleischer. This framework provides us with a comprehensive and systematic analytical perspective from three dimensions: technology, organization, and environment. The technical dimension focuses on the innovation and application of digital technology, including the potential and limitations of cutting-edge technologies such as big data, cloud computing, and the Internet of Things in ecological environment monitoring, early warning, and governance. The organizational dimension focuses on governance systems, organizational structures, personnel allocation, and other aspects, exploring how to build an ecological environment governance system that meets the requirements of the digital age. The environmental dimension involves multiple levels such as policy environment, laws and regulations, social culture, etc. This paper will analyze how these factors affect the promotion and implementation of digital construction.
(1) TOE framework construction
Clarify data collection methods: Design questionnaire surveys or in-depth interviews to collect data from decision-makers, technical personnel, and participants involved in the digital construction of ecological environment systems. The questionnaire or interview outline should cover specific questions from three dimensions: technical, organizational, and environmental.
Determine sample size and scope: Select representative samples based on research objectives and available resources, including ecological environment system construction projects of different sizes, types, and regions. Ensure that the samples have broad coverage and diversity.
Technical factors: Quantitative technological advantages, complexity, compatibility, and observability.
Organizational factors: Evaluate organizational size, structure, culture, and decision support.
Environmental factors: Analyze the impact of government policies, standards, and safeguard measures on the digital construction of ecological environment systems.
The TOE framework draws on relevant theories of innovation adoption and divides the factors that affect organizational innovation adoption into three categories: technology, organization, and environment. Technical factors include technological advantages, complexity, compatibility, and observability. Organizational factors include organizational size, organizational structure, organizational culture, decision support, etc. Environmental factors include government policies, standards, and safeguarding measures. These three are interrelated and mutually restrictive, jointly influencing the adoption behavior of organizations and the speed of innovative technology. The digital construction of the ecological environment system is an advanced stage of the development of ecological construction informatization, and there is an urgent need to solve the environmental problems caused by global climate change and accelerated urbanization. This article regards the digital construction of ecological environment systems as an organizational innovation behavior and analyzes various specific factors that affect system construction from the dimensions of technology, organization, and environment (Figure 1).
The C1 (Technological Innovation) indicator is used to measure the degree of innovation of new technologies in the digital construction of ecological environment systems. Evaluate the innovation of new technologies by comparing the differences between them and traditional technologies, as well as their effectiveness in solving practical problems. C2 (Technology Maturity) technology maturity refers to the stability and reliability of a technology in practical applications. Evaluate the maturity of the technology based on its historical application records, user feedback, and performance indicators in the technical documentation. Quantitative evaluation mainly involves collecting and analyzing relevant data, such as indicators of technological innovation, technological maturity, frequency of organizational restructuring, and employee satisfaction survey results. Qualitative evaluation involves an in-depth understanding of the actual impact of technology, organization, and environment in the process of digital construction through expert interviews, case analysis, and other methods.
(2) Evaluate the construction-influencing factors
① Establish the evaluation structure model
In order to comprehensively and deeply evaluate the impact of digital construction of ecological environment systems in different dimensions and levels, this paper adopts a Technology–Organization–Environment (TOE) framework based on system characteristics for theoretical analysis. This framework not only helps us understand the interactive relationship between technology, organization, and environment, but also provides us with a systematic perspective to examine the multidimensional impact of digital construction on the ecological environment system. Based on theoretical analysis, we have combined expert opinions from the fields of environmental protection, information technology, and policymaking to jointly construct an evaluation structure that includes the impact of technology. This structure aims to comprehensively reflect the impact of digital construction on the ecological environment system, ensuring the comprehensiveness and scientificity of the evaluation. Figure 2 shows the hierarchical structure of factors affecting the digital construction of ecological environment systems.
② Construct judgment matrix
After conducting an expert questionnaire survey and scoring, pairwise comparisons were made between the various elements in the hierarchical evaluation structure of the impact of digital construction on the ecological environment system. And based on the principles of the Seaty scale, judgment matrices between different levels were provided.
③ Hierarchical single ordering and its consistency check
The square root method, also known as Cholesky decomposition, is a decomposition method suitable for symmetric positive definite matrices. In the Analytic Hierarchy Process (AHP), the judgment matrix is usually constructed as a positive reciprocal matrix, that is, a matrix that satisfies aij = 1/aji. Under certain conditions (such as when the judgment matrix has satisfactory consistency), the judgment matrix can be approximated as a symmetric positive definite matrix and, therefore, can be calculated using the square root method. In addition, the square root method has the advantages of relatively small computational complexity and easy implementation, especially when dealing with small- and medium-sized judgment matrices, its computational efficiency is relatively high. Therefore, in AHP, the square root method is often used as a practical method for calculating eigenvalues and eigenvectors. The single-level sorting is to calculate the weight of the important order of the elements of a certain level and the related elements of the previous level according to the judgment matrix. In this paper, the square root method is used to calculate the maximum eigenvalue and eigenvector of the judgment matrix, thereby determining the relative weight.
(1) Calculate the product M of the elements of each row of the judgment matrix.
M I = j = 1 n a i j   i = 1 , 2 , , n
(2) Calculate the nth root of W i ¯ .
W ¯ i = M i n
W ¯ = W 1 , ¯ W 2 ¯ , , W n ¯ T
(3) Normalize the vector W ¯ to obtain ω i .
ω i = W i ¯ / i = 1 n W i ¯
The eigenvector W = ω 1 , ω 2 , ω n T is obtained, which is the approximate value of the eigenvector and the relative weight of each factor.
(4) Calculate the maximum characteristic root λ max of the judgment matrix.
λ max = i = 1 n A W i n ω i
(5) Carry out a consistency check.
The consistency index CI for calculating the deviation of the judgment matrix is
C I = λ max n / n 1
The consistency ratio CR is:
CR = CI/RI
In the formula, RI is the average random consistency index, and its value is shown in Figure 3.
When CR < 0.1, it is considered that the hierarchical sorting results have satisfactory consistency, and the analysis results are accepted. Otherwise, the judgment matrix should be appropriately modified. Figure 4 shows the hierarchical ranking calculation results of the digital impact assessment structure of the ecological governance system. For each level of elements, use the Seaty scale to compare pairwise elements of the same level to determine their relative importance. Compared to technical compatibility, technical maturity may be considered more important, therefore providing a higher scale value. Organizing the results of pairwise comparisons into a matrix form is called a judgment matrix. The rows and columns of the matrix represent evaluation elements at the same level, and the elements in the matrix represent the importance scale values of row elements relative to column elements.
④ Total Hierarchical Ranking
The overall ranking requires combining the results of each level together to obtain the total weight, then comparing the weights, and finally obtaining the ranking result shown in Figure 5. According to the calculation results of the Analytic Hierarchy Process, organizational factors and technological factors are the two modules that have the greatest impact on the digital construction of the ecological governance system, accounting for 49% and 31% of the weight of the indicator system, respectively. Among the factors of secondary indicators, the necessity of system construction has the highest weight, followed by technological advantages and the urgency and feasibility of construction.

3.2. Air Pollution Digital Early Warning

In the context of the explosion of digital information, the field of ecological environment governance is experiencing unprecedented rapid development, and the power of digitization is particularly significant. This trend not only profoundly affects the protection and management of water environments but also demonstrates enormous potential and value in atmospheric environment governance. Of particular note is the air pollution warning model, which, as an outstanding representative of digital technology in ecological governance systems and is gradually becoming a key tool for improving air quality and safeguarding public health. The air pollution warning model fully utilizes the immediacy and intuitiveness of digital information, which can effectively transform complex pollution situations into easily understandable data and charts, providing valuable reference information for decision-makers. This section will delve into how the model can play a role in atmospheric environmental governance, particularly through specific case studies on how digital technology can be integrated and optimized into the ecological governance system. The three core elements that affect environmental air quality—pollution source emissions, atmospheric physical and chemical processes, and meteorological conditions—have been more finely considered under the digital governance framework. Traditional statistical prediction methods typically consider pollution source emissions as static factors and focus more on the direct impact of weather or meteorological conditions on changes in air quality. By collecting and analyzing environmental air quality data and contemporaneous meteorological observation data, researchers can construct fitting equations or statistical models to predict future trends in air quality. This statistical prediction method is widely favored due to its low computational complexity, low hardware requirements, simple operation, and strong practicality.
x = max x x max x min x
This article constructs a regression model based on normalized datasets and deformation groups. The set of independent variables is represented as x1t, x2t, x3t, …, xkt, where y represents the dependent variable. We started building a regression model on n sets of observations in the time series t. Here, n represents the total number of observations, k represents the number of independent variables, and the condition n ≥ k is satisfied. The observation quantity should not be less than the number of independent variables, which is the basic prerequisite for ensuring that the model has a solution.
y = b + b 1 x 1 + b 2 x 2 + b 3 x 3 + b 4 x 4 + b 5 x 5 + b k x k
Perform the best prediction on the data, obtain the independent variable coefficients (b, b1, b2, …, bk), and establish a mathematical model between the independent variables (x1, x2, x3, …, xk,) and the y deformation effect size. In this study, the highest air temperature, lowest air temperature, average air temperature, precipitation, relative humidity, and average wind speed were selected to establish a multiple regression equation with PM2.5, PM10, and O3, respectively.
y = b + b 1 x 1 + b 2 x 2 + b 3 x 3 + b 4 x 4 + b 5 x 5 + b 6 x 6
Y P M 10 = 1.39 0.7 x 1 + 0.115 x 2 0.291 x 3 0.277 x 4 + 0.000169 x 5 0.293 x 6
Y O 3 = 0.46 + 0.03 x 1 + 0.88 x 2 0.53 x 3 + 0.15 x 4 0.19 x 5 0.07 x 6
where Y is the normalized PM2.5, PM10, O3 forecast value, x1, x2, x3, x4, x5, x6 are the average temperature, maximum temperature, minimum temperature, precipitation, relative humidity, and average wind speed, b, b1, b2, b3, b4, b5, b6 are their corresponding independent variable coefficients.

4. Experimental Design and Analysis

4.1. Data Source

This article explores the impact of environmental regulations on the efficiency of ecological environment governance in coastal areas and constructs an econometric model. The ecological efficiency in the coastal areas is the dependent variable, and the environmental regulations in each province are the independent variables, which have been proven to have a stable relationship with ecological efficiency. As explanatory variables, these factors include industrial structure, per capita income, urbanization level, and investment openness. The data in this paper are selected from 30 provinces, autonomous regions and municipalities directly under the Central Government of China from 2013 to 2023 (excluding Xizang in order to maintain the consistency of indicators and data availability). Using Matlab software (version R2022), we can measure the ecological efficiency super efficiency values in the coastal areas of 30 provinces, autonomous regions, and municipalities in China from 2013 to 2023. The average value is shown in Figure 6.
The results show that in the past ten years, the overall ecological efficiency of China’s offshore areas is between 0.7625 and 1.0134, and the overall trend of volatility changes. Specifically, from 2016 to 2020, the national average offshore eco-efficiency level decreased from 0.9972 to 0.7625, a decrease of 30.78%. From 2013 to 2023, the eco-efficiency values of the coastal areas of the provinces showed a steady upward trend. It has risen by 32.90% in the past six years, which also shows the change in China’s intensive growth from extensive economic growth to “five in one”.
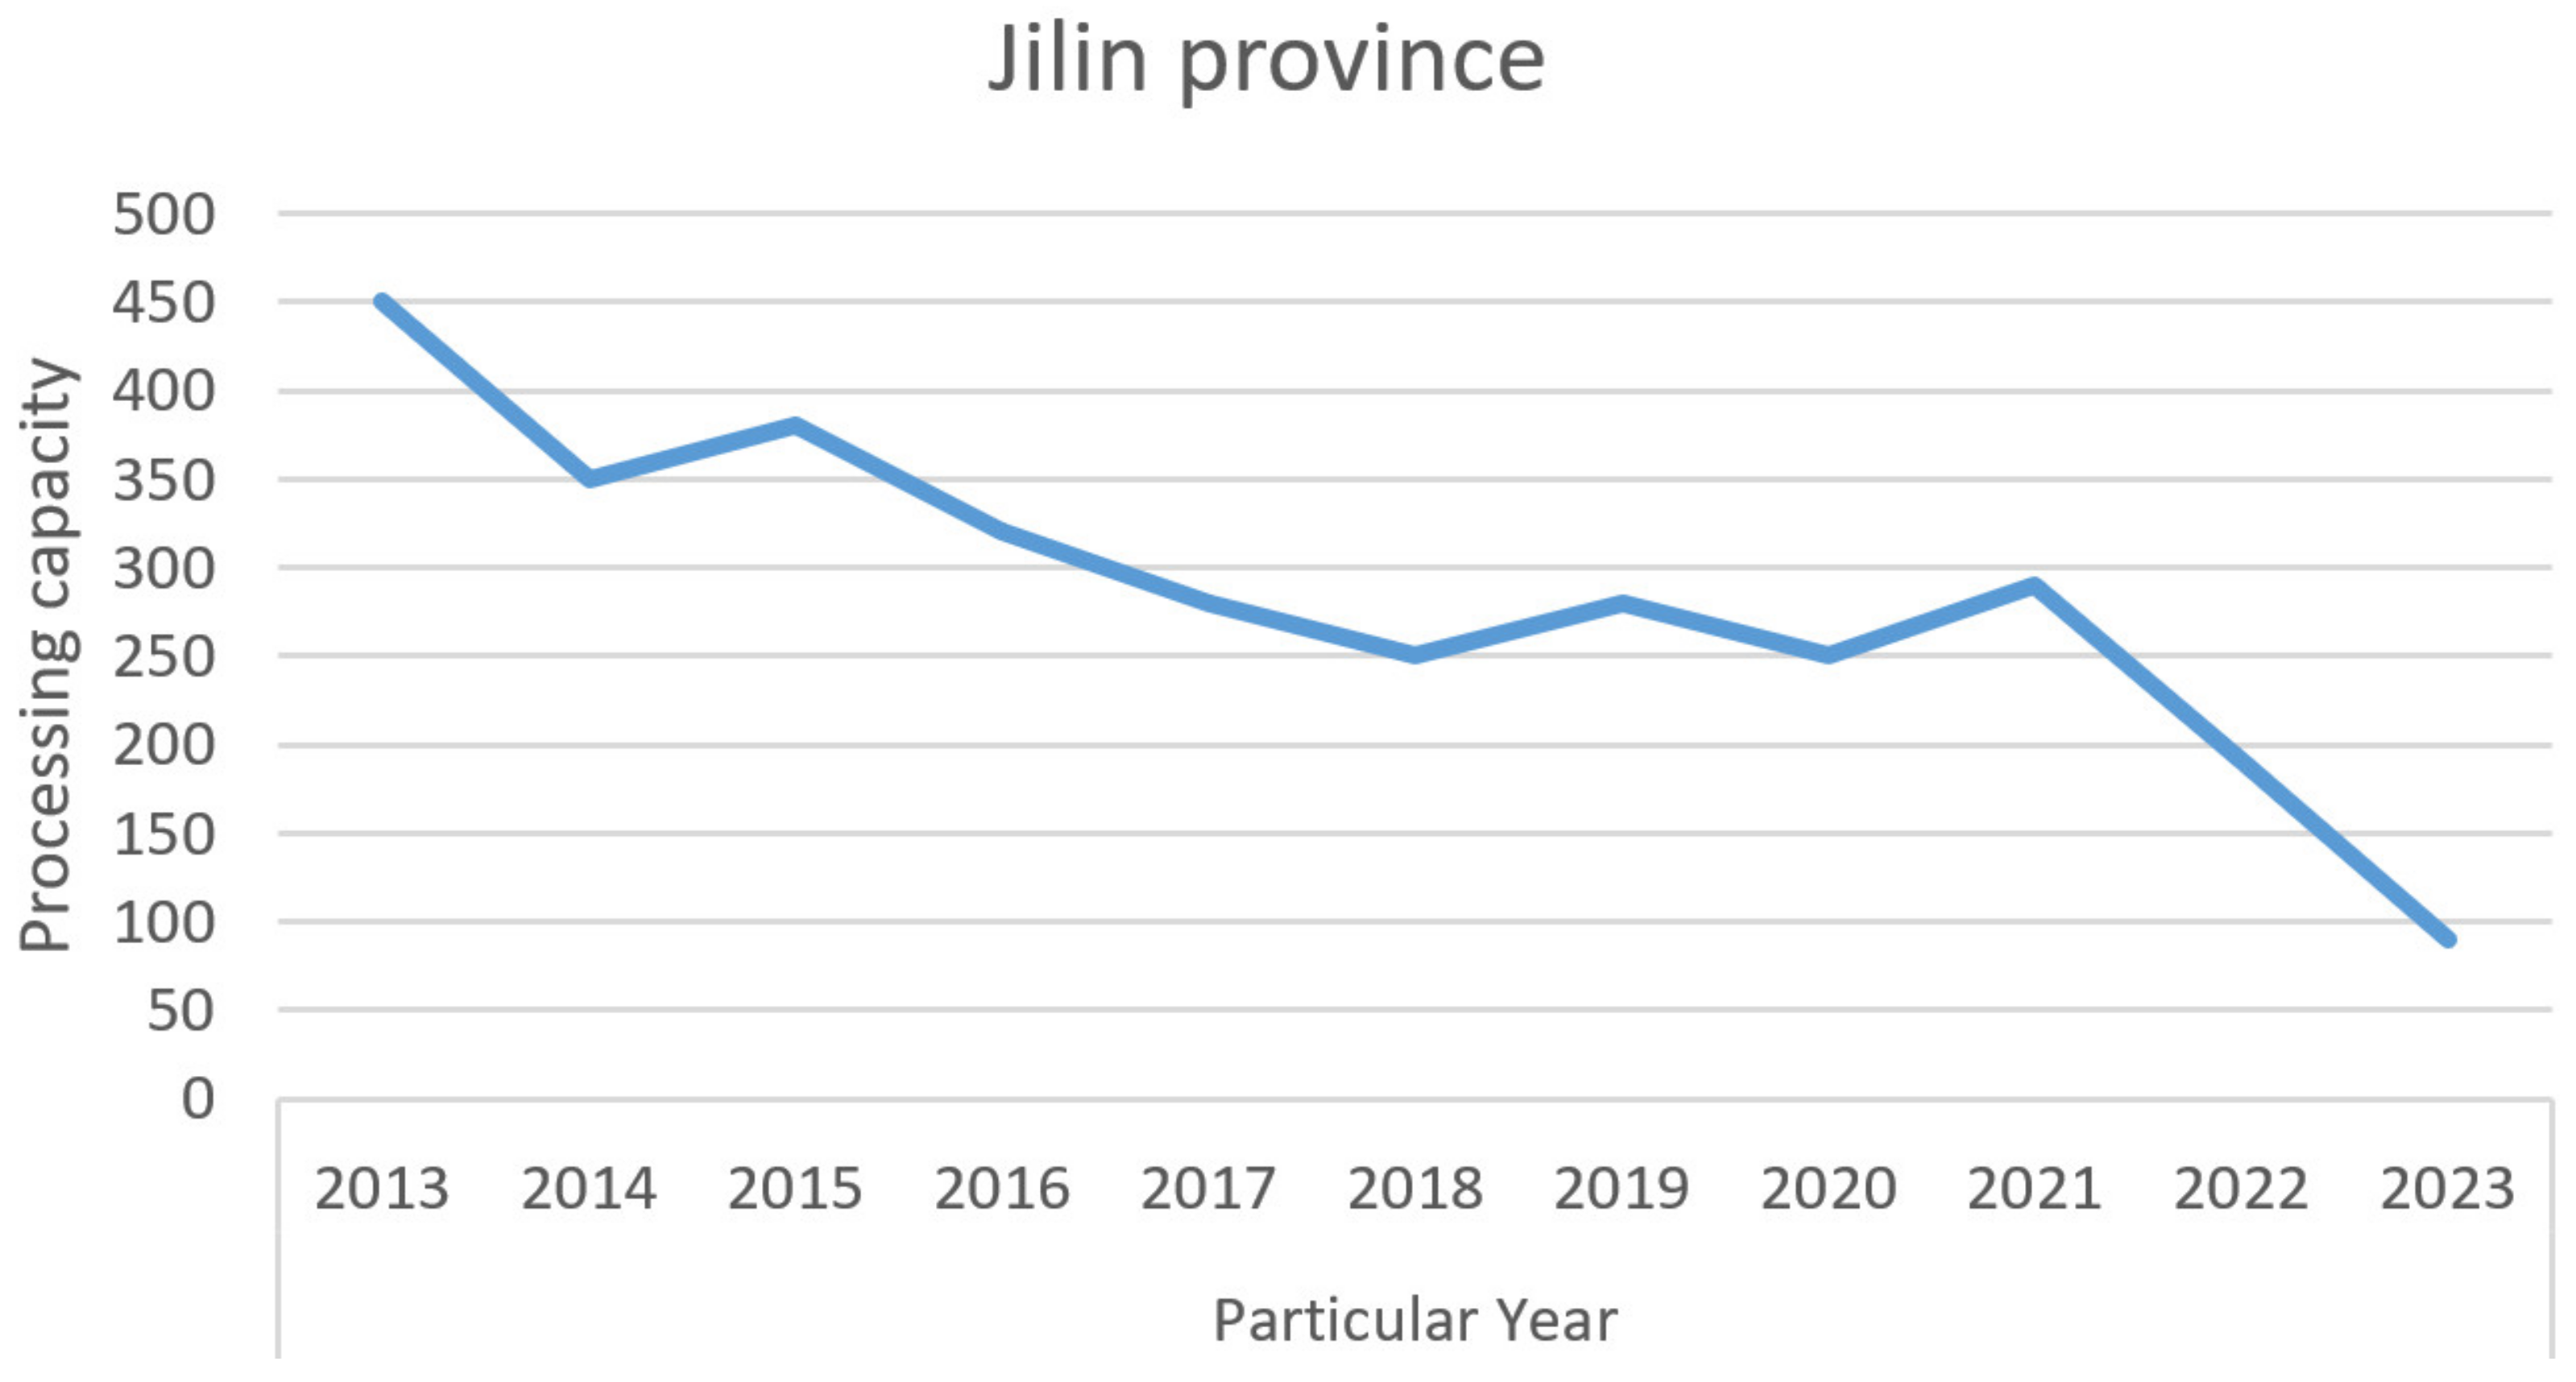
From the perspective of time, the ecological efficiency of the eastern region can be summarized as “stable progress”. Beijing, Shanghai, Guangdong, and other regions have always been in a leading position, and its super efficiency value is always at a high level in the central region, Hubei Province; in 2018, the number 0.4853 jumped to 1.3422 in 2023, an increase of 176.57%, and it is the province with the highest degree of ecological efficiency growth in the central region. The reason is that the domestic garbage disposal index in Hubei Province showed a significant turning point in 2020, and the reduction rate greatly exceeded the same level. At the end of 2018, the total amount of domestic garbage in Hubei Province was 4.258 million tons without harmless treatment, and that of Jilin Province was 4.586 million tons. The value of this indicator is relatively close to the two offshore areas, and the ecological efficiency values of the two offshore areas are relatively close. The same level is comparable to the offshore area, but after 2020, the eco-efficiency values of Hubei Province and Jilin Province began to show a significant gap. In the same year, the amount of domestic waste discharged from Hubei Province dropped from 2.041 million tons in the previous year to 1.0892 million tons, a decrease of half (left and right, as shown in Figure 7 and Figure 8). Therefore, it is speculated that the improvement of the domestic garbage disposal capacity in Hubei Province has an inseparable impact on the improvement of the ecological efficiency of the entire offshore area.

4.2. Data Analysis

The data used in the model are data from 30 provinces, autonomous regions, and municipalities directly under the central government in China from 2018 to 2023. Each cross-section includes six indicators such as eco-efficiency, environmental regulation, per capita income, industrial structure, urbanization rate, and degree of openness in the offshore area that forms a panel data that contains both sections and time series. Therefore, we first determine the form of the panel data, and test the selection of heteroscedasticity, sequence correlation, cross-section correlation, and fixed or random effects. The results are shown in Table 1.
The regression results of Table 2 show that all regional models have heteroscedasticity, sequence correlation and cross-section correlation, and reject the null hypothesis of random effects. Therefore, the FGLS method with fixed effect is used to estimate the panel data. In the A region, there exists heteroscedasticity, non-sequence correlation, and cross-section correlation, and the null hypothesis of random effects are not rejected, so the GLS with random effects is used for estimation. The panel of the B-type area is the same as that of the national region, so the fixed-effect FGLS is also used for estimation. After the selection of the explanatory variables, the setting of the regression equation form, the determination of the panel data, and the selection of the estimation model, the results of estimating the three models using the Stata software (Stata18) are shown in Table 2.
Through simple mathematical calculations, it was found that there is a turning point at 0.002479 in the impact of environmental regulations on ecological efficiency in coastal areas. When the proportion of industrial pollution control investment in each province’s local GDP is less than 0.2479%, the intensity of environmental supervision will increase, and the ecological efficiency of coastal areas will also improve. When the investment ratio for industrial pollution control exceeds 0.2479%, environmental regulations will increase. By observing the investment in industrial pollution control in various provinces, autonomous regions, and municipalities directly under the central government, the average pollution control investment in 30 provinces in 2023 is 0.001192. All nearshore areas have not reached the turning point of ecological efficiency and environmental supervision in nearshore areas. From this perspective, in terms of national environmental regulation, it is beneficial to improve ecological efficiency.
Meanwhile, as we previously speculated, the impact of environmental regulation on ecological efficiency in nearshore areas varies greatly between Type A and Type B regions with different industrial structures. The turning point of environmental regulation on the ecological efficiency value of nearshore areas is 0.001, which is industrial pollution. When the proportion of governance investment is less than 0.1%, environmental regulation has a positive impact on the ecological efficiency of nearshore areas. When it exceeds 0.1%, it may have an inhibitory effect. In Class B, the turning point for environmental regulation of ecological efficiency in coastal areas is 0.000754. The results indicate that when the proportion of industrial pollution control investment is less than 0.0754%, the impact of environmental regulations on ecological efficiency in coastal areas is negative. When the proportion of governance investment is greater than 0.0754%, the impact is positive.

5. Conclusions

Digitization has been widely applied in ecological environment governance, including intelligent water resource management, early warning numerical models, etc. Through data sharing and business interconnection of water services on digital information platforms, intelligent water management provides a basis for water operation decision-makers. The warning numerical model can accurately determine the degree of pollution and warning level, ensuring the timeliness of environmental management plans. Through the evaluation and analysis of the impact of the TOE theoretical framework model on the digital construction of ecosystem governance, organizational factors and technological factors are the two modules that have the greatest impact on system construction, accounting for 49% and 31% of the weight of the indicator system, respectively. Among all factors, the necessity of construction is the most important, followed by technological advantages and the urgency and feasibility of construction. This article constructs a super efficiency model and establishes an environmental protection efficiency index system based on the ecological environment of coastal areas. The results indicate that the overall ecological efficiency of China’s coastal areas has fluctuated between 0.7625 and 1.0134 over the past decade. From 2013 to 2016, the average ecological efficiency level in China’s coastal areas decreased from 0.9972 to 0.7625, a decrease of 30.78%. This also indicates that China’s economic growth has shifted from extensive growth to “five in one” connotative growth. Therefore, China needs to increase environmental supervision efforts to gradually achieve economic and ecological development through adjusting industrial structure and transforming its economic development mode. Although this article constructs a collaborative governance model to study coastal ecological environment protection strategies, there are still some shortcomings. The feasibility and robustness assessment of the model has not been fully completed, so further action can be taken in this regard.

Author Contributions

Conceptualization, T.Z. and K.Z.; methodology, T.Z. and K.Z.; validation, T.Z. and K.Z.; formal analysis, T.Z. and K.Z.; resources, T.Z.; data curation, T.Z.; writing—original draft preparation, T.Z.; writing—review and editing, K.Z.; visualization, K.Z.; supervision, K.Z.; project administration, T.Z.; funding acquisition, T.Z. All authors have read and agreed to the published version of the manuscript.

Funding

This research was funded by the General Project of National Social Science Fund, grant number 22BDJ004; General Project of National Social Science Fund, grant number 24BFX110; Henan Province University humanities and social science youth project, grant number 2025-ZZJH-208; and North China University of Water Resources and Electric Power in the new era of social science research Institute of water control “open list” project, grant number 24JB-03-10.

Institutional Review Board Statement

Not applicable.

Informed Consent Statement

Not applicable.

Data Availability Statement

The raw data supporting the conclusions of this article will be made available by the authors on request.

Conflicts of Interest

The authors declare no conflicts of interest.

References

  1. Kolomboy, F.; Palutturi, S.; Rifai, F.; Saleh, L.M.; Amiruddin, R. Leadership style based on the study of multifactor leadership questionnaire in Palu Anutapura hospital. Gac. Sanit. 2021, 35, S432–S434. [Google Scholar] [CrossRef]
  2. AlNuaimi, B.K.; Singh, S.K.; Ren, S.; Budhwar, P.; Vorobyev, D. Mastering digital transformation: The nexus between leadership, agility, and digital strategy. J. Bus. Res. 2022, 145, 636–648. [Google Scholar] [CrossRef]
  3. Wang, X.C.; Jiang, P.; Yang, L.; Van Fan, Y.; Klemeš, J.J.; Wang, Y. Extended water-energy nexus contribution to environmentally-related sustainable development goals. Renew. Sustain. Energy Rev. 2021, 150, 134–158. [Google Scholar] [CrossRef]
  4. Mirolyubova, T.; Voronchikhina, E. Assessment of the digital transformation impact on regional sustainable development: The case study in Russia. Int. J. Sustain. Econ. 2022, 14, 24–54. [Google Scholar] [CrossRef]
  5. Ren, X.; Zhao, Y.; Wu, L.; Jiang, J.; Zhang, C.; Tang, X.; Han, L.; Zhu, M.; Wang, Z. Towards efficient digital governance of city air pollution using technique of big atmospheric environmental data. IOP Conf. Ser. Earth Environ. Sci. 2020, 502, 12–31. [Google Scholar] [CrossRef]
  6. Fan, Y.; Long, S.; Zhang, R.; Ge, C.; Zhang, Y.; Zhang, Q. Effect Evaluation of Eco-Environmental Big Data Resource Integration and Data Sharing Construction. Wirel. Commun. Mob. Comput. 2022, 12, 245–267. [Google Scholar] [CrossRef]
  7. Kun, Q.; Nan, Y.X. Study on “Internet +” intelligent environmental protection to promote the modernization of environmental governance in Liaoning Province. E3S Web Conf. 2021, 261, 572–589. [Google Scholar] [CrossRef]
  8. Kostka, G.; Zhang, X.; Shin, K. Information, technology, and digitalization in China’s environmental governance. J. Environ. Plan. Manag. 2020, 61, 1–13. [Google Scholar] [CrossRef]
  9. Kruk, S.R.; Kloppenburg, S.; Toonen, H.M.; Bush, S.R. Digitalizing environmental governance for smallholder participation in food systems. Earth Syst. Gov. 2021, 23, 235–268. [Google Scholar] [CrossRef]
  10. Hsu, A.; Yeo, Z.Y.; Weinfurter, A. Emerging digital environmental governance in China: The case of black and smelly waters in China. J. Environ. Plan. Manag. 2020, 63, 14–31. [Google Scholar] [CrossRef]
  11. Figueiredo, I.; Esteves, P.; Cabrita, P. Water wise—A digital water solution for smart cities and water management entities. Procedia Comput. Sci. 2021, 181, 897–904. [Google Scholar] [CrossRef]
  12. Giudicianni, C.; Herrera, M.; Nardo, A.D.; Adeyeye, K.; Ramos, H.M. Overview of Energy Management and Leakage Control Systems for Smart Water Grids and Digital Water. Model. 2020, 1, 134–155. [Google Scholar] [CrossRef]
  13. Arlinghaus, J.C.; Rosca, E. Assessing and mitigating the risk of digital manufacturing: Development and implementation of a digital risk management method. IFAC-Pap. 2021, 54, 337–342. [Google Scholar] [CrossRef]
  14. Bauer, D.; Tyler Leverty, J.; Schmit, J.; Sydnor, J. Symposium on insuretech, digitalization, and big-data techniques in risk management and insurance. J. Risk Insur. 2021, 88, 525–528. [Google Scholar] [CrossRef]
  15. Zhu, X.; Yin, Z.; Liu, Y.; Feng, B.; Wang, Y. Study on Framework Design of Smart Water Management System in Shenzhen. IOP Conf. Ser. Earth Environ. Sci. 2019, 330, 032008. [Google Scholar] [CrossRef]
  16. Choi, Y.H.; Cho, W.S.; Lee, K.H. Big Data Governance Model for Smart Water Management. J. Bigdata 2019, 3, 1–10. [Google Scholar]
  17. Kim, J.H. Accelerating our current momentum toward smart water. Smart Water 2019, 3, 2. [Google Scholar] [CrossRef]
  18. Zhu, Z.; Liu, N.; Li, X.; Yuan, Z.; Wang, G. The status quo and development trend of smart water research. MATEC Web Conf. 2019, 246, 02013. [Google Scholar] [CrossRef]
  19. Liao, J.; Wan, A.T.; He, S.; Zou, G. Optimal model averaging for multivariate regression models. J. Multivar. Anal. 2022, 189, 252–265. [Google Scholar] [CrossRef]
  20. Hesamian, G.; Akbari, M.G. A robust multiple regression model based on fuzzy random variables. J. Comput. Appl. Math. 2020, 143, 270–278. [Google Scholar] [CrossRef]
  21. Ullah, F.; Qayyum, S.; Thaheem, M.J.; Al-Turjman, F.; Sepasgozar, S.M. Risk management in sustainable smart cities governance: A TOE framework. Technol. Forecast. Soc. Change 2021, 167, 476–487. [Google Scholar] [CrossRef]
  22. Kilani, Y. Inspecting the role of Software as a Service (SaaS) in public sector organizations with the extension of technology organization-environment (TOE) framework. Int. J. Bus. Inf. Syst. 2020, 1, 1. [Google Scholar]
  23. Wang, H.; Guo, J. New way out of efficiency-equity dilemma: Digital technology empowerment for local government environmental governance. Technol. Forecast. Soc. Change 2024, 200, 123184. [Google Scholar] [CrossRef]
  24. Yu, J.; Chen, S. The Use of Big Data Analysis in Digital Empowerment of Sustainable Technological Innovation Management of Ecological Enterprises. Environ. Sci. Pollut. Res. 2024, 31, 43956–43966. [Google Scholar] [CrossRef]
  25. Xu, X.; Dai, M. Evaluation of Local Government Digital Governance Ability and Sustainable Development: A Case Study of Hunan Province. Sustainability 2024, 16, 6084. [Google Scholar] [CrossRef]
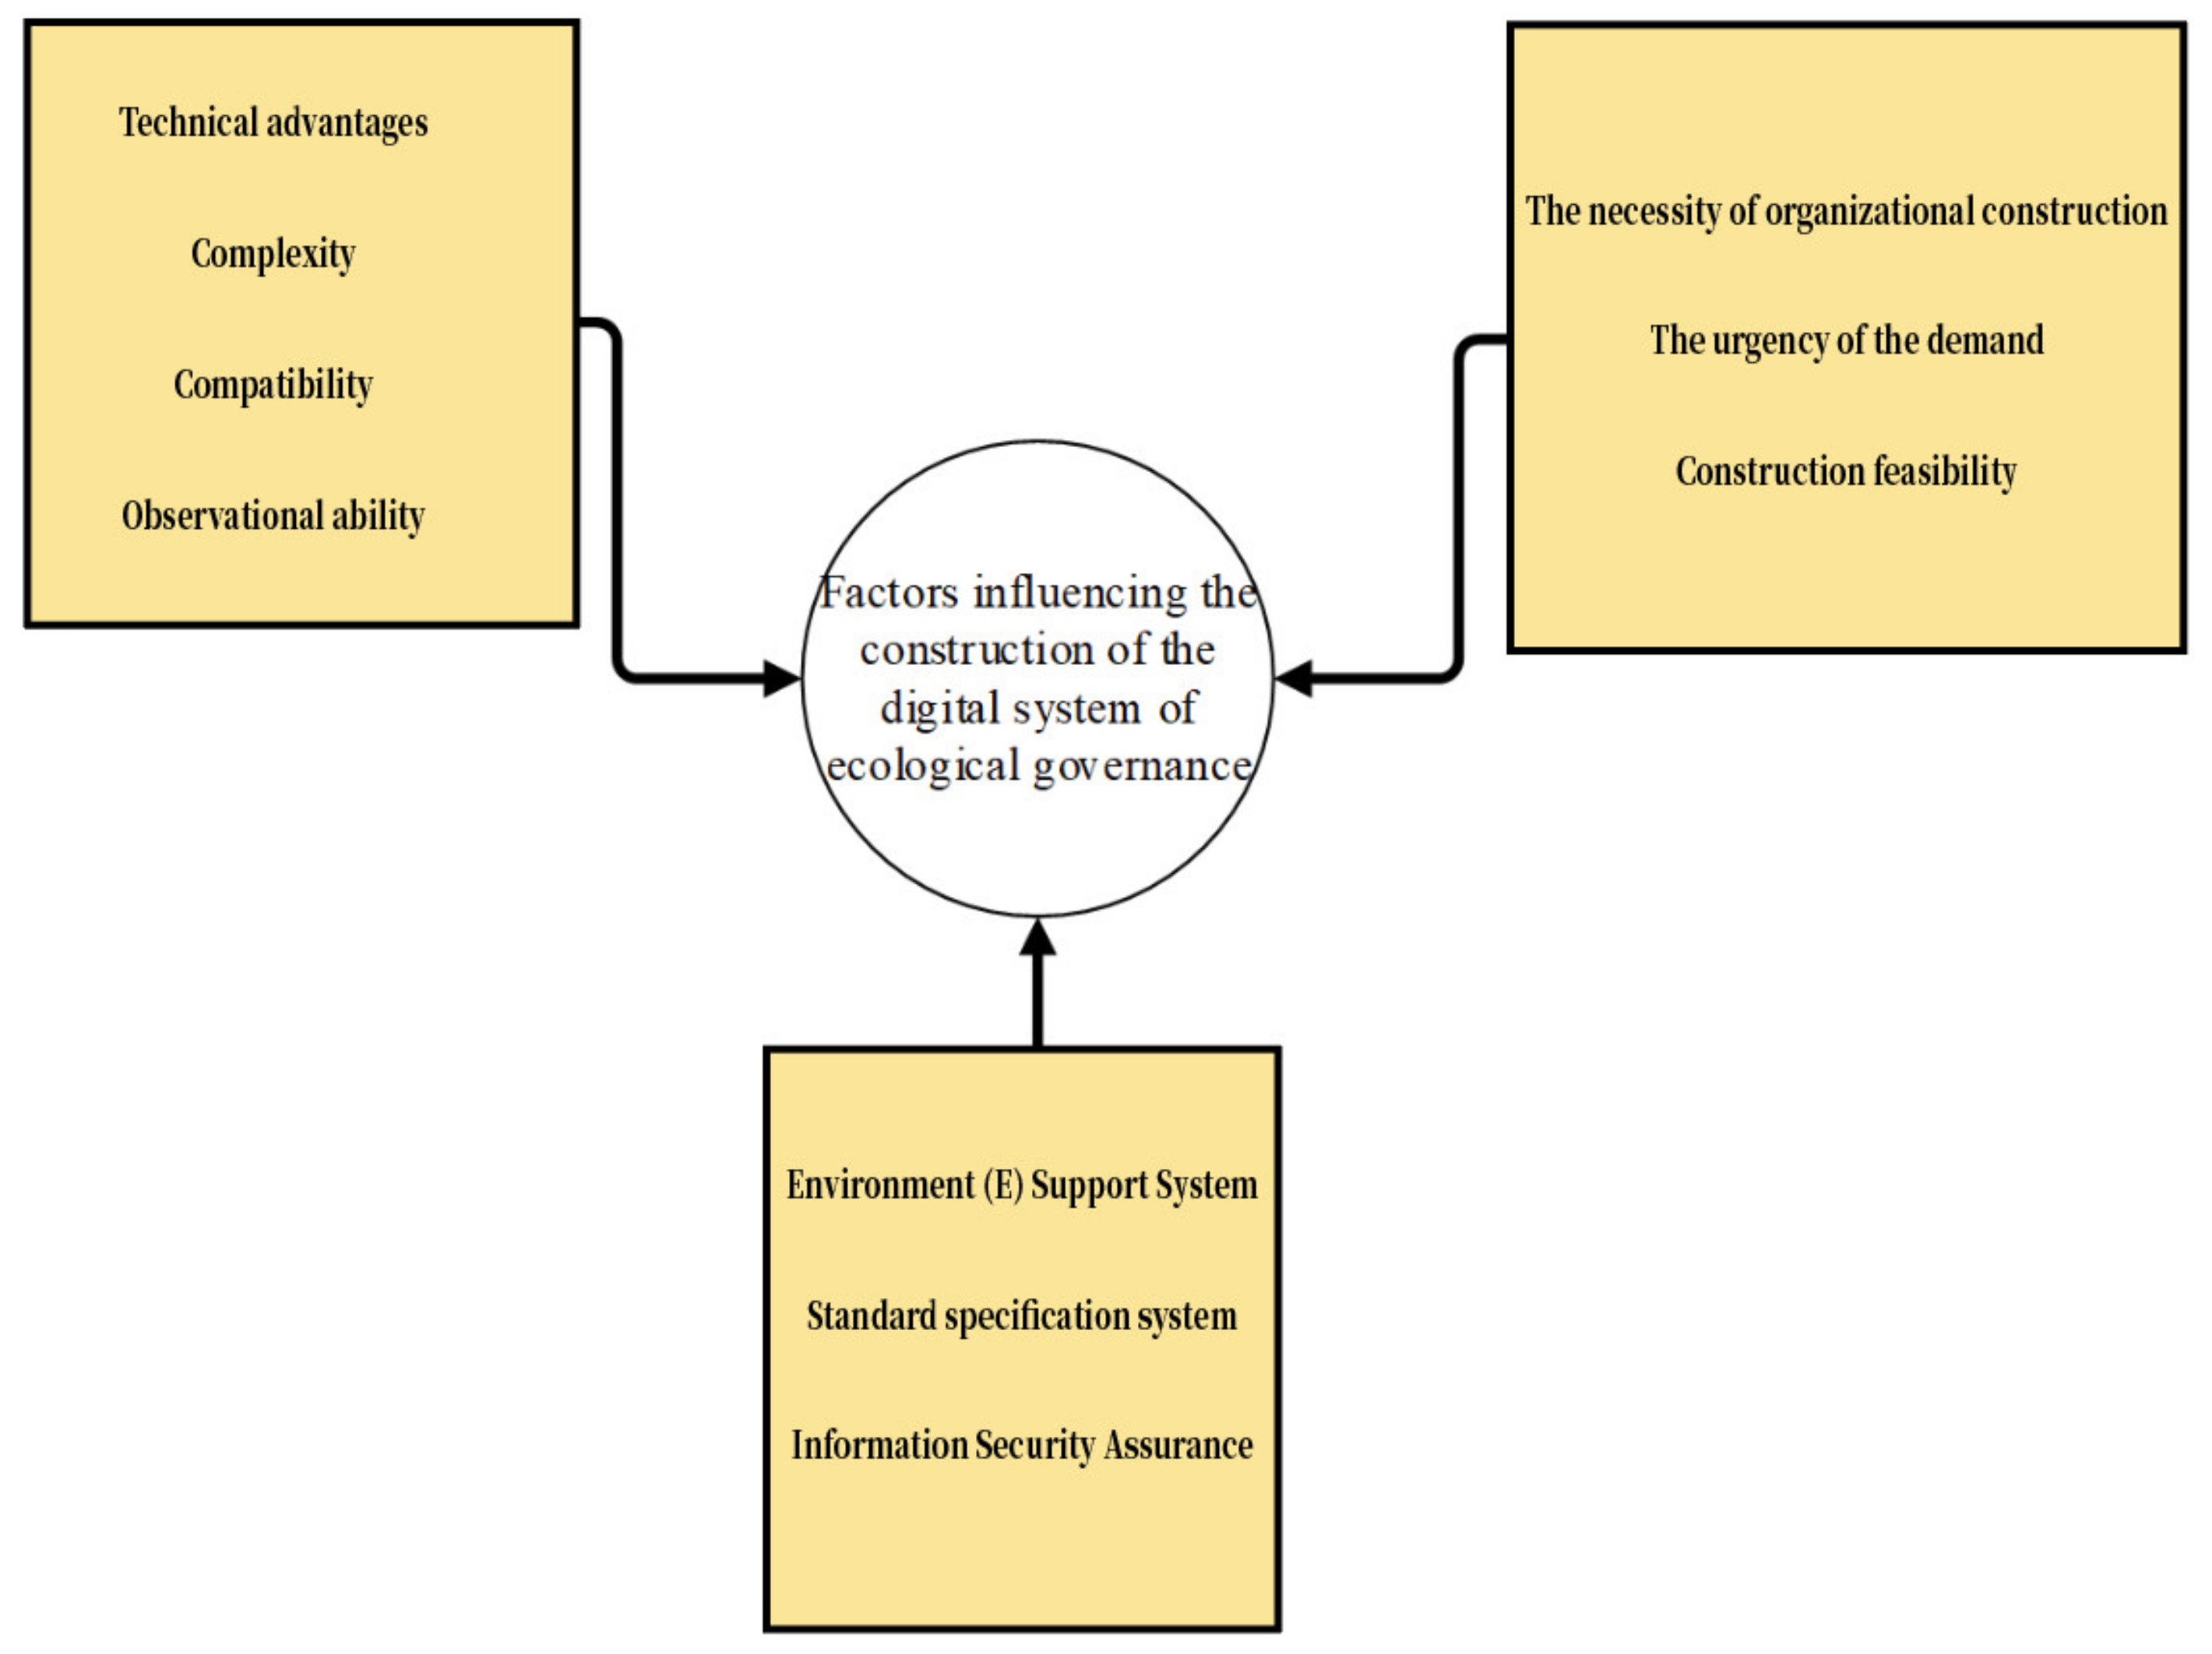
Figure 1. TOE influencing factors framework.
Sustainability 17 01176 g001
Figure 2. Hierarchical evaluation of factors influencing digital construction of ecological environment system.
Sustainability 17 01176 g002
Figure 3. Average random consistency index RI value.
Sustainability 17 01176 g003
Figure 4. Hierarchical single-sorting calculation results.
Sustainability 17 01176 g004
Figure 5. Total hierarchical sorting results.
Sustainability 17 01176 g005
Figure 6. Eco-efficiency value of offshore areas at provincial level in China from 2013 to 2023.
Sustainability 17 01176 g006
Figure 7. Unharmful disposal of municipal solid waste in Hubei Province.
Sustainability 17 01176 g007
Figure 8. Unharmful disposal of domestic refuse in Jilin Province.
Sustainability 17 01176 g008
Table 1. Panel form judgment results.
TestAll AreasClass A AreaClass B Area
BP testProb > chi2 = 0.0000HeteroscedasticityProb > chi2 = 0.0423HeteroscedasticityProb > chi2 = 0.0000Heteroscedasticity
WooldridgetestProb > F = 0.0064Sequence correlationProb > F = 0.1089Non-sequence correlationProb > F = 0.0060Sequence correlation
Pesaran’s testPr = 0.0000Cross-sectional correlationPr = 1.6923Non-cross-sectional correlationPr = 0.0000Cross-sectional correlation
HausmantestProb > chi2 = 0.0000Fixed effectProb > chi2 = 0.2764Random effectsProb > chi2 = 0.0266Fixed effect
ModelFixed-effect FGLSGLS of Random effectsFixed-effect FGLS
Table 2. Regression results.
Regression VariableAll AreasClass A AreaClass B Area
InEKlit−0.595 **−1.550 **−0.302 *
(0.262)(0.670)(0.181)
InEKlit2−0.046 **−0.112 **0.021 *
(0.021)(0.047)(0.013)
GDPit0.001 ***0.0010.000
(0.000)(0.000)(0.000)
GDPit20.001 ***0.0010.000
(0.000)(0.000)(0.000)
Inlndustryit0.528 ***−1.653 ***0.559 ***
(0.130)(0.397)(0.083)
lnUrbanit0.373 ***3.501 ***0.569
(0.115)(0.778)(0.545)
InFDlit0.141 ***−0.1310.121 *
(0.026)(0.140)(0.068)
Note: *, **, *** are explanatory variables that are significant at the 10%, 5%, and 1% levels, respectively.
Disclaimer/Publisher’s Note: The statements, opinions and data contained in all publications are solely those of the individual author(s) and contributor(s) and not of MDPI and/or the editor(s). MDPI and/or the editor(s) disclaim responsibility for any injury to people or property resulting from any ideas, methods, instructions or products referred to in the content.