Article

Research on the Level of High-Quality Urban Development Based on Big Data Evaluation System: A Study of 151 Prefecture-Level Cities in China

School of Public Administration, Nanjing Normal University, Nanjing 210023, China
*
Author to whom correspondence should be addressed.
Sustainability 2025, 17(3), 836; https://doi.org/10.3390/su17030836
Submission received: 28 October 2024 / Revised: 18 December 2024 / Accepted: 16 January 2025 / Published: 21 January 2025

Abstract

:
China’s rapid urbanization has exposed a growing gap between economic growth and development quality, highlighting the urgent need for high-quality urban advancement. This study constructed a comprehensive evaluation system to effectively measure urban growth quality, integrating five key dimensions: innovation, coordination, greenness, openness, and shared development, enhanced by big data analytics. Analyzing data from 151 Chinese cities between 2017 and 2021, we found a consistent improvement in urban development quality and a gradual narrowing of regional disparities. However, significant differences persist between eastern and western cities, with innovation emerging as the primary driver for enhancing urban development quality. These findings suggest that China should intensify investment in innovation, broaden openness, and focus on elevating overall urban development quality while bridging regional gaps.

1. Introduction

Over the past four decades, China’s urbanization rate has surged from 17.92% in 1978 to 66.16% in 2023 [1], reflecting the rapid pace of urban expansion. While this accelerated urbanization has been a key driver of economic growth, it has also exposed deep-rooted challenges that demand urgent attention, including ecological degradation, resource depletion, and growing social inequalities [2], which have sparked widespread concerns regarding the sustainability of urban development. Scholars argue that prioritizing urban scale and economic growth without considering quality leads to a disconnection between economic expansion and residents’ well-being [3]. Urbanization driven solely by land expansion exacerbates ecological pressures, accelerates resource exhaustion, and deepens social disparities [4]. Therefore, China’s urban development must transition from a land-centered approach to a people-centered one [5], focusing on enhancing residents’ quality of life and promoting sustainable, high-quality urban services.
High-quality urban development is no longer an optional consideration but rather an essential prerequisite for sustainable growth. Previous research has indicated that improving the level of high-quality urban development is vital for future urbanization processes and can effectively alleviate issues arising from unbalanced growth [6]. It reflects a broader, more comprehensive development paradigm that seeks to balance economic vitality with environmental sustainability and social harmony [7,8]. This multidimensional approach encompasses factors such as innovation-driven growth, green and low-carbon development, and the enhancement of social governance capabilities [9]. Collectively, these elements contribute to building resilience and enhancing the overall competitiveness of cities in the face of global competition. Therefore, a balanced approach—one that integrates not only economic growth but also urban environmental, social, and cultural dimensions—is crucial for a comprehensive assessment of urban development quality.
This study, based on the context of high-quality urban development in China, constructs a comprehensive evaluation system and analyzes its evolutionary trends. The research has significant practical implications: it helps to further refine the academic understanding of high-quality urban development, addressing gaps in the existing literature, and it provides policymakers with targeted insights for crafting urban development strategies. Moreover, the novelty of this paper lies in its integration of multiple dimensions—including innovation, coordination, and green development—and the use of big data to expand the evaluation dataset, proposing differentiated development pathways suitable for various types of cities. This approach not only enriches the depth of relevant research but also offers practical references for high-quality urban development in the future. The remainder of the paper is organized as follows: Section 2 reviews recent research progress, Section 3 presents the evaluation framework and research methods, Section 4 measures and analyzes development levels, Section 5 explores intrinsic drive, and Section 6 provides conclusions and recommendations.

2. Literature Review

2.1. Conceptual Research on High-Quality Urban Development

From the perspective of sustainable development, some scholars have suggested that sustainable urban development forms the foundation of high-quality urban growth. High-quality urban development not only ensures the sustainability of social, economic, and environmental dimensions [10] but also emphasizes enhancing urban functions, improving residents’ quality of life, protecting the ecological environment, and promoting industrial upgrading [11]. The aim of high-quality urban development is to efficiently, equitably, and sustainably meet people’s growing needs for a better life [12]. From an economic development perspective, some scholars argue that high-quality urban development represents a shift in growth concepts, transformation of growth models, and attention to livelihood standards, relying on factors such as the quality of elements, innovation dynamics, and technological advancement [13]. The goal is to enhance development quality through the efficient use of resources and the protection of the environment while improving the quality of people’s lives [14]. Additionally, scholars focusing on new urbanization argue that the connotation of high-quality urban development lies in the organic combination of high-quality city construction, infrastructure, public services, living environment, urban management, and citizenization [15]. Specifically, it includes changes in population lifestyle and ideology, transformation of economic development modes, industrial upgrading and structural optimization, equalization of infrastructure and public services, and improvement in people’s living standards [16]. It aims to improve population quality and residents’ quality of life, making cities livable places with high standards.
While these studies provide a comprehensive understanding of what constitutes high-quality urban development, they tend to be conceptual and lack concrete frameworks for measuring or operationalizing these concepts. Additionally, many existing studies focus on broad principles without offering a systematic evaluation of how different urban characteristics (such as innovation, coordination, and shared development) contribute to high-quality development. Furthermore, regional disparities and the impact of technological advancements, particularly in developing regions, are often not explored in depth.

2.2. Research on Evaluation Systems for High-Quality Urban Development

Scholars have explored the construction of evaluation systems for high-quality urban development from various perspectives. Firstly, from the perspective of resident satisfaction, some scholars have highlighted that current urban development must address issues related to the environment, transportation, and public resource supply [17], emphasizing a people-centered approach to align objective development with residents’ subjective experiences [18]. They have designed evaluation systems including innate urban endowment, business environment, governance capability, living environment, population development, economic growth, spatial development, social progress, and coordinated development. Empirical analysis has shown that urban development still faces challenges in areas such as housing, income, and spatial planning [19]. Secondly, from the perspective of socio-economic development, some scholars have constructed evaluation systems based on principles like the new development philosophy [20] and complex ecosystems [21] to study the distribution of development levels across different regions, such as the Yellow River basin, identifying significant differences among upstream, midstream, and downstream cities, with administrative rank and locational conditions having a direct impact [22]. Other scholars focus on high-quality development research on central cities within urban agglomerations and cities in western China [23,24,25,26]. Thirdly, from the perspective of urban governance, some scholars argue that high-quality development requires not only hardware support like space and infrastructure [27] but also efficient coordination between hardware and software elements within the urban governance system [28], aligning it with urban residents’ needs, industrial development, and equal access to public services [29].
The existing evaluation systems often focus on isolated aspects of urban development (e.g., governance, economic growth, or quality of life) without considering the interplay between these dimensions. While useful, many evaluation frameworks remain fragmented and may not fully capture the complexity of high-quality urban growth. The challenge of addressing regional disparities is also a recurring theme, but few studies offer actionable recommendations for narrowing these gaps. Furthermore, the application of these evaluation systems remains relatively static, with little focus on incorporating dynamic, real-time data or predictive analytics.

2.3. Big Data Applications in Related Evaluation Systems

With the rise of data-driven technologies such as the internet, cloud computing, and 5G, big data has shown substantial advantages in achieving “data democratization” [30], promoting “indicator updating” [31], and improving “result reliability” [32]. Big data has been recognized as instrumental in enhancing the efficiency, effectiveness, and legitimacy of governance processes [33]. For instance, in economic development research, MIT’s “Billion Prices Project” gathers over 500,000 product price data points daily to calculate online price indices across 20+ countries [34,35]. In policy evaluation, scholars have proposed using big data for precision identification, analysis, and evaluation to enhance the effectiveness of poverty alleviation efforts [36,37]. In urban development assessments, big data technologies like mobile signaling [38], nighttime lights [39], and earth observation [40,41] have been applied to evaluate aspects like urban population vitality, livability, and sustainability [42], showing promising results.
While the use of big data in urban development research is promising, its application in the context of high-quality urban growth remains underexplored. Most existing studies focus on isolated indicators (e.g., economic activity, population movements) rather than integrating these insights into comprehensive evaluation systems. Additionally, there is limited research on how big data can be used to address regional disparities in urban development or improve governance and coordination between different urban sectors. Moreover, the use of big data raises concerns about privacy, data quality, and the representativeness of the data, which have not been adequately addressed in current studies.
In summary, this study endeavors to establish a multidimensional assessment framework that integrates five critical urban development dimensions, thereby offering a comprehensive approach to evaluating high-quality urban growth. By leveraging big data analytics, the framework provides data-driven insights into urban development, enhancing the accuracy and relevance of the evaluation process. Ultimately, the investigation into regional disparities between cities offers valuable policy implications for addressing these gaps and fostering more balanced development.

3. Evaluation System and Methodology

3.1. Evaluation System Construction

3.1.1. Innovation Dimension

Innovation is the core driving force for high-quality urban development. This dimension measures the potential for growth through four secondary indicators: economic foundation, market vitality, technological innovation, and talent environment. For instance, economic development is assessed using indicators like the number of brand stores and listed companies per capita, while technological innovation is evaluated based on the number of patents, R&D expenditure as a percentage of GDP, and the number of high-tech enterprises per capita.

3.1.2. Coordination Dimension

Coordination is an intrinsic requirement for high-quality development, reflecting the balanced growth of regional areas, cultural harmony, and employment. This dimension uses indicators such as income disparities between urban and rural residents and the variability of nighttime lights, which indicate regional development differences.

3.1.3. Green Dimension

Green is the fundamental premise of high-quality development, assessing environmental quality, pollution management, and energy conservation. This dimension includes indicators like per capita green space and PM2.5 levels to evaluate environmental conditions, as well as metrics like waste treatment rates to assess environmental management.

3.1.4. Openness Dimension

Openness is a significant focus of high-quality urban development, measuring the extent of external engagement, including trade, foreign investment, and international accessibility.

3.1.5. Sharing Dimension

Sharing assesses the actual living standards of citizens, covering aspects like education, healthcare, transportation, housing, and eldercare. Indicators include the number of schools, healthcare facilities, public transit convenience, and eldercare services per capita. See Table 1 for details.

3.2. Data Sources and Research Methods

This study includes 151 cities, comprising four municipalities, 27 provincial capitals, major cities, and economic hubs. Data were sourced from web-based open data, statistical yearbooks, and proprietary databases (Table A1, Appendix A). Missing values were supplemented through interpolation, and some data underwent weighted calculations.

3.2.1. Entropy Weight Method

The entropy weight method is used to reduce subjectivity in evaluating high-quality urban development. The process includes normalizing data, calculating proportional values, and determining entropy weights, allowing for objective measurement of the information value conveyed by each indicator. The specific steps are as follows:
The first step is the standardization of the indicator data to eliminate the vector direction and numerical dimension of the indicator:
Forward Formula:
x i * = x i x m i n x m a x x m i n
Inverse Formula:
x i * = x m a x x i x m a x x m i n
Among them, x i * represents the normalized index value, x i represents the original third-level index value, x m i n represents the minimum value of the index value, and x m a x represents the maximum value of the index value.
The second step is to calculate the weight of the i th indicator value of the j th indicator, f i j :
f i j = x i * i = 1 n x i *
The third step is to calculate the corresponding entropy value of the index, e i :
e i = k i = 1 n f i j ln f i j ,   k = 1 ln n
The fourth step is to calculate the entropy weight corresponding to the index, θ i :
θ i = 1 e i n i = 1 n e i

3.2.2. Dagum Gini Coefficient Decomposition

This method was used to analyze spatial disparities in urban development, breaking down overall Gini coefficients into intra-regional, inter-regional, and trans-regional contributions, thereby addressing the limitations of traditional Gini coefficients and Theil indexes. The specific formula is as follows:
G = j = 1 k h = 1 k i = 1 n j γ = 1 n h y j i y h r 2 n 2 μ
Among them, y j i and y h r are the indicators of urban high-quality development level of cities in items j and h , μ is the average level of high-quality development of all cities in a certain region, k is the number of regions, n is the number of cities, and n j and n h are the number of cities in j and h regions.

3.2.3. Variance Decomposition

Variance decomposition was employed to explore structural causes of disparities in urban development levels, identifying the main factors contributing to observed differences. The derivation process is as follows:
v a r Y = c o v Y , X 1 + X 2 + + X 5 = c o v Y , X 1 + c o v Y , X 2 + + c o v ( Y , X 5 )
Divide both sides by v a r Y and obtain the following:
1 = c o v Y , X 1 v a r Y + c o v Y , X 2 v a r Y + + c o v Y , X 5 v a r Y
where v a r stands for variance and c o v stands for covariance. In the above formula, the causes of the city’s high-quality development level are decomposed into five dimensions, and the contribution share of each dimension to the city’s high-quality development level is measured.

3.2.4. Kernel Density Estimation

This study used kernel density estimation to characterize the dynamic evolution of development levels, employing a Gaussian kernel to depict the distribution features of high-quality urban development across time and regions. The distribution position of the kernel density estimation map reflects the level of high-quality development. The distribution morphology shows the regional differences and the degree of polarization, where the peak height and width reflect the magnitude of the sample differences, while the number of peaks shows the degree of spatial polarization. The formula is as follows:
f x = 1 N h i = 1 N K ( X i x h )
K ( x ) = 1 2 π e x p ( x 2 2 )
where N is the number of observations, X i is the independent and identically distributed observations, x is the mean, h is the bandwidth, and K is the kernel function.

4. Quality Measurement and Analysis

4.1. Comparison of High-Quality Urban Development Levels

4.1.1. Overall Comparison

Based on the above urban quality measurement methods, this study calculated the comprehensive quality scores of 151 cities at and above the prefecture level in China from 2017 to 2021. The cities were categorized into four regions: Eastern (Beijing, Shanghai, Tianjin, Shandong, Hebei, Jiangsu, Zhejiang, Fujian, Guangdong, Hainan), Central (Shanxi, Anhui, Jiangxi, Henan, Hubei, Hunan), Western (Inner Mongolia, Gansu, Ningxia, Qinghai, Tibet, Sichuan, Chongqing, Guangxi, Yunnan, Guizhou, Xinjiang), and Northeastern (Liaoning, Jilin, Heilongjiang). The average high-quality development levels of cities in these regions are shown in Figure 1.
The results indicate the following: (1) From an overall perspective, the high-quality development level of cities showed a steady upward trend from 2017 to 2021, with the national average increasing from 0.144 to 0.178, indicating steady progress in promoting high-quality urban development. With the deep implementation of strategies like the rise of the central region [43] and the development of the western region [44], the position of cities in these regions in achieving high-quality development has become increasingly prominent. However, the growth rate in northeastern cities significantly lagged behind other regions, showing a slowing trend, possibly due to issues like population outflow [45] and slow industrial transformation [46]. (2) In terms of differences between eastern and western regions, high-quality urban development has consistently shown an “east-high, west-low” pattern, with eastern cities maintaining a high level and western cities remaining relatively low. Since the beginning of the new century, eastern cities have started high-quality development earlier, with a strong foundation, playing a “pioneering” role, whereas the western regions started later with weaker development fundamentals. (3) Regarding north–south differences, high-quality urban development has shown a “south-fast, north-slow” pattern, with the development level of southern cities increasing faster than that of northern cities, resulting in an expanding north–south gap. (4) From the perspective of development urgency, the differences between the north and south are more related to the phase of industrial differentiation [47], whereas the east–west differences are mainly due to the long-term imbalance in resource distribution [48]. Therefore, despite the evident north–south differentiation, narrowing the east–west gap remains a key point for achieving more balanced and sufficient high-quality development.

4.1.2. Comparison of Development Dimensions

This study further analyzed the evolution characteristics of various dimensions of high-quality urban development, with the results shown in Figure 2. (1) Overall, the five dimensions of high-quality urban development exhibit a “four-up, one-down” trend, with the openness dimension showing a declining trend, in contrast to the consistent rise in other dimensions. This decline is mainly influenced by the dual pressures of a slowing global economy and rising domestic labor costs, which have led to reduced export volumes. (2) Spatially, there is a “strong-east, weak-west” pattern in all dimensions. Eastern cities lead significantly in innovation, coordination, green development, and openness but lag in shared development. This disparity is primarily due to the population size in the east, resulting in lower per capita shared development factors, whereas northeastern cities, with smaller populations, exhibit relatively high shared development levels. (3) In terms of changes over time, innovation, coordination, and shared development dimensions experienced a significant turning point around 2020, with development speed slowing or even declining in some cases. This is primarily attributed to the impact of the COVID-19 pandemic, which caused increased unemployment, economic recession [49], and reduced social welfare [50], severely impacting urban socio-economic factors.

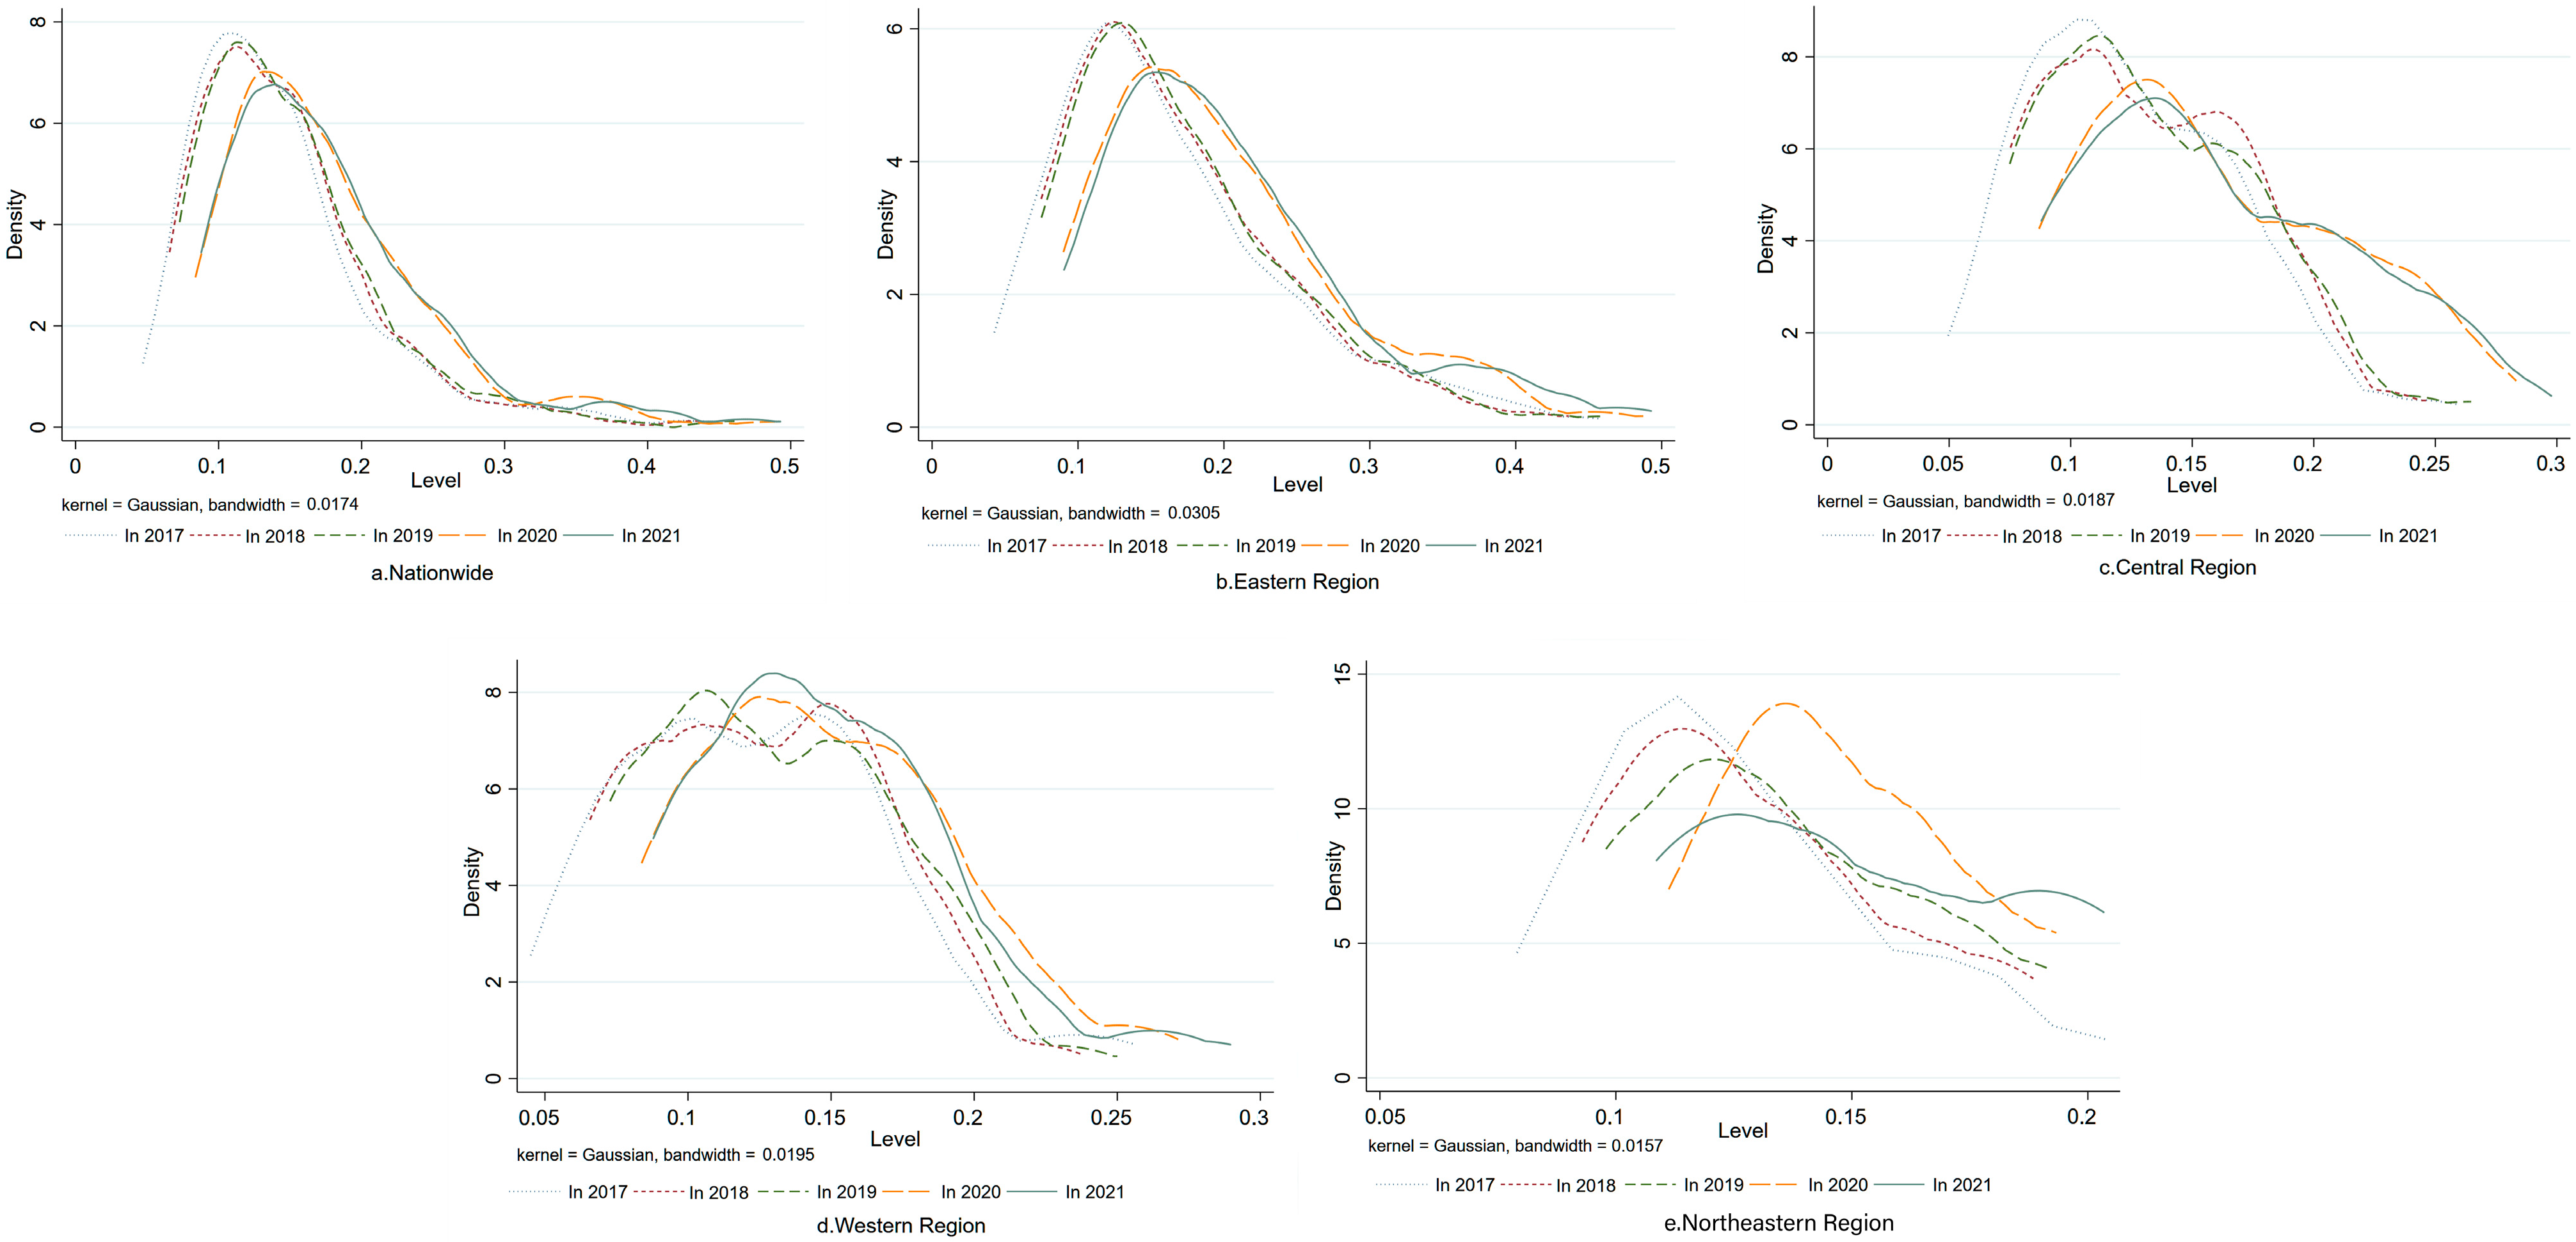
4.2. Dynamic Evolution Characteristics of High-Quality Urban Development Levels

This study used the kernel density estimation method, selecting a Gaussian kernel function to analyze the distribution characteristics of the high-quality development levels of cities across China from 2017 to 2021. The resulting kernel density curves are shown in Figure 3.
The results indicate the following: (1) From 2017 to 2021, the kernel density curves for the high-quality development levels of cities nationwide and in the eastern, central, and western regions all showed significant rightward shifts, indicating a dynamic process of growth from low levels to higher levels of development. The high-quality development levels of cities in all regions improved significantly during the sample period. (2) The kernel density curves for the eastern region showed minimal changes in peak height and width, indicating little change in the overall disparity in high-quality development levels within the region. The central region exhibited a transition from steep to flatter peaks, with wider opening widths and an extended right tail, suggesting increasing disparity in development levels. In contrast, the western region displayed a transition from a flat to a steep peak, with narrower opening widths and a transition from double peaks to a single peak, indicating a reduction in polarization and a narrowing disparity in high-quality development levels.

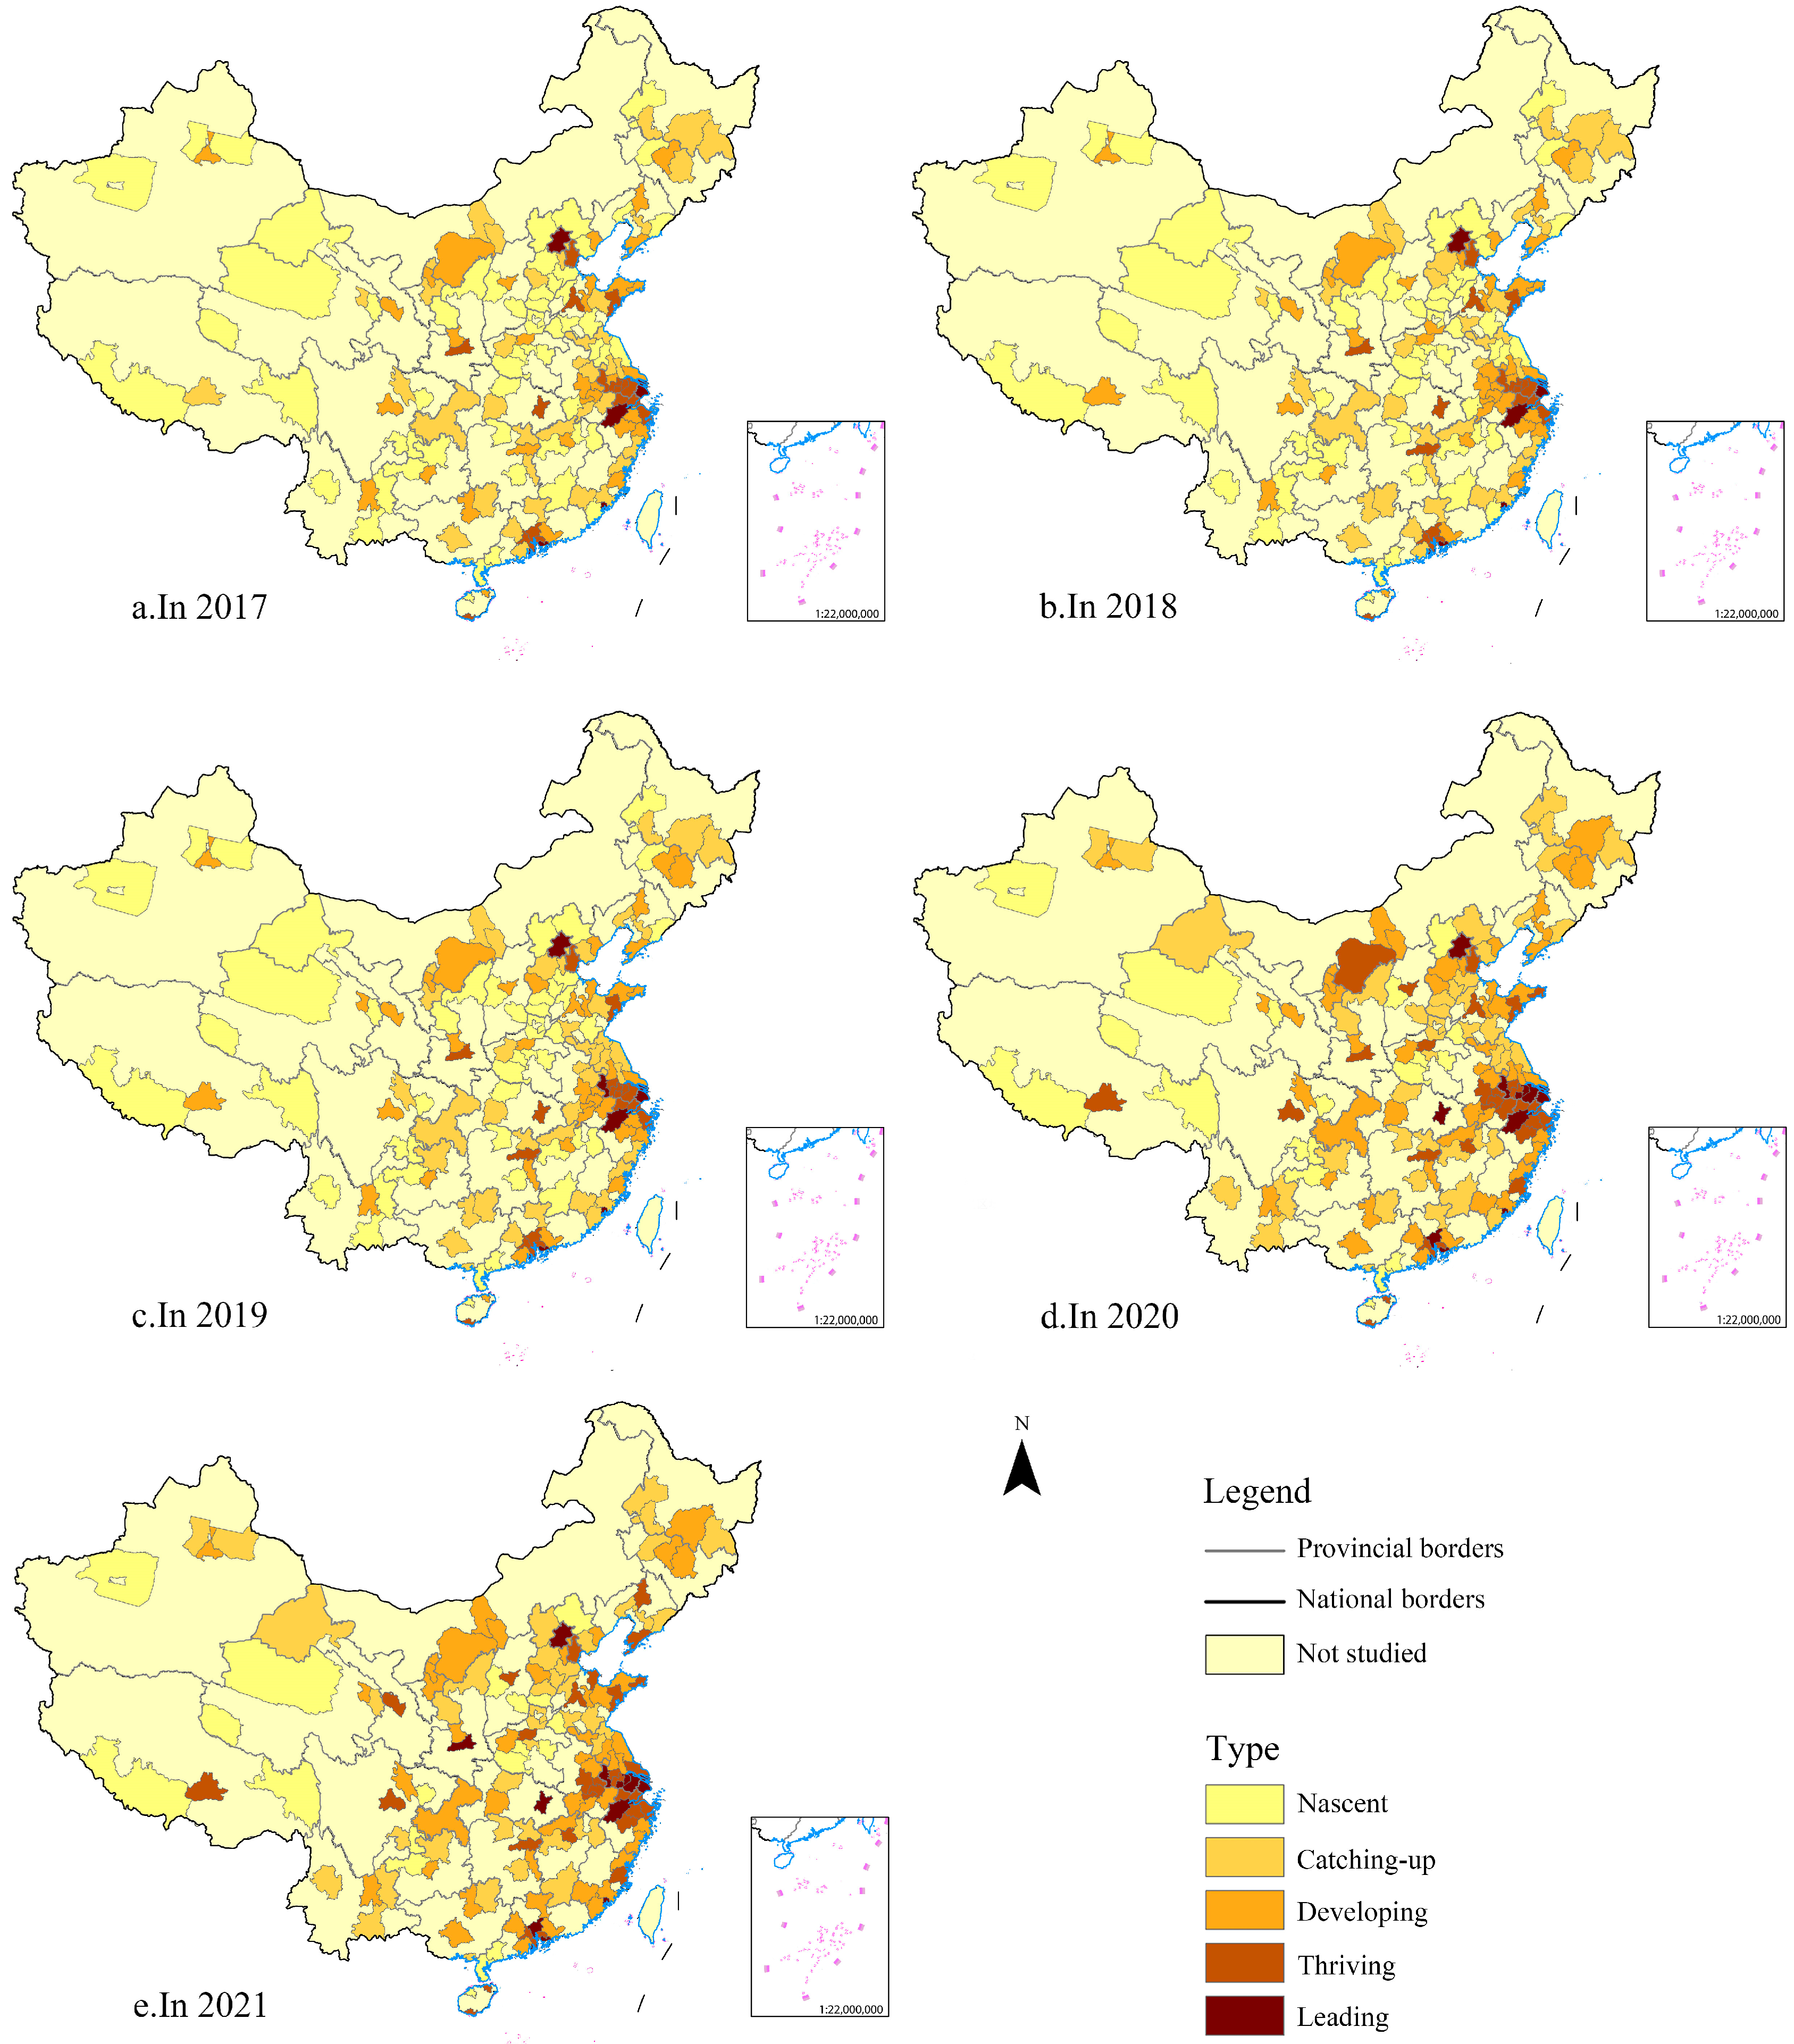
4.3. Classification and Spatial Distribution of High-Quality Urban Development Levels

Using the natural breaks method [51], the cities are classified based on their high-quality development levels into five types: initial development (–0.107), catch-up (0.107–0.145), developing (0.145–0.196), burgeoning (0.196–0.281), and leading (0.281–). The “initial development” type represents cities with relatively low levels of high-quality development, while “catch-up” cities have entered a new stage of development, though imbalances and insufficiencies remain. “Developing” cities exhibit balanced and adequate growth, with high-quality development advancing rapidly. “Burgeoning” cities demonstrate a high level of development, transitioning towards the leading type, while “leading” cities are at the forefront of high-quality development, serving as regional pioneers. Figure 4 shows the spatial distribution and evolutionary trends of cities by development type from 2018 to 2021.
The results indicate the following: (1) Overall, the distribution of cities of different development types follows a clear spatial gradient from east to west. “Leading” and “burgeoning” cities are mainly located in the eastern region, while cities in the central and western regions are mostly classified as “initial development” and “catch-up”. This result suggests that the spatial distribution of high-quality urban development in China remains largely consistent with economic development, with disparities between eastern and western regions continuing to shape the distribution of high-quality development levels. However, these disparities are not merely the result of geographical location or economic status but are deeply influenced by several underlying factors, including policy direction, industrial structure, resource endowments, and talent mobility. For example, the eastern region has benefited from stronger policy support, better industrial infrastructure, and a higher level of resource utilization efficiency, which have fostered more rapid urban development. In contrast, the central and western regions face challenges such as a relatively less favorable industrial base and lower levels of talent retention and mobility, which contribute to slower development. Addressing these imbalances requires not only enhancing the economic capabilities of underdeveloped regions but also implementing more targeted policies that focus on improving local governance, industrial upgrading, and human capital development. (2) Specifically, “leading” and “burgeoning” cities are characterized by contiguous distribution in the eastern region, while they are more sporadically distributed in central cities like Wuhan, Hefei, Changsha, and Zhengzhou, as well as only a few resource-based cities like Chengdu and Lhasa in the west. The distribution reflects the weaker comprehensive development capacity of cities in the central and western regions. A detailed analysis of these areas suggests that the lag in development in the central and western regions can be attributed to factors such as limited access to high-end industries, underdeveloped infrastructure, and less efficient resource utilization. Furthermore, talent mobility plays a crucial role: the eastern regions have established themselves as hubs of innovation and economic dynamism, attracting skilled professionals and entrepreneurs, while the central and western regions struggle to retain talent, exacerbating the development gap. (3) From the perspective of temporal evolution, the development levels of cities like Hefei, Wuhan, and Changsha in the central region have improved significantly, whereas growth in northeastern cities remains slow. This trend is influenced by various factors, including regional policy shifts, industrial upgrading, and changes in market conditions. In particular, Hefei, Wuhan, and Changsha have benefited from targeted government policies aimed at fostering high-tech industries and improving regional infrastructure, contributing to their rapid development. On the other hand, northeastern cities have faced more structural challenges, such as the decline of traditional industries and slower adaptation to new economic trends. Eastern cities continue to experience rapid growth in high-quality development, suggesting that they remain stable growth poles for urban development in China. However, the persistent gap between these regions highlights the need for more nuanced policy interventions that take into account the specific needs and challenges of different regions.

5. Sources of Disparities and Economic Consistency

5.1. Regional Sources of High-Quality Urban Development Disparities

The Dagum Gini coefficient decomposition method was used to analyze the regional disparities in high-quality development levels of cities across China from 2017 to 2021, with the results shown in Figure 5. The overall and intra-regional disparities in high-quality urban development levels across China and within regions showed a steady downward trend, with regional coordination strategies contributing to a reduction in disparities.
(1)
Within regions, the Gini coefficient was highest in the eastern region and lowest in the northeastern region. The central and western regions crossed paths in 2019, with the central region surpassing the western region in Gini coefficient values. As a result, the current ranking of intra-regional Gini coefficients from high to low is eastern, central, western, northeastern.
(2)
From 2017 to 2020, the inter-regional Gini coefficient showed an overall downward trend, but from 2020 to 2021, it exhibited an abnormal increase, likely due to the pandemic-induced differences among regions. The largest disparities were observed between the eastern and western regions, while disparities between the northeastern and western regions, and between the northeastern and central regions, were smaller. This reflects the strong catch-up momentum of central and western cities, though significant disparities between the eastern and western regions remain.
(3)
The intra-regional disparity contribution ranged between 33% and 34%, while the inter-regional disparity contribution ranged between 30.2% and 34.5%, with similar magnitudes of contribution. Both contributions crossed paths around 2020, indicating that disparities exist both within and between regions. These disparities are influenced by factors such as provincial vs. non-provincial cities, capital cities vs. non-capital cities, and central vs. peripheral cities, leading to the formation of regional differences in high-quality urban development across China. The super-density contribution ranged between 32% and 36%, with an average contribution rate of 34.2%, indicating that spatial overlap among cities also plays a role in shaping disparities.

5.2. Structural Sources of High-Quality Urban Development Disparities

This study decomposes high-quality urban development into five dimensions: Innovation, Coordination, Green, Openness, and Sharing, using variance decomposition to reveal the contributions of each dimension to disparities in urban development levels across China and within regions. The results are shown in Figure 6.
Innovation, Green, and Sharing are the main structural sources of disparities in high-quality urban development, with average contribution rates of 37.82%, 21.9%, and 16.84%, respectively. Coordination had the lowest contribution, with an average rate of only 10.04%. From a dynamic perspective, Innovation and Green remained stable, while Openness and Coordination showed a marked decline, and the contribution of sharing increased.
In the eastern region, disparities in high-quality development were similar to those at the national level, with Innovation and Sharing being the largest contributors, and Coordination the smallest. Innovation played an especially dominant role, with a growing trend. In contrast, in the central region, Innovation had a lower contribution, with average contributions as follows: Innovation (32.23%), Sharing (21.6%), Green (20.72%), Coordination (13.18%), and Openness (12.27%), with Sharing showing a downward trend. In the western region, disparities were mainly due to Sharing, with Openness contributing the least. The northeastern region had the most balanced sources of disparity, with no clear low-contributing dimension, although Green and Openness remained relatively weaker.

5.3. Consistency Between High-Quality Urban Development and Economic Development

Using 2021 as an example, this study employed the Bland–Altman analysis method to examine the consistency between the rankings of urban high-quality development and per capita GDP (Figure 7). The findings reveal that, within the 95% confidence interval, a high degree of consistency exists between the two. Based on their differences, cities are classified into five types: highly advanced, slightly advanced, roughly synchronized, slightly lagging, and highly lagging. The results are shown in Figure 8.
The results indicate the following: (1) In 2021, 12 cities were classified as “highly advanced”, 45 as “slightly advanced”, 46 as “roughly synchronized”, 30 as “slightly lagging”, and 18 as “highly lagging”. More than half of the cities were classified as “slightly lagging” or “roughly synchronized”, suggesting that while the overall consistency between high-quality and economic development levels had improved by 2021, further targeted efforts are needed to address shortfalls in high-quality development. (2) In the eastern region, most cities were classified as “roughly synchronized” or “slightly advanced”, indicating good overall consistency between development quality and economic growth. However, in areas like northern Jiangsu and southeastern coastal Fujian, there were evident gaps, with cities classified as “slightly lagging” or “highly lagging”, indicating considerable internal disparities. (3) The central region had a higher proportion of “slightly lagging” and “highly lagging” cities compared to the western region, leading to a “spoon-shaped” distribution pattern of consistency, with higher consistency in the eastern and western regions and lower consistency in the central region. This can be attributed to the relatively late start of high-quality development in central and western cities, especially those in the central region, which face significant pressures in livelihood improvement, environmental management, and external engagement. (4) “Highly advanced” and “slightly advanced” cities were mainly distributed in the northeastern, northern, and southern regions, with the highest concentration in the northeast. This may be because, despite declining economic competitiveness due to industrial restructuring, northeastern cities still excel in high-quality development factors such as healthcare, education, eldercare, and openness.

6. Conclusions and Recommendations

6.1. Conclusions

Based on big data indicators, this study constructed an evaluation system for high-quality urban development that includes five sub-dimensions: Innovation, Coordination, Green, Openness, and Sharing. Using the entropy weight method, the high-quality development levels of 151 prefecture-level and above cities in China were measured from 2017 to 2021. On this basis, the spatial distribution, dynamic evolution, and regional disparities of high-quality development levels were further analyzed, along with the consistency between high-quality and economic development levels. The key findings are as follows:
During the sample period, high-quality urban development levels in China steadily increased, with an average annual growth rate of approximately 4.7%. The levels followed a decreasing gradient from eastern to central to western regions. Development across dimensions was uneven, with four dimensions showing improvement while openness declined. Openness needs to be prioritized in the future.
Significant differences exist in high-quality development types among Chinese cities. Cities were classified into initial, catch-up, developing, burgeoning, and leading types, with leading and burgeoning cities mainly located in the eastern region, and central and western cities predominantly classified as initial and catch-up. Eastern cities showed significant improvement in development levels.
Regional and national disparities in high-quality development levels showed a decreasing trend, with inter-regional disparities and intra-regional disparities both contributing to overall differences. The largest disparities were found between eastern and western regions. Innovation was identified as the main source of structural disparity, while openness contributed the least.
Consistency between high-quality and economic development levels requires improvement. More than half of the cities were classified as either “slightly lagging” or “roughly synchronized”. Regional consistency followed a “spoon-shaped” distribution pattern, with higher consistency in eastern and western cities and lower consistency in central cities.
This study integrates big data analytics with a multidimensional evaluation system to offer a more comprehensive and nuanced understanding of high-quality urban development. By examining the temporal and spatial dynamics of urban development, it provides deeper insights into the driving forces behind such development. A key contribution of this research is the assertion that innovation serves as the primary driver of structural disparities in urban development, particularly in the context of China’s diverse regions. While existing studies often emphasize the significance of economic and environmental factors, they tend to overlook the crucial role that innovation plays in bridging regional disparities. Another important contribution of this research is the proposal of a five-stage development framework based on varying levels of high-quality urban development. This classification model surpasses traditional comparisons of urban development levels by adopting a dynamic framework that captures the evolving nature of urban development across different regions. It thus provides important insights for understanding regional differences and formulating targeted policy interventions. Furthermore, in contrast to previous studies that argue regional disparities are continuously widening, this study reveals that the gap in high-quality development between regions has been narrowing over time, even though intra-regional disparities remain. By identifying specific sub-dimensions of stagnation or decline, this study offers a more granular understanding of urban development. Lastly, the study’s findings on the alignment between high-quality development and economic growth levels introduce a novel dimension to performance-based research. Contrary to the commonly held assumption of a linear relationship between economic growth and urban development, our study demonstrates that more than half of the cities exhibit a misalignment between these two dimensions. This observation challenges traditional perspectives and opens avenues for further exploration of the complex relationship between these two fields.

6.2. Recommendations

Based on the measurement and comparison results for 151 prefecture-level cities in China, this study offers the following recommendations to continuously promote high-quality urban development in China:
(1)
Adhere to innovation-driven development to strengthen the foundation for high-quality development. Innovation is the key driving force behind high-quality urban growth and is essential for long-term sustainable development. The development of Chinese cities must embrace innovation-driven growth; improve policy coordination, industry support, and talent cultivation; and strengthen the foundation for high-quality urban development. In terms of policy, cities should establish mechanisms for long-term support for basic and original research, build urban innovation platforms, and promote cutting-edge application research. In terms of industry, municipal governments should enhance support for technology innovation industries; focus on the interplay between industry, academia, and research; and improve the economic application efficiency of science and technology. In terms of talent cultivation, investments in basic education should be increased, vocational education systems should be improved, and professional talent attraction should be expanded.
(2)
Leverage both domestic and international “dual circulation” to promote high-quality openness. We are in an era of imperfect games [52]. Facing the trend of economic globalization, ignoring or resisting it would go against the historical tide. To address current development conditions, cities must prioritize meeting domestic social needs, enhance employment policies, improve social security, and elevate the quality of life and happiness for citizens. At the same time, expanding openness must also be a focus, aiming to build internationally competitive advanced technology industry clusters, increase the quality and added value of exports, and enhance institutional frameworks for openness. By optimizing business environments and attracting high-quality foreign investment, cities can achieve high-quality open development.
(3)
Strengthen localized planning to unlock the potential for differentiated high-quality development. Given the structural disparities in high-quality development levels within and between regions, development strategies must consider geographic location, resource endowment, and foundational conditions. Regional strengths should be harnessed to avoid homogeneity in development. Eastern cities, with higher economic levels, need to focus on environmental governance and internal balance due to higher pressures on resources and social welfare. Central cities have significant room for improvement in innovation and social welfare. Western cities must focus on enhancing economic culture and addressing deficiencies in openness and connectivity.
(4)
Promote the construction of central cities and advance integrated development within urban clusters. As urban development evolves from dispersed to concentrated, promoting high-quality growth in central cities is essential. High-growth regions within central cities can drive growth in surrounding areas by enhancing economic cooperation, technological exchange, and industrial collaboration, leading to talent, capital, and technological circulation. Improving connectivity in urban infrastructure and ensuring the cross-regional distribution of public resources will further support the integrated development of urban clusters.

Author Contributions

Conceptualization, X.Q. (Xiujun Qin) and X.Q. (Xiaolei Qin); software, X.Q. (Xiujun Qin); validation, X.Q. (Xiaolei Qin); investigation, X.Q. (Xiujun Qin) and X.Q. (Xiaolei Qin); resources, X.Q. (Xiaolei Qin); data curation, X.Q. (Xiujun Qin); writing—original draft preparation, X.Q. (Xiujun Qin); writing—review and editing, X.Q. (Xiaolei Qin); visualization, X.Q. (Xiujun Qin); project administration, X.Q. (Xiaolei Qin); funding acquisition, X.Q. (Xiaolei Qin). All authors have read and agreed to the published version of the manuscript.

Funding

This research was funded by the National Social Science Foundation of China (Funding number: 22BZZ064) and General Project of Jiangsu Provincial Social Science Foundation ((Funding number: 22ZZD004). The funder of the above two fundings is Xiaolei Qin.

Institutional Review Board Statement

Not applicable.

Informed Consent Statement

Not applicable.

Data Availability Statement

The data utilized in this study can be retrieved from publicly accessible websites such as https://www.stats.gov.cn/ and https://www.datayicai.com/. Supplementary data that substantiate the study’s findings are available from the authors upon reasonable request.

Acknowledgments

The author would like to thank the editors and reviewers for their suggestions and revisions to the article.

Conflicts of Interest

The authors declare no conflicts of interest.

Appendix A

Table A1. Specific data sources for evaluation indicators.
NO.Tertiary IndicatorData Source
1Number of Brand Stores Growthwww.datayicai.com
2Number of Listed Companies per 10,000 Peoplewww.datayicai.com
3Number of High-Quality LocalCompanies per 10,000 Peoplewww.datayicai.com
4Number of Entrepreneurial Platforms per 10,000 Peoplewww.datayicai.com
5Number of Internet Broadband Access Users per 10,000 Peoplewww.stats.gov.cn
6Number of Invention Patents Granted per 10,000 Peoplewww.stats.gov.cn
7R&D Expenditure as a Percentage of GDPwww.stats.gov.cn
8Number of High-Tech Enterprises per 10,000Peoplewww.datayicai.com
9Graduate Retention Ratewww.datayicai.com
10Proportion of Young Peoplewww.datayicai.com
11Ratio of Urban to Rural Residents’ DisposableIncomewww.stats.gov.cn
12Nighttime Light Variation Coefficientwww.geodata.cn
13Number of Museums per 10,000 Peoplewww.datayicai.com
14Number of Bookstores per 10,000 Peoplewww.datayicai.com
15Number of Cinemas per 10,000 Peoplewww.datayicai.com
16Proportion of External Working Populationwww.datayicai.com
17Unemployment Ratehttps://data.cnki.net
18Proportion of Tertiary Industry Employeeswww.stats.gov.cn
19Per Capita Green Space Areawww.stats.gov.cn
20Average Annual Concentration of PM2.5www.stats.gov.cn
21Urban Waste Treatment Ratewww.stats.gov.cn
22Urban Sewage Treatment Ratewww.stats.gov.cn
23GDP Energy Consumption per Unitwww.stats.gov.cn
24Foreign Capital Usage per Unit of GDPwww.stats.gov.cn
25Proportion of Trade Imports and Exports to GDPwww.stats.gov.cn
26Number of International FlightDestinations per 10,000 Peoplewww.datayicai.com
27Number of Ordinary Secondary Schools per 10,000 Peoplewww.stats.gov.cn
28Average Number of Students per Teacherhttps://data.cnki.net
29Number of Hospital Beds per 10,000 Peoplehttps://data.cnki.net
30Number of Health Technicians per 10,000 Peoplehttps://data.cnki.net
31Number of Cities Directly Accessible by Rail per 10,000 Peoplewww.datayicai.com
32Number of National Highways per 10,000 Peoplewww.datayicai.com
33Per Capita Urban Residential Areawww.stats.gov.cn
34Income to House Price Ratiowww.58.com, www.stats.gov.cn
35Number of Convenience Stores per 10,000 Peoplewww.datayicai.com
36Basic Pension Insurance Coverage Ratewww.stats.gov.cn
37Number of Elderly Care Beds per 10,000 Peoplewww.stats.gov.cn

References

  1. National Bureau of Statistics of China. Latest Statistics on China’s Urbanization Process. Available online: https://data.stats.gov.cn/easyquery.htm?cn=C01&zb=A0305&sj=2023 (accessed on 18 December 2024).
  2. Barney, C. Urbanization in Developing Countries: Current Trends, Future Projections, and Key Challenges for Sustainability. Technol. Soc. 2006, 28, 63–80. [Google Scholar]
  3. Chen, M.; Gong, Y.; Lu, D.; Ye, C. Build a people-oriented urbanization: China’s new-type urbanization dream and Anhui model. Land Use Policy 2019, 80, 1–9. [Google Scholar] [CrossRef]
  4. Long, H. Land use policy in China: Introduction. Land Use Policy 2014, 40, 1–5. [Google Scholar] [CrossRef]
  5. Zhang, W. Theoretical basis and methods of city health examination evaluation in China. Sci. Geogr. Sin. 2021, 41, 1687–1696. [Google Scholar]
  6. Jia, J.; Zhang, X.; Zhang, W. Between place attachment and urban planning in Jinan: Does environmental quality affect human perception in a developing country context? Land Use Policy 2025, 148, 107384. [Google Scholar] [CrossRef]
  7. Takano, T.; Morita, H.; Nakamura, S.; Togawa, T.; Kachi, N.; Kato, H.; Hayashi, Y. Evaluating the quality of life for sustainable urban development. Cities 2023, 142, 104561. [Google Scholar] [CrossRef]
  8. Manuel, R.; Elena, A.; Maria Teresa, M.; Gumersindo, F.; Sara, G. Defining a procedure to identify key sustainability indicators in Spanish urban systems: Development and application. Sustain. Cities Soc. 2021, 70, 102919. [Google Scholar]
  9. Zhong, P.; Yuan, H.; Tian, X. Sustainable development in China: Trends, patterns, and determinants of the “Five Modernizations” in Chinese cities. J. Clean. Prod. 2019, 214, 685–695. [Google Scholar] [CrossRef]
  10. Raed Fawzi Mohammed, A.; Monjur, M. Urban sustainability assessment framework development: The ranking and weighting of Iraqi indicators using analytic hierarchy process (AHP). Sustain. Cities Soc. 2019, 44, 356–366. [Google Scholar]
  11. Li, S.T.; He, J.W.; Liu, Y.Z. Research on the division of China’s domestic value chain from the perspective of global value chains. Manag. Rev. 2018, 30, 9–18. [Google Scholar]
  12. Zhang, J.K.; Hou, Y.Z.; Liu, P.L.; He, J.; Zhuo, X. Objectives and strategic paths of high-quality development. Manag. World 2019, 35, 1–7. [Google Scholar]
  13. Zhao, J.B.; Shi, D.; Deng, Z. Research on the connotation of high-quality development. Econ. Manag. Res. 2019, 40, 15–31. [Google Scholar]
  14. Ren, B.P. Quality of economic growth: Theoretical interpretation, basic propositions, and ethical principles. Acad. Mon. 2012, 44, 63–70. [Google Scholar]
  15. Fang, C.L. Regularity and key directions of high-quality development of China’s new-type urbanization. Geogr. Res. 2019, 38, 13–22. [Google Scholar]
  16. Xiong, X.H.; Xu, Z.Y. Research on the level and driving factors of China’s new-type urbanization. Quant. Tech. Econ. Res. 2018, 35, 44–63. [Google Scholar]
  17. Zhang, W.Z.; Xu, J.X.; Ma, R.F.; Ma, S. Connotation, status, and development orientation of high-quality development in Chinese cities—A perspective based on resident surveys. Urban Plan. 2019, 43, 13–19. [Google Scholar]
  18. Yuan, X.L.; Li, S.R.; Li, C.P. Benchmarking urban development: Value adherence, logical meaning, and practical orientation under the “People’s City” concept. Contemp. Econ. Res. 2022, 11, 34–43. [Google Scholar]
  19. Yuan, X.L.; Fan, B.N.; Li, C.P. Current situation, problems, and dilemmas of high-quality urban development towards Chinese modernization—A perspective based on residentssubjective feelings. J. Xi’an Jiaotong Univ. 2023, 43, 64–77. [Google Scholar]
  20. Ma, H.T.; Xu, X.F. Evaluation and spatial pattern differentiation of high-quality development of urban agglomerations in the Yellow River Basin. Econ. Geogr. 2020, 40, 11–18. [Google Scholar]
  21. Dong, H.Z.; Han, Y.G. Spatiotemporal evolution and driving factors of high-quality urban development under complex ecosystems—A case study of the seven urban agglomerations in the Yellow River Basin. Hum. Geogr. 2021, 36, 96–107. [Google Scholar]
  22. Zhang, G.X.; Zhang, J.Y. Spatiotemporal evolution of high-quality development in resource-based cities in the Yellow River Basin. Chin. Popul. Resour. Environ. 2023, 33, 124–133. [Google Scholar]
  23. Zhang, W.L.; Wang, Y.B.; Wei, R.B. Spatiotemporal evolution and mechanism of high-quality development club convergence in urban agglomerations. Acta Geogr. Sin. 2023, 78, 3109–3128. [Google Scholar]
  24. Pei, W. Comprehensive evaluation of high-quality urban development based on entropy method. Stat. Decis. 2020, 36, 119–122. [Google Scholar]
  25. Wang, H.Y. Study on the measurement of high-quality development level of central cities in the five major urban agglomerations—Also discussing the high-quality development of Wuhan metropolitan area. Hubei Soc. Sci. 2022, 11, 66–75. [Google Scholar]
  26. Shi, B.; Fang, J.H. Research on the high-quality development of western Chinese cities: Evaluation analysis and policy implications. J. Xi’an Univ. Financ. Econ. 2023, 36, 57–70. [Google Scholar]
  27. Ma, J.; Shen, K.R. Improving the quality of urban development under the background of Chinese-style modernization: Goals, challenges, and paths. Macro Qual. Res. 2023, 11, 59–72. [Google Scholar]
  28. Sun, J.W.; Zhang, Z.B. Urban agglomeration governance oriented towards high-quality development. Frontline 2019, 10, 60–63. [Google Scholar]
  29. Hou, S.; Zhen, Y.L.; Cao, X.T.; Zhang, W. Construction and application of urban agglomeration governance evaluation system under the background of high-quality development—A case study of the Yangtze River Delta urban agglomeration. Econ. Geogr. 2022, 42, 35–44. [Google Scholar]
  30. Flaherty, E.; Sturm, T.; Farries, E. The conspiracy of COVID-19 and 5G: Spatial analysis fallacies in the age of data democratization. Soc. Sci. Med. 2022, 293, 114546. [Google Scholar] [CrossRef]
  31. Zhang, X.; Xu, F. Impact of environmental regulation on green technology innovation—Regional heterogeneity analysis based on government intervention perspective. Urban Issues 2022, 9, 55–64. [Google Scholar]
  32. Su, H.Y.; Wang, X.H. Innovative application of rule-of-law government evaluation in the era of big data. J. Tianjin Adm. Inst. 2019, 21, 26–33. [Google Scholar]
  33. Mergel, I. Agile innovation management in government: A research agenda. Gov. Inf. Q. 2016, 33, 516–523. [Google Scholar] [CrossRef]
  34. Cavallo, A. Scraped data and sticky prices. Rev. Econ. Stat. 2018, 100, 105–119. [Google Scholar] [CrossRef]
  35. Choi, H.; Varian, H. Predicting the present with Google Trends. Econ. Rec. 2012, 88 (Suppl. S1), 2–9. [Google Scholar] [CrossRef]
  36. Du, Y.H. Research on the evaluation of precision poverty alleviation performance under the background of big data. Seek. Truth 2018, 2, 87–96+112. [Google Scholar]
  37. Meng, T.G.; Li, Y. Political and economic analysis of administrative litigation system under judicial reform—Based on the analysis of judicial big data. Nanjing Soc. Sci. 2021, 8, 64–75. [Google Scholar]
  38. Zhang, W.W.; Huang, S.; Zhuo, H.J.; Tang, J. Measurement and evaluation of population vitality in characteristic towns in Zhejiang Province based on big data. Zhejiang Soc. Sci. 2022, 8, 22–33+156–157. [Google Scholar]
  39. Yi, C.D.; Yuan, J.L.; Zheng, L.; Fan, Z. Spatial expansion characteristics and driving factor analysis of metropolitan areas based on nighttime light data. Urban Dev. Stud. 2024, 31, 109–117+124. [Google Scholar]
  40. Gao, J.; Zhang, Z.H.; Li, W.Y.; Sun, F.; Hu, Y.; Wang, L.; Fu, J.; Lin, X.; Cheng, G. Assessment of urban sustainable development supported by Earth big data: Indicators, data, and methods. Bull. Chin. Acad. Sci. 2021, 36, 940–949. [Google Scholar]
  41. Guo, H.D.; Huang, L.; Luo, L.; Liu, J.; Li, X. Progress on achieving environmental SDGs assessed from Big Earth Data in China. Sci. Bull. 2023, 68, 3129–3132. [Google Scholar] [CrossRef] [PubMed]
  42. Liu, H.M. Preliminary exploration of urban evaluation methodology. Geogr. Res. 2024, 43, 596–620. [Google Scholar]
  43. Ding, J.C.; Zhang, L.Z. Economic Effect Evaluation of the Central China Rising Strategy: A PSM-DID Method Study Based on Data from 261 Prefecture-Level Cities. Shanghai Financ. 2022, 8, 67–79. [Google Scholar]
  44. Peng, X.; Chen, Z.C. Policy Effect Evaluation of the Western Development Strategy. China Popul. Resour. Environ. 2016, 26, 136–144. [Google Scholar]
  45. Liu, T.; Yang, M.; Peng, R.X. Structural and Directional Characteristics of Population Loss in the Three Northeastern Provinces: A Regional Comparative Analysis Based on Long-Term Census Data. Geogr. Sci. 2024, 44, 1016–1025. [Google Scholar]
  46. Sun, P.J.; Xiu, C.L.; Dong, C. Economic Spatial Polarization in the Northeast Region and Its Driving Factors: A Quantitative Study. Hum. Geogr. 2013, 28, 87–93. [Google Scholar]
  47. Ding, R.Z.; Wang, H.H. Economic Differences, Industrial Structure, and North-South Economic Division in Urban Agglomerations. Financ. Trade Econ. 2022, 43, 128–143. [Google Scholar]
  48. Lei, H.Y. The Spatiotemporal Evolution of Inclusive Growth in China’s Border Areas: A Periodic Evaluation of the Economic Development Disparities Between Central, Eastern, and Western Regions. Shanghai Econ. Res. 2016, 10, 108–115. [Google Scholar]
  49. Mouratidis, K.; Yiannakou, A. COVID-19 and urban planning: Built environment, health, and well-being in Greek cities before and during the pandemic. Cities 2021, 121, 103491. [Google Scholar] [CrossRef] [PubMed]
  50. Moreno, C.; Wykes, T.; Galderisi, S.; Nordentoft, M.; Arango, C. How mental health care should change as a consequence of the COVID-19 pandemic. Lancet Psychiatry 2020, 7, 813–824. [Google Scholar] [CrossRef]
  51. Rząsa, K.; Ciski, M. Determination of the level of sustainable development of the cities—A proposal for a method of classifying objects based on natural breaks. Acta Sci. Pol. Adm. Locorum 2021, 20, 215–239. [Google Scholar] [CrossRef]
  52. Li, X.; Hao, G.; Zhang, Z. Evolution of cooperation in heterogeneously stochastic interactions. Chaos Solitons Fractals 2021, 150, 111186. [Google Scholar] [CrossRef]
Figure 1. Evolution of national and regional high-quality urban development levels.
Sustainability 17 00836 g001
Figure 2. Evolution trends of high-quality urban development in various dimensions across the country and region.
Sustainability 17 00836 g002
Figure 3. Kernel density curves of high-quality urban development levels in China and the eastern, central, and western regions from 2017 to 2021.
Sustainability 17 00836 g003
Figure 4. Spatial distribution of high-quality urban development levels in China from 2017 to 2021.
Sustainability 17 00836 g004
Figure 5. The Gini coefficient and its contribution rate of high-quality urban development from 2017 to 2021.
Sustainability 17 00836 g005
Figure 6. Structural sources of differences in the level of high-quality development of cities in China and the four major regions.
Sustainability 17 00836 g006
Figure 7. The consistency test of urban high-quality development level and economic development in 2021.
Sustainability 17 00836 g007
Figure 8. The consistent distribution of urban high-quality development level and economic development in 2021.
Sustainability 17 00836 g008
Table 1. Big data evaluation index system for high-quality urban development.
Primarya
Indicator
Secondary IndicatorTertiary IndicatorAttributeWeight
InnovativeEconomic DevelopmentNumber of Brand Stores Growth *+1.69%
Number of Listed Companies per 10,000 People *+4.83%
Market VitalityNumber of High-Quality Local
Companies per 10,000 People *
+4.29%
Number of Entrepreneurial
Platforms per 10,000 People *
+5.29%
Number of Internet Broadband
Access Users per 10,000 People
+2.26%
Technological InnovationNumber of Invention Patents Granted per 10,000 People+4.82%
R&D Expenditure as a Percentage of GDP+2.86%
Number of High-Tech Enterprises per 10,000 People *+4.67%
Talent AttractionGraduate Retention Rate *+2.45%
Proportion of Young People *+2.98%
CoordinatedRegional CoordinationRatio of Urban to Rural Residents’ Disposable Income1.36%
Nighttime Light Variation
Coefficient *
1.41%
Cultural DevelopmentNumber of Museums per 10,000
People *
+3.28%
Number of Bookstores per 10,000 People *+2.17%
Number of Cinemas per 10,000
People *
+1.98%
Employment CoordinationProportion of External Working
Population *
+3.19%
Unemployment Rate1.40%
Proportion of Tertiary Industry
Employees
+1.76%
GreenEnvironmental QualityPer Capita Green Space Area+1.95%
Average Annual Concentration of PM2.51.50%
Environmental GovernanceUrban Waste Treatment Rate+1.37%
Urban Sewage Treatment Rate+1.39%
Energy Conservation and Emission ReductionGDP Energy Consumption per Unit1.42%
OpennessExternal Economy and TradeForeign Capital Usage per Unit of GDP+3.82%
Proportion of Trade Imports and
Exports to GDP
+4.57%
External TransportNumber of International Flight
Destinations per 10,000 People *
+6.71%
SharingEducation QualityNumber of Ordinary Secondary Schools per 10,000 People+2.19%
Average Number of Students per Teacher1.78%
Medical LevelNumber of Hospital Beds per 10,000 People+2.02%
Number of Health Technicians per 10,000 People+1.90%
Transportation and TravelNumber of Cities Directly Accessible by Rail per 10,000 People *+3.34%
Number of National Highways per 10,000 People *+3.13%
Living QualityPer Capita Urban Residential Area+1.75%
Income to House Price Ratio *+2.13%
Number of Convenience Stores per 10,000 People *+2.06%
Elderly Care SecurityBasic Pension Insurance Coverage Rate+1.76%
Number of Elderly Care Beds per 10,000 People+2.55%
Note: * indicates that the indicator is supported by big data.
Disclaimer/Publisher’s Note: The statements, opinions and data contained in all publications are solely those of the individual author(s) and contributor(s) and not of MDPI and/or the editor(s). MDPI and/or the editor(s) disclaim responsibility for any injury to people or property resulting from any ideas, methods, instructions or products referred to in the content.

