
Future Risk from Current Sustainability Assessment Frameworks for the Resource Sector


Abstract
:1. Introduction
2. Materials and Methods
2.1. Life Cycle Sustainability Assessment (LCSA) Framework
- Indicator Adaption: Economic indicators, such as export revenue and operating profit, can be modified to reflect local economic conditions, while environmental indicators, like carbon intensity and water consumption, can integrate data from global climate and energy initiatives (e.g., World Resources Institute or regional energy transition plans).
- Regional Thresholds: Threshold values for key performance indicators can be recalibrated using region-specific sustainability studies and industry data, ensuring relevance and applicability across geographic contexts.
- Scalability Across Industries: The framework can also be applied to other resource-intensive sectors, such as cement production or steel manufacturing, where carbon reduction, energy efficiency, and land rehabilitation are critical concerns.
2.1.1. Preliminary Literature Review
- Environmental and Social Life Cycle Assessments for the mining and metals sectors across various regions (e.g., Europe, Africa, South America).
- Global Sustainability Assessments to capture the best practises and indicator benchmarks applicable across geographies.
- Cross-Sector Indicators that align with international standards (e.g., Global Reporting Initiative, Sustainability Accounting Standards Board).
- Relevance to Industry Goals: Indicators that align with key sustainability objectives, such as decarbonisation, energy efficiency, and freshwater management. For example, E-2.1 Energy Intensity addresses the heavy energy demand in alumina production, particularly during steam generation.
- Data Availability:
- Availability of Reliable Data: Indicators were selected based on robust, verifiable data from industry reports, scientific literature, and international databases.
- Avoiding Data Gaps: Indicators requiring data unavailable for all regions were excluded to maintain analytical consistency. For instance, while biodiversity loss is critical, data limitations often prevent detailed quantification.
- Effectiveness in Measuring Sustainability: Indicators were selected based on their ability to deliver actionable insights into economic, social, and environmental performance. E-4.3 Natural Land Rehabilitation is crucial for post-mining ecosystems, as seen in Australian rehabilitation efforts.
- Relevance to Future Scenarios: Indicators needed to be adaptable to scenario analyses and reflective of technological and policy changes over time. E-1.1 Carbon Intensity is an example that enables future-focused comparisons under varying decarbonisation pathways.
2.1.2. Questionnaire
- Relevance and Importance: Participants rated the relevance and importance of each KPI on a 5-point Likert scale.
- Indicator Suggestions: Participants could propose additional indicators that they believed were critical, but which were absent from the preliminary list.
- Regional Context: Participants provided insights into how indicators might need to be adjusted for geographic or industrial differences, such as the following:
- Adding metrics for water stress in arid regions.
- Incorporating biodiversity monitoring for ecologically sensitive areas.
- Addressing energy grid differences, such as reliance on renewable versus fossil fuels.
- Biodiversity Indicators: Metrics for biodiversity loss and native vegetation were added, which are particularly relevant to regions with significant land use pressures.
- Global Applicability: Participants emphasised the need for region-specific thresholds and global benchmarks to enhance the framework’s adaptability.
- This study focuses on CO2 emissions and omits NOx and SOx emissions from the final list of indicators. This change was made as the majority of participants did not view this as a priority for the alumina sector’s environmental footprint; these indicators would be better placed in an LCSA of the aluminium smelting sector (due to its much larger fossil fuel energy intensity).
2.2. Threshold Values
- Minimum values were determined by following a combination of the following:
- Averaging reported values within current industry and government reports.
- Values reported in industry assessments of emerging low-emission technologies.
- Predicted values, based on market analysis and reports between 2025 and 2050.
- Maximum values were determined by following a combination of the following:
- Averaging reported goal values within current industry and government reports.
- Maximum expected reduction potentials associated with the incorporation of renewable energy and low-emission technologies in current industry, government, and non-government organisation reports.
- Currently calculated annual emission reduction potentials reported in technology reports.
- Averages of goals from other operating countries whose approaches or performance match Australian operation goals.
2.3. Scenario Planning and Sensitivity Analysis
- Key Variable Identification:
- Decarbonisation variables influencing the alumina industry were identified, including the availability and adoption of alternative energy sources, emerging technologies, and changes in policies and regulations.
- Future-focused Scenario Development:
- A total of 34 sub-scenarios were developed—17 for Western Australia and 17 for Queensland—representing different combinations of the identified variables. These included varying levels of renewable energy integration and differing rates/types of technology adoption.
- Scenario Types:
- Business-As-Usual (BAU): The continuation of current practises, with no additional decarbonisation efforts beyond publicised commitments.
- Net-Zero: The achievement of near-zero Scope 1 and 2 emissions by 2050, through incremental adoption of renewables and low-emission technologies.
- Accelerated Net-Zero: The rapid implementation of renewable technologies and advanced decarbonisation strategies to achieve the earliest possible reductions.
- Data Collection and Analysis:
- Data were collected from primary and secondary sources, including industry reports, academic literature, and expert reviews. Threshold values for the KPIs were established based on available industry benchmarks.
- Sensitivity Analysis:
- Sensitivity Analysis was conducted by manipulating key independent variables to explore their impacts on overall sustainability outcomes. This identified potential gaps and areas requiring improvement.
- For example, one sensitivity included was water consumption targets for 2030 and 2050, of a 15% reduction (5.16 m3 to 4.4 m3) and a further 25% reduction (down to 3.2 m3), respectively. Sensitivity Analysis was conducted on water usage to predict how various operational changes (such as adopting water-efficient technologies or alternative processes) could contribute to the achievement of these targets.
2.4. Gap Analysis for Indicator Selection
- Ecological Indicators (Biodiversity and Habitat Loss):
- Leverage remote sensing data to monitor land use changes, habitat fragmentation, and vegetation loss. Tools like satellite imagery and Geographic Information Systems (GIS) can provide real-time assessments of biodiversity impacts.
- Apply ecosystem services valuation models to estimate the economic value of preserved biodiversity and natural habitats.
- Social Indicators (Cultural Heritage and Community Impacts):
- Use participatory approaches, such as structured community surveys, to gather data on local perceptions of land degradation and cultural heritage disruptions.
- Develop qualitative-to-quantitative conversion frameworks that translate survey responses into measurable metrics for inclusion in the LCSA.
- Integrated Modelling Techniques:
- Implement advanced ecological and social impact modelling techniques, such as InVEST (Integrated Valuation of Ecosystem Services and Tradeoffs) or Social Life Cycle Assessment (S-LCA) methodologies, to fill data gaps for these indicators.
3. Results
3.1. Scenario Descriptions
3.1.1. Business-As-Usual (BAU)
- Production Baseline:
- Western Australia: Total alumina production starts at 13.45 Mt per year, with a reduction from 2026 due to the close of Alcoa’s Kwinana Alumina Refinery [104].
- Queensland: Production remains constant throughout the 25-year period.
- Energy Transition:
- Emissions Impact:
- Western Australia: Emissions decrease by 20%, from 9.65 Mt CO2-eq to 6.56 Mt CO2-eq, due to coal power reductions and declining production from the closure of the Kwinana Refinery.
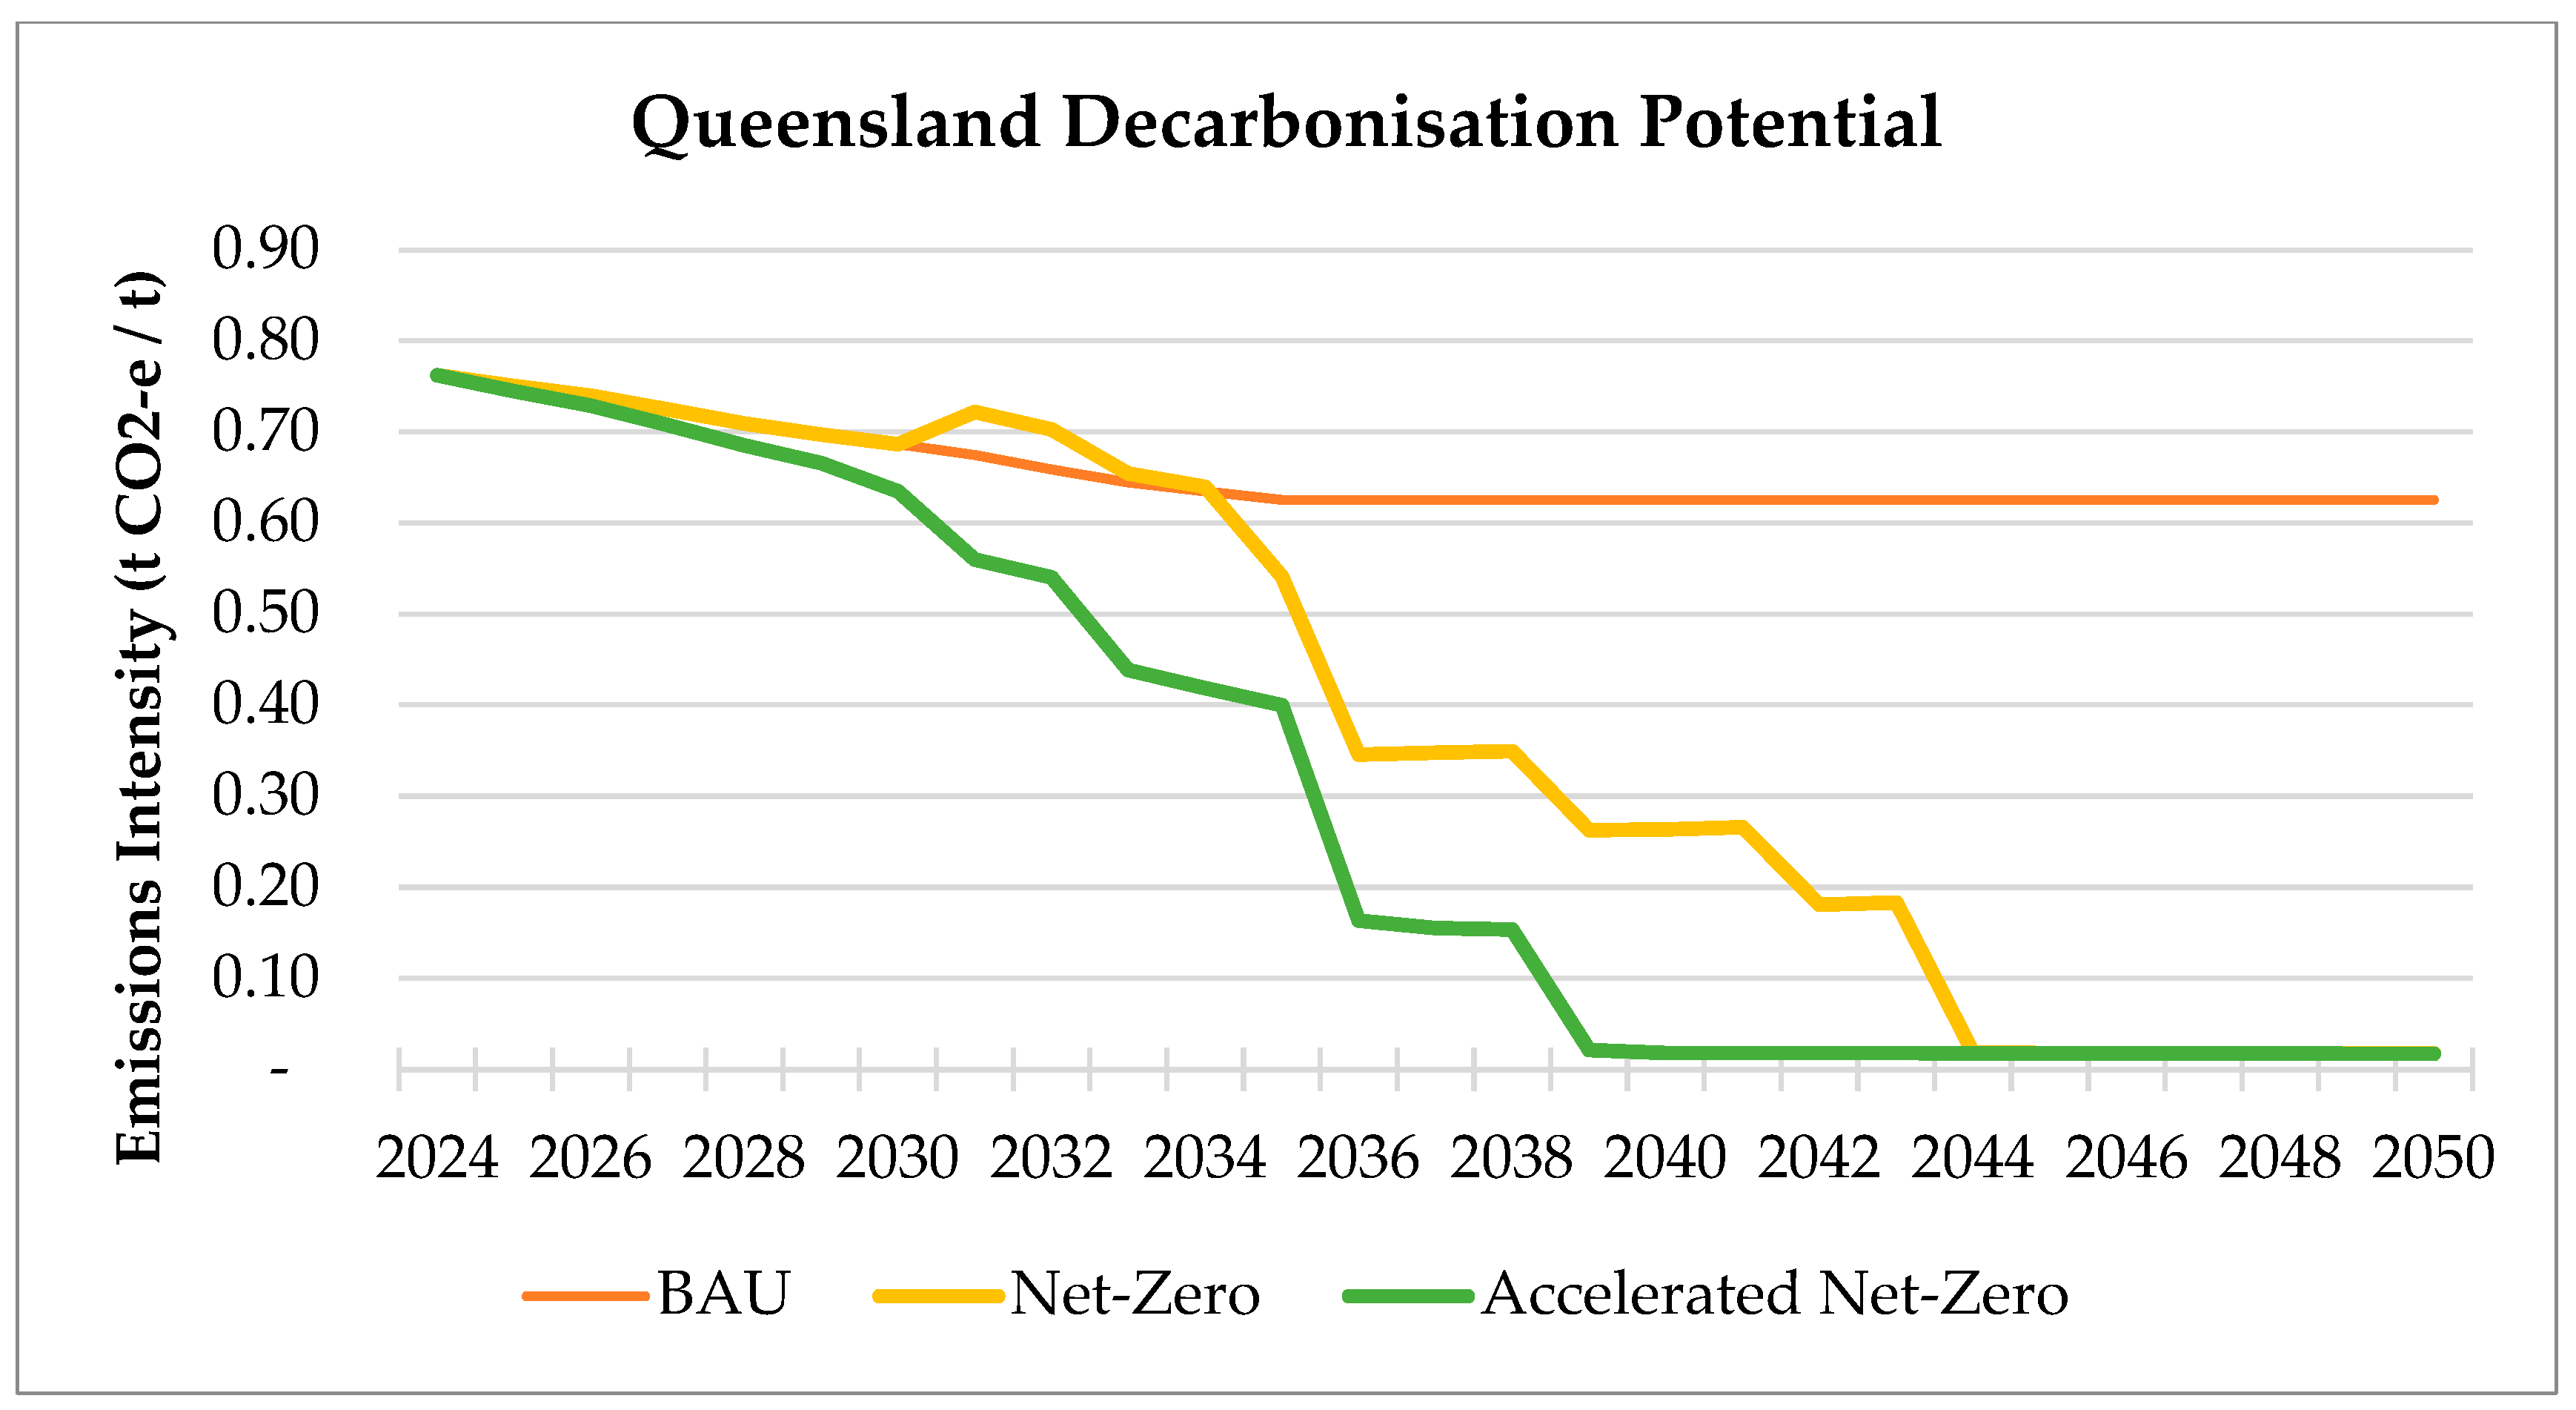
- Queensland: Emissions decrease by 21%, from 5.23 Mt CO2-eq to 4.30 Mt CO2-eq.
- Technology Adoption: No new decarbonisation technologies are deployed in this scenario.
3.1.2. Net-Zero
- Stage 1: Energy Transition
- Western Australia: Coal-fired power stations are decommissioned by 2030.
- Queensland: Coal-fired power stations are decommissioned by 2035.
- Stage 2: Technology Implementation
- Mechanical Vapour Recompression (MVR): Retrofitting begins in 2030 and is completed within six years, significantly reducing energy demand by recycling process steam.
- Electric Calcination: Replacing fossil-fuel calcination with renewable electricity begins in 2040 and is completed by 2044.
- Energy Intensity:
- Energy intensity improves by 50% after renewable energy and technology implementation, reducing energy intensity from 10.47 GJ/t to 5.24 GJ/t.
- Renewable Energy Integration:
- Western Australia: Integration of 5 GW of renewable energy capacity.
- Queensland: Integration of 4 GW of wind energy.
3.1.3. Accelerated Net-Zero
- Stage 1: Energy Transition
- Western Australia: Coal-fired power stations are decommissioned by 2030.
- Queensland: Coal-fired power stations are decommissioned by 2035.
- Stage 2: Technology Implementation
- Mechanical Vapour Recompression (MVR): Retrofitting begins in 2030 and is completed within six years.
- Electric Calcination (WA): Installation begins in 2036 and is completed by 2039.
- Hydrogen Calcination (QLD): Adoption begins in 2036, replacing natural gas with third-party renewable hydrogen, and is completed by 2039.
- Renewable Energy Integration:
- Western Australia: Integration of 6 GW of renewable energy capacity.
- Queensland: Integration of 4 GW of wind energy.
3.2. Scenario Analysis
3.2.1. BAU
3.2.2. Net-Zero
3.2.3. Accelerated Net-Zero
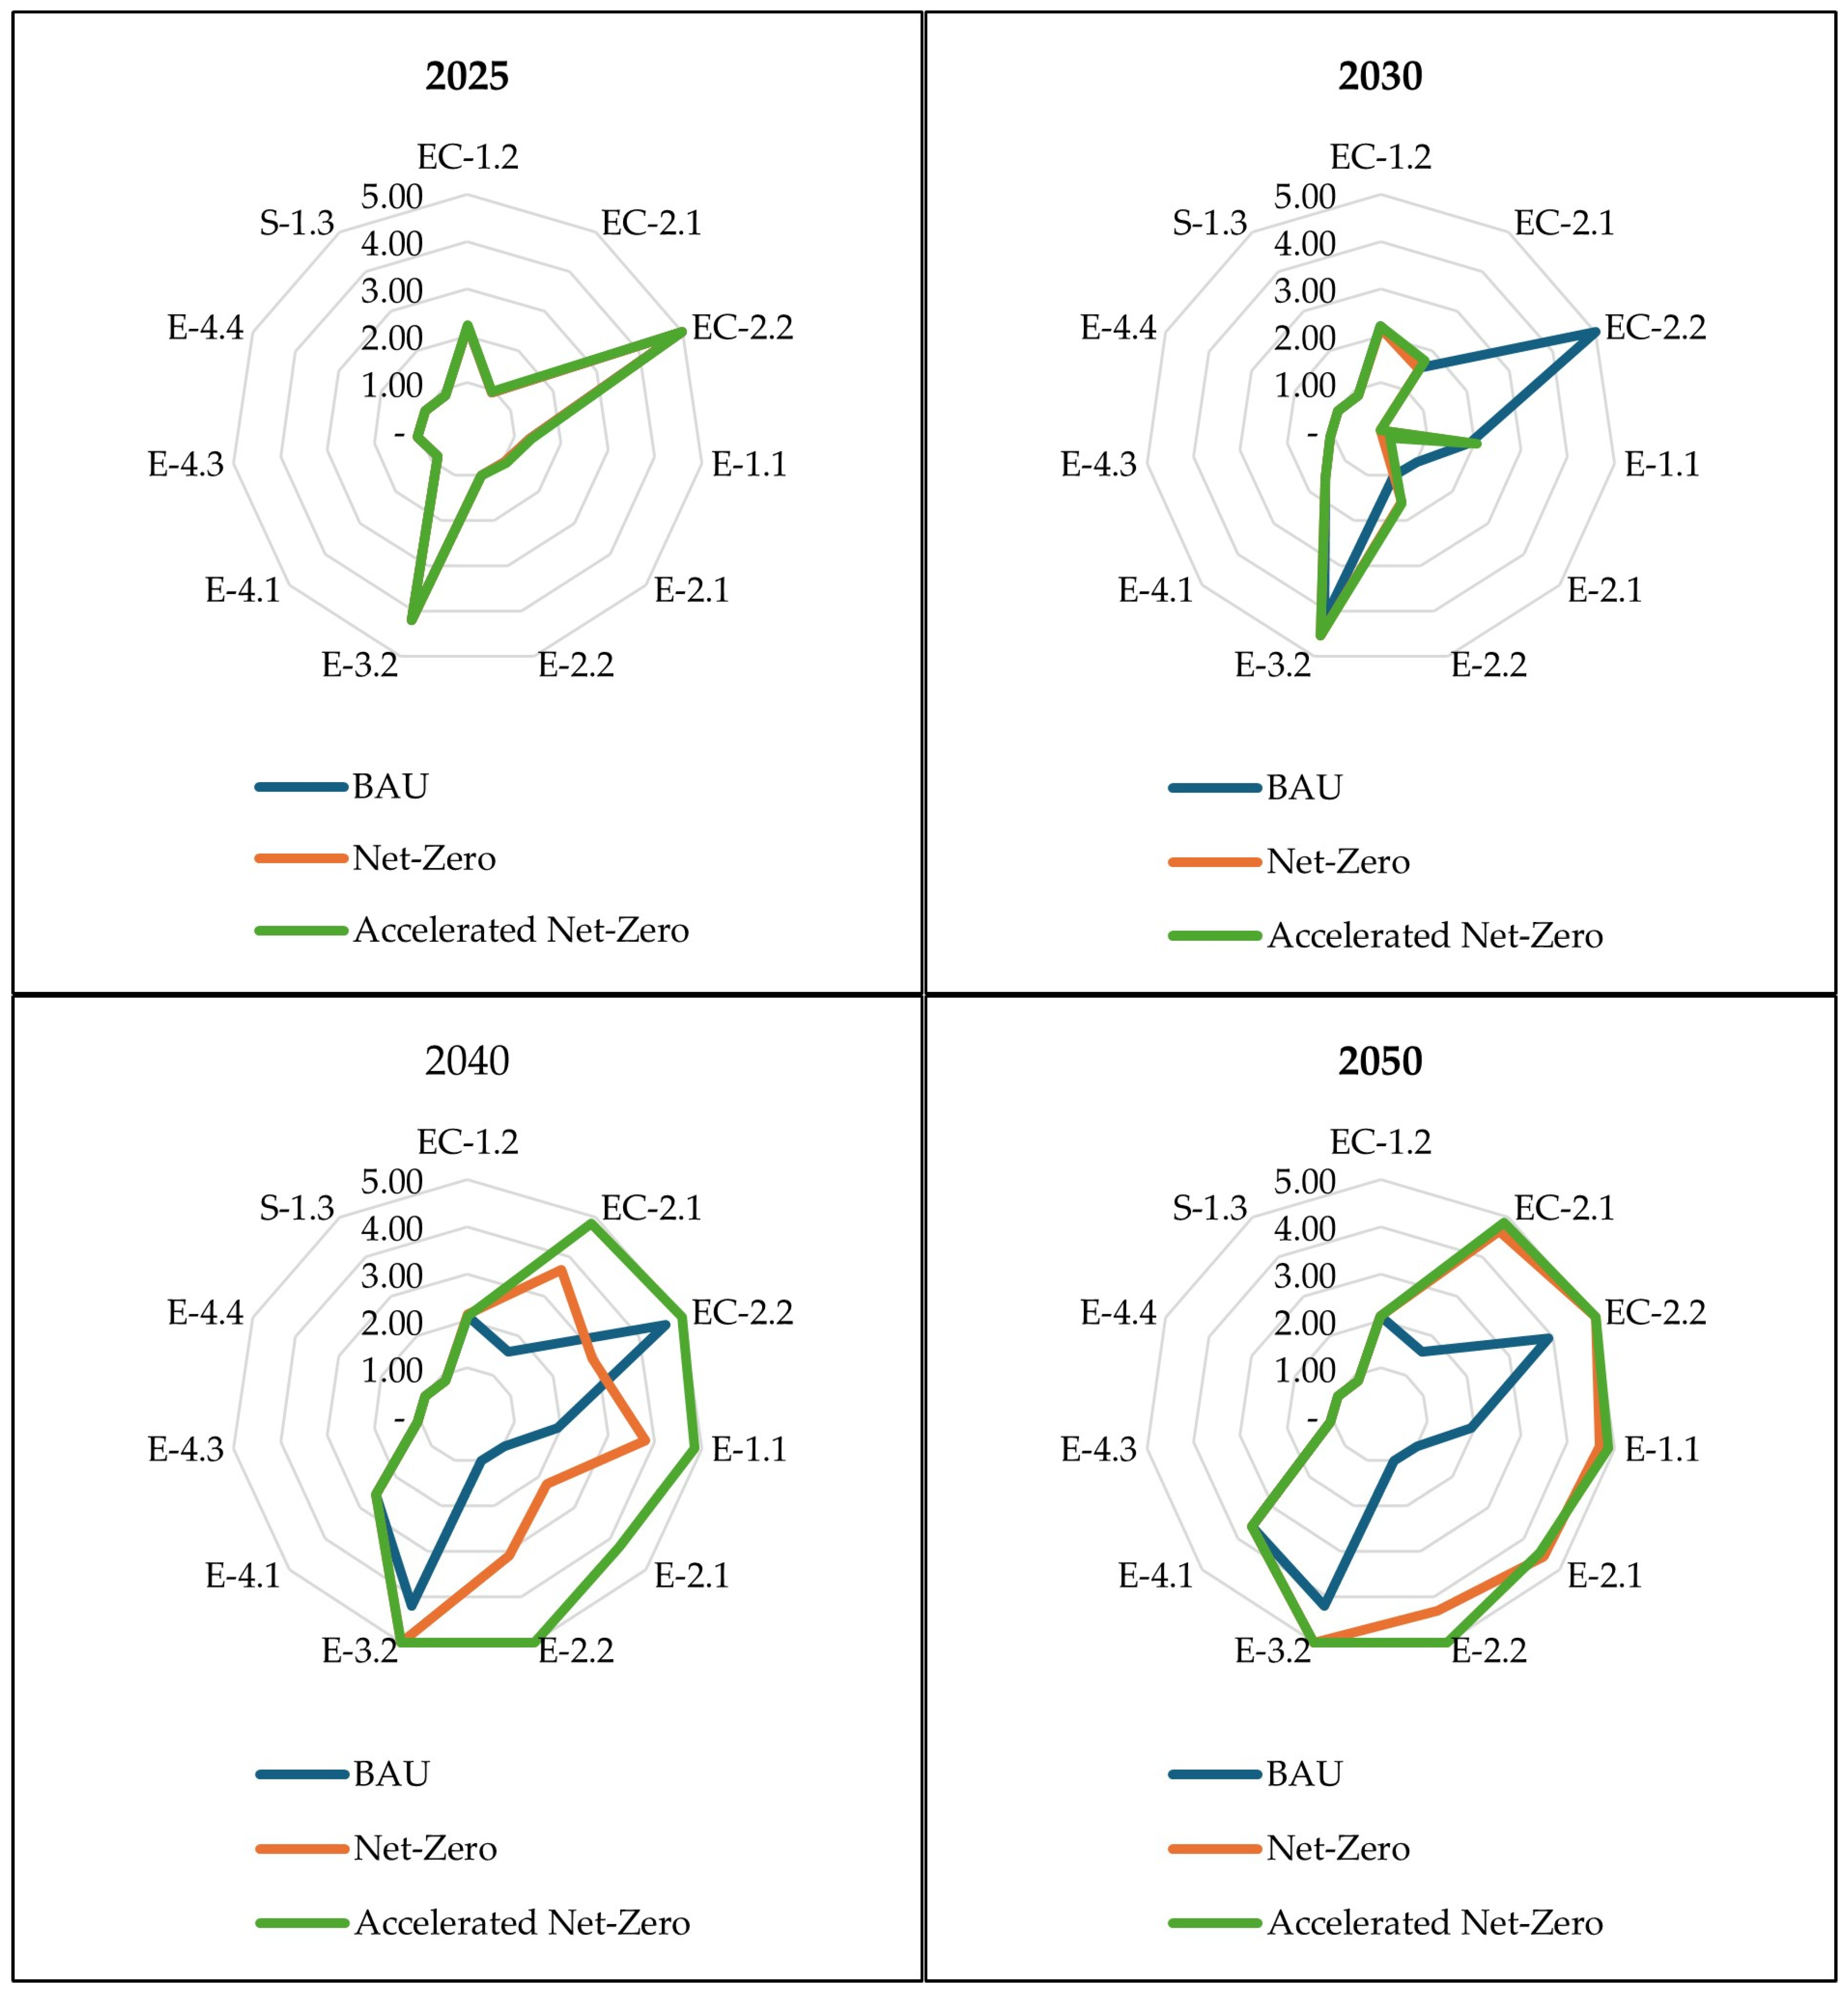
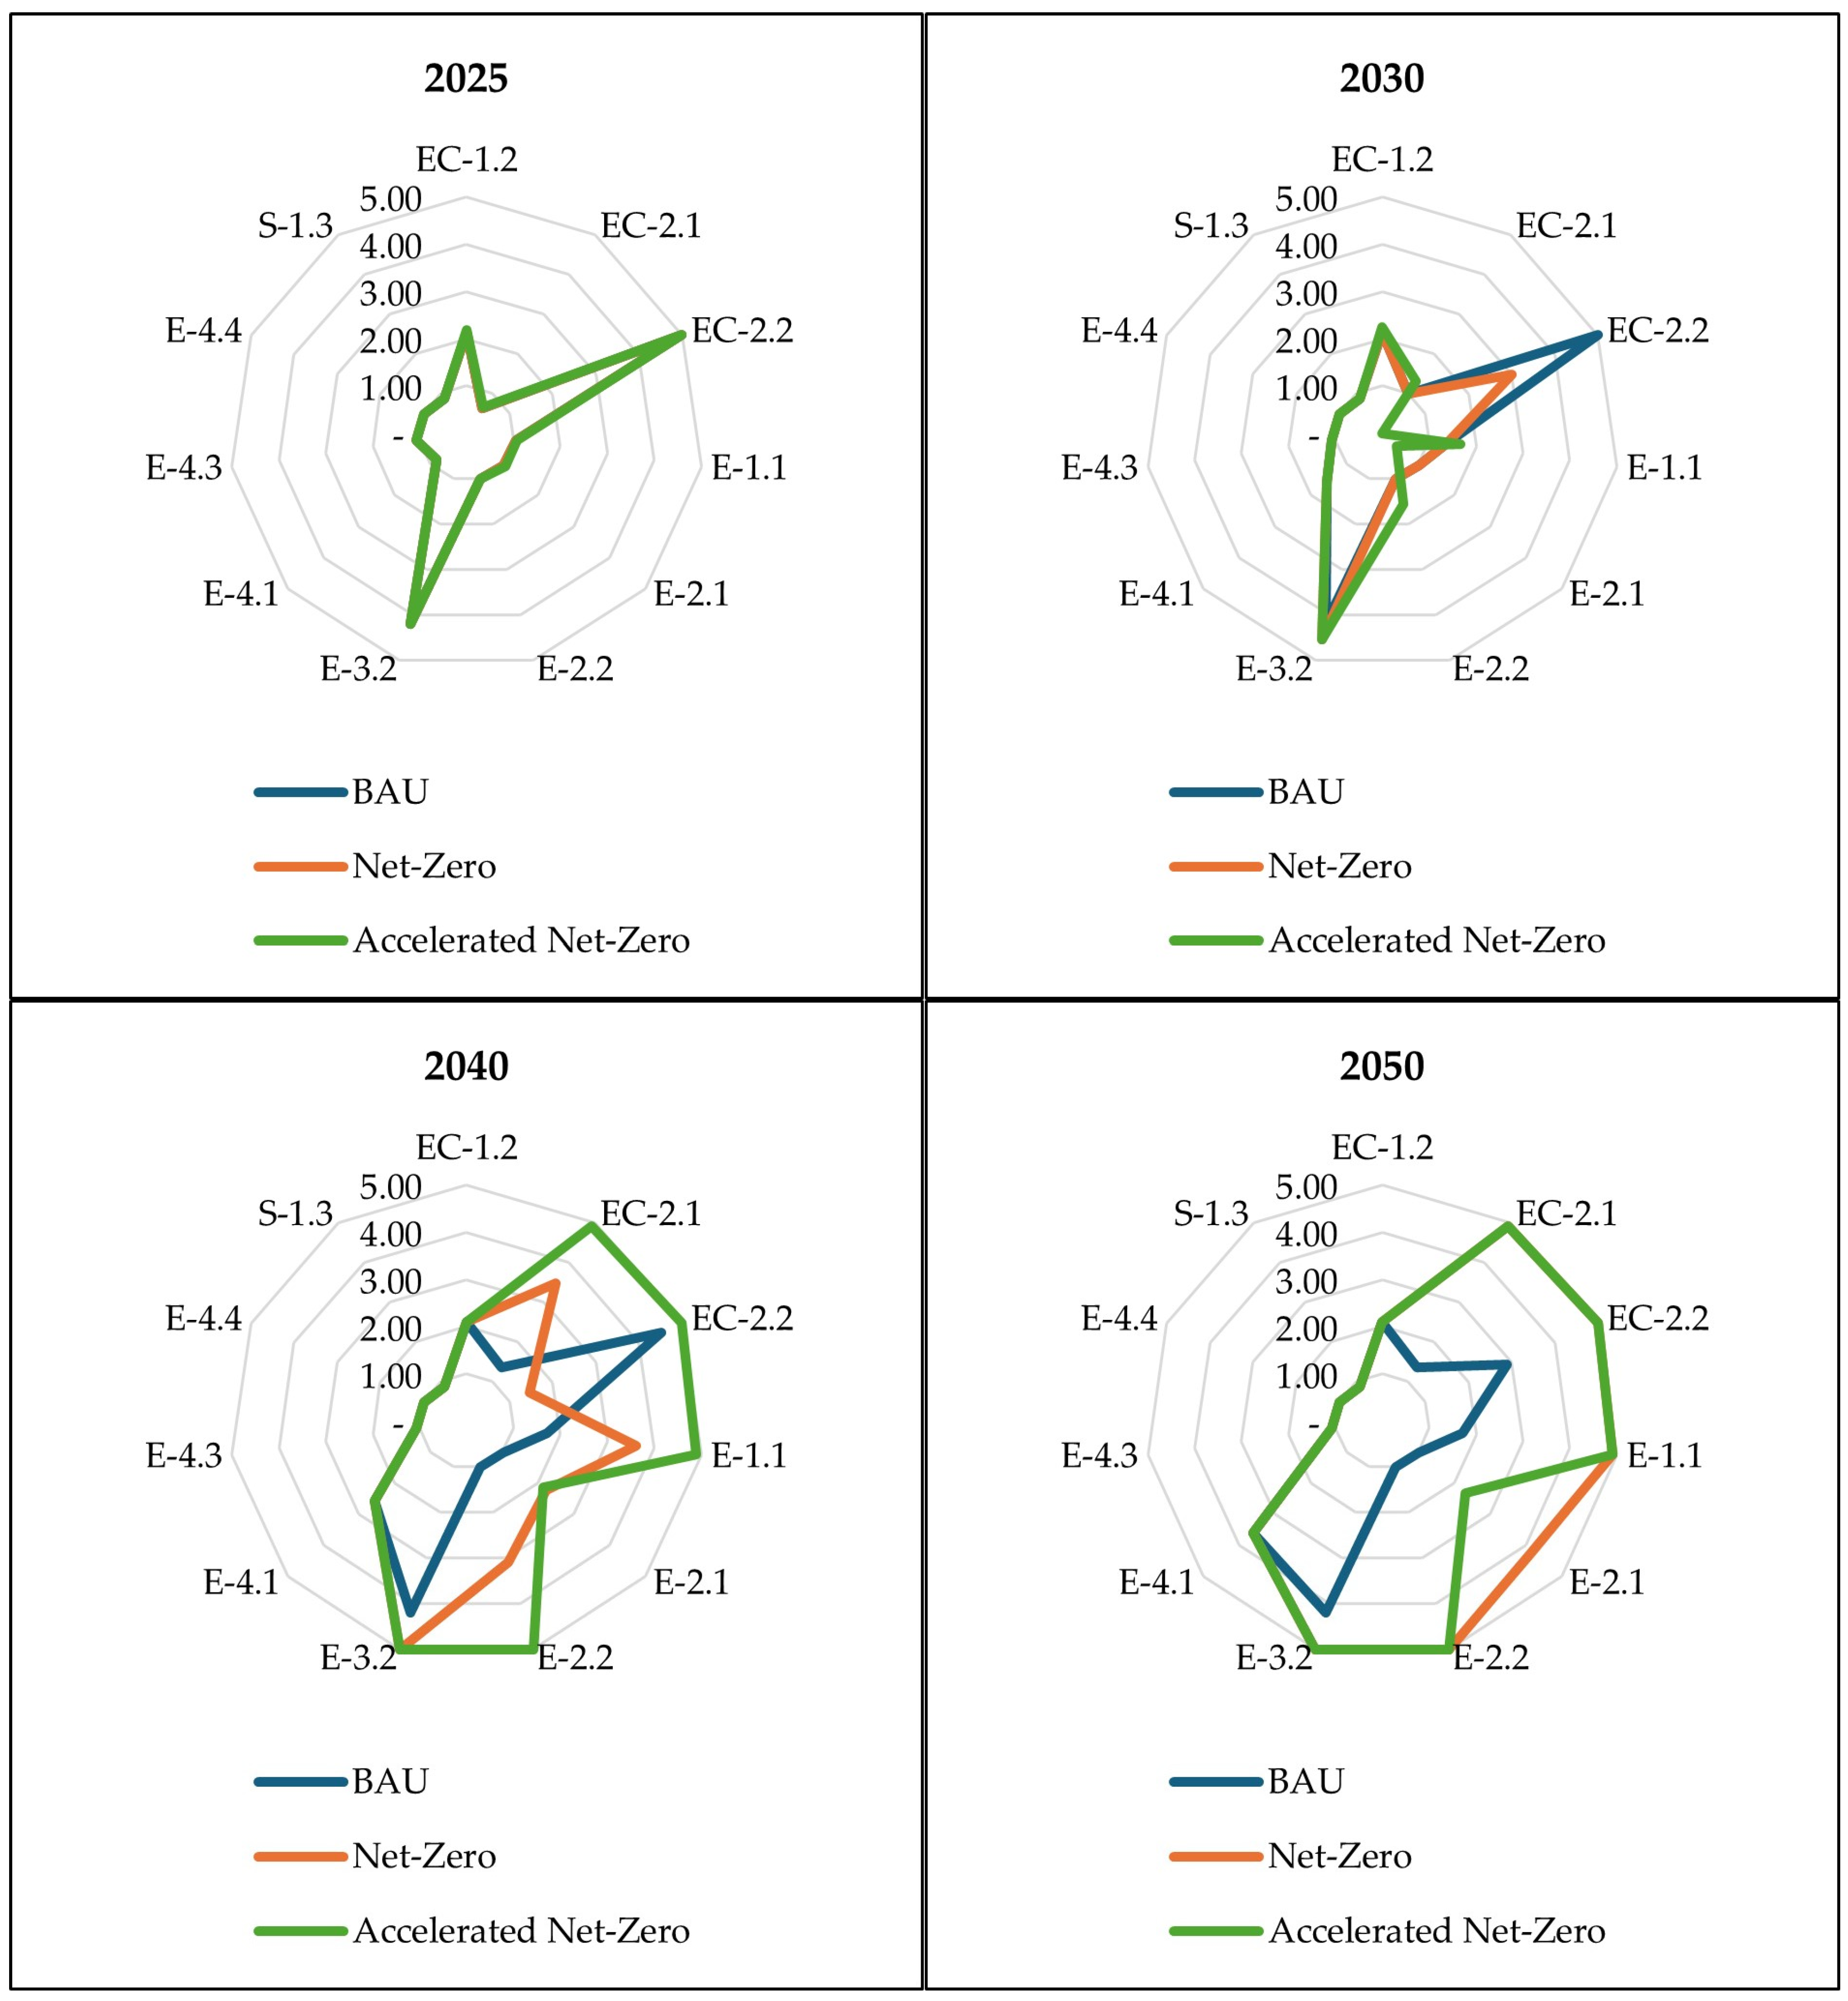
3.3. LCSA Analysis
- Western Australia (Figure 3):
- The Net-Zero scenario demonstrates substantial improvements in energy intensity, water consumption, and carbon intensity compared to BAU.
- The Accelerated Net-Zero scenario further improves carbon intensity and renewable energy share, reflecting the benefits of faster technology adoption.
- Bauxite residue land utilisation and clearing of biodiversity show limited progress, underscoring the need for more targeted ecological interventions.
- Queensland (Figure 4):
- Both the Net-Zero and Accelerated Net-Zero scenarios achieve significant improvements in emissions intensity and energy efficiency.
- Natural land rehabilitation and employment generation remain relatively unchanged, highlighting limitations in addressing broader sustainability impacts.
4. Discussion
4.1. Benefits of the Framework
- Quantify Immediate and Long-Term Impacts: Beyond carbon emissions, the framework captures a broader range of indicators, such as energy intensity, water consumption, and economic performance. For instance, under the Accelerated Net-Zero scenario, Queensland achieves a 97% reduction in carbon emissions, while improving energy efficiency by 50%.
- Support Informed Decision-Making: Scenario Planning enables companies to anticipate risks and opportunities associated with emerging technologies, regulatory changes, and market shifts. This framework enhances their ability to align operations with global climate targets, such as the Paris Agreement.
- Improve Operational Sustainability: The adoption of technologies like MVR and electric/hydrogen calcination demonstrates tangible benefits, including reduced energy demand, improved process efficiency, and water savings.
- Perform Cost–Benefit and Risk Assessment: A detailed cost–benefit analysis highlights the practical implications for industry adoption:
- Electric Calcination: An estimated reduction cost of $30–50 per tonne of CO2 mitigated, offering significant energy efficiency improvements and lower operational costs compared to fossil fuel alternatives.
- Hydrogen Calcination: While achieving similar decarbonisation outcomes, the cost of this is higher ($60–90 per tonne of CO2 mitigated), due to challenges in hydrogen production, storage, and transport. However, hydrogen calcination provides greater flexibility for energy-intensive operations, and aligns with evolving hydrogen infrastructure.
- Risk Consideration: Industry adoption of these technologies carries financial risks related to capital investment, operational disruption, and reliance on emerging energy markets. Additionally, technological maturity and regional energy availability may limit implementation timelines.
- Such assessments allow industries to prioritise investments in emission reduction technologies based on cost-effectiveness, feasibility, and scalability.
- Enhanced Stakeholder Engagement: By assessing impacts across social and economic dimensions alongside environmental indicators, companies can better engage stakeholders, including local communities and regulatory bodies, fostering trust and transparency.
4.2. Limitations of the Framework
- Data Availability and Accessibility:
- The exclusion of key environmental and social “ghost indicators”, such as biodiversity loss, cultural heritage, and community health, is primarily due to insufficient or unavailable data. For this study, the requirement for NDAs with alumina producers restricted access to proprietary operational data, limiting the evaluation of critical impacts.
- Mitigation: Future research should incorporate anonymised data-sharing protocols and leverage advanced tools, like remote sensing for ecological assessments, and structured community surveys for social indicators. Collaborations with independent research bodies and public–private partnerships can facilitate broader data collection efforts.
- Carbon-Centric Focus:
- While this framework successfully measures decarbonisation performance, its emphasis on carbon emissions and energy metrics risks overshadowing equally significant issues, like land rehabilitation, bauxite residue management, and social equity. The selective improvement of easier-to-quantify indicators raises concerns about “cherry-picking” sustainability wins.
- Mitigation: Developing integrated models, such as multi-criteria decision analysis (MCDA), would ensure balanced consideration of environmental, social, and economic dimensions. Incorporating long-term ecological and social monitoring systems will help to address these under-represented indicators.
- Simplified Modelling Assumptions:
- The scenario analysis relies on simplified assumptions about technology adoption rates, renewable energy integration, and operational changes. This approach may fail to capture dynamic factors, like fluctuating market prices, policy uncertainties, and geopolitical risks.
- Mitigation: Enhancing model complexity through Sensitivity Analysis and dynamic system modelling would improve the robustness of scenario outcomes. For instance, iterative modelling techniques can identify key sensitivities in cost and performance assumptions, allowing more accurate future projections.
- Limited Geographic Scope:
- The framework’s reliance on Australian-specific data and assumptions limits its global applicability. Regional variations in energy grids, regulatory environments, and biodiversity priorities must be accounted for to enhance transferability.
- Mitigation: Further research can address this limitation through collaborations with international partners and comparative case studies across different geographic regions. Leveraging global datasets and region-specific benchmarks will improve adaptability and scalability. For example, partnerships with global organisations like the International Aluminium Institute could provide access to standardised data for broader applicability.
4.3. The Next Generation of Sustainability Frameworks
4.3.1. Unaddressed Environmental and Social Impacts
- Biodiversity and Habitat Preservation
- Incorporate biodiversity monitoring programmes that utilise remote sensing and field-based studies, to measure habitat quality and species richness in areas impacted by alumina production.
- Introduce mandatory post-mining rehabilitation plans with specific, measurable targets for biodiversity restoration.
- Employ ecological valuation tools to estimate the benefits of preserved rehabilitated habitats.
- Cultural Heritage and Indigenous Rights
- Develop cultural heritage impact assessment protocols that involve Indigenous communities in decision-making processes, ensuring their rights and traditions are respected.
- Use GIS-based mapping to identify and monitor culturally significant sites within mining areas, integrating these insights into planning and mitigation efforts.
- Social Equity and Community Health
- Conduct longitudinal community surveys to track changes in local perceptions of well-being, land use, and economic opportunities resulting from industrial activities.
- Use health impact assessments (HIAs) to evaluate long-term health risks associated with air and water pollution from alumina production. These assessments should inform mitigation strategies and policy interventions.
- Integrated Reporting
- Develop a multi-criteria decision analysis framework to weigh and integrate findings from ecological, social, and economic assessments. This approach ensures that “ghost indicators” receive equal consideration, alongside traditional sustainability metrics.
4.3.2. Enhancing Global Adaptability
- Global Data Integration: Incorporate international datasets, such as those from the International Aluminium Institute, World Resources Institute, or regional environmental agencies, to recalibrate KPIs and thresholds.
- Case Studies Across Regions: Conduct comparative studies in regions such as South America, Africa, and Asia, where resource-intensive industries face unique biodiversity, water, and social challenges, such as in the following examples:
- South America: Addressing biodiversity loss from mining in the Amazon basin using ecological restoration techniques.
- Europe: Assessing the success of renewable energy transitions in energy-intensive industries.
- Africa: Evaluating community health and economic impacts in mining-dependent rural areas.
- Scalability Across Sectors: Extend the framework’s applicability to other resource sectors, such as cement, steel, or rare earth metals, where similar environmental and social challenges persist. These industries can benefit from insights into decarbonisation, energy efficiency, and social equity.
5. Conclusions
- Carbon-Centric Focus: The current emphasis on decarbonisation risks neglecting broader environmental and social challenges, such as biodiversity preservation, land rehabilitation, and cultural heritage protection.
- Data Accessibility: Limited access to industry-specific and ecological data restricts comprehensive assessment, particularly of critical “ghost indicators”.
- Regional Scope: The reliance on Australian-specific data reduces the global adaptability of the framework.
- Future Research Direction
- Enhanced Measurement Methods for Ecological and Social Indicators:
- Develop advanced biodiversity monitoring tools, such as remote sensing and GIS-based habitat assessments.
- Use participatory methods, like structured community surveys and cultural heritage mapping, to quantify social impacts.
- Integrate advanced models, like Social Life Cycle Assessment (S-LCA) and ecosystem valuation frameworks, to address under-represented impacts.
- Global Adaptability and Transferability:
- Leverage international benchmarks and global datasets (e.g., International Aluminium Institute, UNEP Life Cycle Initiative) to standardise indicators and regional thresholds.
- Conduct comparative case studies in regions such as South America, Africa, and Europe to account for geographic variations in biodiversity priorities, resource availability, and energy grid dynamics.
- Extend the framework to other resource-intensive sectors (e.g., cement, steel) to demonstrate scalability and broader applicability.
- Policy and Regulatory Mechanisms:
- Advocate for the establishment of a mandatory, industry-specific sustainability framework, overseen by independent regulatory bodies, to ensure consistent, transparent reporting.
- Propose policy incentives, such as government subsidies or tax credits, to encourage the adoption of advanced decarbonisation technologies and biodiversity preservation initiatives.
- Foster partnerships with international organisations like the Aluminium Stewardship Initiative to drive global implementation and alignment with best practises.
Author Contributions
Funding
Institutional Review Board Statement
Informed Consent Statement
Data Availability Statement
Acknowledgments
Conflicts of Interest
References
- Georgitzikis, K.; Mancini, L.; d’Elia, E.; Vidal-Legaz, B. Sustainability aspects of Bauxite and Aluminium; Publications Office of the European Union: Luxembourg, 2021; p. 111. [Google Scholar]
- IAI. Aluminium Sector Greenhouse Gas Pathways to 2050; International Aluminium Institute: London, UK, 2021. [Google Scholar]
- MissionPossible. Making Net-Zero Aluminium Possible: A Transition Strategy for a 1.5 °C-Compliant Aluminum Sector; International Aluminium Institution: London, UK, 2022. [Google Scholar]
- Silveira, N.C.G.; Martins, M.L.F.; Bezerra, A.C.S.; Araújo, F.G.S. Red Mud from the Aluminium Industry: Production, Characteristics, and Alternative Applications in Construction Materials—A Review. Sustainability 2021, 13, 12741. [Google Scholar] [CrossRef]
- Saevardottir, G.; Kvande, H.; Welch, B.J. Aluminum Production in the Times of Climate Change: The Global Challenge to Reduce the Carbon Footprint and Prevent Carbon Leakage. JOM 2020, 72, 296–308. [Google Scholar] [CrossRef]
- Butler, C. Why Aluminium Smelters Are a Critical Component in Australian Decarbonisation. In A Case Study of Tomago Aluminium and the Hunter Region; Institute for Energy Economics and Financial Analysis: Heidelberg, Germany, 2020. [Google Scholar]
- IDI. Driving Human Rights Change in the Aluminum Industry: Inclusive Development International; IDI: Asheville, NC, USA, 2022; Available online: https://www.inclusivedevelopment.net/policy-advocacy/driving-human-rights-change-in-the-aluminum-industry/ (accessed on 5 November 2024).
- Javad, A.; Nima, E.; Benyamin, C.; Ali, M.; Reza, A.; Mohammad, G. Environmental impact assessment of aluminium production using the life cycle assessment tool and multi-criteria analysis. Ann. Environ. Sci. Toxicol. 2021, 5 (Suppl. S5), 59–66. [Google Scholar] [CrossRef]
- Donoghue, A.M.; Frisch, N.; Olney, D. Bauxite Mining and Alumina Refining. J. Occup. Environ. Med. 2014, 56, S12–S17. [Google Scholar] [CrossRef]
- Martin, L.; Howard, S. Alumina Refinery Wastewater Management: When Zero Discharge Just Isn’t Feasible…. In Essential Readings in Light Metals; Springer International Publishing: Cham, Switzerland, 2016; pp. 679–684. [Google Scholar] [CrossRef]
- IAI. Sustainable Bauxite Mining Guidelines, 2nd ed.; IAI: London, UK, 2022. [Google Scholar]
- Annandale, M.; Meadows, J.; Erskine, P. Indigenous forest livelihoods and bauxite mining: A case-study from northern Australia. J. Environ. Manag. 2021, 294, 113014. [Google Scholar] [CrossRef] [PubMed]
- Johnson, M.; Bayliss, C. Improving global sustainability in bauxite mining. Alum. Int. Today 2018, 31, 13–16. [Google Scholar]
- Jordan. China: FTM Machinery. 2023. [Cited 2023]. Available online: https://www.ftmmachinery.com/blog/global-use-of-bauxite-and-bauxite-reserves-left-to-human.html (accessed on 5 November 2024).
- DMIRS. Alumina. In Department of Mines IRaS; DMIRS: Perth, Australia, 2022. [Google Scholar]
- GA. Bauxite Australia: Australia Government Geoscience Australia. 2023. Available online: https://www.ga.gov.au/scientific-topics/minerals/mineral-resources-and-advice/australian-resource-reviews/bauxite#:~:text=Australian%20bauxite%20mines%20are%20known,reactive%20silica%20(RxSiO2) (accessed on 19 July 2024).
- Del Monaco, A.; Gwini, S.M.; Kelly, S.; de Klerk, N.; Benke, G.; Dennekamp, M.; Fritschi, L.; Dimitriadis, C.; William Bill Musk, A.; Abramson, M.J.; et al. Respiratory outcomes among refinery workers exposed to inspirable alumina dust: A longitudinal study in Western Australia. Am. J. Ind. Med. 2020, 63, 1116–1123. [Google Scholar] [CrossRef] [PubMed]
- Ujaczki, É.; Feigl, V.; Molnár, M.; Cusack, P.; Curtin, T.; Courtney, R.; O’Donoghue, L.; Davris, P.; Hugi, C.; Evangelou, M.W.; et al. Re-using bauxite residues: Benefits beyond (critical raw) material recovery. J. Chem. Technol. Biotechnol. 2018, 93, 2498–2510. [Google Scholar] [CrossRef] [PubMed]
- IAI. Alumina Production London: International Aluminium Institute; IAI: London, UK, 2023; Available online: https://international-aluminium.org/statistics/alumina-production/ (accessed on 20 July 2024).
- ICMM. A New ESG Mining Standard Will Help Drive Responsible Production 2020. Available online: https://www.icmm.com/en-gb/stories/2020/a-new-esg-mining-standard (accessed on 5 November 2024).
- Moffat, K.; Pert, P.; McCrea, R.; Boughen, N.; Rodriguez, S.; Lacey, J. Australian Attitudes Toward Mining: Citizen Survey—2017 Results; CSIRO: Pullenvale, Australia, 2018.
- Shrivastava, P.; Vidhi, R. Pathway to Sustainability in the Mining Industry: A Case Study of Alcoa and Rio Tinto. Resources 2020, 9, 70. [Google Scholar] [CrossRef]
- Alcoa. 2021 Sustainability Report; Alcoa: Pittsburg, PA, USA, 2021. [Google Scholar]
- South32. Sustainable Development Report 2021; South32: Perth, Australia, 2021. [Google Scholar]
- Hydro. Annual Report 2021; Norsk Hydro: Oslo, Norway, 2021. [Google Scholar]
- Rusal. Human Focus—Sustainability Report; Rusal: Moscow, Russia, 2021. [Google Scholar]
- Biswas, W.K.; John, M. Engineering for Sustainable Development: Theory and Practice; John Wiley & Sons, Incorporated: Newark, UK, 2022. [Google Scholar]
- Joyce, P.J.; Björklund, A. Using Life Cycle Thinking to Assess the Sustainability Benefits of Complex Valorization Pathways for Bauxite Residue. J. Sustain. Metall. 2019, 5, 69–84. [Google Scholar] [CrossRef]
- Biswas, W.K.; Cooling, D. Sustainability assessment of red sand as a substitute for Virgin sand and crushed limestone. J. Ind. Ecol. 2013, 17, 756–762. [Google Scholar] [CrossRef]
- Luthin, A.; Backes, J.G.; Traverso, M. A framework to identify environmental-economic trade-offs by combining life cycle assessment and life cycle costing—A case study of aluminium production. J. Clean. Prod. 2021, 321, 128902. [Google Scholar] [CrossRef]
- Luther, D.; Ali, R. Scenario Planning: Strategy, Steps and Practical Examples. Available online: https://www.netsuite.com/portal/resource/articles/financial-management/scenario-planning.shtml (accessed on 6 June 2024).
- Janjua, S.; Sarker, P.; Biswas, W. Sustainability Assessment of a Residential Building using a Life Cycle Assessment Approach. Chem. Eng. Trans. 2019, 72, 19–24. [Google Scholar] [CrossRef]
- Lim, C.I.; Biswas, W.K. Development of triple bottom line indicators for sustainability assessment framework of Malaysian palm oil industry. Clean Technol. Environ. Policy 2018, 20, 539–560. [Google Scholar] [CrossRef]
- Janjua, S.Y.; Sarker, P.K.; Biswas, W.K. Development of triple bottom line indicators for life cycle sustainability assessment of residential bulidings. J. Environ. Manag. 2020, 264, 110476. [Google Scholar] [CrossRef] [PubMed]
- Alcoa. Fact Sheet Kwinana Alumina Refiner; Alcoa: Perth, Australia, 2022. [Google Scholar]
- RioTinto. Queensland Alumina Limited Sustainable Development 2020 Scorecard; Rio Tinto: Melbourne, Australia, 2020. [Google Scholar]
- Deloitte; ARENA. A Roadmap for Decarbonising Australian Alumina Refining; Deloitte: Sydney, Australia, 2022. [Google Scholar]
- AAC. Australian Alumina Australia: Australian Aluminium Council; AAC: Australian Capital Territory, Australia, 2023; Available online: https://aluminium.org.au/australian-industry/australian-alumina/ (accessed on 7 June 2024).
- Niero, M.; Olsen, S.I.; Laurent, A. Renewable Energy and Carbon Management in the Cradle-to-Cradle Certification: Limitations and Opportunities. J. Ind. Ecol. 2018, 22, 760–772. [Google Scholar] [CrossRef]
- Aziz, S.; Faturohman, T. Cost and Environmental Impact Analysis of Waste Oil Utilization in Coal Mining Industry: A Case Study of PT Berau Coal. Rev. Integr. Bus. Econ. Res. 2021, 10, 254–282. [Google Scholar]
- Soo, V.K.; Peeters, J.R.; Compston, P.; Doolan, M.; Duflou, J.R. Economic and Environmental Evaluation of Aluminium Recycling based on a Belgian Case Study. Procedia Manuf. 2019, 33, 639–646. [Google Scholar] [CrossRef]
- Nunez, P.; Jones, S. Cradle to gate: Life cycle impact of primary aluminium production. Int. J. Life Cycle Assess. 2016, 21, 1594–1604. [Google Scholar] [CrossRef]
- Farjana, S.H.; Huda, N.; Mahmud, M.A.P. Impacts of aluminum production: A cradle to gate investigation using life-cycle assessment. Sci. Total Environ. 2019, 663, 958–970. [Google Scholar] [CrossRef]
- Ma, Y.; Preveniou, A.; Kladis, A.; Pettersen, J.B. Circular economy and life cycle assessment of alumina production: Simulation-based comparison of Pedersen and Bayer processes. J. Clean. Prod. 2022, 366, 132807. [Google Scholar] [CrossRef]
- Tang, Y.; Shi, Y.; Li, Y.; Yuan, X.; Mu, R.; Wang, Q.; Ma, Q.; Hong, J.; Cao, S.; Zuo, J.; et al. Environmental and economic impact assessment of the alumina–carbon refractory production in China. Clean Technol. Environ. Policy 2019, 21, 1723–1737. [Google Scholar] [CrossRef]
- Zhu, X.; Jin, Q.; Ye, Z. Life cycle environmental and economic assessment of alumina recovery from secondary aluminum dross in China. J. Clean. Prod. 2020, 277, 123291. [Google Scholar] [CrossRef]
- Ibarretxe, J.; Alonso, L.; Aranburu, N.; Guerrica-Echevarría, G.; Orbea, A.; Iturrondobeitia, M. Sustainable PHBH–Alumina Nanowire Nanocomposites: Properties and Life Cycle Assessment. Polymers 2022, 14, 5033. [Google Scholar] [CrossRef]
- Zhu, S.; Gao, C.; Song, K.; Chen, M.; Wu, F.; Li, X. An assessment of environmental impacts and economic benefits of multiple aluminum production methods. J. Clean. Prod. 2022, 370, 133523. [Google Scholar] [CrossRef]
- Gediga, J.; Morfino, A.; Finkbeiner, M.; Schulz, M.; Harlow, K. Life cycle assessment of zircon sand. Int. J. Life Cycle Assess. 2019, 24, 1976–1984. [Google Scholar] [CrossRef]
- Ecetoc. Freshwater Ecotoxicity as an Environmental Impact Category to Guide the Selection of Chemical-Based Products. Available online: https://www.ecetoc.org/task-force/freshwater-ecotoxicity-as-an-environmental-impact-category-to-guide-the-selection-of-chemical-based-products/#:~:text=%27Freshwater%20Ecotoxicity%27%20is%20an%20environmental,the%20%27Freshwater%20Ecotoxicity%27%20impact (accessed on 19 May 2024).
- Gandhi, N.; Diamond, M. Freshwater ecotoxicity characterization factors for aluminum. Int. J. Life Cycle Assess. 2018, 23, 2137–2149. [Google Scholar] [CrossRef]
- Mbedzi, M.D.; van der Poll, H.M.; van der Poll, J.A. An Information Framework for Facilitating Cost Saving of Environmental Impacts in the Coal Mining Industry in South Africa. Sustainability 2018, 10, 1690. [Google Scholar] [CrossRef]
- Otte, N.; Claessens, M.; Cooper, C.; Hoke, R.; King, H.; L’Haridon, J.; Palais, F.; Schmidt, F.; Schowanek, D.; Wolf, T.; et al. TR127: Freshwater Ecotoxicity as an Impact Category in Life Cycle Assessment; European Centre for Ecotoxicology and Toxicology of Chemicals: Brussels, Belgium, 2016. [Google Scholar]
- Mancini, L.; Sala, S. Social impact assessment in the mining sector: Review and comparison of indicators frameworks. Resour. Policy 2018, 57, 98. [Google Scholar] [CrossRef]
- Korevaar, G. Social Life Cycle Assessment of Brine Treatment in the Process Industry: A Consequential Approach Case Study. Sustainability 2019, 11, 5945. [Google Scholar] [CrossRef]
- Cadena, E.; Rocca, F.; Gutierrez, J.A.; Carvalho, A. Social life cycle assessment methodology for evaluating production process design: Biorefinery case study. J. Clean. Prod. 2019, 238, 117718. [Google Scholar] [CrossRef]
- Gompf, K.; Traverso, M.; Hetterich, J. Towards social life cycle assessment of mobility services: Systematic literature review and the way forward. Int. J. Life Cycle Assess. 2020, 25, 1883–1909. [Google Scholar] [CrossRef]
- Nazaran, I.; Ghani, A.; Muhammad, Z.; Saputra, J.; Bon, A.; Ghani, L.A. Social Impact of Small Seawater Desalination Plant of Local Community: A Social Life Cycle Assessment. In Proceedings of the International Conference on Industrial Engineering and Operations Management, Monterrey, Mexico, 3–5 November 2021. [Google Scholar]
- Huertas-Valdivia, I.; Ferrari, A.M.; Settembre-Blundo, D.; García-Muiña, F.E. Social Life-Cycle Assessment: A Review by Bibliometric Analysis. Sustainability 2020, 12, 6211. [Google Scholar] [CrossRef]
- Siebert, A.; Bezama, A.; O’Keeffe, S.; Thrän, D. Social life cycle assessment indices and indicators to monitor the social implications of wood-based products. J. Clean. Prod. 2018, 172, 4074–4084. [Google Scholar] [CrossRef]
- Weymouth, R.; Hartz-Karp, J. Participation in planning and governance: Closing the gap between satisfaction and expectation. Sustain. Earth 2019, 2, 5. [Google Scholar] [CrossRef]
- Niranjan, P.; Gitanjali, P.; Kumar, M.S. Job Involvement and Job Satisfaction of Mining Workers in Keonjhar and Jajpur district of Odisha. Adv. Manag. 2022, 15, 22–29. [Google Scholar]
- Sharaai, A.H.; Masri, M.F.; Kalvani, S.R. The Social Impact Study through the Life Cycle of Rice Production at Selangor, Malaysia. Chem. Eng. Trans. 2022, 97, 517–522. [Google Scholar] [CrossRef]
- Serreli, M.; Petti, L.; Raggi, A.; Simboli, A.; Iuliano, G. Social life cycle assessment of an innovative industrial wastewater treatment plant. Int. J. Life Cycle Assess. 2021, 26, 1878–1899. [Google Scholar] [CrossRef]
- APA. Scenario Planning: American Planning Association; APA: Chicago, IL, USA, 2024; Available online: https://www.planning.org/knowledgebase/scenarioplanning/ (accessed on 6 June 2024).
- Mariton, J. SME, Editor: Strategy Management Consulting. 2016. [Cited 2024]. Available online: https://www.smestrategy.net/blog/what-is-scenario-planning-and-how-to-use-it#What-is (accessed on 5 November 2024).
- Alcoa. 2022 Sustainability Report Moving Forward Sustainably; Alcoa: Pittsburg, PA, USA, 2023. [Google Scholar]
- Activated Alumina Market Strong Industry Growth, Business Strategies, Demand, Emerging Trends and Forecast 2030 [Press Release]; Skyquest Technology Consulting Pvt. Ltd.: Ahmedabad, India, 2023.
- SI. Global Alumina Market: Spherical Insights; Spherical Insights LLP.: Mason, OH, USA, 2022; Available online: https://www.sphericalinsights.com/reports/alumina-market (accessed on 1 September 2024).
- ARENA. World First Hydrogen Pilot for Low Carbon Alumina Australia: Australian Renewable Energy Agency; ARENA: Sydney, Australia, 2023. Available online: https://arena.gov.au/news/world-first-hydrogen-pilot-for-low-carbon-alumina/#:~:text=Australia%20is%20the%20world’s%20largest,billion%20to%20the%20nation’s%20GDP (accessed on 15 August 2023).
- AAC. Sustainability: Australian Aluminium Council; Australian Aluminium Council: Australian Capital Territory, Australia, 2023; Available online: https://aluminium.org.au/sustainability-main/sustainability/ (accessed on 21 August 2023).
- L. J. Miner Rio Tinto’s Carbon Problem and Offset Solution: Carbon Credits. 2023. Available online: https://carboncredits.com/rio-tinto-carbon-problem-and-carbon-offset-credit-solution/ (accessed on 17 August 2023).
- Kehoe, J. Labor Caps Carbon Price at $75 for Big Polluters 2023. Available online: https://www.afr.com/policy/energy-and-climate/emission-targets-for-big-polluters-released-20230110-p5cbh6 (accessed on 5 November 2024).
- RioTinto. Sustainability Glossary 2021; RioTinto: London, UK, 2021. [Google Scholar]
- AluminaLimited. ASX Full-Year Preliminary Final Report; Alumina Limited: Sydney, Australia, 2022. [Google Scholar]
- Chatfield, R. MVR Retrofit and Commercialisation Report; Alcoa: Perth, Australia, 2022. [Google Scholar]
- AluminaLimited. ASX Half-Year Report; Alumina Limited: Sydney, Australia, 2022. [Google Scholar]
- Ker, P. Alumina says unit costs have peaked as commodity price slides. Aust. Financ. Rev. 2022. Available online: https://www.afr.com/companies/mining/alumina-says-unit-costs-have-peaked-as-commodity-price-slides-20220823-p5bc47 (accessed on 12 August 2024).
- PrecendenceResearch. Alumina Market (By Product: Metallurgical Grade, Refractory Grade, Grinding Grade, Others; By Grade: Chemical, Smelter, Calcined, Tabular, Reactive, Fused, Aluminum Trihydrate; By Application: Aluminum Production, Non-Aluminum Production, Abrasives, Ceramics, Refractories, Filtration, Others)—Global Industry Analysis, Size, Share, Growth, Trends, Regional Outlook, and Forecast 2023–2032: Precendence Research. 2022; Available online: https://www.precedenceresearch.com/alumina-market (accessed on 5 November 2024).
- DCCEEW. Australia’s Emissions Projections 2023; Department of Climate Change, Energy, the Environment and Water: Canberra, Australia, 2023. [Google Scholar]
- South32. Sustainable Development Report 2022; South32: Perth, Australia, 2022. [Google Scholar]
- DCCEEW. Australian National Greenhouse Accounts Factors; Department of Climate Change, Energy, the Environment and Water: Canberra, ACT, Australia, 2023. [Google Scholar]
- Peppas, A.; Politi, C.; Kottaridis, S.; Taxiarchou, M. LCA Analysis Decarbonisation Potential of Aluminium Primary Production by Applying Hydrogen and CCUS Technologies. Hydrogen 2023, 4, 338–356. [Google Scholar] [CrossRef]
- DCCEEW. Australia’s Emissions Projections 2022; Department of Climate Change E, the Environment and Water, Ed.; Commonwealth of Australia: Canberra, Australia, 2022. [Google Scholar]
- Government, A. Australia’s Long-Term Emissions Reduction Plan; Industry S, Energy and Resources: Canberra, Australia, 2021. [Google Scholar]
- IAI. Bauxite Residue: An Introduction Factsheet 2022. Available online: https://international-aluminium.org/resource/bauxite-residue-an-introduction-factsheet/ (accessed on 5 November 2024).
- Alcoa. Bauxite Residue Management 2023. Available online: https://www.alcoa.com/australia/en/sustainability/bauxite-residue-management (accessed on 5 November 2024).
- IAI. Bauxite Residue Management: International Aluminium Institute; 2018. Available online: https://bauxite.world-aluminium.org/refining/bauxite-residue-management/#:~:text=Utilisation%20of%20Bauxite%20Residue&text=It%20is%20estimated%20that%20some,soil%20amelioration%20and%20landfill%20covering (accessed on 5 November 2024).
- AluminaLimited. Alumina Limited Sustainability Data Pack 2022; AluminaLimited: Sydney, Australia, 2022. [Google Scholar]
- South32. What we do 2023. Available online: https://www.south32.net/what-we-do/our-locations/australia/worsley-alumina#top (accessed on 5 November 2024).
- Alcoa. Fact Sheet Pinjarra Alumina Refinery; Alcoa: Perth, Australia, 2022. [Google Scholar]
- Alcoa. Fact Sheet Wagerup Alumina Refinery; Alcoa: Perth, Australia, 2022. [Google Scholar]
- Goedkoop, M.; Indrane, D.; de Beer, I. Handbook for Product Social Impact Assessment 2018. 2018. Available online: https://www.researchgate.net/profile/Mark-Goedkoop/publication/329059516_Handbook_for_Product_Social_Impact_Assessment_2018/links/5bf3c95f299bf1124fdfa318/Handbook-for-Product-Social-Impact-Assessment-2018.pdf (accessed on 5 November 2024).
- Workplace Accidents [Internet]. International Aluminium Institute. 2023 [Cited 10 August 2023]. Available online: https://international-aluminium.org/statistics/workplace-accidents/ (accessed on 5 November 2024).
- QAL. Sustainability Development Report Scorecard; Queensland Alumina Limited: Gladstone, Australia, 2018. [Google Scholar]
- DMIRS. Safety Performance in the Western Australian Mineral Industry; Department of Mines, Industry Regulation and Safety: Perth, Australia, 2022.
- Segal, M. Australia Proposes New Law Requiring Mandatory Climate Reporting for Companies. ESGtoday. 2024. Available online: https://www.esgtoday.com/australia-proposes-new-law-requiring-mandatory-climate-reporting-for-companies/ (accessed on 16 August 2024).
- Cachia, C.; Lautier, L.; Levine, A.; Hain, M.; Bulling, J.; Ma, C.; Bodlovich, N.; Mangos, R.; Brandt, R. February 2024 ESG Policy Update—Australia. 2024. Available online: https://www.klgates.com/February-2024-ESG-Policy-UpdateAustralia-2-27-2024 (accessed on 5 November 2024).
- Burkinshaw, A. ESG Regulation in 2024: Everything You Need to Know 2024. Available online: https://sustainability-news.net/policy-and-regulation/2024-guide-to-esg-regulation/#:~:text=The%20new%20rules%20will%20ensure,on%20people%20and%20the%20environment (accessed on 5 November 2024).
- Boiral, O. Accounting for the Unaccountable: Biodiversity Reporting and Impression Management. J. Bus. Ethics 2014, 135, 751–768. [Google Scholar] [CrossRef]
- Gray, R. Is accounting for sustainability actually accounting for sustainability...and how would we know? An exploration of narratives of organisations and the planet. Account. Organ. Soc. 2010, 35, 47–62. [Google Scholar] [CrossRef]
- Hahn, R.; Kühnen, M. Determinants of sustainability reporting: A review of results, trends, theory, and opportunities in an expanding field of research. J. Clean. Prod. 2013, 59, 5–21. [Google Scholar] [CrossRef]
- ClimateWorks; Climate-KIC. Pathways to Industrial Decarbonisation: Positioning Australian Industry to Prosper in a Net Zero Global Economy; Australian Industry Energy Transitions Initiative: Ultimo, Australia, 2023. [Google Scholar]
- Alcoa. Alcoa Announces Curtailment of Kwinana Alumina Refinery in Western Australia; Alcoa: Pittsburg, PA, USA, 2024. [Google Scholar]
- State-Owned Coal Power Stations to be Retired by 2030 with Move Towards Renewable Energy; Government of Western Australia: Perth, Australia, 2023.
- Landmark Legislation Protects Queensland Energy Workers and Public Ownership. 2023. Available online: https://statements.qld.gov.au/statements/98991 (accessed on 5 November 2024).
- CER. About the National Greenhouse and Energy Reporting Scheme 2022. Available online: https://www.cleanenergyregulator.gov.au/NGER/About-the-National-Greenhouse-and-Energy-Reporting-scheme (accessed on 5 November 2024).
- CER. The Safeguard Mechanism 2022. Available online: https://www.cleanenergyregulator.gov.au/NGER/The-safeguard-mechanism (accessed on 5 November 2024).
- GHGProtocol. About Us 2024. Available online: https://ghgprotocol.org/about-us (accessed on 5 November 2024).
- CBD. Global Biodiversity Outlook 5. Montreal: Convention on Biological Diversity; CBD: Montreal, QC, Canada, 2020. [Google Scholar]
- DAWE. The Australian Government’s Threatened Species Strategy 2021–2031; Australian Government, Department of Agriculture WatE: Canberra, Australia, 2021.
- Coates, D. Strategic Plan for Biodiversity (2011–2020) and the Aichi Biodiversity Targets. In The Wetland Book: I: Structure and Function, Management, and Methods; Finlayson, C.M., Everard, M., Irvine, K., McInnes, R.J., Middleton, B.A., van Dam, A.A., Davidson, N.C., Eds.; Springer: Dordrecht, The Netherlands, 2018; pp. 493–499. [Google Scholar] [CrossRef]
- NRMMC. Australia’s Biodiversity Conservation Strategy 2010–2030; National Resource Management Ministerial Council: Canberra, Australia, 2010.


| Sustainability Dimension | Impact Categories | KPIs | Unit | References | ||
|---|---|---|---|---|---|---|
| Economic | EC-1 | National Economic Benefits | EC-1.1 | Contribution to Local Economy | $AU/t | [35,36] |
| EC-1.2 | Export Revenue | $AU/t | [37,38] | |||
| EC-2 | Company Economic Benefits | EC-2.1 | Annual Carbon Reduction | t CO2-e/t | [29,39,40] | |
| EC-2.2 | Operating Profit | $AU/t | [40,41] | |||
| Environmental | E-1 | Atmosphere | E-1.1 | Acidification Potential (AP) | kg SO2-e/t | [30,42,43,44,45,46,47,48,49] |
| E-1.2 | Global Warming Potential (GWP) | kg CO2-e/t | [30,32,42,43,44,47,48,49] | |||
| E-1.3 | Ozone Depletion (OD) | kg CFC/t | [42,43,44,45,46,47,49] | |||
| E-2 | Energy | E-2.1 | Energy Intensity | GJ/t | [42,43,44,48,49] | |
| E-2.2 | Renewable Energy Share | % | [39] | |||
| E-3 | Water | E-3.1 | Freshwater Contamination | kg CTU-e/t | [43,45,46,47,50,51,52,53] | |
| E-3.2 | Water Consumption | m3 H2O/t | [42,43,44,45,47] | |||
| E-4 | Land Use and Biodiversity | E-4.1 | Bauxite Residue Land Utilisation | ha/t | [44] | |
| E-4.2 | Bauxite Residue Re-Utilisation | t (BR)/t | [18,28,44,46] | |||
| E-4.3 | Natural Land Rehabilitation | ha/t | [30,45,47,52] | |||
| Social | S-1 | Intra-Generational Equity | S-1.1 | Investment in Local Community | $AU/t | [54,55,56] |
| S-1.2 | Community Engagement | PSIA Scale | [57,58,59,60,61] | |||
| S-1.3 | Employment Generation | FTE/t | [29,54,56,57,60,62,63] | |||
| S-1.4 | Work Safety | Accident Rate per MWH | [54,55,57,60,63,64] | |||
| Sustainability Objective | Impact Categories | KPIs | Unit | ||
|---|---|---|---|---|---|
| Economic | EC-1 | National Economic Benefits | EC-1.1 | Contribution to Local Economy | $AU/t |
| EC-1.2 | Export Revenue | $AU/t | |||
| EC-2 | Company Economic Benefits | EC-2.1 | Annual Carbon Reduction | $AU/t | |
| EC-2.2 | Operating Profit | $AU/t | |||
| Environmental | E-1 | Atmosphere | E-1.1 | Carbon Intensity | kg CO2-e/t |
| E-1.2 | Global Warming Potential (GWP) | kg CO2-e/t | |||
| E-2 | Energy | E-2.1 | Energy Intensity | GJ/t | |
| E-2.2 | Renewable Energy Share | MWh/t | |||
| E-3 | Water | E-3.1 | Freshwater Contamination | kg CTU-e/t | |
| E-3.2 | Water Consumption | m3 H2O/t | |||
| E-4 | Land Use and Biodiversity | E-4.1 | Bauxite Residue Land Utilisation | ha/t | |
| E-4.2 | Bauxite Residue Re-Utilisation | t (BR)/t | |||
| E-4.3 | Natural Land Rehabilitation | ha/t | |||
| E-4.4 | Clearing of Biodiversity and Native Vegetation | ha/t | |||
| Social | S-1 | Intra-Generational Equity | S-1.1 | Community Spending | $AU/t |
| S-1.2 | Community Engagement | PSIA Scale | |||
| S-1.3 | Employment | FTE/t | |||
| S-1.4 | Health and Safety | Accident Rate per MWH/t | |||
| KPI | Threshold Value | Reference | ||
|---|---|---|---|---|
| Minimum | Maximum | |||
| EC-1.1 | Investment in Local Economy | $AU265.51 | $AU521.71 | [36,67,68,69] |
| EC-1.2 | Export Revenue | $AU522.81 | $AU553.13 | [68,69,70,71] |
| EC-2.1 | Annual Carbon Reduction | 0.0 kg CO2-e/t | 26.92 kg CO2-e/t | [37,72,73,74] |
| EC-2.2 | Operating Profit | $AU62.33 | $AU143.55 | [75,76,77,78,79] |
| E-1.1 | Carbon Intensity | 760 kg CO2-e | 15.2 kg CO2-e | [37,71,80,81,82] |
| E-1.2 | Global Warming Potential (GWP) | 700 kg CO2-e | 0.0 kg CO2-e | [67,71,81,83,84] |
| E-2.1 | Energy Intensity | 10.5 GJ | 4.6 GJ | [37,71] |
| E-2.2 | Renewable Energy Share | 0% | 100% | [85] |
| E-3.1 | Freshwater Contamination | 0.233 kg CTU-e | 0.155 kg CTU-e | [46,83] |
| E-3.2 | Water Consumption | 5.16 m3 | 3.20 m3 | [67,71,83] |
| E-4.1 | Bauxite Residue Land Utilisation | 4.49 × 10⁶ ha | 3.82 × 10⁶ ha | [67,86,87] |
| E-4.2 | Bauxite Residue Re-Utilisation | 0.0357 t (BR) | 1.61 t (BR) | [86,88] |
| E-4.3 | Natural Land Rehabilitation | 5.02 × 10⁵ ha | 1.439 × 10⁴ ha | [67,71] |
| E-4.4 | Clearing of Biodiversity and Native Vegetation | 3.86 × 10⁵ | 1.93 × 10⁵ | [71,89] |
| S-1.1 | Investment in Local Community | $AU0.06 | $AU0.63 | [35,36,67,90,91,92] |
| S-1.2 | Community Engagement | 0 | +2 | [93] |
| S-1.3 | Employment Generation | 4.81 × 10⁴ FTE/t | 1.255 × 10³ FTE/t | [35,36,67,71,91,92] |
| S-1.4 | Work Safety | 4.8 TRAR | 0.012 TRAR | [36,94,95,96] |
| Scenario | Western Australia | Queensland |
|---|---|---|
| BAU | 20% | 21% |
| Net-Zero | 91% | 97% |
| Accelerated Net-Zero | 96% | 97% |
Disclaimer/Publisher’s Note: The statements, opinions and data contained in all publications are solely those of the individual author(s) and contributor(s) and not of MDPI and/or the editor(s). MDPI and/or the editor(s) disclaim responsibility for any injury to people or property resulting from any ideas, methods, instructions or products referred to in the content. |
© 2025 by the authors. Licensee MDPI, Basel, Switzerland. This article is an open access article distributed under the terms and conditions of the Creative Commons Attribution (CC BY) license (https://creativecommons.org/licenses/by/4.0/).
Share and Cite
Byrne, M.J.; John, M.; Biswas, W. Future Risk from Current Sustainability Assessment Frameworks for the Resource Sector. Sustainability 2025, 17, 960. https://doi.org/10.3390/su17030960
Byrne MJ, John M, Biswas W. Future Risk from Current Sustainability Assessment Frameworks for the Resource Sector. Sustainability. 2025; 17(3):960. https://doi.org/10.3390/su17030960
Chicago/Turabian StyleByrne, Marcus Jerome, Michele John, and Wahidul Biswas. 2025. "Future Risk from Current Sustainability Assessment Frameworks for the Resource Sector" Sustainability 17, no. 3: 960. https://doi.org/10.3390/su17030960
APA StyleByrne, M. J., John, M., & Biswas, W. (2025). Future Risk from Current Sustainability Assessment Frameworks for the Resource Sector. Sustainability, 17(3), 960. https://doi.org/10.3390/su17030960